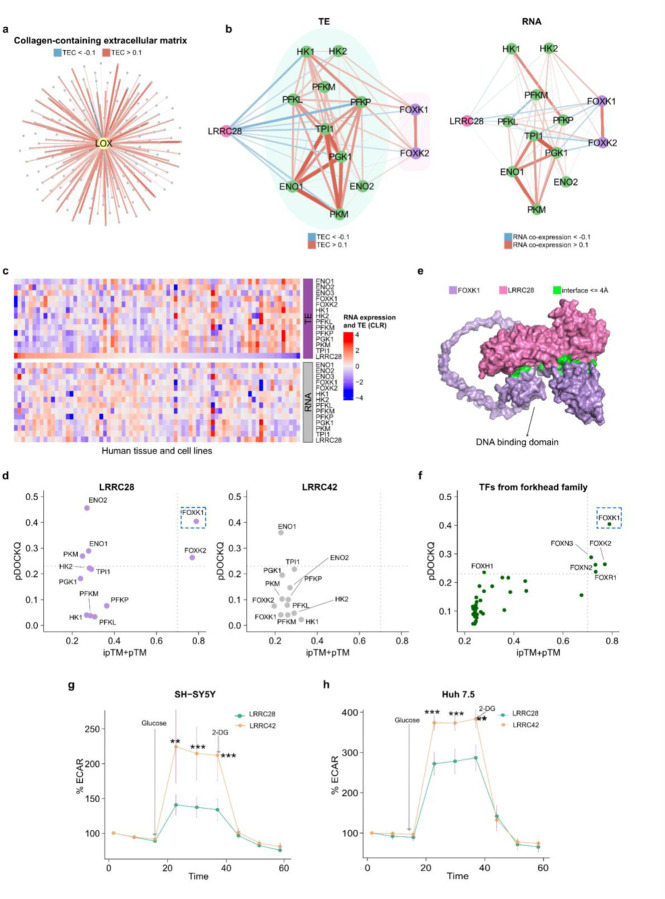
Fig. 5 |. TEC enables the prediction of novel gene functions.
a, We predicted that LOX belongs to the collagen-containing extracellular matrix using an older version of human GO terms (January 1, 2021) and confirmed this prediction with the newer version (December 4, 2022; Methods). The network displays the similarity in TE between LOX (yellow dot) and other genes (gray dots) from the collagen-containing extracellular matrix. Line weight in figure panels indicates the absolute value of rho from 0.1 to 1. b, The networks display the rho between LRRC28 and glycolytic genes at the TE level (on the left) and RNA level (on the right) in humans. Green dots represent genes that belong to the glycolysis pathway, purple nodes are transcription factors that regulate glycolysis. c, TE and RNA expression of LRRC28, glycolytic genes, and transcription factors regulating glycolysis (FOXK1, FOXK2) across human cell types and tissues. d, We used AlphaFold2-Multimer to calculate the binding probabilities between the proteins LRRC28 or LRRC42 and glycolytic proteins (Methods). We evaluated the models with ipTM+pTM (x-axis) and precision of protein-protein interface binding predictions (pDOCKQ; y-axis). We set a threshold of ipTM+pTM > 0.796 and pDOCKQ > 0.2397,98 as previously suggested to identify confident binding. e, 3D model of binding between LRRC28 and FOXK1. For visualization purposes, we removed residues 1–101 and 370–733 in FOXK1 (pLDDT scores below 50). f, Binding probabilities between LRRC28 and transcription factors belonging to the forkhead family99. The dashed lines represent ipTM+pTM > 0.7 or pDOCKQ > 0.23. Kinetic ECAR response of g, SHSY-5Y cell line (n=6, stable overexpression) and h, Huh 7.5 cell line (n=6; transient overexpression) overexpressing LRRC28 or LRCC42 to 10 mM glucose and 100 mM 2-DG. Unpaired two-sided Student’s t-test, ***P < 0.005, **P < 0.05. Panel g & h shows mean ± s.d.; n shows biological independent experiments.

