

SUMMARY
Precision of transcription is critical because transcriptional dysregulation is disease causing. Traditional methods of transcriptional profiling are inadequate to elucidate the full spectrum of the transcriptome, particularly for longer and less abundant mRNAs. SHANK3 is one of the most common autism causative genes. Twenty-four Shank3-mutant animal lines have been developed for autism modeling. However, their preclinical validity has been questioned due to incomplete Shank3 transcript structure. We apply an integrative approach combining cDNA-capture and long-read sequencing to profile the SHANK3 transcriptome in humans and mice. We unexpectedly discover an extremely complex SHANK3 transcriptome. Specific SHANK3 transcripts are altered in Shank3-mutant mice and postmortem brain tissues from individuals with autism spectrum disorder. The enhanced SHANK3 transcriptome significantly improves the detection rate for potential deleterious variants from genomics studies of neuropsychiatric disorders. Our findings suggest that both deterministic and stochastic transcription of the genome is associated with SHANK family genes.
In brief
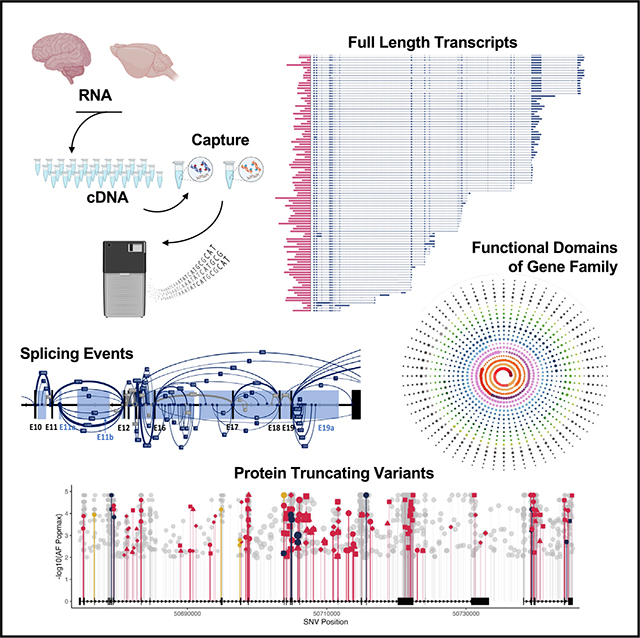
Lu et al. revealed the sophisticated transcriptional landscape of SHANK family genes with an integrative approach combining targeted capture and long-read sequencing. The findings elucidated a full spectrum of transcriptome, illustrated the deterministic and potentially stochastic nature of transcription, and sharpened the profiling of autism-related genetic variations.
Graphical Abstract
INTRODUCTION
In the central dogma of molecular biology, RNA transcription acts as a rheostat, orchestrating the cellular functions of the genes in response to intrinsic and extrinsic signals. The complex functions in the organs, such as the brain, require a diverse proteome from a relatively small gene pool. This diversity is facilitated by transcriptional regulation involving alternative promoter usage and splicing occurring in >90% of neuronal genes in mammalian brains.1–4 Disruption of transcript-specific regulatory elements due to DNA mutations can lead to diseases. Transcriptome-wide changes are implicated in neuropsychiatric conditions, including autism spectrum disorder (ASD).5–9 Accurate annotation and interpretation of these changes relies on a comprehensive transcriptomic profile, either for a given gene or on a genome-wide scale. However, popular short-read sequencing is suboptimal for delineating longer transcripts and discovering novel exons and splicing events.10 Standard long-read sequencing techniques are not sufficiently sensitive to detect transcripts with lower abundance. A theoretical solution lies in the combination of mRNA/cDNA-capture methods11 and long-read sequencing, which could identify both long and low-abundance transcripts. However, this approach has been sparingly reported, probably due to the technical challenge of preserving the mRNA integrity. The current inability to construct a complete transcriptome fuels a continuing debate over the extent of pervasive transcription across the genome and the significance of endogenous transcriptional “dark matter.”12–16 The incomplete transcriptome impedes accurate annotation of disease-linked variants and interpretation of transcriptomic data. This shortfall affects the validation of genetically modified disease models used in preclinical research to develop molecular therapies. Previous studies have indicated specific functions of SHANK3 mRNA transcripts at synapses.17–30 An incomplete human SHANK3 transcriptome could underestimate the contribution of the genetic risk for ASD and other neuropsychiatric disorders. Similarly, the incomplete mouse transcriptome complicates the interpretation of its relevance to human SHANK3 disorders from studies of more than 24 lines of genetically modified animal models.19,31,32 To bridge these substantial gaps in knowledge, we performed standard Iso-Seq (SIS) for whole-transcriptome analysis and paired it with targeted cDNA capture and long-read sequencing techniques (capture-Iso-Seq, CIS) to specifically investigate the SHANK family genes in human and mouse brain. We discovered a drastically intricate SHANK3 transcript structure and a broad transcriptomic diversity across the human and mouse genomes. We identified unexpected extensive fusion transcripts and atypical patterns of transcripts in Shank3-mutant mice. The enhanced SHANK3 transcriptome has significantly improved the discovery rate of deleterious variants in genomic and transcriptomic studies of neuropsychiatric disorders. Our study advocates for a paradigm shift in experimental design and evaluation of genetic disease models using genetically modified animals, emphasizing the need to carefully evaluate the molecular validity of these mutant animal models in preclinical research.
RESULTS
Dataset overview and experimental strategy evolution and optimization
We sequenced 56 single-molecule real-time (SMRT) libraries of human and mouse brains using the PacBio Sequel II System (Figures 1A and 1B). Sixteen libraries proceeded using the SIS method. Forty libraries were constructed following the CIS method, which employed targeted capture enrichment with specific oligonucleotide probe panels that covered the full genomic regions of SHANK/Shank family genes (SHANK1–3, Tables S1 and S2). A non-neuronal gene, TP53, was included as a comparison. Twenty libraries were synthesized from cerebral cortex of neurotypical children ages 5–6 years and young adults ages 24–30 years. For mice, 35 libraries were derived from striatum (ST) and prefrontal cortices (PFCs) of 21-day-old wild-type (WT) C57BL/6J and Shank3 mutants (Shank3Δe4−9, Shank3Δe21, and Shank3Δe4−22).20,21,33–35 We processed only the RNA with an integrity number (RIN) above 7 for human and above 8 for mouse samples for subsequent sequencing. The quality and reproducibility of the SIS and CIS platforms were optimized (Figures S1A–S1I). For experimental validation, RT-PCR and Sanger sequencing was used to confirm novel SHANK3 transcripts from CIS. We performed in silico transcriptome analyses using short-read bulk RNA sequencing (srRNA-seq) and single-cell RNA-seq (scRNA-seq) data and gene discovery analyses of exome sequencing (ES) and whole-genome sequencing (WGS) data from the PsychENCODE project along with other genomics studies.5,36–40
Figure 1. Genome-wide transcript diversity and abundance in brains detected by SIS.

(A) Experimental design of SIS and CIS of human and mouse tissues.
(B) Schematic of experimental procedure for RNA capture and long-read sequencing.
(C) Number of unique transcripts (transcript diversity) for individual genes (blue) and the number of sequence reads (abundance) (red) for an individual transcript detected in human cerebral cortex by SIS with projected chromosome coordinates and idiograms.
(D) Transcript diversity was significantly correlated with the sequence reads (abundance) of the transcripts.
(E) Number of transcripts per gene genome wide from SIS in human and mouse brains.
(F) Number of unique transcripts (Trans_Div) and abundance (Gene_FL) for 213 ASD risk genes, shown as an average of 56 transcripts per gene and a median of 35.
(G and H) Human SIS data show heightened transcript diversity in genes associated with brain disorders, especially ASD and NDD, compared to other diseases. We observed a strong correlation between transcript diversity and abundance in all gene clusters except for those related to dementia/Alzheimer’s disease.
SIS uncovered more diverse transcriptomes genome-wide in mouse and human brains
From the SIS of 12 SMRT libraries of the human brain, we uncovered 131,585 unique transcripts across 15,308 annotated genes, including 311 novel transcripts (UCSC Track 1). The distribution of unique transcripts and sequencing reads per gene are shown in Figure 1C. The number of unique transcripts for a given gene was significantly correlated (Pearson r = 0.8871, p < 0.001) with its abundance (Figure 1D). From four SISs of mouse ST and PFC, we uncovered 154,492 unique transcripts from 16,556 annotated genes, with 1,570 being novel (Figure 1E and UCSC Tracks 2 and 4).
In human brains, the average number of isoforms per gene was 19, with an average sequence read count of 63. Notably, 595 genes exhibited over 100 isoforms (Figure 1E; Table S3a). SEPTIN4 has the highest number of isoforms at 692; it is a gene encoding a presynaptic scaffold and GTP-binding protein involved in exocytosis and which interacts with alpha-synuclein, implicated in Parkinson’s disease.41 In mouse brains, the average number of unique transcripts per gene was found to be 8, with an average of 17 sequence reads per transcript. Sorbs1 had the highest number of isoforms at 158; this gene encodes a Sorbin and Src homology 3 (SH3) domain-containing protein involved in insulin signaling and stimulation42 (Table S3b). We identified 182 genes with more than 50 isoforms and 19 genes with over 100 isoforms in mouse brains. Of these, 7 have human orthologs that also exhibit more than 100 isoforms. Our studies revealed a greater transcript diversity than other studies using the same sequencing platform and analytic algorithm.8,43 We examined the transcript diversity of 213 highly confident ASD-risk genes consolidated from three recent extensive ASD genomics studies using our SIS data44–46 (Figure 1F; Table S4). On average, individual ASD-risk genes exhibited 56 transcripts, with a 90% confidence interval (CI) in the range 8–140. ANK2 was noted for having the highest number of transcripts at 372. Remarkably, the expression level of SHANK3 was one of the lowest, ranking 212 of 213 ASD-risk genes (Figure 1F). Genes associated with brain disorders, especially ASD and neurodevelopmental disorders (NDDs), have significantly greater numbers of transcripts compared to genes implicated in disorders not related to the brain (Figures 1G and 1H).
A complex mouse Shank3 transcriptome from CIS
We noted that the longest annotated SHANK3/Shank3 transcripts in humans (NM_001372044.2, 7,691 bp, hg38) and mice (NM_021423.4, 7,380 bp, mm39) have not been detected in any published long-read RNA-seq datasets.6,8,43 From four SISs of mouse ST and PFC, we identified only five Shank3 transcripts (ranging from 5,625 to 6,463 bp) in ST, with none detected in PFC upon validation. The discrepancy in transcript number and the variation between ST and PFC were consistent with the highest expression level of Shank3 in ST and lower expression in neocortex at P21 days.26 The failure to detect longer Shank3 mRNAs by SIS was most likely due to their low abundance, as transcripts up to 14.5 kb were successfully sequenced in our libraries (Figures S1F and S1G).
With CIS, we detected 545 Shank3 transcripts in the mouse ST (Figure 2A) and 345 in PFC (Figure 3A), including the longest annotated transcript (NM_021423.4). We successfully validated 51 (85%) of 60 representative novel transcripts by RT-PCR and sequencing (Figures 2E–2H; Table S5). To evaluate the quality of each transcript, we employed a confidence metric that integrates the transcript abundance, the length of predicted open reading frame (ORF), and validation with srRNA-seq data (Figure S2A). In ST, 223 (41%) of Shank3 transcripts were classified as high confidence, while 382 (59%) were in moderate confidence. In PFC, 168 (49%) transcripts were in high confidence, with the remaining 176 (51%) of moderate confidence. Analysis revealed 36 and 26 potential transcription start sites (TSSs) in ST and PFC, respectively. In the ST, 142 Shank3 transcripts originated at exon 1 of the annotated referenced transcript (NM_021423.4) and terminated at 26 different sites (Figure 2B). Thirty-five transcripts terminated within exon 21, each presenting a different ORF. Exon 21, the largest coding exon of 2,257 bp, was spliced out in many transcripts. Over 90% of transcripts terminated within 100–500 bp of an annotated transcription termination site (TTS) and poly(A) signal (Figure S3). This indicates that the early terminations are not artifacts of RNA degradation or cDNA synthesis errors. Intron retentions were observed in introns 1, 2, 11, 12, and 19, leading to altered ORFs and earlier stop codons. While some transcript structure variations were subtle, they are predicted to encode different ORFs (Figures 2C and 2D).
Figure 2. Novel Shank3 transcriptome in mouse striatum (ST) by CIS.
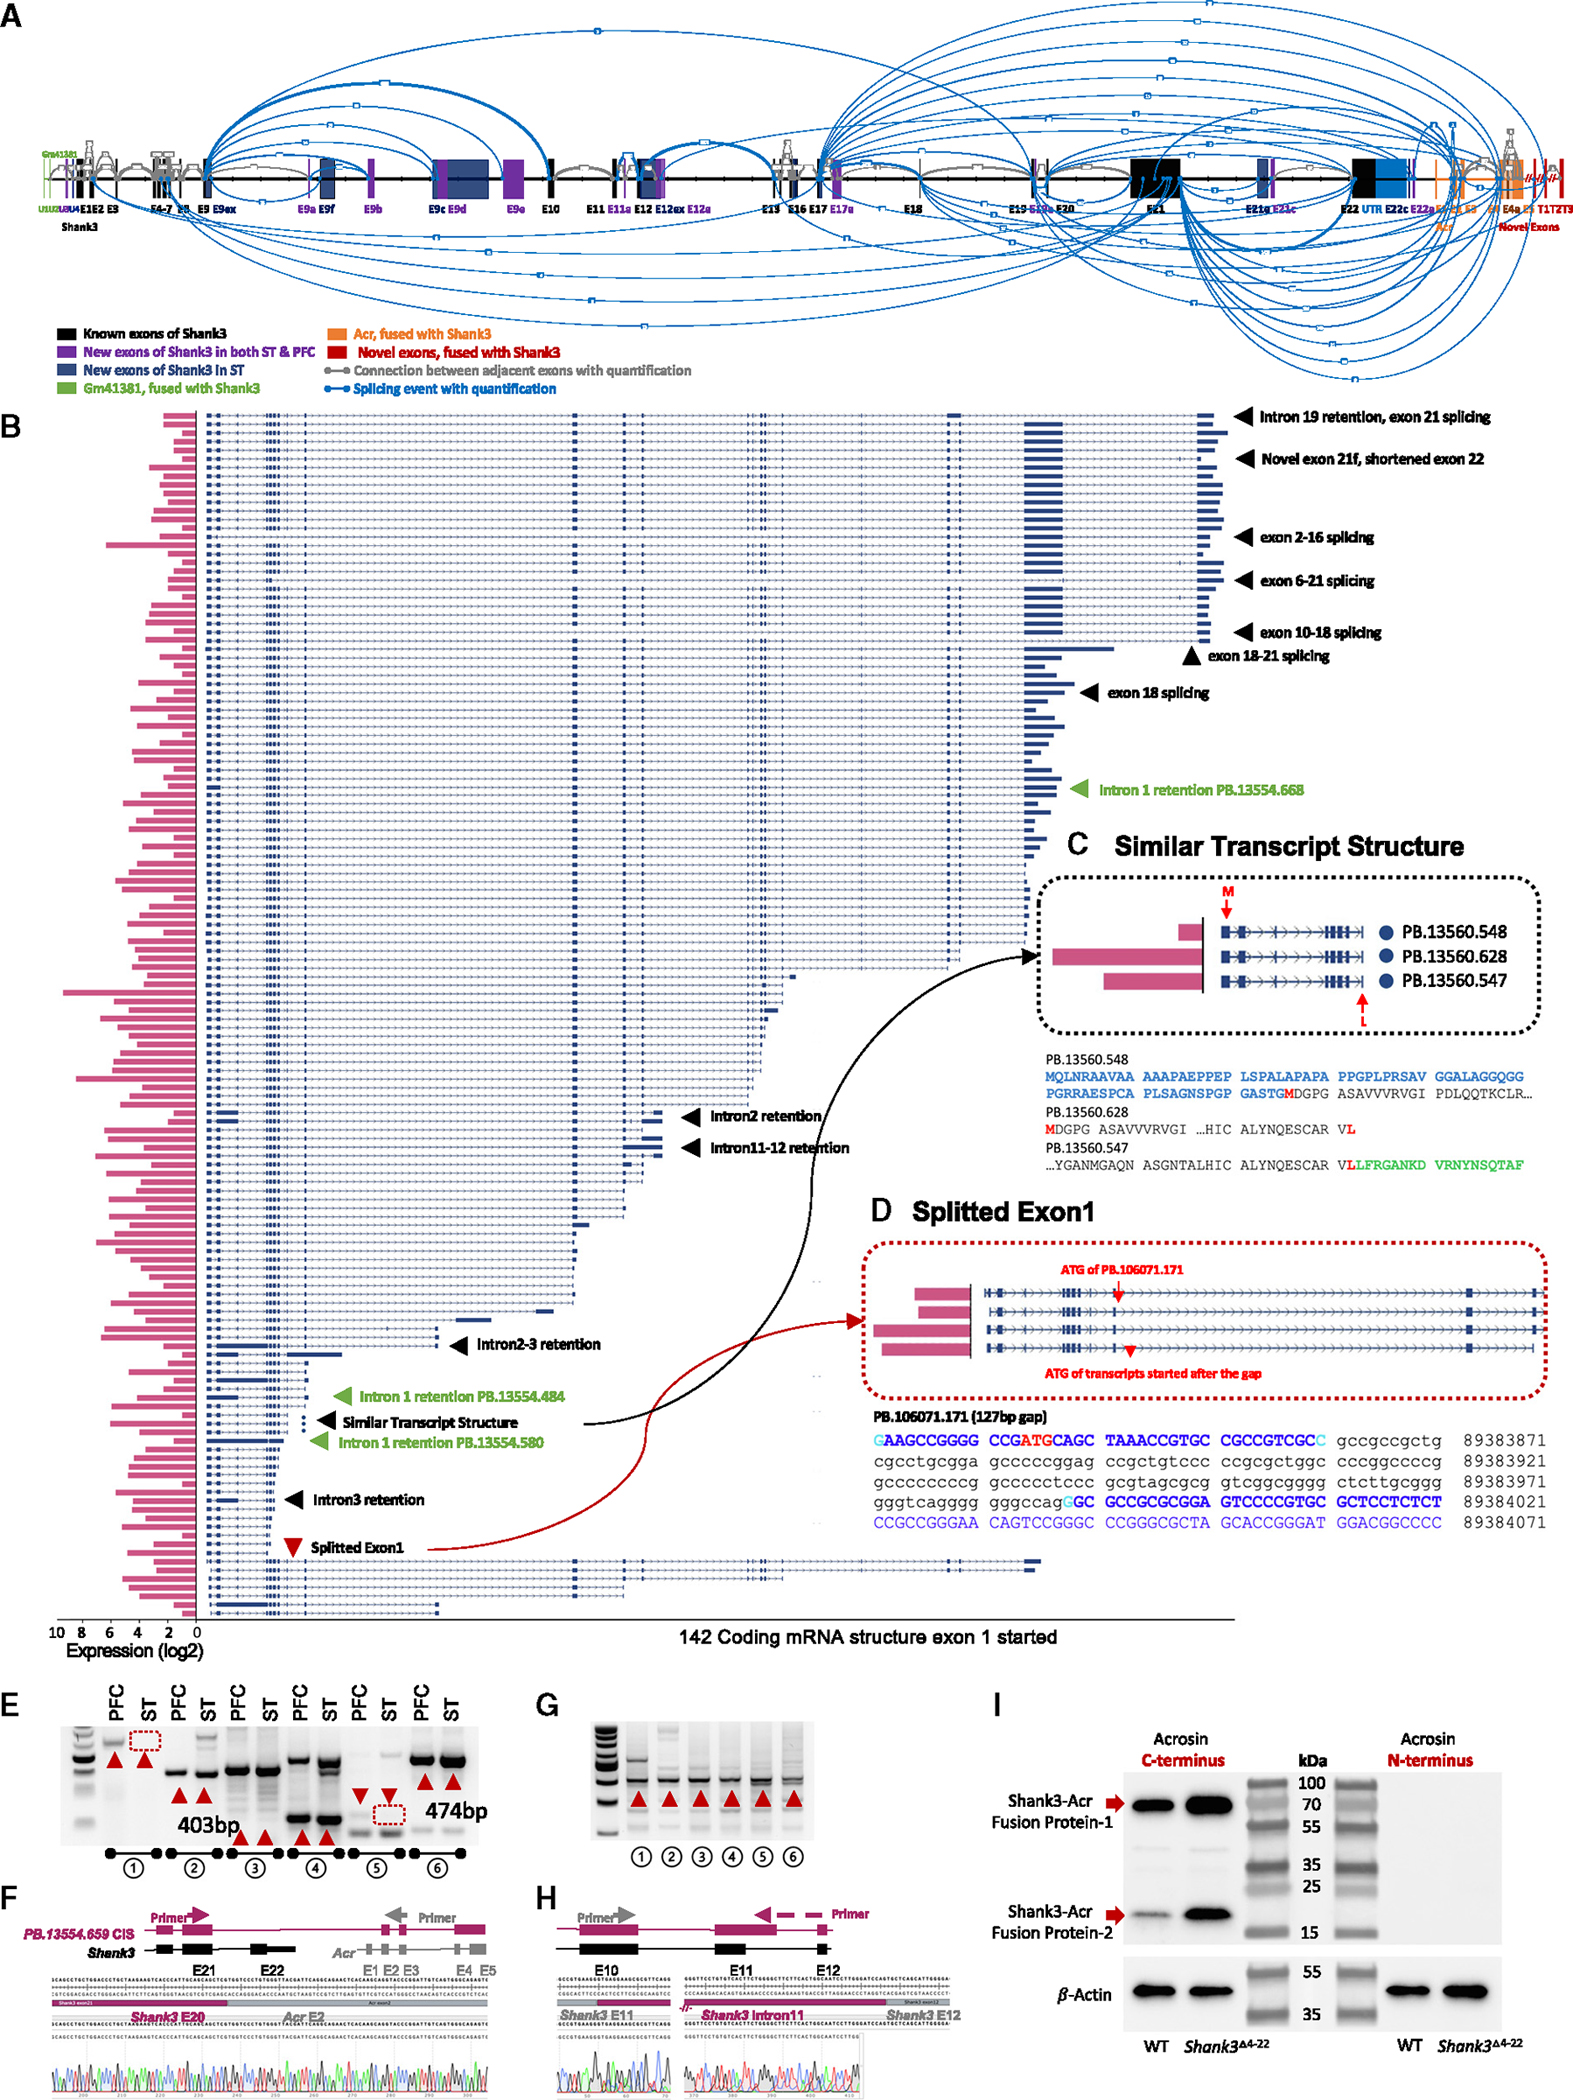
(A) CIS revealed a refined Shank3 gene structure and splicing patterns in WT mouse ST. The established Shank3 structure (NM_001034115, mm39) is expanded with newly detected exons shared between ST and PFC, depicted in purple. Unique splicing events, represented by gray lines with thickness indicating read quantity, include novel ST-specific exons in dark blue and alternative splices in light blue. Fusion transcript exons near Gm41381 and Acr, shown in green and orange, respectively, feature unique splicing with newly identified red exons (T1–T3) exclusive to Shank3. New exon U3 is shared between ST and PFC. U4 is linked to Gm4138 and ST specific. Exon 21e is a new in-frame exon and 21c is a new exon harboring a stop codon (enlarged view in Figure S9).
(B) One hundred forty-two unique transcripts started with the canonical exon 1 of annotated Shank3 (NM_001034115) in ST and terminated at different positions. Pink bar plots on the left are the abundance (log2 counts). Arrows describe the features of given transcripts.
(C) Example of transcripts with similar structures in panorama but different at the sequence level with predicted ORFs and ATG codons. The transcripts of PB.13560.548, PB.13560.628, and PB.13560.547 are similar, but the predicted ORFs show different ATG codons and protein domains.
(D) Details of the split exon 1. There is a cryptic splicing of 127 bp (non-capitalized sequence in black) within the annotated exon 1 of transcript PB.106071.171, which resulted in a predicted upstream ATG codon and an additional 134 aa. Other transcripts have transcriptional start sites (TSSs) in exon 1 but a predicted ATG codon in exon 2. Variability in TSS and intron 1 retention, as seen in transcripts PB.13554.484, PB.13554.580, and PB.13554.668, leads to ORFs of 304, 106, and 1,290 aa, respectively.
(E) Validation of new transcripts from paired mouse PFC and ST samples. Pair 1, novel exon U1; pair 2, fusion transcript between Shank3 exon 21 and Acr exon 2; pair 3, splicing event between Shank3 exon 9 and exon 19; pair 4, splicing event between Shank3 exon 5 and exon 21; pair 5, novel exon 9b of Shank3; pair 6, Shank3 exon 11 extension/intron 11 retention. The red arrows indicate the novel products confirmed by Sanger sequencing. Other bands are products from known transcripts.
(F) Sanger sequencing confirmation of a fusion transcript between Shank3 exon 21 and Acr exon 2 in mouse brain (pair 2 of E).
(G) Fusion transcripts in other tissues. Forward and reverse primers were from exon 20 of Shank3 and exon 5 of mouse Acr, respectively. Lane 1, liver in P21 mouse; lane 2, thymus in P21 mouse; lane 3, ovary in P21 mouse; lane 4, ovary in 3-month-old mouse; lane 5, testis in P21 mouse; lane 6, testis in 3-month-old mouse. The red arrows show the novel products confirmed by Sanger sequencing as indicated. Other bands are known products.
(H) Sanger sequencing of Shank3 exon 11 extension/intron 11 retention in mouse brain (lane 6 of G).
(I) Western blot shows the upregulation of SHANK3-ACR fusion protein in mouse PFC of Shank3Δe4−22−/− mutant mice compared to WT.
Figure 3. Novel Shank3 transcriptome in mouse PFC by CIS and predicted domain structures of ORFs.

(A) New Shank3 transcript structure and conch plot of splicing events discovered in WT mouse PFC by CIS. Color code is the same as in Figure 2A. The novel exon 9a (chr15: 89394416–89394465, mm39) is shared between PFC and ST. Other novel exons such as exon 12e (chr15: 89414330–89414640, mm39) were unique to PFC. Novel exons 21a, 21b, and 21c are predicted to result in an early stop codon and shorter ORFs (chr15: 89394416–89394465, chr15: 89408698–89408784, chr15: 89418571–89418609, mm39) (enlarged view in Figure S10).
(B) Structure of 59 transcripts with different TSSs but terminating at annotated exon 22 of Shank3. Pink bar plot represents the abundance (log2 counts) of each transcript.
(C and D) The comparison of transcripts and predicted ORFs between mouse ST and PFC.
(E and F) The pattern of deduced TSSs and predicted starting sites of the coding sequence (CDS) for all Shank3 transcripts, including new 5′ and 3′ fusion transcripts from CIS in mouse ST (E) and PFC (F). Each filament represents an individual transcript in different classes of GM41381 (U1–U2)-Shank3, Shank3-T1–3, Shank3, Shank3-Acr (first column), deduced TSS (middle column), and predicted starting sites of CDS (third column).
(G) A total of 125 unique ORFs are predicted from 142 transcripts starting with exon 1 in ST. The pattern of the combination of six protein domains is shown in the outermost ring of the windmill plot. The middle layer shows the abundance of each RNA transcript and the p value of its expression level compared to other transcripts. Only four ORFs of transcripts contained all six protein domains.
(H–K) Four windmill plots showing 270 predicted ORFs from all 345 transcripts detected in PFC classified by the combination of functional domains.
(L) Spiral plot showing an aggregated functional domain coverage of the transcripts captured by the Shank1–3 joint probe panel by CIS of mouse PFC and ST. Each dot represents a unique transcript. Each color represents a unique combination of functional domains. The dots are ordered from the longest to the shortest transcript, while the colors are arranged from the SAM to the Ubl domain.
In the PFC, we identified 59 Shank3 transcripts initiating from 19 different exons and terminating within the last coding exon 22 (Figures 3A and 3B). Notably, 28 of these transcripts started within exon 21 with different ATG codons. This finding aligns with our prior results obtained from 5′ rapid amplification of cDNA ends (RACE) experiments.26 We discovered 12 new exons in ST and 17 in PFC, with 11 being shared in both regions (Figures 2A and 3A). In addition, we discovered 4 new untranslated exons, U1–4, located 5′ upstream of the annotated Shank3 exon 1 (Figure 2A). Six new and alternative spliced exons, E9a–f, were identified between exons 9 and 10. The spliced variants between exons 9 and 10 were the most abundant, with 4,326 reads in ST and 641 in PFC, while exon 12e was exclusive to the PFC (Figure 2E).
Surprisingly, we observed a considerable number of novel fusion transcripts, in which different Shank3 exons were joined to downstream exons 2–5 of the Acr gene, which encodes the acrosin protein in the acrosome of spermatozoa47 (Figures 2A and 3A). These fusion transcripts were validated by PCR and sequencing (Figures 2E and 2F). We noted that splice events linking Shank3 exons 17 and 21 to Acr exons occurred more frequently than others. Specifically, fusions from Shank3 exon 21 to Acr exon 2 (208 reads) and exon 3 (243 reads) were the most abundant. Western blot using antibody against the C-terminus epitope of ACR detected significantly increased SHANK3-ACR fusion protein in Shank3Δe4−22−/− mutant mice compared to WT (Figure 2I). The protein bands of SHANK3-ACR fusion product no. 1 and SHANK3-ACR fusion product no. 2 were extracted for liquid chromatography-tandem mass spectrometry (LC-MS/MS) protein identification analysis. The peptide sequences identified from LC-MS/MS match to the protein sequence encoded by exon 2 or exon 3 of SHANK3. We also identified splice products from Shank3 exons 17 and 21 to three novel exons/transcripts (T1–3) situated downstream of Acr (Figure 2A). These transcripts in ST and PFC are predicted to yield five ORFs, extending the SHANK3 protein by an additional 64 aa (NP_001358973).
The transcriptomic architecture of Shank3 revealed by CIS in ST and PFC displayed both shared and unique characteristics. Overall, 230 transcripts (42% of ST, 67% of PFC) were common to both brain regions (Figure 3C). We analyzed the tissue-specific usage of TSSs and coding sequence starting sites (CDSs). Transcripts were categorized as follows: overlapping with the annotated Shank3 mRNA, U1–4 to Shank3, Shank3-Acr fusion, and Shank3-T1–3. In ST, 75% of transcripts belonged to the category overlapping with the annotated Shank3, and 24% fell within the Shank3-Acr fusion category (Figure 3E). In PFC, 52% of the transcripts were overlapping with annotated Shank3, while 43% were classified as Shank3-Acr fusion transcripts (Figure 3F).
Protein-domain-specific mouse SHANK3 proteome
SHANK3 and its family encode proteins possessing six domains: ubiquitin-like (Ubl), ankyrin repeats (ANKYR), postsynaptic density (PSD) protein 95/discs large homolog 1/zonula occludens 1 (PDZ), SH3, a proline-rich region containing Homer and Cortactin-binding sites (Pro), and a sterile alpha motif (SAM).48–50 As a scaffold protein in the PSD of synapses, SHANK3 protein interacts with various synaptic proteins via these domains, contributing to synaptic architecture and function. There are 474 ORFs predicted from 545 Shank3 transcripts in ST and 270 ORFs in PFC using GeneMarkS-T,51 with 261 ORFs being common to both brain regions (Figure 3D). ORFs of novel transcripts were further corroborated by proteome data derived from various in silico datasets, utilizing graded criteria for sequence identity and overlap (Figure S2B).
Among the 125 ORFs predicted from 140 Shank3 transcripts starting from exon 1 in ST, only 4 encompassed all six protein domains (Figure 3G). Among the 270 ORFs predicted from 345 Shank3 transcripts in PFC, only 1 contained the complete set of six protein domains, while 37 ORFs had more than three protein domains (Figures 3H–3K). One hundred nineteen SHANK3 ORFs (30%) in PFC comprised only a single protein domain, typically the Pro domain. Approximately 15% of the predicted ORFs lacked recognized protein domains. The protein domain combinations were found to be non-random and tissue specific; for instance, no predicted ORFs included the SAM-SH3 combination. The SAM-Pro-SH3 and SAM-SH3-ANKYR domain combinations were exclusive to PFC, while the Ubl-ANKYR-Pro-SAM and ANKYR-SH3-PDZ-Pro combinations were identified only in ST (Figure 3L).
Uniquely altered Shank3 transcriptome in Shank3-mutant mice
Sixteen Shank3-mutant mouse lines and eight mutant rat, dog, and non-human primate lines featuring various exonic deletions or point mutations have been generated to model SHANK3-associated ASD31 (Figure 4A). Using the same Shank3 probe design, we conducted CIS on Shank3-mutant mice: those with deletions of exons 4–9 (Shank3Δe4−9), exons 4–22 (Shank3Δe4−22), and exon 21 (Shank3Δe21).20,21,33,34 In Shank3Δe4−9 homozygous mice, we detected 69 Shank3 transcripts in ST and 56 in PFC. Representative mutant and residual transcripts are diagrammed in Figure 4B, with details provided in Figures S4A and S4B. In ST and PFC of Shank3Δe4−9 mice, we identified three long transcripts (~7.3 kb), harboring a deletion of exons 4–9. Interestingly, the first exon of these transcripts, with the exon 4–9 deletion, was in intron 1 of the annotated Shank3, a TSS not utilized in WT mice, suggesting an alternative TSS due to the exon 4–9 deletion. These transcripts also lacked coding exon 22 and exhibited fusions between exon 21 of Shank3 and exon 2 of Acr. ORF prediction suggests that the resultant SHANK3-ACR fusion proteins for these mutant transcripts are 1,254 aa for PB.6361.147, 1,073 aa for PB.6623.114, and 833 aa for PB.6623.199. Approximately 70% of the residual transcripts are initiated from intron 16/exon 17 and terminate within exon 21/intron 21 of Shank3 or exon 5 of Acr. Transcripts starting at exon 11 were exclusively detected in ST. The proportion of transcripts initiated from intron 16/exon 17 was increased in Shank3Δe4−9 mice compared to WT. A total of 54 ORFs (ranging from 113 to 1,327 aa) were predicted in ST, with a similar pattern observed in PFC from residual transcripts of Shank3Δe4−9 mice.
Figure 4. The summary and illustration of altered Shank3 transcripts in Shank3Δe4–9, Shank3Δe21, and Shank3Δe4–22 mutant mice from CIS.
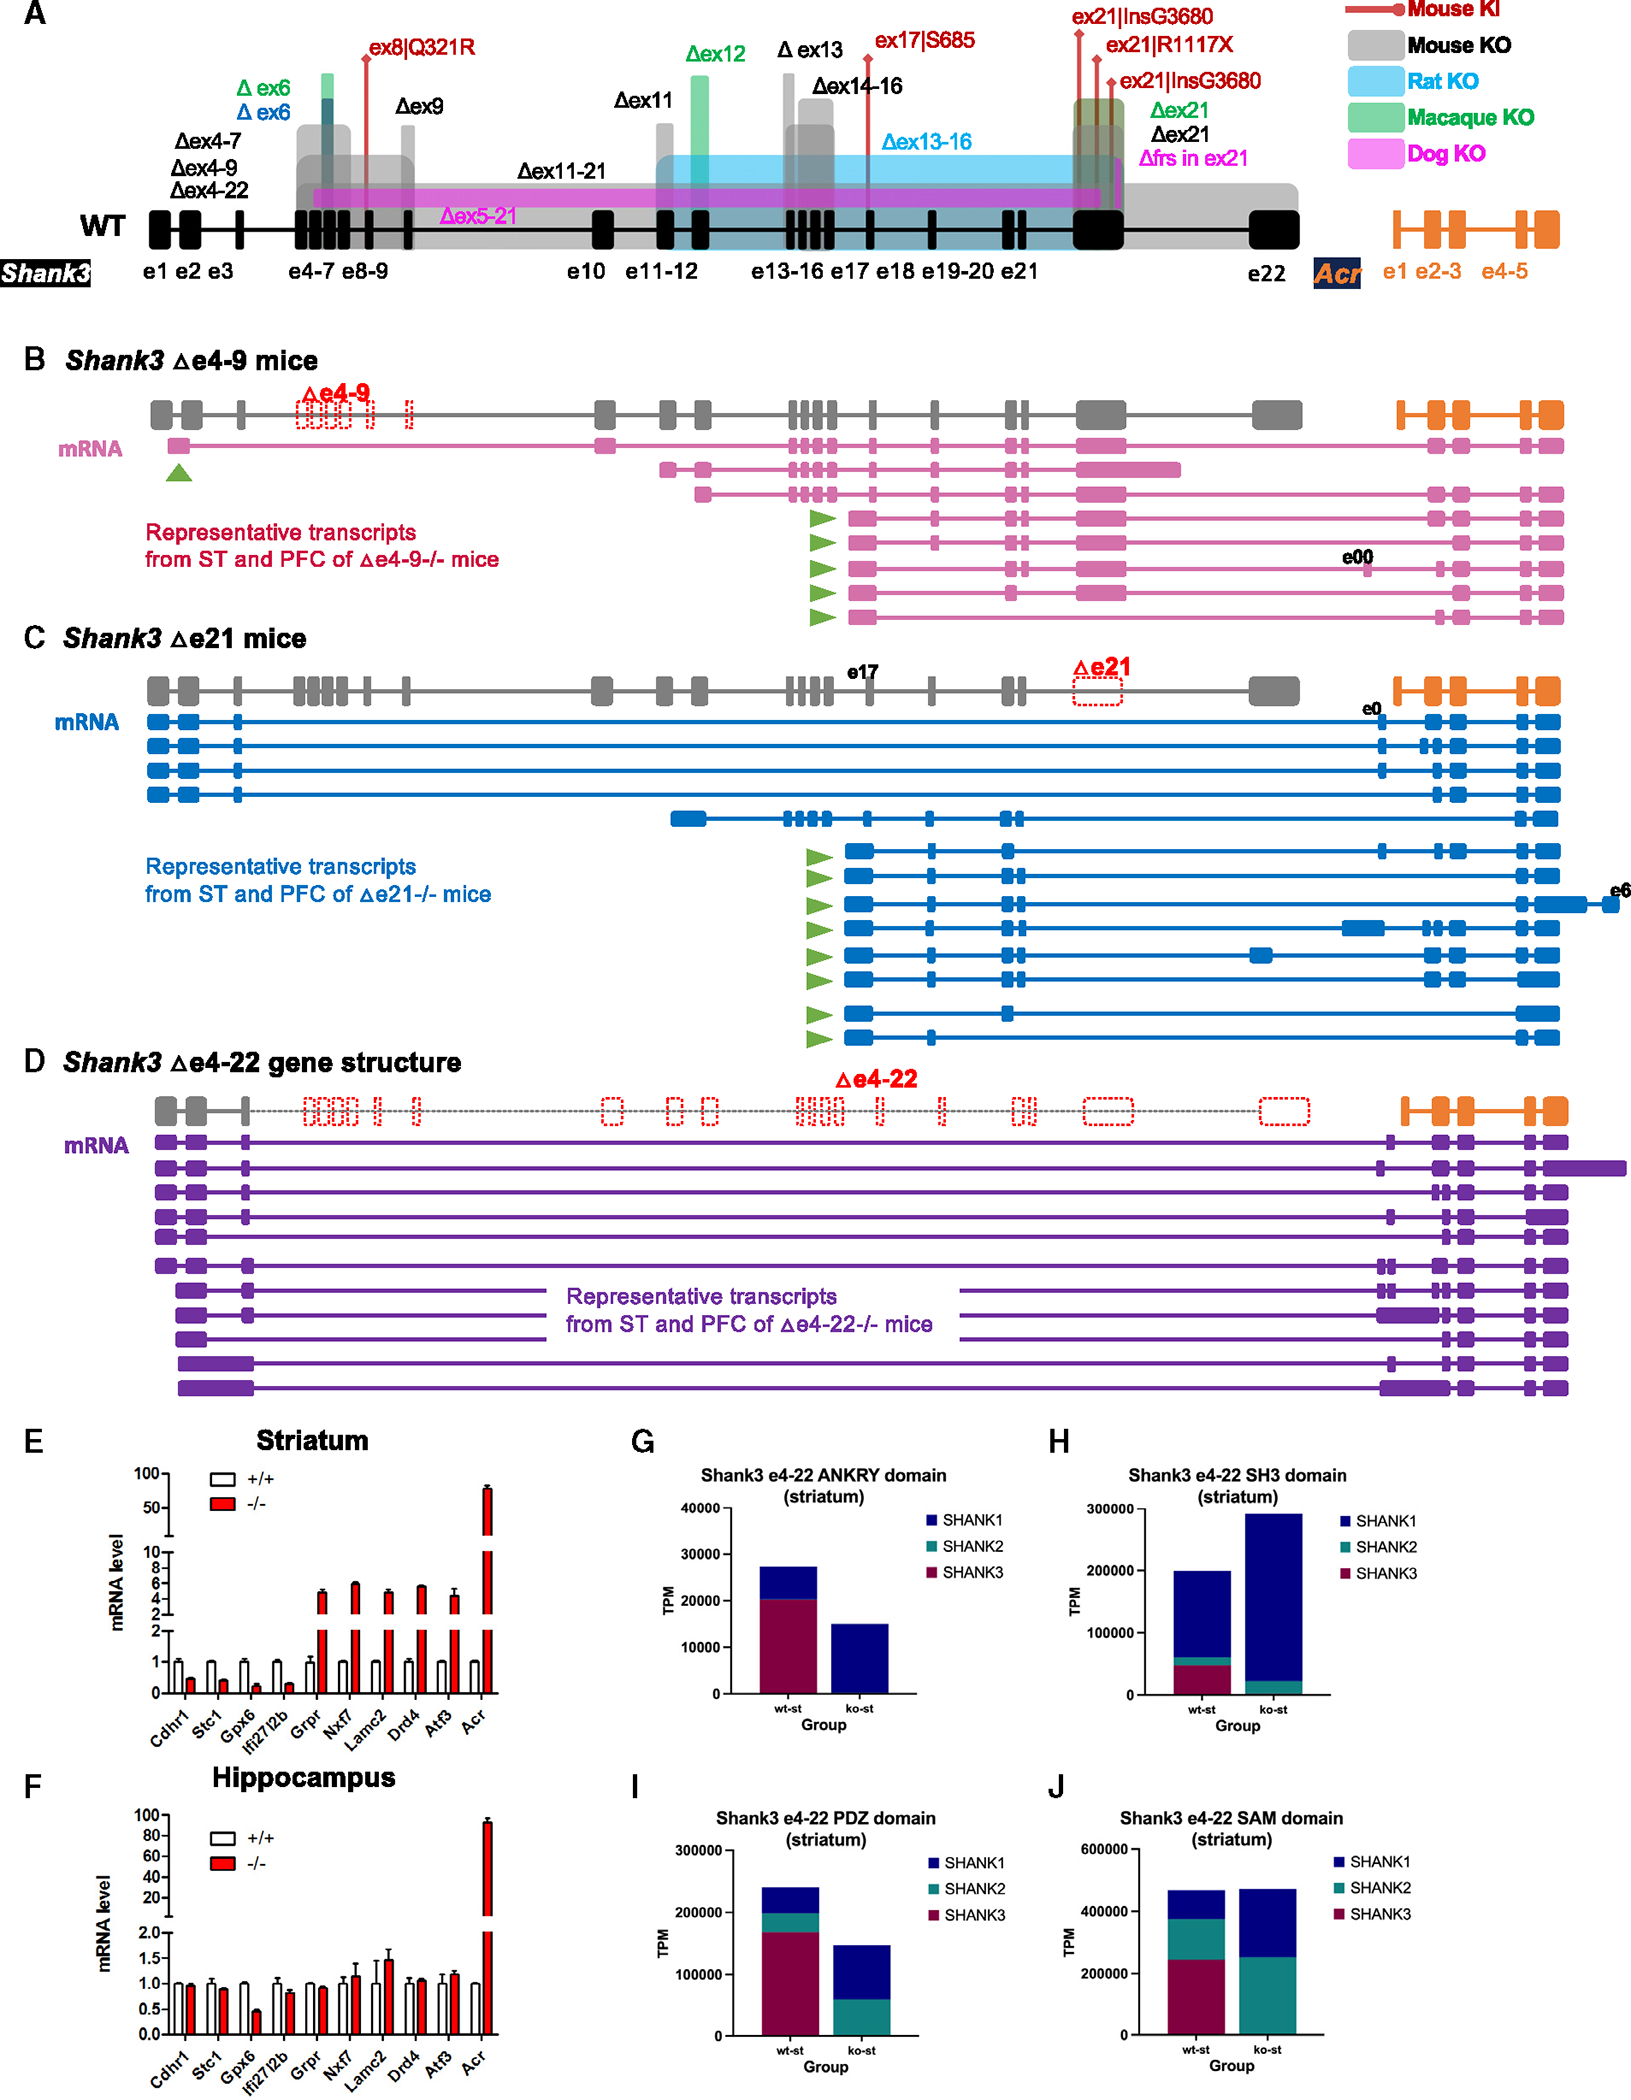
(A) Current annotated mouse Shank3 and Acr (NM_013455, mm39) gene structures. The annotations of genetically targeted mutations in mouse, rat, monkey, and dog are shown (KO, exonic deletions; KI, knockin mutation).
(B) The gene structure of Shank3Δe4–9 mutant mice is in gray, and representative mRNA transcripts, according to structural uniqueness, from Shank3Δe4−9−/− mice are in pink. No transcript using first annotated exon 1 was detected. Instead, the first exon, presumably a cryptic TSS (arrow), was detected in intron 1. The exon 4–9 deleted transcript missed exons 11, 12, and 22, but has a fusion between Shank3 and Acr. The transcripts starting at intron 16/exon 17 (arrows) as the first exon were most abundant. Extensive fusion transcripts between Shank3 exon 21 and Acr exon 2 were observed. The last coding exon 22 was not detected in any transcripts.
(C) The gene structure of Shank3Δe21 mutant mice and Acr gene, in gray, and representative mRNA transcripts, from a structural uniqueness perspective, from Shank3Δe21−/− mice in blue. Splicing between exon 4 of Shank3 and exons of Acr that resulted in fusion transcripts was observed. The transcripts starting at intron 16/exon 17 (arrows) as first exon and fusion between Shank3 and Acr were most common. The coding exon 22 was not detected in any transcript.
(D) The gene structure of Shank3Δe4–22 mutant mice and the Acr gene, in gray, and representative mRNA transcripts in purple to reflect structural uniqueness. The number of fusion transcripts between Shank3 and Acr is significantly increased in Shank3Δe4−22−/− mutant mice.
(E and F) Increased expression of the Acr transcript in Shank3Δe4−22−/− mutant mouse by RT-qPCR. The expression of the Acr gene was significantly increased in both striatum and hippocampus by >100-fold.
(G–J) Compensatory expression of the functional domains of SHANK family proteins in the striatum of Shank3Δe4–22 mutant mice. The bulk RNA-seq data of Shank3Δe4–22 were analyzed for the compensatory expression of other functional domains of Shank1 and Shank2 genes. The deficiency of the ANKYR and SH3 domains of SHANK3 was compensated for by SHANK1, but the deficiency of the PDZ and SAM domains was compensated for by both SHANK1 and SHANK2. The deficiency of the SAM and SH3 domains was fully compensated for, but the deficiency of the ANKYR and PDZ domains was partially compensated for.
In Shank3Δe21 homozygous mice, we identified 401 Shank3 transcripts in ST and 148 in PFC (Figures 4C, S4C, and S4D). In Shank3Δe4−22 homozygous mice, the numbers were 436 in ST and 792 in PFC (Figures 4D, S4E, and S4F). Remarkably, over 99% of these transcripts were Shank3-ACR fusion events in both brain regions of Shank3Δe21 and Shank3Δe4−22 mice. The predominant transcripts in Shank3Δe21 mice were from the intron 16/exon 17 region in both ST and PFC. Conversely, in Shank3Δe4−22 mice, transcription primarily initiated from intron 1/exon 2. We also detected multiple novel exons interposed between Shank3 and Acr genes (Figures S4C* and S4D*), exclusive to these Shank3 mutant lines and absent in WT. Fusion transcripts of Shank3-Acr were more prevalent in Shank3Δe4−22, Shank3Δe4−9, and Shank3Δe21 mutants. Moreover, a significant overexpression of Acr transcripts was found in neocortex and hippocampus of Shank3Δe4−22−/− mice (Figures 4E and 4F). Bulk RNA-seq data analysis from ST of Shank3Δe4−22−/− mice also indicated a compensatory expression from Shank1 and Shank2, which was protein domain specific (Figures 4H–4K).
The Shank3 transcriptomic findings from CIS prompted us to extend our approach to include all Shank family genes (Shank1–3) using a joint capture strategy. This joint CIS for the Shank family genes identified 664 Shank1 and 495 Shank2 transcripts in PFC and 320 Shank1 and 326 Shank2 transcripts in ST (UCSC Tracks 4 and 5). The overall transcript structures and patterns of Shank3 from both single-gene and joint CIS were similar. We discovered seven novel exons upstream of the annotated exon 1 of SHANK1 (Figure S5A). Fusion transcripts involving Shank1 and Shank2 with adjacent genes were also detected. The most upstream novel exon of Shank1 overlapped with the last exon of the Clec11a gene (NM_009131.3), which is transcribed in the reverse direction relative to Shank1 (Figure S5B). The fusion transcripts between Shank1 and Josd2, a gene located approximately 100 kb downstream, were exclusively detected in PFC. Two new untranslated exons, U1 and U2, were found about 24 kb upstream of the annotated 5′ exon 1 of SHANK2 (Figure S5C).
Transcript diversity of SHANK family genes in human brains
In the current reference genome (hg38), an annotated human SHANK3 mRNA (7,691 bp, NM_001372044) is displayed, yet it has not been experimentally validated. With CIS on SHANK family genes, we discovered 472 unique SHANK3 transcripts (Figures 5A–5C, UCSC Track 6), with the longest being 6,824 bp. Notably, the annotated 7,691 bp SHANK3 transcript (NM_001372044) was absent. The absence of the longest SHANK3 transcript is unlikely to be a result of RNA degradation, because a 10.8 kb SHANK2 transcript was detected in the same captured sample, which is much longer than the 3 kb peak in the study by Shimada et al.52 and the 1 kb in that of Yang et al.9 Instead, it appeared to be due to extremely low or no expression of the full-length SHANK3 transcript in adult frontal and temporal cortices. Most of the 472 unique SHANK3 transcripts clustered within regions spanning exons 1–9 and 10–22. None incorporated splicing between exons 9 and 10, a region characterized by high GC content (77% of GC) and a CpG island (hg38). The failure to detect exon 9–10 transcripts was probably not due to high GC content, because we could not detect them by regular RT-PCR using DNA polymerase that has been optimized for efficiently amplifying up to 90% of GC-rich templates. Similarly, the failure to detect the exon 9–10 splicing transcripts was not likely due to RNA quality, because the RIN for these tissues was between 7 and 9.5. We noted that 43 unique transcripts initiated from this CpG island, implying a TSS within intron 9. In silico analysis using a parameter-free assembly approach (Cufflinks-Cuffmerge)53 applied to srRNA-seq data and a published region-specific long-read transcriptome profiling on different postmortem human brain regions52 also failed to detect any transcripts connecting exons 9 and 10. Taken together, our data support that the lack of exon 9–10 splicing transcripts in these analyzed tissues is a biological phenomenon and less likely to be due to technical reasons.
Figure 5. The novel transcripts of human SHANK3 genes detected by CIS and predicted ORFs.
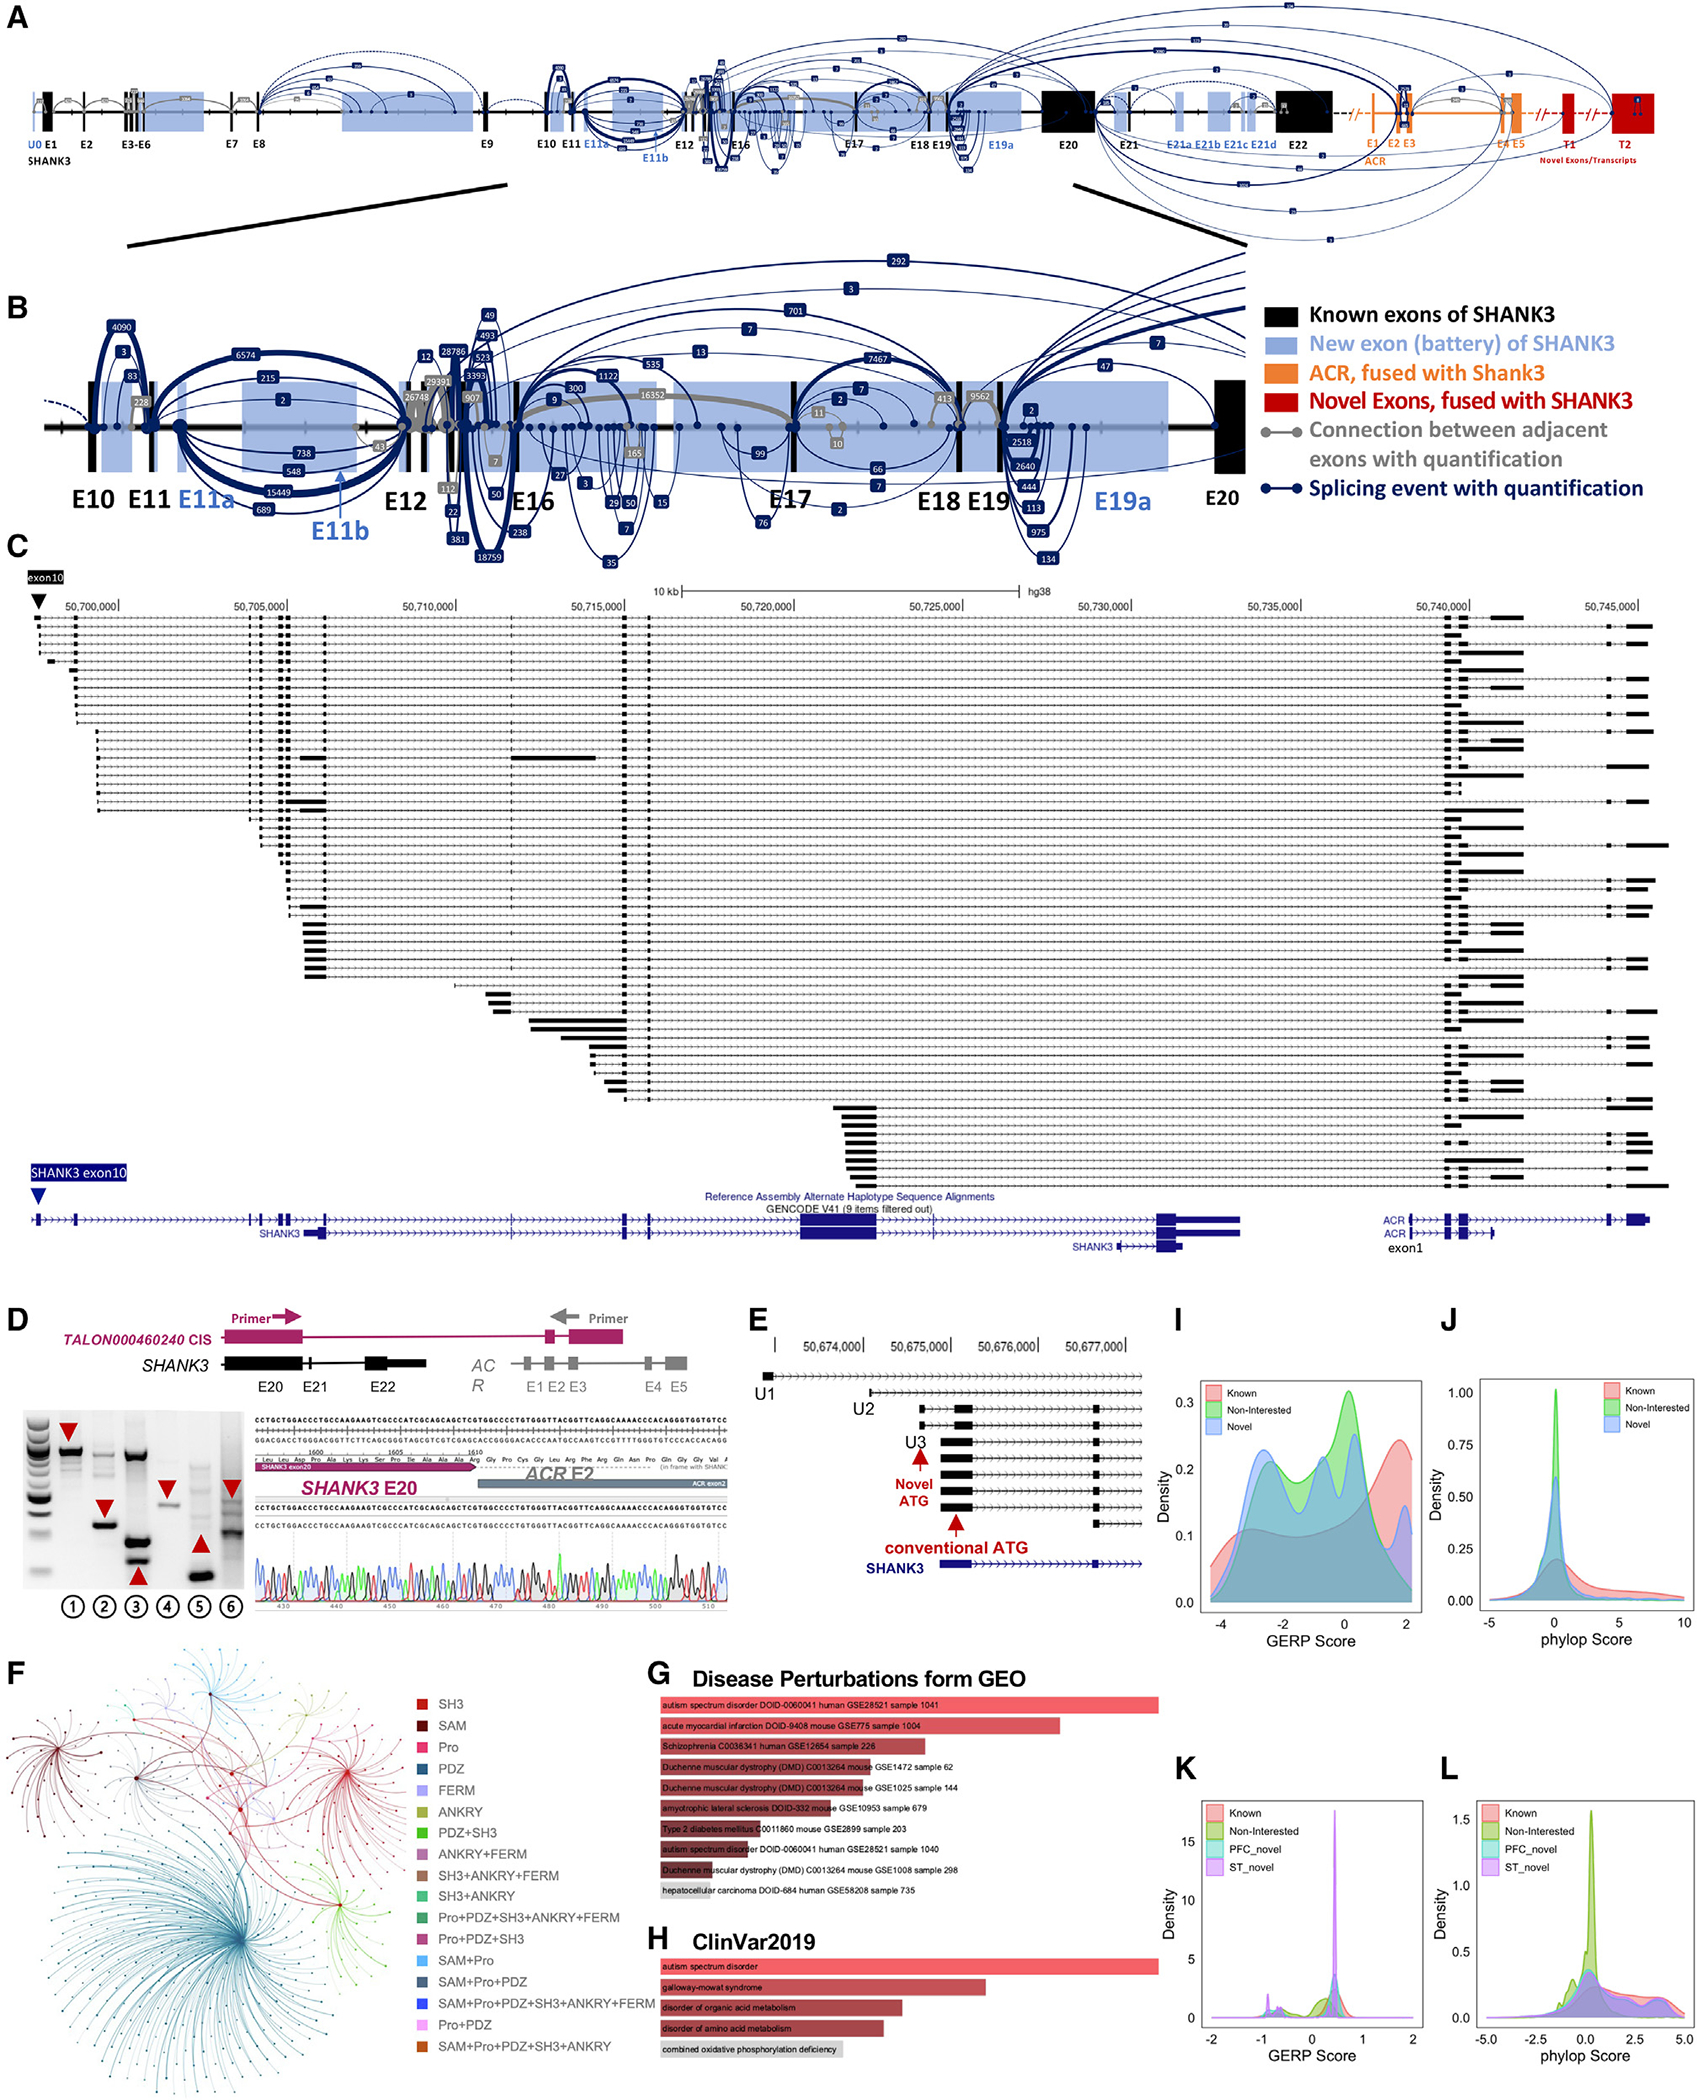
(A) New SHANK3 transcript structure and conch plot of SHANK3 transcripts discovered by CIS in normal human cortex. Black backbone is the annotated SHANK3 transcript of NM_001372044 (hg38). Blue rectangles represent novel exons of SHANK3. The exons of ACR are shown as orange rectangles. The new and uncharacterized exons distal to ACR are red rectangles. The gray line connects adjacent exons, while the light blue line illustrates alternative splicing events. The number of sequence reads for the splicing event is shown in the middle of connecting lines and reflected in the thickness of the connecting lines (enlarged view in Figure S9).
(B) Zoomed-in view of the splicing events between exons 10 and 20 in the human cortex. Exons 16 and 20 of SHANK3 in humans correspond to exons 17 and 21 of Shank3 in mice.
(C) Structure and abundance of the fusion transcripts between SHANK3 and ACR in the human cortex. A majority of fusion transcripts are initiated after exon 10, mainly from introns 16 and 17 and exon 21. The fusion transcripts are notably skipping exon 20 (the largest exon) of SHANK3 and exon 1 of ACR.
(D) Validation of novel SHANK3 transcripts in human brain tissue by RT-PCR and Sanger sequencing. Diagram of the primer design of L1 is shown. RT-PCR gel: L1, fusion transcript between SHANK3 exon 20 and ACR exon 2; L2, fusion transcript between SHANK3 exon 20 and ACR exon 4; L3, fusion transcript between SHANK3 exon 19 and ACR exon 2; L4, novel exon U3; L5, intron 14 retention; and L6, intron 15 retention. M, DNA marker. The Sanger sequence of the RT-PCR product of SHANK3 exon 20 and ACR exon 2 fusion from L1 is shown.
(E) Three new exons upstream of the annotated exon 1 of SHANK3 mRNA (NM_001372044) (U1, chr22: 50672853–50672979; U2, chr22: 50674076–50674097; U3, chr22: 50674642–50674705, hg38). A new ATG codon is in U2.
(F) Dandelion plot shows functional domain combinations of the SHANK1, SHANK2, and SHANK3 transcripts from CIS. Each dot represents a unique transcript, and each color is a unique combination of functional domains. There are 17 combinations of functional domains of human SHANK family genes. The PDZ domain was significantly more present (~70%) in predicted ORFs.
(G and H) Significant enrichment of fusion transcripts in transcriptome data of ASD and schizophrenia. Gene Ontology enrichment analysis with Enrichr95 in 41 disease-related datasets is shown. The fusion transcripts were significantly enriched in ASD and schizophrenia in disease perturbations from the GEO dataset (G) and the ClinVar2019 dataset (H).
(I and J) Distribution of GERP (G) and PhyloP (H) scores across human SHANK3 genomic regions of known coding exons, novel exons from CIS, and a non-transcribed region in cerebral cortex. (I) The GERP score for novel exons from CIS in cerebral cortex is significantly higher than in a non-transcribed region (D = 0.097; p < 0.001) but significantly lower than that of SHANK3 known exons (D = 0.299; p < 0.001). (J) The PhyloP score for novel exons from CIS in cerebral cortex is significantly higher than in a non-transcribed region (D = 0.133, p < 0.001) but significantly lower than that of SHANK3 known coding exons (D = 0.296, p < 0.001).
(K and L) Distribution of GERP and PhyloP scores across mouse Shank3 genomic regions of known coding exons, novel exons from CIS, and a non-transcribed region in PFC and ST. (K) The GERP score for novel exons from CIS in PFC and ST is significantly higher than that of a non-transcribed region (PFC, D = 0.548, p < 0.001; ST, D = 0.602, p < 0.001) but significantly lower than that of known Shank3 coding exons (PFC, 0.15, p < 0.001; ST, D = 0.0960; p < 0.001). (L) The PhyloP score for novel exons from CIS in PFC and ST is significantly higher than that of a non-transcribed region (PFC, D = 0.385, p < 0.001; ST, D = 0.439, p < 0.001) but significantly lower than that of known Shank3 coding exons (PFC, D = 0.184, p < 0.001; ST, D = 0.128, p < 0.001).
Similar to mouse Shank3, we detected 66 fusion transcripts between SHANK3 and ACR (Figure 5C). These fusion transcripts, intron retention, and novel exons were validated by RT-PCR and sequencing (Figure 5D). Fifty-eight of them were fusion transcripts comprising exon 19/exon 20 of SHANK3 (exon 20 is the largest exon in human, equivalent to exon 21 in mouse) to exons 2–5 of ACR. Nine transcripts that started within SHANK3 exon 20 were found to be fused with ACR. We observed splicing events connecting SHANK3 exons 19–20 to uncharacterized downstream exons, T1–2, of ACR. We also detected three novel untranslated exons (U1–U3) upstream of exon 1 of SHANK3 mRNA (Figure 5E). The sequence of U2 is highly conserved in mouse.
With the joint capture for SHANK family genes, we detected 86 SHANK1 and 277 SHANK2 transcripts (UCSC Track 6), from which 69 ORFs for SHANK1 and 165 ORFs for SHANK2 were predicted. Across these SHANK family ORFs, we observed 17 different combinations of the six functional domains, with the PDZ domain appearing most frequently (Figure 5F). A complete set of all six functional domains (Ubl, ANKYR, SH3, PDZ, Pro, and SAM) was predicted only in one SHANK2 transcript.
The unexpected discovery of extensive fusion transcripts between SHANK3 and ACR in human brain tissue led to a comprehensive genome-wide analysis for fusion transcripts in SIS data. We detected 2,265 fusion transcripts (1.7% of the total transcripts) associated with 3,499 genes in the brains of children and adults, with 963 fusion transcripts common to both groups. About 98% of fusion transcripts are between two adjected genes. A small number of fusion transcripts are among three adjacent genes. No fusion transcript is from distant genes or genes from two chromosomes. Gene Ontology enrichment analysis revealed a significant enrichment of fusion transcripts in genes associated with ASD (Figures 5G and 5H).
To access the functional constraint of novel SHANK3/Shank3 exons in humans and mice identified by CIS, we utilized evolutionary rate profiling (GERP)54,55 and PhyloP56 conservation scores. In mice, GERP and PhyloP scores for most Shank3 novel exons were significantly higher than those of a non-transcribed region, but they were lower than scores for known coding exons in both PFC and ST (Figures 5I and 5J; Tables S6A and S6B). A concordant pattern was observed in human SHANK3 (Figures 5K and 5L; Tables S6C and S6D). These results suggest that the novel exons of SHANK3/Shank3 uncovered by CIS are evolutionarily constrained elements, underscoring their potential functional significance.
Transcript diversity and novel transcripts of the TP53 gene in human and mouse
To examine whether the transcriptional complexity is exclusively associated with synaptic genes, we applied SIS and CIS to TP53 in human brain and to Trp53 in mouse brain and thymus, where Trp53 expression is the highest. SIS detected only five Trp53 transcripts in mouse ST and three in mouse PFC, which is consistent with the data in the literature,57,58. In contrast, CIS identified a comprehensive set of 243 transcripts from thymus, 164 from PFC, and 188 from ST (Figures S6A–S6C, UCSC Track 7). The patterns of unique Trp53 transcripts are similar among the three tissues, with 18 alternative TSSs deduced from thymus transcripts. A significantly higher percentage of transcripts exhibited intron retention in Trp53 compared to Shank3. In addition, novel tissue-specific 5′ exons unique to brain (bU1) and thymus (tU1/tU2) were discovered.
In human brain, CIS detected 106 TP53 transcripts, which predicted 60 ORFs, 18 TSSs, and three 3′ transcriptional ends (Figure S6D, UCSC tracks). We also discovered three novel exons (hT1–3) at the 3′ end, which extended the C terminus of the TP53 ORF by 72 aa and is conserved with the mouse TRP53 (77% identical). These observations underscore the diversity of the TP53/Trp53 transcriptome, which is complex but less heterogeneous than that of SHANK family genes.
Developmental, tissue, and cell-type specificity of SHANK3/Shank3 transcripts from CIS
To investigate the developmental specificity of Shank3 transcriptome, we aligned mouse srRNA-seq data of the cerebral cortex at different ages from day E14.5 to P18059–61 to Shank3 transcripts from CIS (Figure 6A). The E14.5 embryos exhibited the least diversity of Shank3 transcripts. As development progressed, the number of unique Shank3 transcripts increased, reaching a maximum at day P56 before declining at day P180. Further analysis on cell-type specificity aligning scRNA-seq data from the anterior cingulate area (ACA) of 8-week-old mice40 to Shank3 transcripts identified by CIS demonstrated a significantly higher abundance of Shank3 transcripts in glutamatergic neurons compared to GABAergic neurons. The Shank3 transcripts including exon 18 were exclusively found in endothelial cells (Figure 6B).
Figure 6. Development-, cell-type-, and cell-compartment-specific and spatial transcriptome of Shank3 in mouse brains.

(A) Development-specific Shank3 transcripts in mouse cerebral cortex.
(B) Cell-type-specific Shank3 transcripts in mouse brains. The scRNA-seq of the anterior cingulate cortex (ACA)5 was aligned to Shank3 transcripts detected by CIS. Glutamatergic neurons, especially the L2/3, L4/5, and L6 CTX, have more diverse Shank3 transcripts compared to GABAergic neurons and non-neuronal cells. Certain transcripts were cell-type specific. The Shank3 transcript (PB.10607.933) including exon 18 was detected only in endothelial cells.
(C–F) Mouse Shank3 transcripts in the Visium spatial transcriptome. (C) Visium spatial anatomy (CA, cornu ammonis; DG, dentate gyrus; TH, thalamus; PIR, piriform cortex; MEA, medial amygdala; CP, choroid plexus; CTX, cortex; HPF, hippocampal formation; HY, hypothalamus).
(G) Cellular compartment-specific changes in Shank3 exon usage in the hippocampus of an Alzheimer’s disease (AD) mouse model from scRNA-seq data from different cellular compartments. The nucleus, compared to synapses, expressed significantly fewer splicing events of 32 and 33 that correspond to exon 21, the largest exon of mouse Shank3.
(H) Different patterns of Shank3-Acr fusion transcripts in nucleus and synapse between WT and AD mice.
To investigate tissue specificity, we analyzed the exon usage in mouse Shank3 transcripts from CIS against scRNA-seq data from five cerebral cortex subregions.40 The exon usage patterns of Shank3 CIS transcripts within the same cell type exhibited unique variations across different brain subregions (Figure S7). This tissue-specific exon usage was also observed in other long-read transcriptome sequencing and scRNA-seq studies.52,62 The pattern of human SHANK3 transcripts in infants and children was distinct from that of adults when we aligned human srRNA-seq data to SHANK3 transcripts from CIS. The SHANK3 exon usage also changed with age.
We mapped Shank3 transcripts to 103 Genomics Visium spatial transcriptome of the mouse to visualize the expression pattern in situ.63 Two probes targeting Shank3 exons 11 and 22, and one for Acr exon 5, facilitated this analysis. Three Shank3 transcripts identified by CIS were enriched to distinct anatomical regions (Figures 6C–6F). Shank3 transcript TALONT000202476 containing exon 11 and TALONT000200721 incorporating exon 22 have similar cell-specific expression patterns, albeit at different levels of abundance. Transcript TALONT000200852, a fusion transcript connecting Shank3 exon 21 and Acr exon 5, displayed a cell-type-specific expression pattern. Furthermore, we found a cellular-compartment-specific preference for the Shank3 transcripts. The inclusion of Shank3 largest exon 21 is significantly more common in synapses than in nuclei from mouse brain scRNA-seq data64 (Figure 6G). Exon 2 of the Acr gene, frequently fused with Shank3 exons, was significantly less present in the nucleus of AD models compared to WT. The splicing events involving a 5′ segment of Acr exon 5 were more common across both nucleus and synapses in AD mice, while splicing involving the latter 2/3 of Acr exon 5 was more frequent in the nucleus of WT (Figure 6H).
Applications of the SHANK3 transcriptome from CIS to genome sequencing and transcriptome analyses of ASD and other neuropsychiatric disorders
Human SHANK3 transcripts identified through CIS exhibit expression patterns that are specific to developmental stages and brain regions, such as the cerebral cortex and cerebellum (Figures 7A–7D and S8). We extended the in silico transcriptome diversity analysis to 213 highly confident ASD-risk genes consolidated from three recent extensive ASD genomics studies (Table S4).44–46 The transcriptome diversity of ASD-risk genes was significantly greater than that of non-ASD-associated genes (Pearson r = 0.386, p < 0.001). Specifically, ASD-risk genes associated with gene expression regulation and neuronal communication showed a significantly higher level of transcriptome complexity compared to genes in other functional categories (Pearson r = 0.825 and Pearson r = 0.793, respectively, both p < 0.001). SHANK3, consistently reported as one of the top 5 ASD-causing genes in these studies,44–46 is also implicated in schizophrenia (SCZ),65 bipolar disorder (BPD),66 and major depressive disorder (MDD).67 To investigate alterations in SHANK3 transcriptomes across these disorders, we analyzed srRNA-seq data from the PsychENCODE project.36 Principal-component analysis (PCA) revealed unique transcript patterns for each disorder, especially for ASD and SCZ (Figure 7E). The expression of a subset of SHANK3 transcripts varied across ASD, MDD, BD, SCZ, and controls (Figures 7E–7I). Brain-region- and age-specific expression of SHANK3 transcripts formed a distinct cluster in PCA (Figure 7J). Exons 12, 15, 20, and 22 of SHANK3 transcripts in BA7 were significantly more represented in ASD brains than in controls (Figure 7K), and exon 10 showed a higher expression in BA38 of ASD brains (Figure 7L).
Figure 7. Improved transcriptome analysis of ASD transcriptome and sequence variant annotations of genome sequence data using the SHANK3 transcript structure from CIS.
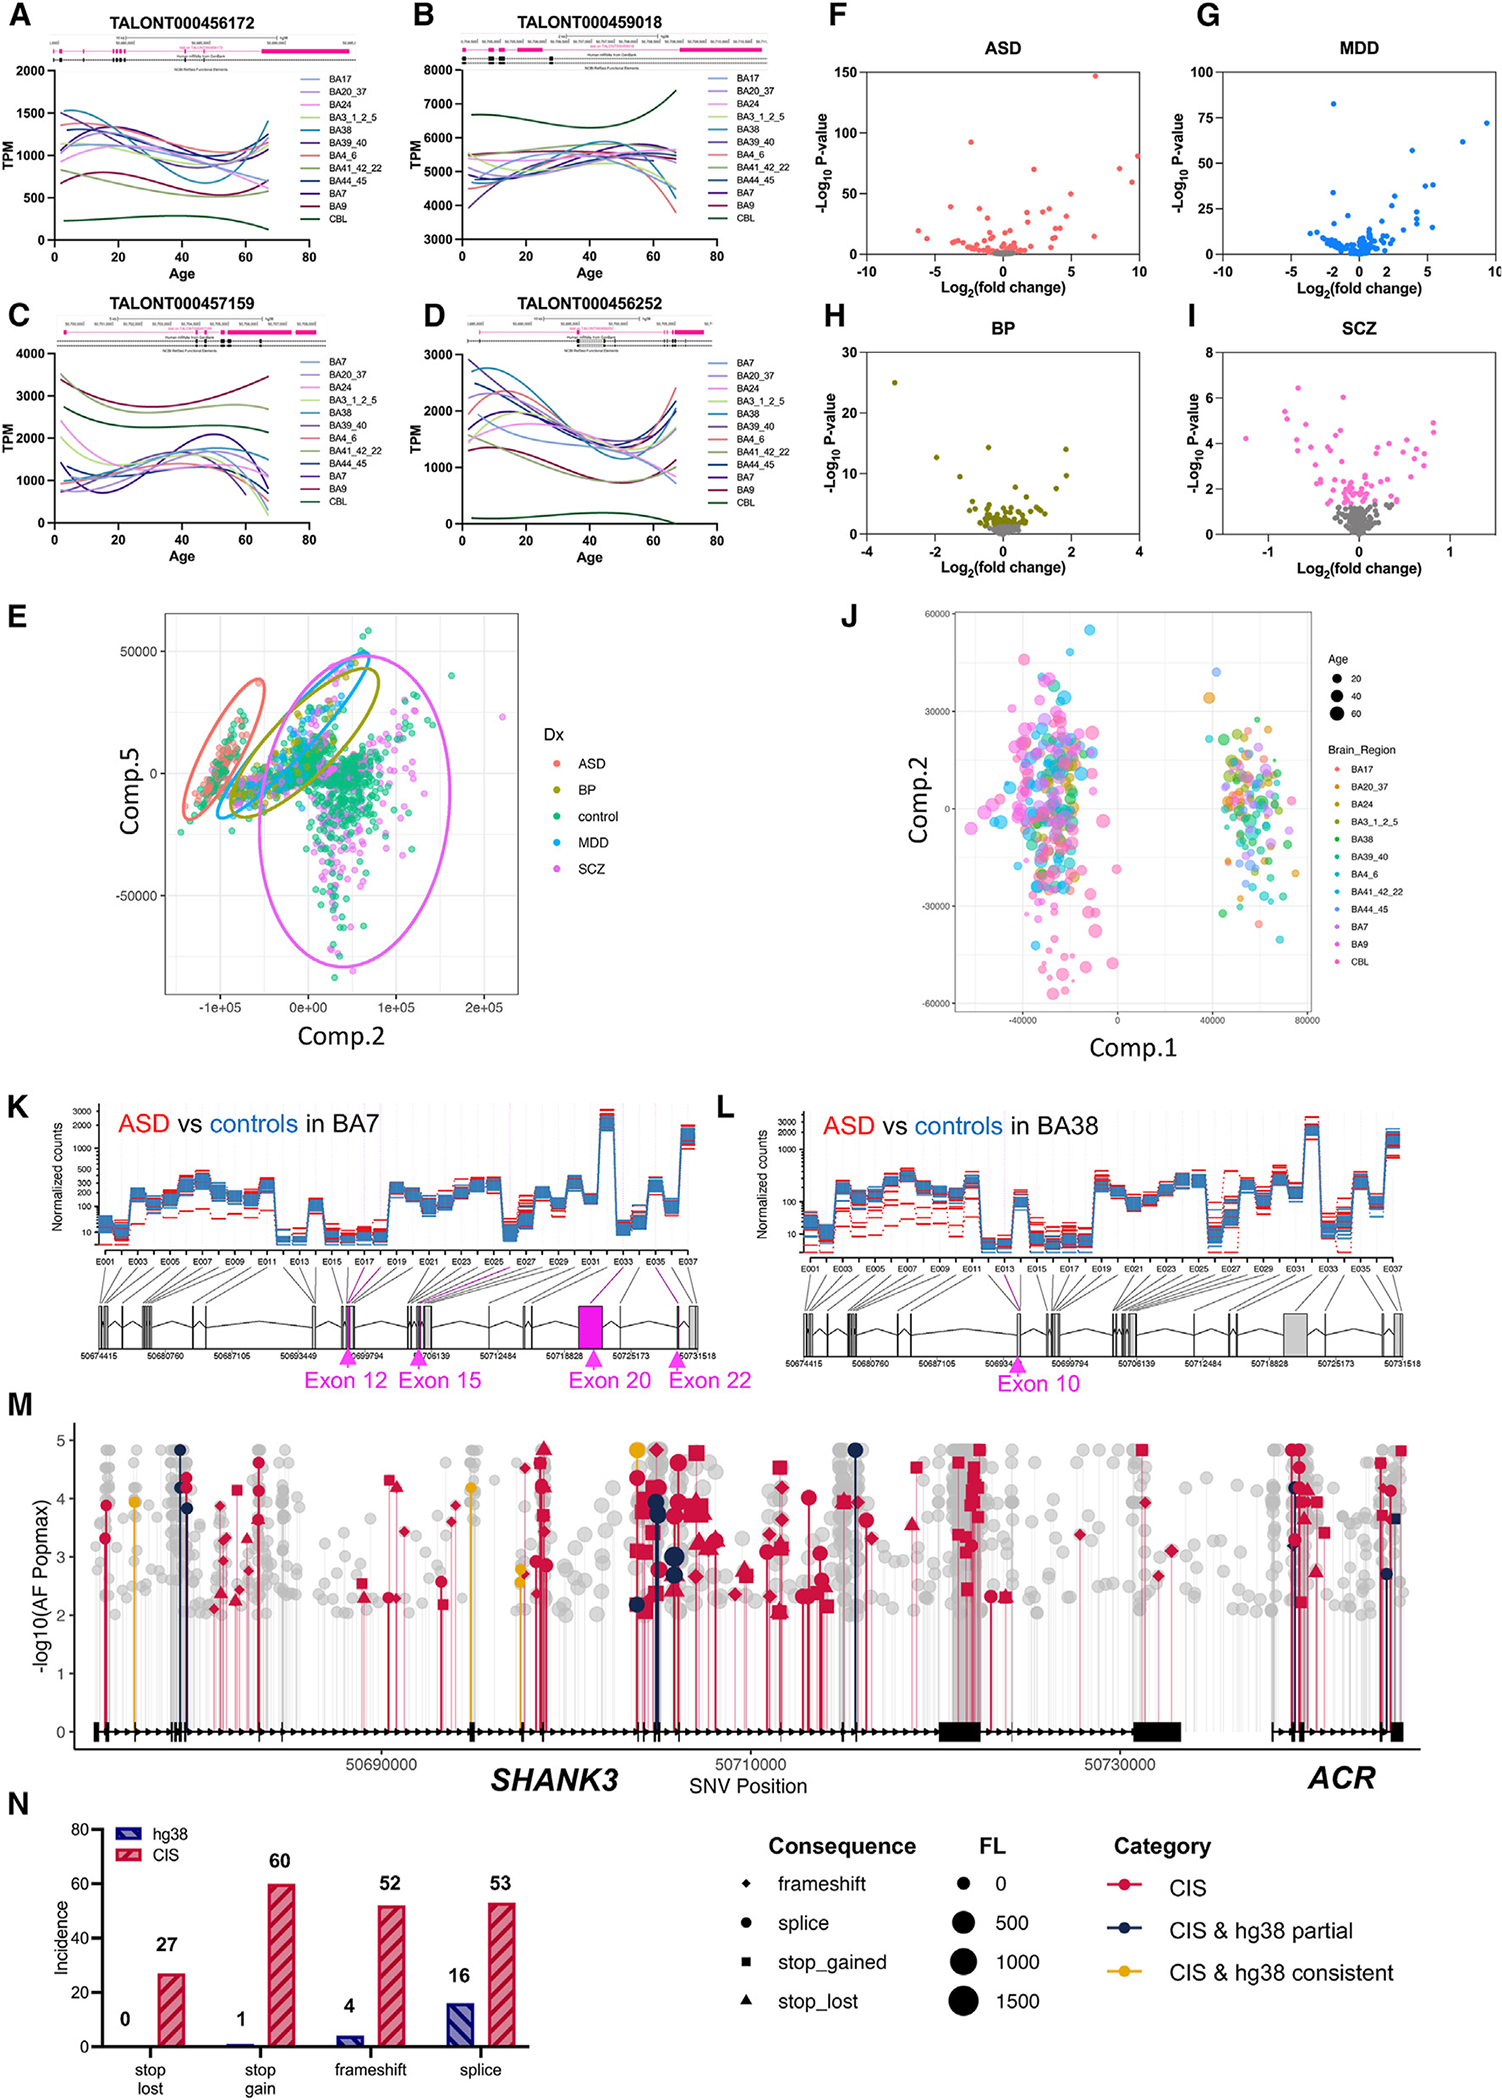
(A–D) The patterns of human SHANK3 transcripts from CIS changed at different ages and brain regions. Bulk RNA-seq data of normal controls was aligned to SHANK3 transcripts detected using CIS (BA, Brodmann area; CBL, cerebellum).
(E–I) PCA of human SHANK3 transcripts from CIS and bulk RNA-seq data of 2,474 cases with ASD, BPD, MDD, or SCZ, and normal controls from PsychENCODE (only data from prefrontal cortex are included). The clusters of MDD and BPD overlapped but are separate from ASD and SCZ. (F–I) Volcano plots for individual disorders ASD (n = 68), MDD (n = 87), BPD (n = 297), and SCZ (n = 736) compared to controls (n = 1,286).
(J) PCA of SHANK3 transcripts in different brain regions and ages (BA, Brodmann area; CBL, cerebellum).
(K and L) Brain-region-specific change in SHANK3 transcripts in ASD brains. Bulk RNA-seq data of subregions of the brain from ASD and controls were aligned to SHANK3 transcripts from CIS. (K) Exons 11, 15, 20, and 22 of SHANK3 transcripts were significantly more represented in the BA7 region of ASD. (L) Exon 10 of SHANK3 transcripts is significantly more represented in BA38 of ASD brain.
(M) Utilizing the updated SHANK3 transcript structure from CIS enhanced PTV detection in ASD, SCZ, and BPD exome and genome sequencing data. From 55,000 cases, we identified 1,530 new PTVs, a significant increase from previous annotations using the SHANK3 transcript NM_001372044.2 in hg38. Of these, 192 variants were likely deleterious, including 27 stop-loss, 60 stop-gain, 52 frameshift, and 53 splice variants, compared to the earlier finding of 22 such variants.
(N) The discovery rate of PTVs for SHANK3 is increased from 1.3% using NM_001372044.2/hg38 as a reference to 12.5% using the transcript structure from CIS in this study.
While SHANK3 genetic mutations are implicated in 1%–2% of ASD cases and to a lesser extent in other neuropsychiatric disorders,44–46,68,69 we sought to examine whether incorporating the enhanced SHANK3 transcript structure from CIS into publicly available ES and WGS of ASD/SCZ/BPD datasets could uncover additional disease-associated single nucleotide variants (SNVs).46,70–73 We reanalyzed sequence variants on a large cohort of 177,000 samples of both controls and disease subjects, including ES data from the Autism Sequencing Consortium,46 BPD Exomes,71 and SCZ Exome Meta-analysis Consortium70 as well as WGS of ASD, SCZ, and BP cohorts from BrainVar72 and BrainGVEX.73 Variant identifications and annotations were previously based on the mRNA reference NM_001372044.2 and hg38 genome assembly. We used Variant Effect Predictor (VEP; release 107)74 and Genome Aggregation Database (gnomAD; v.3.1.2)75 for annotation and filtering, including variants with a population allele frequency of ≤0.01 for protein-truncating variants (PTVs), and excluding missense and synonymous variants for further analysis. SpliceAI76 and SnpEff77 were used to analyze splice variants and evaluate the pathogenic potential of stop-loss, stop-gain, and frameshift variants. This reannotation identified 1,530 new SNVs across 55,000 cases pooled from ASD (11,986 ES, 923 WGS), BP (14,210 ES), and SCZ (27,648 ES) cohorts (Figure 7M), resulting in the discovery of 27 stop-loss, 60 stop-gain, 52 frameshift, and 53 splice variants in SHANK3 considered potentially deleterious or PTVs using CIS annotation in disease subjects but not in controls. This was a marked contrast to the variants analyzed using the current reference (0 stop-loss, 1 stop-gain, 4 frameshift, and 16 splice variants). Accordingly, the detection rate for potential deleterious SNVs of SHANK3 increased from 1.3% when using the current reference (NM_001372044) to 12.5% when annotated with the SHANK3 CIS transcripts, highlighting the significance of comprehensive transcriptome annotation in uncovering genetic contributions to neuropsychiatric disorders (Figure 7N).
DISCUSSION
Diverse transcription is crucial for generating proteomic diversity and facilitating complex cellular functions. Precision of transcription is critical because mutations in the transcriptional regulatory DNA elements can cause numerous single-gene disorders. Despite the recent report of the completed human genome,78 the transcriptome remains largely uncharted. Our work applying SIS on human and mouse brains discovered unprecedented transcriptome diversity.8,43 Using the similar SIS protocol, Glinos et al.8 reported a maximum of 178 isoforms for a single gene, with only five genes exhibiting more than 100 isoforms. Both Glinos et al.8 and Shimada et al.52 detected a median of 2 isoforms per gene across various tissues and cell lines. Leung et al.’s study43 noted a peak of 40 isoforms per gene in the human cortex. Furthermore, Chau et al.79 assembled an average of 4 isoforms per gene from bulk RNA-seq of human developing brains. Significantly, these studies uncovered only a few incomplete SHANK3 mRNA isoforms. However, our study identified as many as 692 isoforms for a single gene, with 595 genes having more than 100 isoforms, and an average of 19 isoforms per gene in the human cerebral cortex. Our results suggest that the extent of transcript complexity described in existing literature is significantly underestimated, particularly for genes like SHANK3.
Our targeted capture and long-read sequencing have mapped the SHANK family transcriptomes in detail, with the majority of novel transcripts likely endogenously expressed. This is supported by our strict identification process, validation through RT-PCR and Sanger sequencing, consistency across experiments and brain regions, and conservation between species. In addition, the specificity of these transcripts was confirmed in Shank3-mutant mice. Despite the high confidence, it remains a possibility that a small fraction might not be expressed endogenously. The discovery of a substantial number of fusion transcripts for SHANK3/Shank3 in our study was unexpected, with a prevalence that surpassed the findings of other studies.8,43 Until recently, fusion transcripts have been largely investigated in cancer-related studies because of their oncogenic properities.80,81 Yet, their presence in normal cells has only recently been acknowledged.8,43,82 Two recent studies using the SIS method8,43 reported a mere 136 fusion transcripts (0.41% of total transcripts) in human brains. In contrast, our study identified 2,265 fusion transcripts in human brains, constituting 1.7% of total transcripts. Interestingly, these fusion transcripts were found to be particularly more enriched in the human ASD-associated transcriptome.
The enhanced SHANK3 transcript structure from CIS has significantly increased the detection rate of PTVs or predicted loss-of-function (LOF) variants in ES and WGS data for neuropsychiatric disorders. Further functional validations are warranted to determine the pathogenicity of these new identified PTVs. Our findings highlight the significance of employing fully characterized transcript structures in genomics studies of disease gene discovery. Transcriptional dysregulation in the brain has been implicated in neuropsychiatric disorders.5,83 By integrating the SHANK3 transcriptome data from CIS and the transcriptome data from PsychENCODE, we discovered brain-region-specific dysregulation in the SHANK3 transcriptome associated with ASD and other neuropsychiatric disorders. Notably, brain-region-specific DNA methylation in intragenic CpG islands, which show altered methylation in ASD brains,52,84,85 suggests that epigenetic changes could be instrumental in SHANK3 transcript variations. Our findings add the SHANK family to the gene families such as CACNA1C and NEUREXIN that are examples of extreme transcriptional diversity.86–88
In Shank3-mutant mice, stable transcripts with exonic deletions indicated truncated protein production or upregulated non-mutant isoforms.31,89 Cryptic promoters, especially within intron 16/exon 17, suggest alternative initiation and potential novel protein isoforms. These could perturb the PSD protein interactome, indicating possible loss and gain of function in Shank3 mutants. Such complexities question the molecular and phenotypic consistency of Shank3 mouse models.17–19,31,90,91 For example, differential behavioral phenotypes and receptor subunit alterations are noted across different mutant lines.20,31,35 Specifically, Shank3Δe21 mutants show unique upregulation of alternative transcripts and fusion transcripts, diverging behaviorally from Shank3Δe4−22 mutants.31,92 These molecular nuances challenge the translational fidelity of Shank3 mouse models for preclinical studies and necessitate reevaluation, particularly for models in therapeutic development.
Our study’s detailed alignment of SHANK3/Shank3 transcripts underscores its proteomic diversity at the PSD, essential for complex synaptic functions.49,50,93 However, about 15% of the transcripts, possibly arising from cryptic promoters or alternative splicing, lack substantial ORFs or are poorly expressed, hinting at stochastic transcription events previously noted in other species.94–103 Challenges to the ENCODE projects’ findings on genome transcription by subsequent short-read RNA-seq studies12–14,16,104–106 align with our discovery that SHANK3/Shank3 and TP53 transcription involves intragenic promoters and frequent intron retention. These regions, less conserved evolutionarily, affirm pervasive transcription and suggest a more deterministic transcriptional landscape for these genes in humans and mice.
Limitations of the study
Several limitations of the study warrant discussion. We will not be able quantify the extent of stochasticity of transcription from the current analysis. The extensive functional validation of transcripts at the protein level remains a challenge, as some transcripts may function uniquely at the RNA level, eluding protein-interaction analyses. Also, our capture-based method trades sensitivity for efficiency when scaling up, as increased gene targets reduce sequence depth, necessitating careful experimental design for quality data.
STAR★METHODS
RESOURCE AVAILABILITY
Lead contact
Further information and requests for resources and reagents should be directed to and will be fulfilled by the lead contact, Yong-Hui Jiang (yong-hui.jiang@yale.edu).
Materials availability
Oligonucleotide probe panels were synthesized by Integrated DNA Technologies (IDT). The probe coverage and design are provided in Tables S1 and S2.
Data and code availability
Both human and mouse raw sequencing data have been deposited at SRA under BioProject: PRJNA1066952 and are publicly available. Accession numbers are listed in the key resources table. All UCSC tracks described in manuscript, and raw Tandem Mass Spectrometry data have been deposited at Mendeley and are publicly available. The DOI is listed in the key resources table.
This paper does not report original code.
Any additional information required to reanalyze the data reported in this paper is available from the lead contact upon request.
KEY RESOURCES TABLE.
| REAGENT or RESOURCE | SOURCE | IDENTIFIER |
|---|---|---|
|
| ||
| Antibodies | ||
|
| ||
| Acrosin Polyclonal Antibody (C-terminus) | Invitrogen | Cat #: PA5–114207; RRID: AB_2884721 |
| Acrosin Polyclonal Antibody (N-terminus) | Invitrogen | Cat #: PA5–99580; RRID: AB_2818513 |
|
| ||
| Biological samples | ||
|
| ||
| Human Brain Tissue | Mayo Clinic, Jacksonville, FL, 32224 USA | Adults, n = 4 |
| Human Brain Tissue | Children’s Hospital of Fudan University, Shanghai, 201102 China | Children, n = 4 |
|
| ||
| Critical commercial assays | ||
|
| ||
| NucleoZOL™ | Takara Bio | Cat #:740404.200 |
| NucleoSpin® RNA set for NucleoZOL™ | Takara Bio | Cat #: 740406.50 |
| rDNase Set | Takara Bio | Cat #: 740963 |
| NucleoSpin® RNA Clean-up XS | Takara Bio | Cat #: 740903.50 |
| RNA to cDNA EcoDry™ Premix kit | Takara Bio | Cat #: 639548 |
| KAPA SYBR® FAST qPCR Master Mix (2X) Universal | Kapa Biosystems | Cat #: KK4602 |
| xGen® Lockdown® Probes | Integrated DNA Technologies | customized |
| Iso-Seq Express Oligo Kit | PACBIO | PN 101–737–500 |
| SMRTbell Express Template Prep Kit 2.0 | PACBIO | PN 100–938–900 |
| Elution Buffer | PACBIO | PN 101–633–500 |
| NEBNext® Single Cell/Low Input cDNA Synthesis & Amplification Module | NEB | Cat#: E6421S |
| NEBNext® High-Fidelity 2X PCR Master Mix | NEB | Cat#: M0541S |
| ProNex® Beads | Promega | Cat #: NG2001 |
| Qubit® dsDNA HS Assay Kit | Invitrogen | Cat #: Q32851 |
| NucleoSpin® RNA/Protein Kit | Takara Bio | Cat #: 740933.50 |
| Protein Quantification Assay | Takara Bio | Cat #: 740967.250 |
| 4x Laemmli buffer | Bio-Rad | Cat#: 1610747 |
| 4–20% Mini-PROTEAN® TGX Stain-Free™ Protein Gels | Bio-Rad | Cat #: 4568094 |
|
| ||
| Deposited data | ||
|
| ||
| Iso-Seq/RNA-Seq | This study | BioProject: PRJNA1066952 |
| UCSC tracks | This study | https://doi.org/10.17632/n5vjjmwb9p.1 |
| Tandem Mass Spectrometry | This study | https://doi.org/10.17632/n5vjjmwb9p.1 |
| UCLA-ASD RNA-Seq | PsychENCODE | syn4921369 |
| BrainVar RNA-Seq | PsychENCODE | syn21557948 |
| BrainGVEX RNA-Seq | PsychENCODE | syn4590909 |
| CMC RNA-Seq | PsychENCODE | syn22344687 |
| LIDB RNA-Seq | PsychENCODE | syn12299750 |
| CommonMind RNA-Seq | PsychENCODE | syn2759792 |
| SMART scRNA-seq | Yao et al.40 | https://assets.nemoarchive.org/dat-jb2f34y |
| ASC VCF | Autism Sequencing Consortium | https://asc.broadinstitute.org/downloads |
| BipEx VCF | Bipolar Exomes | https://bipex.broadinstitute.org/downloads |
| Epi25 VCF | whole-exome sequencing case- control study of epilepsy | https://epi25.broadinstitute.org/downloads |
| SCHEMA VCF | Schizophrenia exome meta-analysis consortium | https://schema.broadinstitute.org/downloads |
| Mouse brain Visium | 10x Genomics | FFPE Mouse Brain Coronal Section 1 |
|
| ||
| Experimental models: Organisms/strains | ||
|
| ||
| C57BL/6J | Jackson Laboratory | Strain #:000664 |
| Shank3Δe21 | Jackson Laboratory | Shank3tm1.1Pfw/J, Strain #:018398 |
| Shank3Δe4–9 | Jiang Lab | Wang et al.35 |
| Shank3Δe4–22 | Jiang Lab | Wang et al.20 |
|
| ||
| Software and algorithms | ||
|
| ||
| Lima v2.5.0 | PACBIO | https://lima.how/ |
| IsoSeq v3 | PACBIO | https://github.com/PacificBiosciences/IsoSeq |
| pbmm2 | PACBIO | https://github.com/PacificBiosciences/pbmm2 |
| SQANTI3 v4.3 | Pardo-Palacios et al.107 | https://github.com/ConesaLab/SQANTI3 |
| fastp | Chen et al.108 | https://github.com/OpenGene/fastp |
| HISAT 2.2.1 | Kim et al.109 | https://daehwankimlab.github.io/hisat2/download/ |
| SAMtools | Danecek et al.110 | https://www.htslib.org/ |
| FeatureCount | Liao et al.111 | https://rnnh.github.io/bioinfo-notebook/docs/featureCounts.html |
| Salmon 1.4.0 | Patro et al.112 | https://github.com/COMBINE-lab/salmon/releases |
| DEXSeq | Anders et al.113 | https://bioconductor.org/packages/release/bioc/html/DEXSeq.html |
| BCFtools v 1.16 | Danecek et al.110 | https://bioconda.github.io/recipes/bcftools/README.html |
| HTSlib v 1.16 | Bonfield et al.114 | https://www.htslib.org/download/ |
| Tabix v 0.2.5 | Li et al.115 | https://github.com/samtools/tabix |
| VEP, release 107 | McLaren et al.74 | https://github.com/Ensembl/ensembl-vep |
| gnomAD, v3.1.2 | Koch et al.75 | https://gnomad.broadinstitute.org/news/2021-10-gnomad-v3-1-2-minor-release/ |
| SpliceAI | Jaganathan et al.76 | https://github.com/Illumina/SpliceAI |
| SnpEff | Cingolani et al.77 | https://pcingola.github.io/SnpEff/ |
| Cell Ranger | 10x Genomics | https://www.10xgenomics.com/support/software/cell-ranger/latest |
| Space Ranger v2.0 | 10x Genomics | https://www.10xgenomics.com/support/software/space-ranger/latest |
| Genomics Loupe Visualization Software v6.5 | 10x Genomics | https://www.10xgenomics.com/support/software/loupe-browser/latest |
EXPERIMENTAL MODEL AND STUDY PARTICIPANT DETAILS
Human brain tissues
Adult human cortex tissues (n=4, 24–33 years old; frontal cortex, n=2; temporal cortex, n=2) were obtained from Mayo Clinic Florida Biospecimen Bank and processed at Yale University School of Medicine. Children cortex tissues (n=4, 5–12 years old; temporal cortex, n=3; amygdala, n=1) were obtained and processed from the Children’s Hospital of Fudan University in Shanghai, followed the same RNA extraction, library preparation and sequencing protocols as Yale site. The IRB protocols were approved both at Mayo Clinic Florida and the Children’s Hospital of Fudan University in Shanghai.
Mice
Wild type C57BL/6J mice were obtained from the Jackson Laboratory. Shank3 mutant mice of Shank3 exons 4–9 deletion (Shank3Δe4−9)35 and Shank3 exons 4–22 (Shank3Δe4−22)20 were generated and maintained in Jiang’s lab. Shank3 exon 21 deletion (Shank3Δe21) was obtained from Jackson Laboratory (Shank3tm1.1Pfw/J and Strain #:018398).116 Mice were housed of 4–5 per cage in pathogen-free mouse facility with free access to food and water on a 12-hour light: dark cycle at the ambient temperature of 20–22°C and humidity of 30–70%. An equal number of male and female mice were used for all experiments. All procedures were performed following the approved animal protocol by Yale University School of Medicine Animal Care and Use Committee.
METHOD DETAILS
RNA isolation and quality control
Mouse brain tissues were snap-frozen in liquid nitrogen immediately after dissection. Human brain tissues were snap-frozen in liquid nitrogen within an hour after dissection. All tissues were stored in liquid nitrogen thereafter. Total RNA was isolated from 20 mg frozen tissues, using NucleoZOL™ (Takara Bio, 740404.200) and NucleoSpin® RNA set for NucleoZOL™ (Takara Bio, 740406.50) following the manufactures specifications, followed by rDNase Set (Takara Bio, 740963) to digest DNA, and NucleoSpin® RNA Clean-up XS (Takara Bio, 740903) for RNA repurification. RNA purity (260/280, 260/230) and concentration were measured on NanoDrop™ 2000/2000c Spectrophotometers. RNA integrity number (RIN) was assessed using Agilent 2100 Bioanalyzer system.
Generation of standard and captured Iso-seq libraries
The Iso-seq libraries were prepared by following the manufacturer’s instructions for each step (Iso-Seq™ Express Template Preparation for Sequel® and Sequel II Systems for standard Iso-seq; Customer Collaboration – Iso-Seq® Express Capture Using IDT xGen® Lockdown® Probes for capture Iso-seq). The 600 ng of total RNA was used as input. Only the RNA with RIN higher than 7 of human samples, and 8 of mouse samples were processed for reverse transcription, amplification, enrichment, and library preparations.
Hybridization capture panel design
Hybridization capture panel design was assisted by IDT (Integrated DAN Technologies). Briefly, after extracted as 120-base-length sequence of interested gene, xGen Lockdown probes were aligned to the genome and calculated the number of possible enrichment sites. A “perfect” probe was considered as only has 1 hit (the target of interest) with genome, but most of the sequences returned more than 1 hit. Following IDT proprietary xGen Off-Target QC Method, any probes with more than 50 hits were removed because of non-specific targets in genome. The specifics and details of each probe panel are presented in Table S3.
Hybridization protocol
300 ng of total RNA in less than 5.4 μL of volume mixed with 2 μL of NEBNext Single Cell RT Primer Mix. The final volume was brought up to 9 μL with nuclease-free water. The reaction was placed in a thermocycler and run for 5 minutes at 70°C, followed by holding at 4°C for primer annealing and first-strand synthesis. Reverse transcription template switching reaction was then performed by adding 5 μL of NEBNext Single Cell RT Buffer, 3 μL of nuclease-free water, and 2 μL of NEBNext Single cell RT Enzyme Mix to the first-strand cDNA. The reaction was incubated in a thermocycler at 42°C with the lid at 52°C for 75 minutes, followed by holding at 4°C. After adding 1 μL of Iso-Seq Express Template Switching oligo to the 19 μL reaction for a final volume of 20 μL, the reaction was incubated again in a thermocycler at 42°C with the lid at 52°C for 15 minutes, followed by holding at 4°C.
The Reverse Transcription and Template Switching reaction product was then purified using ProNex Beads before proceeding with cDNA amplification. For amplification, 50 μL of NEBNext Single Cell cDNA PCR master Mix, 2 μL of NEBNext Single Cell cDNA PCR Primer, 2 μL of Iso-Seq Express cDNA PCR primer, and 0.5 μL of NEBNext Cell Lysis Buffer were added to the purified product. The reaction was incubated in a thermocycler and run for 45 seconds at 98°C, followed by 14 cycles of the following steps: 10 seconds at 98°C, 15 seconds at 62°C, and 3 minutes at 72°C. The reaction was then held for 5 minutes at 72°C, followed by holding at 4°C. Finally, the product was purified again using ProNex Beads before proceeding with either the library preparation for standard Iso-Seq (SIS) or the capture steps for capture-based Iso-Seq (CIS).
As for the capture steps, first concentrate a total of 500ng cDNA in a 1.5 mL LoBind tube along with 7.5 μL of Cot DNA. To this mixture, add 1.8X volume of ProNex beads and gently pipette mix 10 times, followed by incubation for 10 min at room temperature. Place the tube on a magnet stand and wait until supernatant is clear. Remove the supernatant and wash twice with 200μL of freshly prepared 80% ethanol while on the magnet stand. Spin the tube strip briefly after removing the second wash, return to magnetic stand, and remove residual ethanol. Next, immediately add the hybridization reaction mix (which comprises 2X Hybridization Buffer, Hybridization Buffer Enhancer, xGen Asym TSO block, xGen RT-primer-barcode block, and 1X xGen Lockdown Panel) to elute the cDNA. Gently pipette mix 10 times and incubate for 5 min at room temperature. Then, place the tube on the magnetic stand to separate the beads from the supernatant. Transfer 17 μL of the supernatant to a new 0.2 mL PCR tube and briefly centrifuge it. Ensure that the tube is tightly sealed to prevent evaporation. Finally, place the sample tube in the thermal cycler and start the hybridization program: HYB program (lid set at 100°C), 95°C for 30 sec, 65°C for 4 hr, and lastly hold at 65°C.
During the incubation, prepare 1X working buffers and beads for capture. Preheat the wash buffers to +65°C in a heat block or water bath. To prepare the capture beads, allow the Dynabeads M-270 Streptavidin to warm to room temperature for 30 minutes prior to use. Thoroughly vortex the beads for 15 seconds to mix them, then aliquot 50 μL of beads into a 0.2 mL PCR tube, followed by adding 100 μL of 1X Bead Wash Buffer per capture, and pipette the mixture 10 times. Place the PCR tube on a magnetic rack. When the supernatant is clear, carefully remove and discard it without disturbing the beads. Note: Allow the Dynabeads to settle for at least 1 minute before removing the supernatant. Thereafter, two washes are performed as follows: Add 100 μL of 1X Bead Wash Buffer, pipette 10 times to mix, then place the PCR tube on a magnetic rack, allowing the beads to fully separate from the supernatant. Carefully remove and discard the clear supernatant. Repeat this process for a total of two washes. Finally, resuspend the beads in 17 μL of Bead Resuspension Mix per capture. The Bead Resuspension Mix includes xGen 2X Hybridization Buffer (8.5 μL), xGen Hybridization Buffer Enhancer (2.7 μL), and Nuclease-Free Water (5.8 μL). By following these steps carefully, you can ensure that the buffers and beads are prepared correctly for the capture step and obtain reliable results.
Then Bind cDNA to the capture beads, by incubating the samples in a thermocycler set to +65C for 45 minutes. Then Wash the captured cDNA with 1X wash buffers and elute the cDNA with 46ul elution buffer. To amplify the captured DNA sample, NEBNext High-Fidelity 2X PCR Master Mix is recommended, and the NEBNext Single Cell cDNA PCR Master Mix is alternative for post capture amplification. Assemble the following PCR reaction: 50 μL of NEBNext High-Fidelity 2X PCR Master Mix, 2 μL of NEBNext Single Cell cDNA PCR Primer, 2 μL of Iso-Seq Express cDNA PCR Primer, 0.5 μL of NEBNext Cell Lysis Buffer, and 45.5 μL of the captured library. Amplify the PCR reaction mix using the following PCR protocol: Denature the DNA at 98°C for 45 seconds. Perform 14 cycles of the following steps: a. Denature the DNA at 98°C for 10 seconds. b. Anneal the primers at 62°C for 15 seconds. c. Extend the DNA at 72°C for 3 minutes. Final extension at 72°C for 5 minutes, and hold at 4°C. Finally perform the post amplification clean up steps with ProNex brands and ethanol. Use 1 μL of sample to quantifiy with Qubit dsDNA HS kit and dilute 1 μL of sample to 1.5ng/μL and run 1 μL on an Agilent Bioanalyzer using the High Sensitivity DNA kit. We used 500ng cDNA for library construction as Sequel II sequence platform required. After DNA damage repair, end repair/A-Tailing, overhang adapter ligation, and purification with ProNex Beads, the cDNA library is ready for sequencing
Sequencing platform
To load the cDNA library onto the PacBio Sequel II System, the diffusion method was applied and followed by a 24-hour movie time and a 2-hour pre-extension time. The samples were cleaned up using ProNex beads and loaded onto the plate at a concentration of 50–100 pM.
Real-time quantitative polymerase chain reaction (RT-qPCR)
Two μg of total RNA was reverse transcribed into cDNA templates using RNA to cDNA EcoDry™ Premix kit including both random hexamer and oligo(dT)18 primers (Takara Bio, 639548). KAPA SYBR® FAST qPCR Master Mix (2X) Universal (Kapa Biosystems, KK4602) was used for qPCR reactions with 18 ng of cDNA as template input. The following program on CFX96 Touch Real-Time PCR Detection System (BIO-RAD) was used: 3 minutes at 95°C for enzyme activation, followed by 40 cycles of denaturation (95°C, 3 seconds) and annealing, extension, data acquisition (60°C, 30 seconds), followed by dissociation and holding at 4°C. The PCR primers are shown in Table S3.
Western Blot
Whole cell lysates were extracted from mouse brain tissue using the NucleoSpin® RNA/Protein Kit (Takara Bio, 740933.50). Protein concentrations were quantified using the Protein Quantification Assay (Takara Bio, 740967.250). The samples were then mixed with 4x Laemmli buffer (Bio-Rad, 1610747) and heated at 98 °C for 5 minutes to denature the proteins. Subsequently, proteins were loaded onto 4–20% Mini-PROTEAN® TGX Stain-Free™ Protein Gels (Bio-Rad, 4568094) for electrophoresis. For immunodetection, the gels were incubated with antibodies targeting the C-terminus (Invitrogen, PA5–114207, 1:500) and N-terminus (Invitrogen, PA5–99580, 1:500) of ACR overnight at 4°C.
QUANTIFICATION AND STATISTICAL ANALYSIS
Sequence data filtering algorithm
The following pipeline was diagramed in Figure S12. Sequencing reads were screened initially with Lima (v2.5.0) and IsoSeq (v3). A transcript with both cDNA primers and the poly(A) was identified and called Full-length reads.117 The Full-length reads which had less than 100 base pairs 5’ end overhang, less than 30 bases pairs 3’ end overhang, and less than 10 base pairs gaps in the middle are considered as the same transcript. Clustering using hierarchical alignment, and iterative cluster merging, generate polished sequence, with quality scores. The output further filtered with SQANTI3 (v4.3)107 after cluster and collapse to generate unique transcripts. SQANTI3 filtered the transcripts as below: If a transcript is Full-Splice Match (FSM), then it was retained unless the 3’ end was unreliable (intrapriming). If a transcript was not Full-Splice Match, then it was retained only if all below were met: (1) 3’ end is reliable. (2) did not have a junction that was labeled as RT-Switching. (3) all intro-exon junctions were canonical.117 Further criteria included a transcript had to include at least 2 exons, and in the sense orientation and predicted open reading frame (ORF) had longer than 100 amino acids for the given transcript.
Iso-seq data analysis pipeline
The flow chart (Figure S12) described the analytic pipeline for ISO-Seq sequence dat. The subreads.bam file of an Iso-Seq SMRT cell was a raw input. The number of the SMRT cells, instead of the number of multiplex samples sequenced on a SMRT cell, regardless of the library preparation methods [Sta-Iso-Seq (SIS) or Cap-Iso-Seq (CIS)], dictated the direction of the analysis flow.
Transcript confidence score
To assess the quality of individual transcript, transcripts after filtering steps were scored by the following scoring metrics: (1) Score of 3 point: If the exons of transcript were presented in the sequences of by either Illumina short read methods of the bulk RNAseq (human dataset: UCLA-ASD, BrainGVEX, CMC, CommonMind and LIDB) and SMART scRNAseq. (2) Score of 2 points: If a transcript had predicted ORF longer than 100AA. (3) If the abundance of a transcript were higher than 20 percentage of the rank of the abundance of all transcripts. The summation of scores was confidence score to define each transcript: high confidence (≥ 4 points), moderate confidence (2–3 points), and low confidence (0–1 point).
RNA-seq data processing
Illumina bulk RNA-Seq raw data in FASTQ format after quality control and filtering with fastp,108 and SMART scRNAseq FASTQ data, were aligned to hg38 for human sequences and mm39 for mouse sequences using HISAT 2.2.1.109 Aligned RNA-Seq data (aligned to hg37/38) in BAM format were converted to FASTQ format using SAMtools110 when the raw FASTQ was not available, followed by the same process as above. Gene expression counts and DEXSeq-counts were calculated using FeatureCount111 for further gene expression and exon usage analysis. Detailed RNAseq datasets information summarized in Table S4.
Differential transcript usage
Transcript-level quantification of the processed RNA-Seq data was performed using the software Salmon 1.4.0.112 The transcriptome index used for quantification was built from the reference genome annotation (in GTF format), along with the reference genome FASTA file. Transcript abundances were estimated using the quasi-mapping algorithm (–quasiMAP) mode, which performs a light-weight alignment-free estimation of abundances based on k-mer matching. The output files were generated in TPM (transcripts per million) format.
Differential exon usage (DEU)
DEXSeq-counts tables were imported into R, analysis with R package DEXSeq.113 Normalization and filtering were performed to remove lowly expressed exons. DexSeq uses a binomial generalized linear model to estimate exon expression, accounting for the variability in exon-exon junction usage across samples. DEU was then tested using the DEXSeq function, which fits a statistical model to test for differences in exon usage between two or more groups of samples. Exons with an adjusted p-value ≤ 0.05 and a log2 fold change ≥ 1 or ≤ −1 were considered significantly differentially used and visualized with built-in function of DEXSeq.
Whole genome sequencing and exome analysis
DNA variation data post variation calling in VCF format were downloaded from Autism Sequencing Consortium (ASC), Bipolar Exomes (BipEx), whole-exome sequencing case-control study of epilepsy (Epi25), Schizophrenia exome meta-analysis consortium (SCHEMA), and PsychENCODE. VCFs initially aligned to hg38 (BipEx and Epi25) and the datasets (ASC, SCHEMA and PsychENCODE) after alignment lift over from hg37 to hg38 with UCSC LiftOver tool and chain file, were subsetted to the region of interest (SHANK3, chr22:50670000–50770000) using BCFtools (v 1.16).110 The data format was modified using HTSlib (v 1.16)114 and TAB-delimited file InderXer (Tabix, v 0.2.5).115 Then the data were annotated with Ensembl Variant Effect Predictor (VEP, release 107)74 and filtered with Genome Aggregation Database (gnomAD, v3.1.2)75 by INFO/AF_popmax<=0.01. Filtered DNA variation were aligned to novel exons detected in SIS and CIS with SpliceAI76 for splicing event analysis, and with SnpEff 77 to evaluate other deleterious SNV (stop lost, stop gain and frameshift).
Spatial transcriptional analysis
An open access Visium dataset of mouse brain coronal section from 10x Genomics63 in FASTQ format was analyzed using customized references and annotation generated from mouse Shank3 CIS transcripts using Cell Ranger,118 followed by quantitation with customized probe-set (probe-transcripts relation spreadsheet) using 10x Genomics Space Ranger v2.0. The output cloupe file was visualized using 10x Genomics Loupe Visualization Software v6.5.
Data visualization
Visualization was performed using ggplot2 (version 3.3.2) in R (version 4.2.2) for plotting gene expression, transcript and exon usage profiles and heatmaps.
Tandem mass spectrometry
Trypsin digests were subjected to liquid chromatography-tandem mass spectrometry (LC-MS/MS) analysis using the ThermoFisher Scientific LTQ-Orbitrap XL mass spectrometer. Raw mass spectrometry data were processed using MaxQuant v2.5.2.0. Standard label-free quantification parameters were applied as group-specific parameters. Additionally, a pooled Mouse Proteome dataset sourced from UniProt and predicted Shank3 open reading frames (ORFs) from CIS were included as global parameters. Identified protein IDs were subsequently reported as results.
Supplementary Material
Highlights.
Revealed the transcriptional complexity of SHANK family genes in human and mouse brains
Improved detection rate for potential deleterious variants of neuropsychiatric disorders
Evidence for the debate over transcriptional determinism and stochasticity
ACKNOWLEDGMENTS
We are thankful for the valuable discussion and assistance of Antonio Giraldez, Hongyu Zhao, Gang Peng, and Antonio Jorge Forte. We thank Emily Qian and Rao Nivedita for editorial assistance. Y.-h.J. is supported by NIH grants MH104316, MH117289, HD087795, HD088007, MH098114, and HD088626. The project is supported by Taysha GTx, but Taysha GTx had no role in project design or execution. X.L. is a postdoctoral fellow of the Foundation for Angelman Syndrome Therapeutics (FAST). Y.W. and Y.M. are supported by Shanghai Municipal Science and Technology Major Project (2017SHZDZX01). We also thank the Yale Center for Genome Analysis and Keck Microarray Shared Resource at Yale University for providing the necessary PacBio sequencing services, which are funded in part by a National Institutes of Health instrument grant (1S10OD028669–01). The usage of YCGA’s sequencing/HPC resources is supported by an HPC grant (1S10OD030363–01A1). A.Q.-H. acknowledges support from Richard and Lauralee Uihlein, the William J. and Charles H. Mayo Professorship, the Mayo Clinic Clinician Investigator Award, the Florida Department of Health Cancer Research Chair Fund, the Monica Flynn Jacoby Endowed Chair, the BPJK Cleveland Family Foundation Neurosurgery Biobank and Registry Fund, and the Jacquie Lorraine Goldman Fund for a Brain Tissue Bank.
Footnotes
DECLARATION OF INTERESTS
Y.-h.J. is a scientific co-founder of Couragene, Inc., but this study is unrelated to his role. The project was supported initially by a sponsored research project by Taysha Gene Therapies. Taysha Gene Therapies did not have any direct role in the conceptualization, design, data collection, analysis, decision to publish, or preparation of the manuscript.
SUPPLEMENTAL INFORMATION
Supplemental information can be found online at https://doi.org/10.1016/j.celrep.2024.114376.
REFERENCES
- 1.Park E, Pan Z, Zhang Z, Lin L, and Xing Y (2018). The Expanding Landscape of Alternative Splicing Variation in Human Populations. Am. J. Hum. Genet. 102, 11–26. 10.1016/j.ajhg.2017.11.002. [DOI] [PMC free article] [PubMed] [Google Scholar]
- 2.Blencowe BJ (2017). The Relationship between Alternative Splicing and Proteomic Complexity. Trends Biochem. Sci. 42, 407–408. 10.1016/j.tibs.2017.04.001. [DOI] [PubMed] [Google Scholar]
- 3.Raj B, and Blencowe BJ (2015). Alternative Splicing in the Mammalian Nervous System: Recent Insights into Mechanisms and Functional Roles. Neuron 87, 14–27. 10.1016/j.neuron.2015.05.004. [DOI] [PubMed] [Google Scholar]
- 4.Ray TA, Cochran K, Kozlowski C, Wang J, Alexander G, Cady MA, Spencer WJ, Ruzycki PA, Clark BS, Laeremans A, et al. (2020). Comprehensive identification of mRNA isoforms reveals the diversity of neural cell-surface molecules with roles in retinal development and disease. Nat. Commun. 11, 3328. 10.1038/s41467-020-17009-7. [DOI] [PMC free article] [PubMed] [Google Scholar]
- 5.Gandal MJ, Zhang P, Hadjimichael E, Walker RL, Chen C, Liu S, Won H, van Bakel H, Varghese M, Wang Y, et al. (2018). Transcriptome-wide isoform-level dysregulation in ASD, schizophrenia, and bipolar disorder. Science 362, eaat8127. 10.1126/science.aat8127. [DOI] [PMC free article] [PubMed] [Google Scholar]
- 6.Patowary A, Zhang P, Jops C, Vuong CK, Ge X, Hou K, Kim M, Gong N, Margolis M, Vo D, et al. (2023). Developmental isoform diversity in the human neocortex informs neuropsychiatric risk mechanisms. Preprint at bioRxiv. 10.1101/2023.03.25.534016. [DOI] [PubMed] [Google Scholar]
- 7.Ollà I, Pardiñas AF, Parras A, Hernández IH, Santos-Galindo M, Picó S, Callado LF, Elorza A, Rodríguez-López C, Fernández-Miranda G, et al. (2023). Pathogenic mis-splicing of CPEB4 in schizophrenia. Biol. Psychiatr. 94, 341–351. 10.1016/j.biopsych.2023.03.010. [DOI] [PubMed] [Google Scholar]
- 8.Glinos DA, Garborcauskas G, Hoffman P, Ehsan N, Jiang L, Gokden A, Dai X, Aguet F, Brown KL, Garimella K, et al. (2022). Transcriptome variation in human tissues revealed by long-read sequencing. Nature 608, 353–359. 10.1038/s41586-022-05035-y. [DOI] [PMC free article] [PubMed] [Google Scholar]
- 9.Yang Y, Yang R, Kang B, Qian S, He X, and Zhang X (2023). Single-cell long-read sequencing in human cerebral organoids uncovers cell-type-specific and autism-associated exons. Cell Rep. 42, 113335. 10.1016/j.celrep.2023.113335. [DOI] [PMC free article] [PubMed] [Google Scholar]
- 10.Wang Z, Gerstein M, and Snyder M (2009). RNA-Seq: a revolutionary tool for transcriptomics. Nat. Rev. Genet. 10, 57–63. 10.1038/nrg2484. [DOI] [PMC free article] [PubMed] [Google Scholar]
- 11.Mercer TR, Clark MB, Crawford J, Brunck ME, Gerhardt DJ, Taft RJ, Nielsen LK, Dinger ME, and Mattick JS (2014). Targeted sequencing for gene discovery and quantification using RNA Capture-Seq. Nat. Protoc. 9, 989–1009. 10.1038/nprot.2014.058. [DOI] [PubMed] [Google Scholar]
- 12.Clark MB, Amaral PP, Schlesinger FJ, Dinger ME, Taft RJ, Rinn JL, Ponting CP, Stadler PF, Morris KV, Morillon A, et al. (2011). The reality of pervasive transcription. PLoS Biol. 9, e1000625–e1001102. 10.1371/journal.pbio.1000625. [DOI] [PMC free article] [PubMed] [Google Scholar]
- 13.ENCODE Project Consortium; Birney E, Stamatoyannopoulos JA, Guigó R, Guigó R, Gingeras TR, Margulies EH, Weng Z, Snyder M, Dermitzakis ET, et al. (2007). Identification and analysis of functional elements in 1% of the human genome by the ENCODE pilot project. Nature 447, 799–816. 10.1038/nature05874. [DOI] [PMC free article] [PubMed] [Google Scholar]
- 14.van Bakel H, Nislow C, Blencowe BJ, and Hughes TR (2010). Most “dark matter” transcripts are associated with known genes. PLoS Biol. 8, e1000371. 10.1371/journal.pbio.1000371. [DOI] [PMC free article] [PubMed] [Google Scholar]
- 15.Villa T, and Porrua O (2023). Pervasive transcription: a controlled risk. FEBS J. 290, 3723–3736. 10.1111/febs.16530. [DOI] [PubMed] [Google Scholar]
- 16.Djebali S, Davis CA, Merkel A, Dobin A, Lassmann T, Mortazavi A, Tanzer A, Lagarde J, Lin W, Schlesinger F, et al. (2012). Landscape of transcription in human cells. Nature 489, 101–108. 10.1038/nature11233. [DOI] [PMC free article] [PubMed] [Google Scholar]
- 17.Schmeisser MJ, Ey E, Wegener S, Bockmann J, Stempel AV, Kuebler A, Janssen AL, Udvardi PT, Shiban E, Spilker C, et al. (2012). Autistic-like behaviours and hyperactivity in mice lacking ProSAP1/Shank2. Nature 486, 256–260. 10.1038/nature11015. [DOI] [PubMed] [Google Scholar]
- 18.Peça J, Feliciano C, Ting JT, Wang W, Wells MF, Venkatraman TN, Lascola CD, Fu Z, and Feng G (2011). Shank3 mutant mice display autistic-like behaviours and striatal dysfunction. Nature 472, 437–442. 10.1038/nature09965. [DOI] [PMC free article] [PubMed] [Google Scholar]
- 19.Jiang YH, and Ehlers MD (2013). Modeling autism by SHANK gene mutations in mice. Neuron 78, 8–27. 10.1016/j.neuron.2013.03.016. [DOI] [PMC free article] [PubMed] [Google Scholar]
- 20.Wang X, Bey AL, Katz BM, Badea A, Kim N, David LK, Duffney LJ, Kumar S, Mague SD, Hulbert SW, et al. (2016). Altered mGluR5-Homer scaffolds and corticostriatal connectivity in a Shank3 complete knockout model of autism. Nat. Commun. 7, 11459. 10.1038/ncomms11459. [DOI] [PMC free article] [PubMed] [Google Scholar]
- 21.Speed HE, Kouser M, Xuan Z, Reimers JM, Ochoa CF, Gupta N, Liu S, and Powell CM (2015). Autism-Associated Insertion Mutation (InsG) of Shank3 Exon 21 Causes Impaired Synaptic Transmission and Behavioral Deficits. J. Neurosci. 35, 9648–9665. 10.1523/jneurosci.3125-14.2015. [DOI] [PMC free article] [PubMed] [Google Scholar]
- 22.Jaramillo TC, Speed HE, Xuan Z, Reimers JM, Escamilla CO, Weaver TP, Liu S, Filonova I, and Powell CM (2017). Novel Shank3 mutant exhibits behaviors with face validity for autism and altered striatal and hippocampal function. Autism Res. 10, 42–65. 10.1002/aur.1664. [DOI] [PMC free article] [PubMed] [Google Scholar]
- 23.Duffney LJ, Zhong P, Wei J, Matas E, Cheng J, Qin L, Ma K, Dietz DM, Kajiwara Y, Buxbaum JD, and Yan Z (2015). Autism-like Deficits in Shank3-Deficient Mice Are Rescued by Targeting Actin Regulators. Cell Rep. 11, 1400–1413. 10.1016/j.celrep.2015.04.064. [DOI] [PMC free article] [PubMed] [Google Scholar]
- 24.Zhou Y, Kaiser T, Monteiro P, Zhang X, Van der Goes MS, Wang D, Barak B, Zeng M, Li C, Lu C, et al. (2016). Mice with Shank3 Mutations Associated with ASD and Schizophrenia Display Both Shared and Distinct Defects. Neuron 89, 147–162. 10.1016/j.neuron.2015.11.023. [DOI] [PMC free article] [PubMed] [Google Scholar]
- 25.Lee J, Chung C, Ha S, Lee D, Kim DY, Kim H, and Kim E (2015). Shank3-mutant mice lacking exon 9 show altered excitation/inhibition balance, enhanced rearing, and spatial memory deficit. Front. Cell. Neurosci. 9, 94. 10.3389/fncel.2015.00094. [DOI] [PMC free article] [PubMed] [Google Scholar]
- 26.Wang X, Xu Q, Bey AL, Lee Y, and Jiang YH (2014). Transcriptional and functional complexity of Shank3 provides a molecular framework to understand the phenotypic heterogeneity of SHANK3 causing autism and Shank3 mutant mice. Mol. Autism. 5, 30. 10.1186/2040-2392-5-30. [DOI] [PMC free article] [PubMed] [Google Scholar]
- 27.Bouquier N, Sakkaki S, Raynaud F, Hemonnot-Girard AL, Seube V, Compan V, Bertaso F, Perroy J, and Moutin E (2022). The Shank3(Venus/Venus) knock in mouse enables isoform-specific functional studies of Shank3a. Front. Neurosci. 16, 1081010. 10.3389/fnins.2022.1081010. [DOI] [PMC free article] [PubMed] [Google Scholar]
- 28.Yoo T, Yoo YE, Kang H, and Kim E (2022). Age, brain region, and gene dosage-differential transcriptomic changes in Shank3-mutant mice. Front. Mol. Neurosci. 15, 1017512. 10.3389/fnmol.2022.1017512. [DOI] [PMC free article] [PubMed] [Google Scholar]
- 29.Yoo YE, Yoo T, Kang H, and Kim E (2022). Brain region and gene dosage-differential transcriptomic changes in Shank2-mutant mice. Front. Mol. Neurosci. 15, 977305. 10.3389/fnmol.2022.977305. [DOI] [PMC free article] [PubMed] [Google Scholar]
- 30.Lim S, Naisbitt S, Yoon J, Hwang JI, Suh PG, Sheng M, and Kim E (1999). Characterization of the Shank family of synaptic proteins. Multiple genes, alternative splicing, and differential expression in brain and development. J. Biol. Chem. 274, 29510–29518. 10.1074/jbc.274.41.29510. [DOI] [PubMed] [Google Scholar]
- 31.Delling JP, and Boeckers TM (2021). Comparison of SHANK3 deficiency in animal models: phenotypes, treatment strategies, and translational implications. J. Neurodev. Disord. 13, 55. 10.1186/s11689-021-09397-8. [DOI] [PMC free article] [PubMed] [Google Scholar]
- 32.Tian R, Li Y, Zhao H, Lyu W, Zhao J, Wang X, Lu H, Xu H, Ren W, Tan QQ, et al. (2023). Modeling SHANK3-associated autism spectrum disorder in Beagle dogs via CRISPR/Cas9 gene editing. Mol. Psychiatr. 28, 3739–3750. 10.1038/s41380-023-02276-9. [DOI] [PubMed] [Google Scholar]
- 33.Jaramillo TC, Speed HE, Xuan Z, Reimers JM, Liu S, and Powell CM (2016). Altered Striatal Synaptic Function and Abnormal Behaviour in Shank3 Exon4–9 Deletion Mouse Model of Autism. Autism Res. 9, 350–375. 10.1002/aur.1529. [DOI] [PMC free article] [PubMed] [Google Scholar]
- 34.Drapeau E, Dorr NP, Elder GA, and Buxbaum JD (2014). Absence of strong strain effects in behavioral analyses of Shank3-deficient mice. Dis. Model. Mech. 7, 667–681. 10.1242/dmm.013821. [DOI] [PMC free article] [PubMed] [Google Scholar]
- 35.Wang X, McCoy PA, Rodriguiz RM, Pan Y, Je HS, Roberts AC, Kim CJ, Berrios J, Colvin JS, Bousquet-Moore D, et al. (2011). Synaptic dysfunction and abnormal behaviors in mice lacking major isoforms of Shank3. Hum. Mol. Genet. 20, 3093–3108. 10.1093/hmg/ddr212. [DOI] [PMC free article] [PubMed] [Google Scholar]
- 36.PsychENCODE Consortium; Akbarian S, Liu C, Knowles JA, Vaccarino FM, Farnham PJ, Crawford GE, Jaffe AE, Pinto D, Dracheva S, et al. (2015). The PsychENCODE project. Nat. Neurosci. 18, 1707–1712. 10.1038/nn.4156. [DOI] [PMC free article] [PubMed] [Google Scholar]
- 37.Wang D, Liu S, Warrell J, Won H, Shi X, Navarro FCP, Clarke D, Gu M, Emani P, Yang YT, et al. (2018). Comprehensive functional genomic resource and integrative model for the human brain. Science 362, eaat8464. 10.1126/science.aat8464. [DOI] [PMC free article] [PubMed] [Google Scholar]
- 38.Ramaker RC, Bowling KM, Lasseigne BN, Hagenauer MH, Hardigan AA, Davis NS, Gertz J, Cartagena PM, Walsh DM, Vawter MP, et al. (2017). Post-mortem molecular profiling of three psychiatric disorders. Genome Med. 9, 72. 10.1186/s13073-017-0458-5. [DOI] [PMC free article] [PubMed] [Google Scholar]
- 39.Srinivasan K, Friedman BA, Etxeberria A, Huntley MA, van der Brug MP, Foreman O, Paw JS, Modrusan Z, Beach TG, Serrano GE, and Hansen DV (2020). Alzheimer’s Patient Microglia Exhibit Enhanced Aging and Unique Transcriptional Activation. Cell Rep. 31, 107843. 10.1016/j.celrep.2020.107843. [DOI] [PMC free article] [PubMed] [Google Scholar]
- 40.Yao Z, van Velthoven CTJ, Nguyen TN, Goldy J, Sedeno-Cortes AE, Baftizadeh F, Bertagnolli D, Casper T, Chiang M, Crichton K, et al. (2021). A taxonomy of transcriptomic cell types across the isocortex and hippocampal formation. Cell 184, 3222–3241.e26. 10.1016/j.cell.2021.04.021. [DOI] [PMC free article] [PubMed] [Google Scholar]
- 41.Ihara M, Yamasaki N, Hagiwara A, Tanigaki A, Kitano A, Hikawa R, Tomimoto H, Noda M, Takanashi M, Mori H, et al. (2007). Sept4, a component of presynaptic scaffold and Lewy bodies, is required for the suppression of alpha-synuclein neurotoxicity. Neuron 53, 519–533. 10.1016/j.neuron.2007.01.019. [DOI] [PubMed] [Google Scholar]
- 42.Lin WH, Chiu KC, Chang HM, Lee KC, Tai TY, and Chuang LM (2001). Molecular scanning of the human sorbin and SH3-domain-containing-1 (SORBS1) gene: positive association of the T228A polymorphism with obesity and type 2 diabetes. Hum. Mol. Genet. 10, 1753–1760. 10.1093/hmg/10.17.1753. [DOI] [PubMed] [Google Scholar]
- 43.Leung SK, Jeffries AR, Castanho I, Jordan BT, Moore K, Davies JP, Dempster EL, Bray NJ, O’Neill P, Tseng E, et al. (2021). Full-length transcript sequencing of human and mouse cerebral cortex identifies widespread isoform diversity and alternative splicing. Cell Rep. 37, 110022. 10.1016/j.celrep.2021.110022. [DOI] [PMC free article] [PubMed] [Google Scholar]
- 44.Fu JM, Satterstrom FK, Peng M, Brand H, Collins RL, Dong S, Wamsley B, Klei L, Wang L, Hao SP, et al. (2022). Rare coding variation provides insight into the genetic architecture and phenotypic context of autism. Nat. Genet. 54, 1320–1331. 10.1038/s41588-022-01104-0. [DOI] [PMC free article] [PubMed] [Google Scholar]
- 45.Zhou X, Feliciano P, Shu C, Wang T, Astrovskaya I, Hall JB, Obiajulu JU, Wright JR, Murali SC, Xu SX, et al. (2022). Integrating de novo and inherited variants in 42,607 autism cases identifies mutations in new moderate-risk genes. Nat. Genet. 54, 1305–1319. 10.1038/s41588-022-01148-2. [DOI] [PMC free article] [PubMed] [Google Scholar]
- 46.Satterstrom FK, Kosmicki JA, Wang J, Breen MS, De Rubeis S, An JY, Peng M, Collins R, Grove J, Klei L, et al. (2020). Large-Scale Exome Sequencing Study Implicates Both Developmental and Functional Changes in the Neurobiology of Autism. Cell 180, 568–584.e23. 10.1016/j.cell.2019.12.036. [DOI] [PMC free article] [PubMed] [Google Scholar]
- 47.Flörke-Gerloff S, Töpfer-Petersen E, Müller-Esterl W, Schill WB, and Engel W (1983). Acrosin and the acrosome in human spermatogenesis. Hum. Genet. 65, 61–67. 10.1007/bf00285030. [DOI] [PubMed] [Google Scholar]
- 48.Monteiro P, and Feng G (2017). SHANK proteins: roles at the synapse and in autism spectrum disorder. Nat. Rev. Neurosci. 18, 147–157. 10.1038/nrn.2016.183. [DOI] [PubMed] [Google Scholar]
- 49.Tu JC, Xiao B, Naisbitt S, Yuan JP, Petralia RS, Brakeman P, Doan A, Aakalu VK, Lanahan AA, Sheng M, and Worley PF (1999). Coupling of mGluR/Homer and PSD-95 complexes by the Shank family of postsynaptic density proteins. Neuron 23, 583–592. 10.1016/s0896-6273(00)80810-7. [DOI] [PubMed] [Google Scholar]
- 50.Naisbitt S, Kim E, Tu JC, Xiao B, Sala C, Valtschanoff J, Weinberg RJ, Worley PF, and Sheng M (1999). Shank, a novel family of postsynaptic density proteins that binds to the NMDA receptor/PSD-95/GKAP complex and cortactin. Neuron 23, 569–582. 10.1016/s0896-6273(00)80809-0. [DOI] [PubMed] [Google Scholar]
- 51.Tang S, Lomsadze A, and Borodovsky M (2015). Identification of protein coding regions in RNA transcripts. Nucleic Acids Res. 43, e78. 10.1093/nar/gkv227. [DOI] [PMC free article] [PubMed] [Google Scholar]
- 52.Shimada M, Omae Y, Kakita A, Gabdulkhaev R, Hitomi Y, Miyagawa T, Honda M, Fujimoto A, and Tokunaga K (2024). Identification of region-specific gene isoforms in the human brain using long-read transcriptome sequencing. Sci. Adv. 10, eadj5279. 10.1126/sciadv.adj5279. [DOI] [PMC free article] [PubMed] [Google Scholar]
- 53.Trapnell C, Roberts A, Goff L, Pertea G, Kim D, Kelley DR, Pimentel H, Salzberg SL, Rinn JL, and Pachter L (2012). Differential gene and transcript expression analysis of RNA-seq experiments with TopHat and Cufflinks. Nat. Protoc. 7, 562–578. 10.1038/nprot.2012.016. [DOI] [PMC free article] [PubMed] [Google Scholar]
- 54.Cooper GM, Stone EA, Asimenos G , NISC Comparative Sequencing Program; Green ED, Batzoglou S, and Sidow A (2005). Distribution and intensity of constraint in mammalian genomic sequence. Genome Res. 15, 901–913. 10.1101/gr.3577405. [DOI] [PMC free article] [PubMed] [Google Scholar]
- 55.Davydov EV, Goode DL, Sirota M, Cooper GM, Sidow A, and Batzoglou S (2010). Identifying a high fraction of the human genome to be under selective constraint using GERP++. PLoS Comput. Biol. 6, e1001025. 10.1371/journal.pcbi.1001025. [DOI] [PMC free article] [PubMed] [Google Scholar]
- 56.Siepel A, Bejerano G, Pedersen JS, Hinrichs AS, Hou M, Rosenbloom K, Clawson H, Spieth J, Hillier LW, Richards S, et al. (2005). Evolutionarily conserved elements in vertebrate, insect, worm, and yeast genomes. Genome Res. 15, 1034–1050. 10.1101/gr.3715005. [DOI] [PMC free article] [PubMed] [Google Scholar]
- 57.Marcel V, Dichtel-Danjoy ML, Sagne C, Hafsi H, Ma D, Ortiz-Cuaran S, Olivier M, Hall J, Mollereau B, Hainaut P, and Bourdon JC (2011). Biological functions of p53 isoforms through evolution: lessons from animal and cellular models. Cell Death Differ. 18, 1815–1824. 10.1038/cdd.2011.120. [DOI] [PMC free article] [PubMed] [Google Scholar]
- 58.Khoury MP, and Bourdon JC (2010). The isoforms of the p53 protein. Cold Spring Harbor Perspect. Biol. 2, a000927. 10.1101/cshperspect.a000927. [DOI] [PMC free article] [PubMed] [Google Scholar]
- 59.Ayoub AE, Oh S, Xie Y, Leng J, Cotney J, Dominguez MH, Noonan JP, and Rakic P (2011). Transcriptional programs in transient embryonic zones of the cerebral cortex defined by high-resolution mRNA sequencing. Proc. Natl. Acad. Sci. USA 108, 14950–14955. 10.1073/pnas.1112213108. [DOI] [PMC free article] [PubMed] [Google Scholar]
- 60.Belgard TG, Marques AC, Oliver PL, Abaan HO, Sirey TM, Hoerder-Suabedissen A, García-Moreno F, Molnár Z, Margulies EH, and Ponting CP (2011). A transcriptomic atlas of mouse neocortical layers. Neuron 71, 605–616. 10.1016/j.neuron.2011.06.039. [DOI] [PMC free article] [PubMed] [Google Scholar]
- 61.Fertuzinhos S, Li M, Kawasawa YI, Ivic V, Franjic D, Singh D, Crair M, and Sestan N (2014). Laminar and temporal expression dynamics of coding and noncoding RNAs in the mouse neocortex. Cell Rep. 6, 938–950. 10.1016/j.celrep.2014.01.036. [DOI] [PMC free article] [PubMed] [Google Scholar]
- 62.Joglekar A, Prjibelski A, Mahfouz A, Collier P, Lin S, Schlusche AK, Marrocco J, Williams SR, Haase B, Hayes A, et al. (2021). A spatially resolved brain region- and cell type-specific isoform atlas of the postnatal mouse brain. Nat. Commun. 12, 463. 10.1038/s41467-020-20343-5. [DOI] [PMC free article] [PubMed] [Google Scholar]
- 63.Genomics, x. (2022). FFPE Mouse Brain Coronal Section 1 (FFPE). Spatial Gene Expression Dataset by Space Ranger 2.0.0. [Google Scholar]
- 64.Niu M, Cao W, Wang Y, Zhu Q, Luo J, Wang B, Zheng H, Weitz DA, and Zong C (2023). Droplet-based transcriptome profiling of individual synapses. Nat. Biotechnol. 41, 1332–1344. 10.1038/s41587-022-01635-1. [DOI] [PubMed] [Google Scholar]
- 65.Gauthier J, Champagne N, Lafrenière RG, Xiong L, Spiegelman D, Brustein E, Lapointe M, Peng H, Côté M, Noreau A, et al. (2010). De novo mutations in the gene encoding the synaptic scaffolding protein SHANK3 in patients ascertained for schizophrenia. Proc. Natl. Acad. Sci. USA 107, 7863–7868. 10.1073/pnas.0906232107. [DOI] [PMC free article] [PubMed] [Google Scholar]
- 66.Vucurovic K, Landais E, Delahaigue C, Eutrope J, Schneider A, Leroy C, Kabbaj H, Motte J, Gaillard D, Rolland AC, and Doco-Fenzy M (2012). Bipolar affective disorder and early dementia onset in a male patient with SHANK3 deletion. Eur. J. Med. Genet. 55, 625–629. 10.1016/j.ejmg.2012.07.009. [DOI] [PubMed] [Google Scholar]
- 67.Levy T, Foss-Feig JH, Betancur C, Siper PM, Trelles-Thorne MDP, Halpern D, Frank Y, Lozano R, Layton C, Britvan B, et al. (2022). Strong evidence for genotype-phenotype correlations in Phelan-McDermid syndrome: results from the developmental synaptopathies consortium. Hum. Mol. Genet. 31, 625–637. 10.1093/hmg/ddab280. [DOI] [PMC free article] [PubMed] [Google Scholar]
- 68.Moessner R, Marshall CR, Sutcliffe JS, Skaug J, Pinto D, Vincent J, Zwaigenbaum L, Fernandez B, Roberts W, Szatmari P, and Scherer SW (2007). Contribution of SHANK3 mutations to autism spectrum disorder. Am. J. Hum. Genet. 81, 1289–1297. 10.1086/522590. [DOI] [PMC free article] [PubMed] [Google Scholar]
- 69.Leblond CS, Nava C, Polge A, Gauthier J, Huguet G, Lumbroso S, Giuliano F, Stordeur C, Depienne C, Mouzat K, et al. (2014). Meta-analysis of SHANK Mutations in Autism Spectrum Disorders: a gradient of severity in cognitive impairments. PLoS Genet. 10, e1004580. 10.1371/journal.pgen.1004580. [DOI] [PMC free article] [PubMed] [Google Scholar]
- 70.Singh T, Poterba T, Curtis D, Akil H, Al Eissa M, Barchas JD, Bass N, Bigdeli TB, Breen G, Bromet EJ, et al. (2022). Rare coding variants in ten genes confer substantial risk for schizophrenia. Nature 604, 509–516. 10.1038/s41586-022-04556-w. [DOI] [PMC free article] [PubMed] [Google Scholar]
- 71.Palmer DS, Howrigan DP, Chapman SB, Adolfsson R, Bass N, Blackwood D, Boks MPM, Chen CY, Churchhouse C, Corvin AP, et al. (2022). Exome sequencing in bipolar disorder identifies AKAP11 as a risk gene shared with schizophrenia. Nat. Genet. 54, 541–547. 10.1038/s41588-022-01034-x. [DOI] [PMC free article] [PubMed] [Google Scholar]
- 72.Werling DM, Pochareddy S, Choi J, An JY, Sheppard B, Peng M, Li Z, Dastmalchi C, Santpere G, Sousa AMM, et al. (2020). Whole-Genome and RNA Sequencing Reveal Variation and Transcriptomic Coordination in the Developing Human Prefrontal Cortex. Cell Rep. 31, 107489. 10.1016/j.celrep.2020.03.053. [DOI] [PMC free article] [PubMed] [Google Scholar]
- 73.Bryois J, Garrett ME, Song L, Safi A, Giusti-Rodriguez P, Johnson GD, Shieh AW, Buil A, Fullard JF, Roussos P, et al. (2018). Evaluation of chromatin accessibility in prefrontal cortex of individuals with schizophrenia. Nat. Commun. 9, 3121. 10.1038/s41467-018-05379-y. [DOI] [PMC free article] [PubMed] [Google Scholar]
- 74.McLaren W, Gil L, Hunt SE, Riat HS, Ritchie GRS, Thormann A, Flicek P, and Cunningham F (2016). The Ensembl Variant Effect Predictor. Genome Biol. 17, 122. 10.1186/s13059-016-0974-4. [DOI] [PMC free article] [PubMed] [Google Scholar]
- 75.Koch L (2020). Exploring human genomic diversity with gnomAD. Nat. Rev. Genet. 21, 448. 10.1038/s41576-020-0255-7. [DOI] [PubMed] [Google Scholar]
- 76.Jaganathan K, Kyriazopoulou Panagiotopoulou S, McRae JF, Darbandi SF, Knowles D, Li YI, Kosmicki JA, Arbelaez J, Cui W, Schwartz GB, et al. (2019). Predicting Splicing from Primary Sequence with Deep Learning. Cell 176, 535–548.e24. 10.1016/j.cell.2018.12.015. [DOI] [PubMed] [Google Scholar]
- 77.Cingolani P, Platts A, Wang LL, Coon M, Nguyen T, Wang L, Land SJ, Lu X, and Ruden DM (2012). A program for annotating and predicting the effects of single nucleotide polymorphisms, SnpEff: SNPs in the genome of Drosophila melanogaster strain w1118; iso-2; iso-3; iso-2; iso-3. Fly 6, 80–92. 10.4161/fly.19695. [DOI] [PMC free article] [PubMed] [Google Scholar]
- 78.Nurk S, Koren S, Rhie A, Rautiainen M, Bzikadze AV, Mikheenko A, Vollger MR, Altemose N, Uralsky L, Gershman A, et al. (2022). The complete sequence of a human genome. Science 376, 44–53. 10.1126/science.abj6987. [DOI] [PMC free article] [PubMed] [Google Scholar]
- 79.Chau KK, Zhang P, Urresti J, Amar M, Pramod AB, Chen J, Thomas A, Corominas R, Lin GN, and Iakoucheva LM (2021). Full-length isoform transcriptome of the developing human brain provides further insights into autism. Cell Rep. 36, 109631. 10.1016/j.celrep.2021.109631. [DOI] [PMC free article] [PubMed] [Google Scholar]
- 80.Mertens F, Johansson B, Fioretos T, and Mitelman F (2015). The emerging complexity of gene fusions in cancer. Nat. Rev. Cancer 15, 371–381. 10.1038/nrc3947. [DOI] [PubMed] [Google Scholar]
- 81.Dorney R, Dhungel BP, Rasko JEJ, Hebbard L, and Schmitz U (2023). Recent advances in cancer fusion transcript detection. Briefings Bioinf. 24, bbac519. 10.1093/bib/bbac519. [DOI] [PMC free article] [PubMed] [Google Scholar]
- 82.Mehani B, Narta K, Paul D, Raj A, Kumar D, Sharma A, Kaurani L, Nayak S, Dash D, Suri A, et al. (2020). Fusion transcripts in normal human cortex increase with age and show distinct genomic features for single cells and tissues. Sci. Rep. 10, 1368. 10.1038/s41598-020-58165-6. [DOI] [PMC free article] [PubMed] [Google Scholar]
- 83.Gandal MJ, Haney JR, Wamsley B, Yap CX, Parhami S, Emani PS, Chang N, Chen GT, Hoftman GD, de Alba D, et al. (2022). Broad transcriptomic dysregulation occurs across the cerebral cortex in ASD. Nature 611, 532–539. 10.1038/s41586-022-05377-7. [DOI] [PMC free article] [PubMed] [Google Scholar]
- 84.Beri S, Tonna N, Menozzi G, Bonaglia MC, Sala C, and Giorda R (2007). DNA methylation regulates tissue-specific expression of Shank3. J. Neurochem. 101, 1380–1391. 10.1111/j.1471-4159.2007.04539.x. [DOI] [PubMed] [Google Scholar]
- 85.Zhu L, Wang X, Li XL, Towers A, Cao X, Wang P, Bowman R, Yang H, Goldstein J, Li YJ, and Jiang YH (2014). Epigenetic dysregulation of SHANK3 in brain tissues from individuals with autism spectrum disorders. Hum. Mol. Genet. 23, 1563–1578. 10.1093/hmg/ddt547. [DOI] [PMC free article] [PubMed] [Google Scholar]
- 86.Treutlein B, Gokce O, Quake SR, and Südhof TC (2014). Cartography of neurexin alternative splicing mapped by single-molecule long-read mRNA sequencing. Proc. Natl. Acad. Sci. USA 111, E1291–E1299. 10.1073/pnas.1403244111. [DOI] [PMC free article] [PubMed] [Google Scholar]
- 87.Schmucker D, and Chen B (2009). Dscam and DSCAM: complex genes in simple animals, complex animals yet simple genes. Genes Dev. 23, 147–156. 10.1101/gad.1752909. [DOI] [PubMed] [Google Scholar]
- 88.Clark MB, Wrzesinski T, Garcia AB, Hall NAL, Kleinman JE, Hyde T, Weinberger DR, Harrison PJ, Haerty W, and Tunbridge EM (2020). Long-read sequencing reveals the complex splicing profile of the psychiatric risk gene CACNA1C in human brain. Mol. Psychiatr. 25, 37–47. 10.1038/s41380-019-0583-1. [DOI] [PMC free article] [PubMed] [Google Scholar]
- 89.Bey AL, Wang X, Yan H, Kim N, Passman RL, Yang Y, Cao X, Towers AJ, Hulbert SW, Duffney LJ, et al. (2018). Brain region-specific disruption of Shank3 in mice reveals a dissociation for cortical and striatal circuits in autism-related behaviors. Transl. Psychiatry 8, 94. 10.1038/s41398-018-0142-6. [DOI] [PMC free article] [PubMed] [Google Scholar]
- 90.Won H, Lee HR, Gee HY, Mah W, Kim JI, Lee J, Ha S, Chung C, Jung ES, Cho YS, et al. (2012). Autistic-like social behaviour in Shank2-mutant mice improved by restoring NMDA receptor function. Nature 486, 261–265. 10.1038/nature11208. [DOI] [PubMed] [Google Scholar]
- 91.Han K, Holder JL Jr., Schaaf CP, Lu H, Chen H, Kang H, Tang J, Wu Z, Hao S, Cheung SW, et al. (2013). SHANK3 overexpression causes manic-like behaviour with unique pharmacogenetic properties. Nature 503, 72–77. 10.1038/nature12630. [DOI] [PMC free article] [PubMed] [Google Scholar]
- 92.Qin L, Ma K, Wang ZJ, Hu Z, Matas E, Wei J, and Yan Z (2018). Social deficits in Shank3-deficient mouse models of autism are rescued by histone deacetylase (HDAC) inhibition. Nat. Neurosci. 21, 564–575. 10.1038/s41593-018-0110-8. [DOI] [PMC free article] [PubMed] [Google Scholar]
- 93.Ecker JR, Geschwind DH, Kriegstein AR, Ngai J, Osten P, Polioudakis D, Regev A, Sestan N, Wickersham IR, and Zeng H (2017). The BRAIN Initiative Cell Census Consortium: Lessons Learned toward Generating a Comprehensive Brain Cell Atlas. Neuron 96, 542–557. 10.1016/j.neuron.2017.10.007. [DOI] [PMC free article] [PubMed] [Google Scholar]
- 94.Raj A, and van Oudenaarden A (2008). Nature, nurture, or chance: stochastic gene expression and its consequences. Cell 135, 216–226. 10.1016/j.cell.2008.09.050. [DOI] [PMC free article] [PubMed] [Google Scholar]
- 95.Gupta A, Martin-Rufino JD, Jones TR, Subramanian V, Qiu X, Grody EI, Bloemendal A, Weng C, Niu SY, Min KH, et al. (2022). Inferring gene regulation from stochastic transcriptional variation across single cells at steady state. Proc. Natl. Acad. Sci. USA 119, e2207392119. 10.1073/pnas.2207392119. [DOI] [PMC free article] [PubMed] [Google Scholar]
- 96.Thattai M, and van Oudenaarden A (2001). Intrinsic noise in gene regulatory networks. Proc. Natl. Acad. Sci. USA 98, 8614–8619. 10.1073/pnas.151588598. [DOI] [PMC free article] [PubMed] [Google Scholar]
- 97.Bohrer CH, and Larson DR (2021). The Stochastic Genome and Its Role in Gene Expression. Cold Spring Harbor Perspect. Biol. 13, a040386. 10.1101/cshperspect.a040386. [DOI] [PMC free article] [PubMed] [Google Scholar]
- 98.Raser JM, and O’Shea EK (2005). Noise in gene expression: origins, consequences, and control. Science 309, 2010–2013. 10.1126/science.1105891. [DOI] [PMC free article] [PubMed] [Google Scholar]
- 99.Girbig M, Misiaszek AD, and Müller CW (2022). Structural insights into nuclear transcription by eukaryotic DNA-dependent RNA polymerases. Nat. Rev. Mol. Cell Biol. 23, 603–622. 10.1038/s41580-022-00476-9. [DOI] [PubMed] [Google Scholar]
- 100.Agapov A, Olina A, and Kulbachinskiy A (2022). RNA polymerase pausing, stalling and bypass during transcription of damaged DNA: from molecular basis to functional consequences. Nucleic Acids Res. 50, 3018–3041. 10.1093/nar/gkac174. [DOI] [PMC free article] [PubMed] [Google Scholar]
- 101.Vassylyev DG, Vassylyeva MN, Perederina A, Tahirov TH, and Artsimovitch I (2007). Structural basis for transcription elongation by bacterial RNA polymerase. Nature 448, 157–162. 10.1038/nature05932. [DOI] [PubMed] [Google Scholar]
- 102.Landick R (2001). RNA polymerase clamps down. Cell 105, 567–570. 10.1016/s0092-8674(01)00381-6. [DOI] [PubMed] [Google Scholar]
- 103.McDowell JC, Roberts JW, Jin DJ, and Gross C (1994). Determination of intrinsic transcription termination efficiency by RNA polymerase elongation rate. Science 266, 822–825. 10.1126/science.7526463. [DOI] [PubMed] [Google Scholar]
- 104.ENCODE Project Consortium; Snyder MP, Gingeras TR, Moore JE, Weng Z, Gerstein MB, Ren B, Hardison RC, Stamatoyannopoulos JA, Graveley BR, et al. (2020). Perspectives on ENCODE. Nature 583, 693–698. 10.1038/s41586-020-2449-8. [DOI] [PMC free article] [PubMed] [Google Scholar]
- 105.Jensen TH, Jacquier A, and Libri D (2013). Dealing with pervasive transcription. Mol. Cell. 52, 473–484. 10.1016/j.molcel.2013.10.032. [DOI] [PubMed] [Google Scholar]
- 106.Robinson R (2010). Dark matter transcripts: sound and fury, signifying nothing? PLoS Biol. 8, e1000370. 10.1371/journal.pbio.1000370. [DOI] [PMC free article] [PubMed] [Google Scholar]
- 107.Pardo-Palacios FJ, Arzalluz-Luque A, Kondratova L, Salguero P, Mestre-Tomás J, Amorín R, Estevan-Morió E, Liu T, Nanni A, McIntyre L, et al. (2024). SQANTI3: curation of long-read transcriptomes for accurate identification of known and novel isoforms. Nat. Methods 21, 793–797. 10.1038/s41592-024-02229-2. [DOI] [PMC free article] [PubMed] [Google Scholar]
- 108.Chen S, Zhou Y, Chen Y, and Gu J (2018). fastp: an ultra-fast all-in-one FASTQ preprocessor. Bioinformatics 34, i884–i890. 10.1093/bioinformatics/bty560. [DOI] [PMC free article] [PubMed] [Google Scholar]
- 109.Kim D, Paggi JM, Park C, Bennett C, and Salzberg SL (2019). Graph-based genome alignment and genotyping with HISAT2 and HISAT-genotype. Nat. Biotechnol. 37, 907–915. 10.1038/s41587-019-0201-4. [DOI] [PMC free article] [PubMed] [Google Scholar]
- 110.Danecek P, Bonfield JK, Liddle J, Marshall J, Ohan V, Pollard MO, Whitwham A, Keane T, McCarthy SA, Davies RM, and Li H (2021). Twelve years of SAMtools and BCFtools. GigaScience 10, giab008. 10.1093/gigascience/giab008. [DOI] [PMC free article] [PubMed] [Google Scholar]
- 111.Liao Y, Smyth GK, and Shi W (2014). featureCounts: an efficient general purpose program for assigning sequence reads to genomic features. Bioinformatics 30, 923–930. 10.1093/bioinformatics/btt656. [DOI] [PubMed] [Google Scholar]
- 112.Patro R, Duggal G, Love MI, Irizarry RA, and Kingsford C (2017). Salmon provides fast and bias-aware quantification of transcript expression. Nat. Methods 14, 417–419. 10.1038/nmeth.4197. [DOI] [PMC free article] [PubMed] [Google Scholar]
- 113.Anders S, Reyes A, and Huber W (2012). Detecting differential usage of exons from RNA-seq data. Genome Res. 22, 2008–2017. 10.1101/gr.133744.111. [DOI] [PMC free article] [PubMed] [Google Scholar]
- 114.Bonfield JK, Marshall J, Danecek P, Li H, Ohan V, Whitwham A, Keane T, and Davies RM (2021). HTSlib: C library for reading/writing high-throughput sequencing data. GigaScience 10, giab007. 10.1093/gigascience/giab007. [DOI] [PMC free article] [PubMed] [Google Scholar]
- 115.Li H (2011). Tabix: fast retrieval of sequence features from generic TAB-delimited files. Bioinformatics 27, 718–719. 10.1093/bioinformatics/btq671. [DOI] [PMC free article] [PubMed] [Google Scholar]
- 116.Bangash MA, Park JM, Melnikova T, Wang D, Jeon SK, Lee D, Syeda S, Kim J, Kouser M, Schwartz J, et al. (2011). Enhanced polyubiquitination of Shank3 and NMDA receptor in a mouse model of autism. Cell 145, 758–772. 10.1016/j.cell.2011.03.052. [DOI] [PMC free article] [PubMed] [Google Scholar] [Retracted]
- 117.Tardaguila M, de la Fuente L, Marti C, Pereira C, Pardo-Palacios FJ, Del Risco H, Ferrell M, Mellado M, Macchietto M, Verheggen K, et al. (2018). SQANTI: extensive characterization of long-read transcript sequences for quality control in full-length transcriptome identification and quantification. Genome Res. 28, 396–411. 10.1101/gr.222976.117. [DOI] [PMC free article] [PubMed] [Google Scholar]
- 118.Zheng GXY, Terry JM, Belgrader P, Ryvkin P, Bent ZW, Wilson R, Ziraldo SB, Wheeler TD, McDermott GP, Zhu J, et al. (2017). Massively parallel digital transcriptional profiling of single cells. Nat. Commun. 8, 14049. 10.1038/ncomms14049. [DOI] [PMC free article] [PubMed] [Google Scholar]
Associated Data
This section collects any data citations, data availability statements, or supplementary materials included in this article.
Supplementary Materials
Data Availability Statement
Both human and mouse raw sequencing data have been deposited at SRA under BioProject: PRJNA1066952 and are publicly available. Accession numbers are listed in the key resources table. All UCSC tracks described in manuscript, and raw Tandem Mass Spectrometry data have been deposited at Mendeley and are publicly available. The DOI is listed in the key resources table.
This paper does not report original code.
Any additional information required to reanalyze the data reported in this paper is available from the lead contact upon request.
KEY RESOURCES TABLE.
| REAGENT or RESOURCE | SOURCE | IDENTIFIER |
|---|---|---|
|
| ||
| Antibodies | ||
|
| ||
| Acrosin Polyclonal Antibody (C-terminus) | Invitrogen | Cat #: PA5–114207; RRID: AB_2884721 |
| Acrosin Polyclonal Antibody (N-terminus) | Invitrogen | Cat #: PA5–99580; RRID: AB_2818513 |
|
| ||
| Biological samples | ||
|
| ||
| Human Brain Tissue | Mayo Clinic, Jacksonville, FL, 32224 USA | Adults, n = 4 |
| Human Brain Tissue | Children’s Hospital of Fudan University, Shanghai, 201102 China | Children, n = 4 |
|
| ||
| Critical commercial assays | ||
|
| ||
| NucleoZOL™ | Takara Bio | Cat #:740404.200 |
| NucleoSpin® RNA set for NucleoZOL™ | Takara Bio | Cat #: 740406.50 |
| rDNase Set | Takara Bio | Cat #: 740963 |
| NucleoSpin® RNA Clean-up XS | Takara Bio | Cat #: 740903.50 |
| RNA to cDNA EcoDry™ Premix kit | Takara Bio | Cat #: 639548 |
| KAPA SYBR® FAST qPCR Master Mix (2X) Universal | Kapa Biosystems | Cat #: KK4602 |
| xGen® Lockdown® Probes | Integrated DNA Technologies | customized |
| Iso-Seq Express Oligo Kit | PACBIO | PN 101–737–500 |
| SMRTbell Express Template Prep Kit 2.0 | PACBIO | PN 100–938–900 |
| Elution Buffer | PACBIO | PN 101–633–500 |
| NEBNext® Single Cell/Low Input cDNA Synthesis & Amplification Module | NEB | Cat#: E6421S |
| NEBNext® High-Fidelity 2X PCR Master Mix | NEB | Cat#: M0541S |
| ProNex® Beads | Promega | Cat #: NG2001 |
| Qubit® dsDNA HS Assay Kit | Invitrogen | Cat #: Q32851 |
| NucleoSpin® RNA/Protein Kit | Takara Bio | Cat #: 740933.50 |
| Protein Quantification Assay | Takara Bio | Cat #: 740967.250 |
| 4x Laemmli buffer | Bio-Rad | Cat#: 1610747 |
| 4–20% Mini-PROTEAN® TGX Stain-Free™ Protein Gels | Bio-Rad | Cat #: 4568094 |
|
| ||
| Deposited data | ||
|
| ||
| Iso-Seq/RNA-Seq | This study | BioProject: PRJNA1066952 |
| UCSC tracks | This study | https://doi.org/10.17632/n5vjjmwb9p.1 |
| Tandem Mass Spectrometry | This study | https://doi.org/10.17632/n5vjjmwb9p.1 |
| UCLA-ASD RNA-Seq | PsychENCODE | syn4921369 |
| BrainVar RNA-Seq | PsychENCODE | syn21557948 |
| BrainGVEX RNA-Seq | PsychENCODE | syn4590909 |
| CMC RNA-Seq | PsychENCODE | syn22344687 |
| LIDB RNA-Seq | PsychENCODE | syn12299750 |
| CommonMind RNA-Seq | PsychENCODE | syn2759792 |
| SMART scRNA-seq | Yao et al.40 | https://assets.nemoarchive.org/dat-jb2f34y |
| ASC VCF | Autism Sequencing Consortium | https://asc.broadinstitute.org/downloads |
| BipEx VCF | Bipolar Exomes | https://bipex.broadinstitute.org/downloads |
| Epi25 VCF | whole-exome sequencing case- control study of epilepsy | https://epi25.broadinstitute.org/downloads |
| SCHEMA VCF | Schizophrenia exome meta-analysis consortium | https://schema.broadinstitute.org/downloads |
| Mouse brain Visium | 10x Genomics | FFPE Mouse Brain Coronal Section 1 |
|
| ||
| Experimental models: Organisms/strains | ||
|
| ||
| C57BL/6J | Jackson Laboratory | Strain #:000664 |
| Shank3Δe21 | Jackson Laboratory | Shank3tm1.1Pfw/J, Strain #:018398 |
| Shank3Δe4–9 | Jiang Lab | Wang et al.35 |
| Shank3Δe4–22 | Jiang Lab | Wang et al.20 |
|
| ||
| Software and algorithms | ||
|
| ||
| Lima v2.5.0 | PACBIO | https://lima.how/ |
| IsoSeq v3 | PACBIO | https://github.com/PacificBiosciences/IsoSeq |
| pbmm2 | PACBIO | https://github.com/PacificBiosciences/pbmm2 |
| SQANTI3 v4.3 | Pardo-Palacios et al.107 | https://github.com/ConesaLab/SQANTI3 |
| fastp | Chen et al.108 | https://github.com/OpenGene/fastp |
| HISAT 2.2.1 | Kim et al.109 | https://daehwankimlab.github.io/hisat2/download/ |
| SAMtools | Danecek et al.110 | https://www.htslib.org/ |
| FeatureCount | Liao et al.111 | https://rnnh.github.io/bioinfo-notebook/docs/featureCounts.html |
| Salmon 1.4.0 | Patro et al.112 | https://github.com/COMBINE-lab/salmon/releases |
| DEXSeq | Anders et al.113 | https://bioconductor.org/packages/release/bioc/html/DEXSeq.html |
| BCFtools v 1.16 | Danecek et al.110 | https://bioconda.github.io/recipes/bcftools/README.html |
| HTSlib v 1.16 | Bonfield et al.114 | https://www.htslib.org/download/ |
| Tabix v 0.2.5 | Li et al.115 | https://github.com/samtools/tabix |
| VEP, release 107 | McLaren et al.74 | https://github.com/Ensembl/ensembl-vep |
| gnomAD, v3.1.2 | Koch et al.75 | https://gnomad.broadinstitute.org/news/2021-10-gnomad-v3-1-2-minor-release/ |
| SpliceAI | Jaganathan et al.76 | https://github.com/Illumina/SpliceAI |
| SnpEff | Cingolani et al.77 | https://pcingola.github.io/SnpEff/ |
| Cell Ranger | 10x Genomics | https://www.10xgenomics.com/support/software/cell-ranger/latest |
| Space Ranger v2.0 | 10x Genomics | https://www.10xgenomics.com/support/software/space-ranger/latest |
| Genomics Loupe Visualization Software v6.5 | 10x Genomics | https://www.10xgenomics.com/support/software/loupe-browser/latest |