

Abstract
Background
As a currently incurable but preventable disease, the prevention and early diagnosis of Alzheimer’s disease (AD) has long been a research hotspot. Amyloid deposition has been shown to be a major pathological feature of AD. Notably, not all the people with amyloid-beta (Aβ) pathology will have significant cognitive declines and eventually develop AD. Therefore, the aim of this study was to explore the risk factors for cognitive decline in Aβ-positive participants.
Methods
We included 650 non-demented participants who were Aβ-positive at baseline from the Alzheimer’s Disease Neuroimaging Initiative (ADNI) database. Mixed effects and COX regression models were applied to assess 37 potential risk factors. Mixed effects models were employed to assess the temporal associations between potential risk factors and four cognitive assessment scales. COX regression models were used to assess the impact of potential risk factors on cognitive diagnosis conversion. Univariate and multivariate analyses were applied to the above models. Additionally, we used the Cochran-Armitage trend test to examine whether the incidence of cognitive decline increased with the number concurrent of risk factors.
Results
Six factors (low diastolic pressure, low body mass index, retired status, a history of drug abuse, Parkinsonism, and depression) were the identified risk factors and four factors (a history of urinary disease, musculoskeletal diseases, no major surgical history, and no prior dermatologic-connective tissue diseases) were found to be suggestive risk factors. The incidence of cognitive decline in the Aβ-positive participants gradually increased as the number of concurrent risk factors increased (p for trend = 0.0005).
Conclusions
Our study may facilitate the understanding of the potential pathological processes in AD and provide novel targets for the prevention of cognitive decline among participants with Aβ positivity.
Supplementary Information
The online version contains supplementary material available at 10.1186/s13195-024-01554-0.
Keywords: Alzheimer’s disease, Amyloid-beta positivity, Cognitive decline, Risk factors
Introduction
With population growth and population aging, the number of people with dementia worldwide is estimated to reach 150 million in 2050, which is about triple the number in 2019 [1]. Alzheimer’s disease (AD), as the main cause of dementia [2], imposes a heavy burden on the health care system [3], patients and the society [4]. Amyloid-beta (Aβ) plaques and neurofibrillary tangles (NFTs) are considered to be the core neuropathological characteristics of AD [5–7]. The former contains fibrillar aggregates of Aβ peptides, and the latter contains aggregates of hyperphosphorylated tau proteins. In the past, we solely relied on late clinical symptoms or postmortem examination to make an AD diagnosis. Since Aβ depositions precede the clinical onset of AD for more than 10 years, Aβ pathology can currently serve as part of the evidence for AD diagnosis [8]. With the development of biomarkers and imaging techniques, Aβ pathology can be early detected both by cerebrospinal fluid (CSF) biomarkers and positron emission tomography (PET) scanning [9]. Furthermore, the National Institute on Aging and Alzheimer’s Association (NIA-AA) redefined AD by proposing the ATN framework based on Aβ deposition, pathologic tau, and neurodegeneration [10], which makes it possible to recognize AD by biomarkers before the clinical stage. However, not all the people with Aβ pathology will have significant cognitive declines and eventually develop AD [11]. For instance, a longitudinal study with an average follow-up duration of 11 years revealed that individuals exhibiting low levels of Aβ and tau proteins did not exhibit any cognitive decline even after several years of follow-up [12], suggesting that Aβ pathology might only be an initiating factor for AD.
Many observational and randomized controlled trials have investigated the risk factors of cognitive decline and AD in detail, such as advanced age, genetic, socioeconomic, and environmental factors, as well as psychiatric symptoms of anxiety, depression, or apathy [13, 14]. Moreover, previous meta-analyses and reviews have shown that approximately one-third of AD cases may be attributable to modifiable risk factors, such as diabetes, hypertension, physical activity, diet, and social activity [15, 16]. However, although the risk factors for cognitive decline and those for AD have been extensively studied, few previous studies have focused on the risk factors for cognitive decline in the Aβ-positive (A+) non-demented population. As Aβ pathology has been detected in an increasing number of people, identifying risk factors for cognitive decline in A+ non-demented participants is of vital importance to AD prevention. Whether the well-established AD risk factors still confer a risk of cognitive decline among A+ non-demented participants is unclear. Therefore, the purpose of our study was to identify the risk factors for cognitive decline in the A+ non-demented population. Additionally, some identified AD risk factors showed a synergistic effect with Aβ [17, 18]. Specifically, risk factors, such as apolipoprotein E ε4 (APOE-ε4) allele, α-synuclein, and age may lead to faster cognitive decline in people with Aβ pathology. The risk factors for cognitive decline in a non-demented population with Aβ pathology deserve further exploration.
Methods
Study participants
The participants in our study were included in the Alzheimer’s Disease Neuroimaging Initiative (ADNI) study. The ADNI study is a large multicenter study that collected extensive data on clinical, imaging, genetic, and biochemical biomarkers of preclinical AD and AD. The ADNI study has been approved by the Institutional Review Boards of all participating institutional centers and the written informed consent form has been signed by all participants according to the Declaration of Helsinki.
In the ADNI database, there were 899 A+ participants at baseline. Among them, we included 650 A+ non-demented participants at baseline who provided basic clinical characteristics and imaging data at baseline, as well as cognitive measurements at follow-up (see Fig. 1 for details). The exclusion criteria included significant neurologic diseases, psychiatric disorders with psychotic features, current use of specific psychoactive medications, and so forth. Detailed inclusion and exclusion criteria for the ADNI database can be found at adni.loni.usc.edu. The ADNI divided participants into cognitively normal (CN), mild cognitive impairment (MCI), and AD participants according to strict criteria [19]. In our study, participants with a transition from CN to MCI/AD or from MCI to AD during the follow-up were considered as cognitive diagnosis conversions. According to whether the participants experienced a cognitive diagnostic conversion during follow-up, we categorized them into the cognitive decline group and the no cognitive decline group. According to the APOE-ε4 status, participants were categorized into APOE-ε4 carriers and non-carriers. Participants were classified as APOE-ε4 carriers if they had at least one APOE-ε4 allele.
Fig. 1.

Screening process and workflow of the study. The flowchart describes the details of screening participants from the Alzheimer’s Disease Neuroimaging Initiative (ADNI) database for analysis. Abbreviations: pg/ml, picograms per milliliter; PET, positron emission tomography; Aβ, amyloid-β; ADNI-EF2, the ADNI Composite Executive Function 2 score; ADNI-MEM, the ADNI Composite Memory Score; MMSE, Mini-Mental State Examination; MoCA, Montreal Cognitive Assessment; CN, cognitively normal; MCI, mild cognitive impairment; AD, Alzheimer’s disease
CSF and amyloid imaging measures
CSF concentrations of Aβ42 and p-tau were measured at the University of Pennsylvania using Innogenetics immunoassay kits on the multiplex xMAP Luminex platform (Luminex Corp, Austin, TX), and the measuring method has been described in detail in a previous study [20]. We applied the cut-off values for determining biomarker positivity which were published in previous articles. A positive CSF Aβ42 was defined as having a CSF Aβ42 level less than 977 picograms per milliliter (pg/mL), and CSF p-tau positivity was defined as having a CSF p-tau level greater than 21.8 pg/mL [21].
PET imaging data in the ADNI database were acquired by PET scanners at different sites across the country, and the detailed process has been described in previous studies [22, 23]. In this study, the SUV ratio (SUVR) was used as a main indicator of PET performance. SUVR PIB-PET values or SUVR AV45-PET values were calculated as the average of several representative regions of interest (ROIs), using the cerebellum as a reference region. We used two established thresholds to define A+: PIB-PET (SUVR > 1.44) and AV45-PET (SUVR > 1.11) [21, 24]. For tau PET, we selected ROIs in the inferior temporal, amygdala, bilateral entorhinal, fusiform, and middle temporal regions for evaluation. The meta-ROI SUVR threshold of tau PET (AV1451-PET) was 1.37 [25].
Participants were classified as A+ based on either a positive CSF Aβ42 value or positive amyloid PET (using either PIB-PET or AV45-PET). Participants were classified as tau positivity (T+) based on either a positive CSF p-tau value or a positive AV1451 tau PET imaging.
Cognitive assessments
We applied the ADNI Composite Memory Score (ADNI-MEM) and the ADNI Composite Executive Function 2 score (ADNI-EF2) as tools to evaluate the memory function and executive function of participants, respectively. We used the Mini-Mental State Examination (MMSE) scale and Montreal Cognitive Assessment (MoCA) scores to assess the overall cognitive performance. Higher scores represent better cognitive functioning, and all of these measures have excellent robustness and external validity [26]. ADNI-EF2 includes the Trail-Making Test parts A and B, WAIS-R Digit Symbol Substitution, Category Fluency tasks, five Clock Drawing tasks, and Digit Span Backwards [27]. ADNI-MEM is derived from several tasks, including word list learning and recognition from ADAS-Cog, the Rey Auditory Verbal Learning Task, the 3-word recall item from the MMSE, and recall from Logical Memory I of the Wechsler Memory Scale-Revised [28].
Baseline information of participants
The ADNI database collected the baseline information of the participants, consisting of age (continuous), gender (female or male), educational years (continuous), APOE-ε4 carrier (yes or no), as well as other data which were potential risk factors to be explore in our study, including body weight (continuous), body height (continuous), body mass index (BMI, < 25 kg/m2 or ≥ 25 kg/m2), systolic pressure (continuous), diastolic pressure (continuous), pulse pressure (continuous), race (Asian, white, black, more than one), handedness (left or right), parental dementia (yes or no), lifestyle factors (alcohol use, cigarette use, drug abuse, marital status, and retirement status), and histories of clinical diseases which included stroke, hypertension, psychiatric diseases, neurologic diseases (other than AD), otolaryngology diseases, cardiovascular diseases, respiratory diseases, hepatic diseases, dermatologic connective tissue diseases, musculoskeletal diseases, endocrine-metabolic diseases, gastrointestinal diseases, hematopoietic-lymphatic diseases, urinary disease, drug allergies, malignancy diseases, major surgical procedures, Parkinsonism, subjective cognitive decline (SCD), significant visual impairment, and significant auditory impairment. All the above lifestyle factors and histories of clinical diseases were dichotomous variables (yes or no). For these dichotomous variables, “no” was coded as 0, and “yes” was coded as 1.
Additionally, the Geriatric Depression Scale (GDS) and Hachinski Ischemic Scale (HIS) [29] were utilized to assess depressive symptoms and the risk of vascular dementia, respectively. According to previous literature, we divided participants into depressed and non-depressed based on a GDS cutoff value of 0 [30].
Statistical analysis
In this study, continuous variables were described using the mean and standard deviation, while categorical variables were described using numbers and prevalence. To analyze the intergroup differences, the Mann-Whitney U test and the chi-square test were performed for continuous variables and categorical variables, respectively. The Shapiro-Wilk test showed that ADNI-MEM, ADNI-EF2, MMSE, and MoCA scores were skewed, and then these scores were transformed into a normal distribution using the car package of R software.
We used five models to identify risk factors. Mixed effects models were employed to assess the temporal associations between potential risk factors and ADNI-EF2 (Model 1), ADNI-MEM (Model 2), MMSE (Model 3), and MoCA (Model 4) scores. COX regression models (Model 5) were carried out to estimate the hazard ratios (HRs) and 95% confidence intervals (CIs) of these risk factors for cognitive diagnosis conversion. These five models were conducted in two steps in a similar way: first, a univariate analysis was performed, followed by a multivariate analysis. Initially, univariate models were used to screen for risk factors potentially contributing to cognitive decline in the A + population (*p < 0.1). Subsequently, multivariate models, including multivariate mixed-effects models and multivariate Cox regression models, were employed to further analyze the significant risk factors identified in the univariate analysis (*p < 0.05) [31]. Age, gender, years of education, APOE-ε4 status, and baseline cognitive status are included as basic covariates. Factors validated by only one multivariate analysis model are considered suggestive risk factors, while those validated by two or more multivariate analysis models are considered identified risk factors.
In addition, gender and age are common unmodifiable risk factors for AD, so we applied COX regression analysis to conduct subgroup analyses by age. (younger elderly group: < 70 years; older elderly group: ≥ 70 years) [32], gender (male; female), and T status (T+; tau negative, T-). To assess whether the incidence of cognitive decline in the A+ population increases with the number of concurrent risk factors, we conducted the Cochran-Armitage trend test. The Cochran-Armitage trend test was applied to all significant factors in the multifactorial analysis. Multicollinearity was assessed using the variance inflation factor (VIF).
To ensure the robustness of the results, sensitivity analyses and post hoc analyses were conducted as follows: (1) The analyses were repeated for participants with complete data only, since some hadn’t completed risk factor data. (2) The analyses were repeated after adjusting for tau status to determine if tau status influenced the results. (3) Sensitivity analyses were conducted by excluding the 21 participants with cognitive reversion (MCI to CN) to examine whether their inclusion affected the results. (4) The false discovery rate (q value) results from the univariate analysis were provided to mitigate potential bias from the single-variable selection method.
A p-value < 0.05 was considered significant. All analyses were carried out using R version 3.5.1 and SPSS 26.0.
Results
Participant characteristics
A total of 650 A+ participants without dementia were included at baseline. Among them, 272 experienced cognitive diagnostic conversion, while 378 did not. Table 1 presents the baseline information of the participants and the differences in characteristics between the two groups. The study population had an average age of 73.51 ± 6.78 years, with approximately 45% being female. The average years of education were 16.19 ± 2.75, and the mean duration of follow-up was 4.37 ± 2.99 years. Significant differences were observed between the cognitive decline group and the no cognitive decline group in terms of APOE-ε4 carrier status, marital status, history of stroke, gastrointestinal diseases, Parkinsonism, SCD, and GDS.
Table 1.
Basic characteristics of included participants
| Variable | No cognitive decline | cognitive decline | Total | p |
|---|---|---|---|---|
| N | 378 | 272 | 650 | / |
| Age, year, mean [SD] | 73.21 [6.67] | 73.93 [6.91] | 73.51 [6.78] | 0.104‡ |
| Gender, female/male | 81/194 | 114/158 | 297/353 | 0.101† |
| Education, year, mean [SD] | 16.27 [2.75] | 16.08 [2.79] | 16.19 [2.75] | 0.384‡ |
| APOE ε4 carrier, yes (%) | 202 (53.44) | 178 (65.44) | 380 (58.46) | 0.004 † |
| CSF Aβ42, pg/mL, mean [SD] | 765.90 [247.85] | 659.55 [207.98] | 716.35 [236.17] | < 0.001 ‡ |
| CSF p-tau, pg/mL, mean [SD] | 25.85 [13.70] | 34.08 [15.03] | 29.63 [14.90] | < 0.001 ‡ |
| Cognitive composite measures | ||||
| Memory function, mean [SD] | 0.49 [0.94] | -0.49 [0.72] | 0.08 [0.98] | < 0.001 ‡ |
| Executive function, mean [SD] | 0.07 [0.85] | -0.59 [0.90] | -0.21 [0.93] | < 0.001 ‡ |
| MMSE, mean [SD] | 27.34 [2.79] | 24.37 [3.47] | 26.10 [3.42] | < 0.001 ‡ |
| MoCA, mean [SD] | 23.62 [3.68] | 20.12 [4.17] | 22.33 [4.22] | < 0.001 ‡ |
| Vital signs | ||||
| Body weight, kg, mean [SD] | 77.25 [15.81] | 75.75 [14.54] | 76.63 [15.31] | 0.495‡ |
| Body height, cm, mean [SD] | 169.42 [16.90] | 168.89 [10.31] | 169.20 [14.53] | 0.587‡ |
| BMI, kg/m2, mean [SD] | 27.51 [9.72] | 26.43 [4.77] | 27.05 [7.99] | 0.128‡ |
| Systolic pressure, mmHg, mean [SD] | 135.88 [16.35] | 136.45 [18.27] | 136.12 [17.17] | 0.944‡ |
| Diastolic pressure, mmHg, mean [SD] | 75.80 [9.46] | 75.22 [9.32] | 75.56 [9.40] | 0.595‡ |
| Pulse pressure, mmHg, mean [SD] | 60.09 [14.74] | 61.23 [16.21] | 60.56 [15.38] | 0.616‡ |
| Race | 0.071† | |||
| Asian, yes (%) | 2 (0.53) | 4 (1.47) | 6 (0.92) | |
| White, yes (%) | 345 (92.00) | 258 (94.85) | 603 (93.19) | |
| Black, yes (%) | 17 (4.50) | 8 (2.94) | 25 (3.86) | |
| More than one, yes (%) | 11 (2.52) | 2 (0.73) | 13 (2.01) | |
| Participant handedness, right (%) | 341 (90.45) | 246 (92.13) | 587 (91.14) | 0.522† |
| Parental dementia, yes (%) | 236 (62.59) | 155 (58.05) | 495 (76.86) | 0.228† |
| Lifestyle | ||||
| Alcohol abuse, yes (%) | 9 (2.38) | 12 (4.41) | 21 (3.26) | 0.140† |
| Cigarette abuse, yes (%) | 136 (36.07) | 106 (38.97) | 242 (37.58) | 0.363† |
| Drug abuse, yes (%) | 2 (0.53) | 3 (1.10) | 5 (0.78) | 0.400† |
| Marital Status, yes (%) | 0.033 † | |||
| Married | 270 (71.81) | 220 (80.88) | 490 (75.73) | |
| divorced | 38 (10.11) | 19 (6.99) | 57 (8.80) | |
| Widowed | 46 (13.03) | 17 (6.25) | 73 (11.27) | |
| Never married | 22 (5.85) | 6 (2.21) | 28 (4.32) | |
| Retired, yes (%) | 300 (80.43) | 224 (86.49) | 524 (83.04) | 0.054† |
| Clinical diseases | ||||
| Stroke, yes (%) | 2 (0.52) | 7 (2.57) | 9 (1.40) | 0.026 † |
| Hypertension, yes (%) | 185 (49.07) | 125 (45.96) | 310 (48.14) | 0.551† |
| Psychiatric diseases, yes (%) | 126 (33.42) | 95 (34.93) | 221 (34.37) | 0.586† |
| Neurologic diseases (other than AD), yes (%) | 103 (27.32) | 79 (29.04) | 182 (28.26) | 0.543† |
| Otolaryngology diseases, yes (%) | 239 (63.40) | 179 (65.81) | 418 (64.91) | 0.362† |
| Cardiovascular diseases, yes (%) | 248 (65.78) | 172 (63.24) | 420 (65.22) | 0.686† |
| Respiratory diseases, yes (%) | 76 (20.16) | 54 (19.85) | 130 (20.19) | 0.997† |
| Hepatic diseases, yes (%) | 16 (4.24) | 8 (2.94) | 24 (3.73) | 0.407† |
| Dermatologic-Connective Tissue diseases, yes (%) | 129 (34.22) | 88 (32.35) | 217 (33.69) | 0.721† |
| Musculoskeletal diseases, yes (%) | 260 (68.97) | 185 (68.01) | 445 (69.10) | 0.970† |
| Endocrine-Metabolic diseases, yes (%) | 165 (44.50) | 104 (38.24) | 269 (41.77) | 0.212† |
| Gastrointestinal diseases, yes (%) | 189 (50.01) | 113 (41.54) | 302 (46.89) | 0.047 † |
| Hematopoietic-Lymphatic diseases, yes (%) | 39 (10.34) | 23 (8.45) | 62 (9.63) | 0.457† |
| Urinary disease, yes (%) | 159 (42.17) | 117 (43.01) | 276 (42.86) | 0.699† |
| Allergies or Drug Sensitivities, yes (%) | 158 (41.90) | 106 (38.97) | 264 (40.37) | 0.556† |
| Malignancy diseases, yes (%) | 91 (24.13) | 65 (23.90) | 156 (24.22) | 0.967† |
| Major Surgical Procedures, yes (%) | 283 (75.10) | 193 (70.90) | 476 (73.91) | 0.396† |
| Parkinsonism, yes (%) | 0 (0.00) | 3 (1.10) | 3 (0.64) | < 0.001 † |
| Subjective cognitive decline, yes (%) | 236 (62.59) | 216 (79.41) | 452 (69.54) | < 0.001 † |
| Significant Visual Impairment, yes (%) | 23 (0.53) | 11 (4.12) | 33 (5.12) | 0.179† |
| Significant Auditory Impairment, yes (%) | 33 (0.88) | 26 (9.74) | 59 (9.16) | 0.677† |
| Clinical Scale | ||||
| Geriatric Depression Scale, mean [SD] | 1.34 [1.39] | 1.58 [1.39] | 1.44 [1.39] | 0.030 ‡ |
| Hachinski ischemic Scores, mean [SD] | 0.60 [0.65] | 0.63 [0.78] | 0.61 [0.71] | 0.675‡ |
N = number of participants
Bold indicated that the results were statistically significant
Abbreviations: SD, standardized deviation; APOE ε4, apolipoprotein E ε4; Aβ amyloid-β, p-tau phosphorylated tau, BMI, body mass index (calculated as weight in kilograms divided by square of height in meters); CSF, cerebrospinal fluid; AD, Alzheimer’s disease; pg/mL, picograms per milliliter; MMSE, the Mini-Mental State Examination; MoCA, Montreal Cognitive Assessment; kg, kilogram; cm, centimeter; mmHg, millimeters of mercury;
*Intergroup comparisons were tested by t-test
†Intergroup comparisons were tested by chi-square test
‡Intergroup comparisons were tested by the Mann-Whitney U test
Potential risk factors for a cognitive decline in A+ participants
Firstly, 37 potential risk factors were analyzed using a univariate mixed-effects model (Model 1–4). Model 1 showed that diastolic pressure, race, marital status, a history of hypertension, dermatologic-connective tissue diseases, musculoskeletal diseases, depressive disorder, and Hachinski ischemic scores had a significant impact on ADNI-EF2. Model 2 indicated that body weight, BMI, race, marital status, retirement status, the history of dermatologic-connective tissue diseases, hematopoietic-lymphatic diseases, Parkinsonism, and depressive disorder had a significant impact on ADNI-MEM. Model 3 showed that body weight, BMI, race, marital status, retirement status, the history of parental dementia, psychiatric diseases, Parkinsonism, urinary disease, depressive disorder, and major surgical procedures had a significant impact on MMSE. Model 4 showed that BMI, diastolic pressure, race, marital status, retirement status, depressive disorder, history of drug abuse, cardiovascular diseases, allergies or drug sensitivities, and major surgical history had a significant impact on MoCA. Combining the results from Models 1–4, a total of 20 risk factors were screened by the univariate mixed-effects model. For specific details, see Fig. 2 and Supplementary Tables S1-S2. Then, we analyzed these 37 potential risk factors using a univariate COX regression model (Model 5). As shown in Fig. 2 and Supplementary Table S3, there were 11 significant risk factors, consisting of body weight, BMI, race, marital status, retirement status, the histories of alcohol abuse, stroke, hepatic diseases, gastrointestinal diseases, depressive disorder, and Parkinsonism.
Fig. 2.
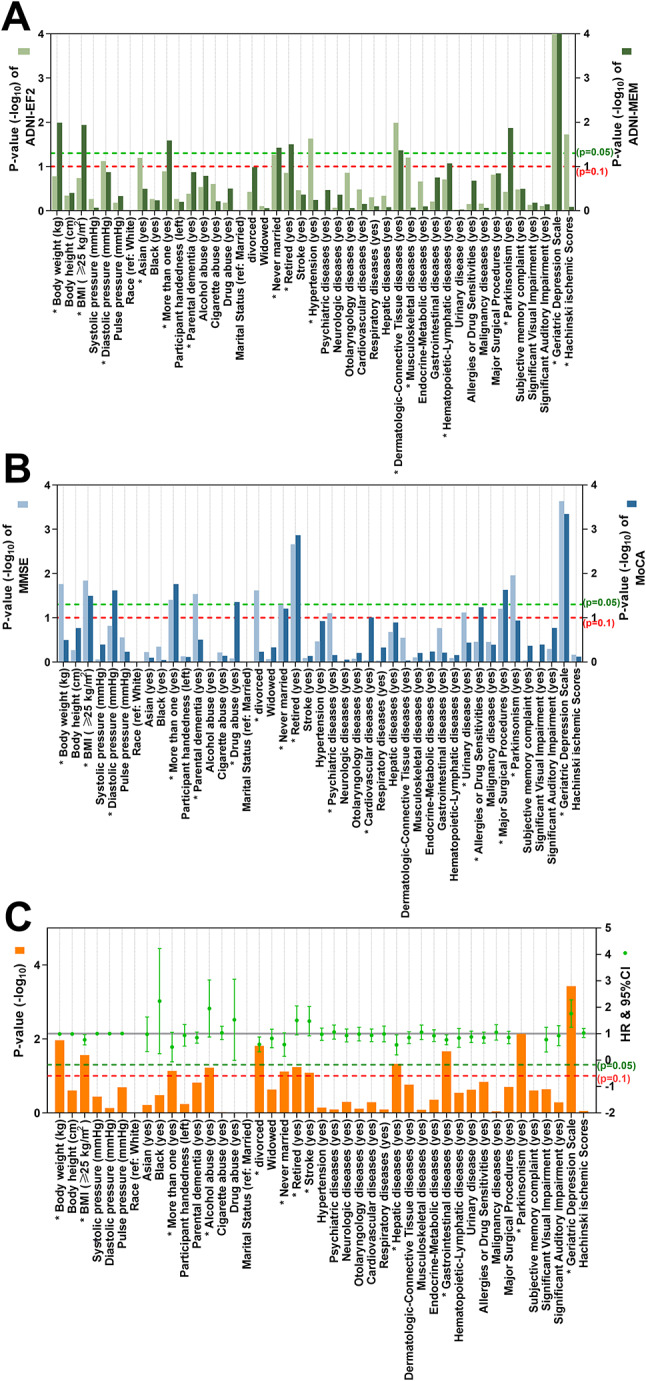
Risk factors for a cognitive decline in A+ participants in univariate analyses. An initial screening was conducted using univariate models for the risk factors that might contribute to a cognitive decline in the A+ population. Univariate mixed-effect models were used to evaluate the temporal associations of the risk factors with ADNI-EF2, and ADNI-MEM scores (A). Univariate mixed-effect models were used to evaluate the temporal associations of the risk factors with overall cognitive performance (MMSE and MoCA) (B.) Univariate COX regression models were carried out to estimate the hazard ratios (HRs) and 95% confidence intervals (CIs) of these risk factors for cognitive diagnosis conversion (C). Age, gender, years of education, APOE-ε4 status, and baseline cognitive status are included as basic covariates. “*” indicated that the results were statistically significant (*p < 0.1). Abbreviations: Aβ, amyloid-β; BMI, body mass index (calculated as weight in kilograms divided by square of height in meters); ADNI-EF2, the ADNI Composite Executive Function 2 score; ADNI-MEM, the ADNI Composite Memory Score; MMSE, Mini-Mental State Examination; MoCA, Montreal Cognitive Assessment
In the second step, we separately incorporated the 20 factors identified from the univariate mixed-effects models and the 11 risk factors identified from the univariate COX regression models into multivariate models for further analysis. Multivariable mixed effects model analysis revealed that the faster decline in ADNI-EF2 scores was associated with low diastolic blood pressure (β = 0.0146; 95% CI: 0 to 0.03; p = 0.0440), no history of dermatologic-connective tissue diseases (β = 0.0188; 95% CI: 0 to 0.03; p = 0.0085), and depression (β = -0.0306; 95% CI: -0.04 to -0.02; p < 0.0001). The faster decline rate of ADNI-MEM scores was linked to low BMI (β = 0.0188; 95% CI: 0 to 0.04; p = 0.0367), a history of drug abuse (β = -0.0214; 95% CI: -0.04 to 0; p = 0.0136), musculoskeletal diseases (β = -0.0187; 95% CI: -0.04 to 0; p = 0.0368), Parkinsonism (β = -0.0227; 95% CI: -0.04 to 0; p = 0.0129), and depression (β = -0.0210; 95% CI: -0.04 to 0; p = 0.0116). The faster decline rate of MMSE scores was related to retired status (β =-0.0297; 95% CI: -0.05 to -0.01; p = 0.0048), a history of urinary disease (β = -0.0240; 95% CI: -0.04 to 0; p = 0.0242;), Parkinsonism (β = -0.0319; 95% CI: -0.06 to -0.01; p = 0.0115) and depression (β = -0.0301; 95% CI: -0.05 to -0.01; p = 0.0029). The accelerated decline of MoCA scores was associated with low BMI (β = 0.0191; 95% CI: 0 to 0.04 p = 0.0306), low diastolic blood pressure (β = 0.0200; 95% CI: 0 to 0.04; p = 0.0214), the history of drug abuse (β = -0.0237; 95% CI: -0.04 to -0.01; p = 0.0113), retired status (β = -0.0269; 95% CI: -0.04 to -0.01; p = 0.0025), without major surgical procedures (β = 0.0183; 95% CI: 0 to 0.04; p = 0.0350) and depressive state (β = -0.0285; 95% CI: -0.04 to -0.01; p = 0.0005). In the multivariate COX regression model, a history of Parkinsonism (HR: 6.55, 95% CI: 1.80 to 23.91, p = 0.0044) and depressive state (HR: 2.38; 95% CI: 1.58 to 3.60; p < 0.0001) remained statistically significant risk factors. More details can be seen in Fig. 3; Tables 2, 3 and 4.
Fig. 3.

Risk factors for a cognitive decline in A+ participants in multivariate analyses. Multivariate models were used to further analyze the significant risk factors (*p < 0.1) found in univariate models. Similarly, multivariate mixed effect models were used to evaluate the temporal associations of the risk factors with ADNI-EF2 (A), ADNI-MEM (B), MMSE (C), and MoCA (D) scores. Multivariate COX regression models were carried out to estimate the hazard ratios (HRs) and 95% confidence intervals (CIs) of these risk factors for cognitive diagnosis conversion (E). Notably, age, gender, years of education, APOE-ε4 status, and baseline cognitive status were adjusted in the multivariate models. Abbreviations: HR, hazard ratio; BMI, body mass index (calculated as weight in kilograms divided by square of height in meters); ADNI-EF2, the ADNI Composite Executive Function 2 score; ADNI-MEM, the ADNI Composite Memory Score; MMSE, Mini-Mental State Examination; MoCA, Montreal Cognitive Assessment; Beta, regression coefficient; HR, hazard ratio
Table 2.
Multivariate mixed-effects model analyses of the temporal associations between executive function/memory function and risk factors
| Factors | Executive function | Memory function | ||||||
|---|---|---|---|---|---|---|---|---|
| β | SE | 95% Cl | p | β | SE | 95% Cl | p | |
| Body weight (kg) | 0.01 | 0.01 | [-0.01, 0.02] | 0.4553 | 0.01 | 0.01 | [0.00, 0.03] | 0.1114 |
| BMI (≥ 25 kg/m 2 ) | 0.01 | 0.01 | [0.00, 0.02] | 0.1637 | 0.02 | 0.01 | [0.00, 0.04] | 0.0367 |
| Diastolic pressure (mmHg) | 0.01 | 0.01 | [0.00, 0.03] | 0.0440 | 0.01 | 0.01 | [-0.01, 0.02] | 0.5205 |
| Race (ref: White) | ||||||||
| Asian (yes) | 0.06 | 0.04 | [-0.02, 0.13] | 0.1330 | 0.01 | 0.05 | [-0.07, 0.10] | 0.7585 |
| Black (yes) | 0.04 | 0.07 | [-0.09, 0.17] | 0.5672 | <-0.01 | 0.10 | [-0.19, 0.19] | 0.9968 |
| More than one (yes) | 0.07 | 0.05 | [-0.03, 0.17] | 0.1594 | 0.07 | 0.05 | [-0.03, 0.17] | 0.1528 |
| Parental dementia (yes) | < 0.01 | 0.01 | [-0.01, 0.02] | 0.5658 | 0.01 | 0.01 | [-0.01, 0.02] | 0.5731 |
| Drug abuse (yes) | < 0.01 | 0.01 | [-0.02, 0.02] | 0.9423 | -0.02 | 0.01 | [-0.04, 0.00] | 0.0136 |
| Marital Status (ref: Married) | ||||||||
| Divorced | <-0.01 | 0.03 | [-0.05, 0.05] | 0.9483 | 0.04 | 0.03 | [-0.02, 0.10] | 0.1758 |
| Widowed | -0.02 | 0.02 | [-0.06, 0.03] | 0.4332 | 0.01 | 0.03 | [-0.05, 0.06] | 0.7974 |
| Never married | 0.05 | 0.04 | [-0.02, 0.12] | 0.1417 | 0.03 | 0.04 | [-0.05, 0.11] | 0.4229 |
| Retired (yes) | -0.02 | 0.01 | [-0.03, 0.00] | 0.0506 | -0.01 | 0.01 | [-0.03, 0.00] | 0.1406 |
| Hypertension (yes) | 0.01 | 0.01 | [0.00, 0.03] | 0.0576 | <-0.01 | 0.01 | [-0.02, 0.01] | 0.7536 |
| Psychiatric diseases (yes) | <-0.01 | 0.01 | [-0.01, 0.01] | 0.9450 | -0.01 | 0.01 | [-0.02, 0.01] | 0.4401 |
| Cardiovascular diseases (yes) | 0.01 | 0.01 | [0.00, 0.02] | 0.1744 | < 0.01 | 0.01 | [-0.02, 0.02] | 0.8774 |
|
Dermatologic-Connective Tissue diseases (yes) |
0.02 | 0.01 | [0.00, 0.03] | 0.0085 | 0.01 | 0.01 | [-0.01, 0.02] | 0.4292 |
| Musculoskeletal diseases (yes) | 0.01 | 0.01 | [-0.01, 0.02] | 0.4430 | -0.02 | 0.01 | [-0.04, 0.00] | 0.0368 |
| Hematopoietic-Lymphatic diseases (yes) | 0.01 | 0.01 | [0.00, 0.02] | 0.1382 | 0.01 | 0.01 | [-0.01, 0.03] | 0.1955 |
| Urinary disease (yes) | <-0.01 | 0.01 | [-0.01, 0.01] | 0.9301 | -0.01 | 0.01 | [-0.03, 0.01] | 0.3469 |
| Allergies or Drug Sensitivities (yes) | <-0.01 | 0.01 | [-0.02, 0.01] | 0.8407 | -0.01 | 0.01 | [-0.02, 0.01] | 0.3987 |
| Major Surgical Procedures (yes) | 0.01 | 0.01 | [-0.01, 0.02] | 0.3284 | 0.01 | 0.01 | [-0.01, 0.03] | 0.1771 |
| Parkinsonism (yes) | -0.01 | 0.01 | [-0.03, 0.01] | 0.3313 | -0.02 | 0.01 | [-0.04, 0.00] | 0.0129 |
| Geriatric Depression Scale | -0.03 | 0.01 | [-0.04, -0.02] | < 0.0001 | -0.02 | 0.01 | [-0.04, 0.00] | 0.0116 |
| Hachinski ischemic Scores | 0.01 | 0.01 | [0.00, 0.03] | 0.0539 | -0.01 | 0.01 | [-0.03, 0.01] | 0.2312 |
Bold indicated that the results were statistically significant (*p < 0.05)
The age, gender, years of education, apolipoprotein Eε4 status, and baseline cognitive status were included as basic covariates
Abbreviations: β, regression coefficient; 95%CI, 95% Confidence Interval; SE, Standard Error; BMI, body mass index (calculated as weight in kilograms divided by square of height in meters); kg, kilogram; cm, centimeter; kg/m2, kilograms per square meter; mmHg, millimeters of mercury
Table 3.
Multivariate mixed-effects model analyses of the temporal associations between MMSE/MoCA and risk factors
| Factors | MMSE | MoCA | ||||||
|---|---|---|---|---|---|---|---|---|
| β | SE | 95% Cl | p | β | SE | 95% Cl | p | |
| Body weight (kg) | 0.01 | 0.01 | [-0.01, 0.03] | 0.2170 | 0.01 | 0.01 | [-0.01, 0.02] | 0.4318 |
| BMI (≥ 25 kg/m 2 ) | 0.01 | 0.01 | [-0.01, 0.04] | 0.1986 | 0.02 | 0.01 | [0.00, 0.04] | 0.0306 |
| Diastolic pressure (mmHg) | 0.01 | 0.01 | [-0.01, 0.03] | 0.3055 | 0.02 | 0.01 | [0.00, 0.04] | 0.0214 |
| Race (ref: White) | ||||||||
| Asian (yes) | 0.03 | 0.06 | [-0.08, 0.14] | 0.5754 | -0.02 | 0.05 | [-0.11, 0.08] | 0.7280 |
| Black (yes) | <-0.01 | 0.13 | [-0.25, 0.24] | 0.9735 | 0.01 | 0.09 | [-0.16, 0.18] | 0.9302 |
| More than one (yes) | 0.07 | 0.06 | [-0.05, 0.18] | 0.2778 | 0.10 | 0.05 | [0.00, 0.21] | 0.0585 |
| Parental dementia (yes) | 0.01 | 0.01 | [-0.01, 0.03] | 0.4393 | < 0.01 | 0.01 | [-0.01, 0.02] | 0.6298 |
| Drug abuse (yes) | <-0.01 | 0.01 | [-0.03, 0.02] | 0.6438 | -0.02 | 0.01 | [-0.04, -0.01] | 0.0113 |
| Marital Status (ref: Married) | ||||||||
| Divorced | 0.05 | 0.03 | [-0.01, 0.12] | 0.1329 | < 0.01 | 0.03 | [-0.06, 0.06] | 0.9595 |
| Widowed | 0.01 | 0.03 | [-0.05, 0.08] | 0.7045 | 0.03 | 0.03 | [-0.03, 0.08] | 0.3165 |
| Never married | 0.04 | 0.05 | [-0.05, 0.13] | 0.3920 | 0.04 | 0.04 | [-0.04, 0.12] | 0.2939 |
| Retired (yes) | -0.03 | 0.01 | [-0.05, -0.01] | 0.0048 | -0.03 | 0.01 | [-0.04, -0.01] | 0.0025 |
| Hypertension (yes) | < 0.01 | 0.01 | [-0.02, 0.02] | 0.8495 | 0.01 | 0.01 | [0.00, 0.03] | 0.1505 |
| Psychiatric diseases (yes) | -0.01 | 0.01 | [-0.04, 0.01] | 0.1599 | < 0.01 | 0.01 | [-0.01, 0.02] | 0.7046 |
| Cardiovascular diseases (yes) | < 0.01 | 0.01 | [-0.02, 0.02] | 0.8146 | 0.02 | 0.01 | [0.00, 0.03] | 0.0815 |
|
Dermatologic-Connective Tissue diseases (yes) |
< 0.01 | 0.01 | [-0.02, 0.02] | 0.6984 | <-0.01 | 0.01 | [-0.02, 0.02] | 0.9776 |
| Musculoskeletal diseases (yes) | -0.01 | 0.01 | [-0.03, 0.01] | 0.3257 | -0.01 | 0.01 | [-0.03, 0.01] | 0.3376 |
| Hematopoietic-Lymphatic diseases (yes) | <-0.01 | 0.01 | [-0.02, 0.02] | 0.7390 | < 0.01 | 0.01 | [-0.01, 0.02] | 0.8210 |
| Urinary disease (yes) | -0.02 | 0.01 | [-0.04, 0.00] | 0.0242 | <-0.01 | 0.01 | [-0.02, 0.01] | 0.5832 |
| Allergies or Drug Sensitivities (yes) | <-0.01 | 0.01 | [-0.03, 0.02] | 0.7050 | -0.01 | 0.01 | [-0.03, 0.00] | 0.1582 |
| Major Surgical Procedures (yes) | 0.02 | 0.01 | [0.00, 0.04] | 0.0510 | 0.02 | 0.01 | [0.00, 0.04] | 0.0350 |
| Parkinsonism (yes) | -0.03 | 0.01 | [-0.06, -0.01] | 0.0115 | -0.02 | 0.01 | [-0.05, 0.01] | 0.1168 |
| Geriatric Depression Scale | -0.03 | 0.01 | [-0.05, -0.01] | 0.0029 | -0.03 | 0.01 | [-0.04, -0.01] | 0.0005 |
| Hachinski ischemic Scores | -0.01 | 0.01 | [-0.03, 0.01] | 0.2119 | < 0.01 | 0.01 | [-0.02, 0.02] | 0.8309 |
Bold indicated that the results were statistically significant (*p < 0.05)
The age, gender, years of education, apolipoprotein Eε4 status, and baseline cognitive status were included as basic covariates
Abbreviations: MMSE, the Mini-Mental State Examination; MoCA, Montreal Cognitive Assessment; β, regression coefficient; 95%CI, 95% Confidence Interval; SE, Standard Error; BMI, body mass index (calculated as weight in kilograms divided by square of height in meters); kg, kilogram; cm, centimeter; kg/m2, kilograms per square meter; mmHg, millimeters of mercury
Table 4.
Multivariate Cox regression analysis of risk factors for cognitive diagnostic conversion
| Factors | HR | β | 95%CI | p |
|---|---|---|---|---|
| Body weight (kg) | 0.99 | -0.01 | [0.98, 1.01] | 0.4328 |
| BMI (≥ 25 kg/m 2 ) | 0.95 | -0.05 | [0.60, 1.51] | 0.8382 |
| Race (ref: White) | ||||
| Asian (yes) | 0.84 | -0.17 | [0.30, 2.40] | 0.7516 |
| Black (yes) | 1.01 | 0.01 | [0.24, 4.29] | 0.9909 |
| More than one (yes) | 0.60 | -0.50 | [0.14, 2.60] | 0.4981 |
| Alcohol abuse (yes) | 1.34 | 0.29 | [0.59, 3.05] | 0.4911 |
| Marital Status (ref: Married) | ||||
| Divorced | 0.91 | -0.09 | [0.49, 1.70] | 0.7683 |
| Widowed | 0.66 | -0.42 | [0.34, 1.26] | 0.2030 |
| Never married | 0.81 | -0.21 | [0.31, 2.13] | 0.6662 |
| Retired (yes) | 1.65 | 0.50 | [0.91, 3.01] | 0.0996 |
| Stroke (yes) | 1.48 | 0.39 | [0.79, 2.78] | 0.2232 |
| Hepatic diseases (yes) | 0.74 | -0.31 | [0.31, 1.73] | 0.4819 |
| Gastrointestinal diseases (yes) | 0.78 | -0.24 | [0.54, 1.13] | 0.1912 |
| Parkinsonism (yes) | 6.55 | 1.88 | [1.80, 23.91] | 0.0044 |
| Geriatric Depression Scale | 2.381 | 0.87 | [1.58, 3.60] | < 0.0001 |
Bold indicated that the results were statistically significant (*p < 0.05)
The age, gender, years of education, apolipoprotein Eε4 status, and baseline cognitive status were included as basic covariates
Abbreviations: HR, hazard ratio; β, regression coefficient; 95%CI, 95% Confidence Interval; BMI, body mass index (calculated as weight in kilograms divided by square of height in meters); kg, kilogram; cm, centimeter; kg/m2, kilograms per square meter; mmHg, millimeters of mercury
Based on the analysis results of the mixed effects model, low BMI, low diastolic blood pressure, retired status, a history of drug abuse, musculoskeletal diseases, urinary disease, Parkinsonism, and depression significantly positively associated with longitudinal cognitive decline. Conversely, a history of dermatologic-connective tissue diseases and major surgical procedures showed a significant negative association. Additionally, the Cox regression model analysis indicated that Parkinsonism and depression increased the risk of cognitive diagnosis conversion. In summary, we concluded from the above results of 5 models that among the 37 potential risk factors, six factors were identified risk factors (low diastolic pressure, low BMI, retired status, a history of drug abuse, depression, and Parkinsonism), and four were suggestive risk factors (a history of urinary disease, musculoskeletal diseases, no major surgical procedures, and no prior dermatologic-connective tissue diseases).
Subgroup analyses and trend test
Subgroup analyses stratified by gender, age, and T status were conducted to examine the differential effects of these variables on the outcomes. In the subgroup analysis by age, a history of Parkinsonism and depression were only significant in the older elderly subgroup. In the subgroup analysis by gender, having a history of Parkinsonism significantly increased the risk of cognitive diagnostic conversion in men, and no significant differences were found in depression status among gender subgroups. In the subgroup analysis by T status, depression was more pronounced in the T- subgroup, while body weight, race, and a history of Parkinsonism were only significant in the T- subgroup. Details are presented in Tables S4-S6. The Cochran-Armitage trend analysis showed that the risk of cognitive decline in A+ subjects increased with the number of concurrent risk factors (p for trend = 0.0005). Details are presented in Fig. 4. We found no multicollinearity in each multivariate model.
Fig. 4.
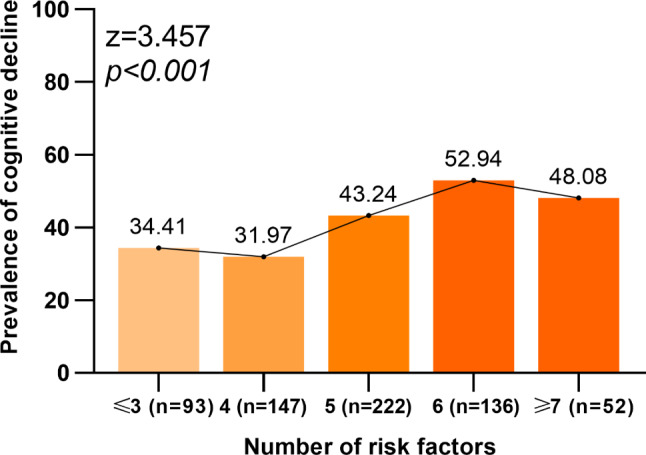
Trend test. The Cochran-Armitage trend analysis showed that the risk of cognitive decline in A+ subjects increased with the number of concurrent risk factors (p for trend = 0.0005)
Sensitivity analyses and post hoc analyses
In the post hoc analysis, after repeating the analysis only for participants with complete data, the results were largely consistent with our main findings. Details are presented in Tables S7-S12. We found that tau status had no significant influence on our results. When we excluded 21 participants with cognitive reversal for the analysis, the sensitivity analysis showed that our results remained robust. Details are presented in Tables S13-S14. The false discovery rate results of the univariate analysis revealed that the primary variables identified in the study remained significant.
Discussion
This large-scale study explores 37 potential risk factors for cognitive decline in A+ non-demented individuals. The study showed ten risk factors, of which six were identified risk factors (low diastolic pressure, low BMI, retired status, a history of drug abuse, Parkinsonism, and depression) and four were suggestive risk factors (a history of urinary disease, musculoskeletal diseases, no major surgical history, and no prior dermatologic-connective tissue diseases). The 10 factors mentioned above were associated with longitudinal cognitive decline, with a history of Parkinsonism and depression linked to both cognitive decline and cognitive diagnosis conversion. Our results will facilitate the formulation of better strategies for the early prevention of AD, thereby contributing to reducing the prevalence of dementia.
The amyloid cascade hypothesis for AD has been well-known in the academic community, in which Aβ peptide deposition is the central event in the pathogenesis of AD [33]. A large number of previous studies have examined the risk factors for AD and dementia [24, 34], whereas only a few studies explored the risk factors for cognitive decline in the A+ but non-demented population. A previous study involving 248 A+ participants showed that advanced age and APOE-ε4 were associated with greater Aβ burden and they were important risk factors for cognitive impairment and decline [35]. A longitudinal observational study demonstrated that APOE-ε4 carriers had faster rates of memory decline than non-carriers in preclinical AD (A+ participants), and advanced age might exacerbate this adverse effect of APOE-ε4 [36]. The above previous studies primarily focused on unmodifiable risk factors such as age and APOE-ε4. However, our observations have identified many modifiable risk factors.
In the study, some basic vital signs were risk factors for cognitive decline in the A+ participants, such as low diastolic blood pressure and low BMI. Previous studies, consistent with our research, indicated that lower diastolic blood pressure was associated with cognitive decline [37]. Mathew et al. also pointed out that higher diastolic blood pressure was associated with better cognitive performance in the absence of elevated systolic blood pressure levels [38]. The possible reason for these results is that higher diastolic blood pressure can prevent cerebral hypoperfusion, thereby achieving better cognitive function. At the same time, the study suggested that in A+ participants, low BMI was associated with a faster decline in ADNI-MEM and MoCA scores. The relationship between BMI and AD risk is complex and appears to vary across different life stages. While midlife obesity is a known risk factor, recent research suggested a potential protective effect of higher BMI in late life [16, 39]. A longitudinal study indicated that overweight/obese individuals with favorable metabolic profiles have a lower risk of AD, with the effect likely driven by Aβ [40]. Jules et al. found a positive correlation between BMI and Aβ42 levels in CSF in subjects with cognitive impairment [41]. One possible explanation for the association between BMI and the risk of AD is that a decline in BMI may reflect systemic worsening frailty, which is associated with brain Aβ deposition [42]. On the other hand, chronic systemic inflammation, caused by low BMI, may aggravate Aβ pathology [43]. Additionally, certain adipokines, such as leptin, may play a key role. Studies have shown that higher levels of leptin in obese populations are associated with better cognitive function [44]. Meanwhile, the impact of BMI on dementia appears to be threshold-dependent. A review found that in late life, the risk of AD decreases when BMI exceeds 27 kg/m². However, this protective effect for vascular dementia (VaD) is absent when BMI surpasses 39 kg/m² [45]. Therefore, future research should further investigate the optimal BMI range for late-life cognitive health.
As for lifestyle risk factors, both retired status and a history of drug abuse were found to be identified risk factors. For retired status, retired participants may engage in fewer social activities, and studies have shown that extensive social interaction was associated with better cognitive function [46]. For drug abuse, there is little literature on drug abuse and cognitive decline. Previous literature has found an association between long-term cannabis application and cognitive dysfunction [47] and smaller hippocampal volumes [48]. However, a study from 2018 found that opioid use was not associated with an increased risk of AD [49]. The specific mechanism is not clear. Drug abuse can be harmful to physical and mental health, including mood disorders, neurocognitive disorders, and cardiovascular and respiratory systems [50, 51], which may make abusers more susceptible to pathological amyloid deposition. Furthermore, dysfunction of the opioid system may be involved in the production of Aβ and hyperphosphorylation of tau [49].
In the study, a history of musculoskeletal diseases and urinary disease were both found to be risk factors. The connection between musculoskeletal diseases and cognitive decline in the A+ participants might be attributed to several underlying mechanisms. Chronic inflammation is a common feature of both musculoskeletal disorders, such as osteoarthritis [52] and myositis, and neurodegenerative diseases. Elevated levels of pro-inflammatory cytokines may inhibit the phagocytosis of Aβ in the brain. Concurrently, the abnormal accumulation of amyloid oligomers can trigger excessive release of pro-inflammatory factors, further exacerbating neuronal damage and cognitive decline [53]. Another aspect to consider is the role of physical activity. Musculoskeletal diseases often lead to reduced mobility and physical inactivity, which are known risk factors for cognitive decline. Exercise training can upregulate the expression of the hippocampal Dicer gene, which may help reduce Aβ accumulation and slow the progression of AD [54]. For urinary disease, previous studies have shown that brain-derived Aβ and tau proteins could be transported to the periphery for clearance, and the kidneys are key organs in this process. Declining kidney function can lead to the accumulation of these neurotoxic substances, further impacting brain health and cognitive function [55, 56].
Our study found that Parkinsonism was associated with a cognitive decline in A+ participants, especially in older men (≥ 70 years). One possible explanation is that serotoninergic system degeneration in Parkinson’s disease (PD) promotes the development of cerebral amyloidosis [57]. Parkinsonism could occur in many diseases, including PD and Lewy body dementia. These diseases are associated with α-synuclein. Another possible explanation for this is that there is a correlation between Aβ load and accumulation of abnormal α-synuclein [58]. Abnormally aggregated α-synuclein may be a synergistic factor between amyloid aggregation [59]. However, some studies suggested the prevalence of amyloid deposition is lower in PD patients with MCI compared to non-PD MCI participants [60]. In our study, there were fewer participants with Parkinsonian symptoms, so this conclusion should be approached with caution. Depression was also a risk factor for cognitive decline in A+ participants. Consistent with our finding, depression has been reported to have associations with Aβ levels and cognition. A study showed that depression accelerated the cognitive decline in A+ MCI patients [61]. Another study of community-dwelling older adults found that participants with depressive symptoms had higher plasma Aβ42 levels than those without depressive symptoms [62]. There are two possible explanations for these associations. First, depressive symptoms may promote the activation of chronic inflammatory pathways, and these inflammatory and pro-inflammatory cytokines are associated with the expression and processing of Aβ precursor proteins [63]. Another possible explanation is that both AD and depression damage 5-hydroxytryptamine systems, which may increase the Aβ burden [64]. With the increase of Aβ-related pathological burden, participants will have cognitive impairment and decline [65].
We have observed that certain risk factors exhibit more significant associations within the T- subgroup. This could potentially be explained as follows: On the one hand, A+/T + is defined as a biological diagnosis of AD, and individuals in this group typically display more typical AD pathological features compared to A+/T- individuals. These characteristics are less likely to be influenced by external factors, thereby reducing the impact of modifiable risk factors on cognitive decline. On the other hand, according to the NIA-AA Research Framework, A+/T- and A+/T + represent a continuum of the disease process. Therefore, differences in the T status subgroup may suggest that various risk factors play different roles at different stages of the AD continuum. Another consideration is that our study focused on non-demented A+ individuals, which inherently constrained the sample composition. Compared to the T- group, the number of T+ samples was relatively smaller. The limited sample size of the T+ subgroup may be related to the lower positivity rate in this subgroup.
Surprisingly, dermatologic-connective tissue diseases and major surgical procedures were found to be protective factors for A+ participants. An observational meta-study finds rheumatoid arthritis is associated with a lower incidence of AD [66]. While another observational study found autoimmune rheumatic diseases increase dementia risk [67]. The results are difficult to interpret, but they may be related to long-term oral anti-inflammatory drugs and hormone therapy, which helped delay Aβ deposition [68]. The potential protective mechanisms of major surgical procedures for A+ patients may include the following: participants undergoing proactive treatments (such as surgical procedures) may reduce the cognitive damage caused by comorbidities or chronic pain. Moreover, successful surgical interventions can enhance mobility and physical activity, thereby improving cognitive function. However, no surgical history was considered only a suggestive risk factor. Future research with larger sample sizes is needed for further validation.
There are several important points to note in the study: (1) Different types of cognitive functions are affected by different risk factors. For example, ADNI-MEM, which represents memory function, was mainly influenced by factors such as low BMI, drug abuse, and Parkinsonism; whereas ADNI-EF2, which represents executive function, was primarily affected by low diastolic blood pressure and a lack of history of skin connective tissue disease. (2) Parkinsonism and depression, both associated with the cognitive diagnosis conversion, also increased the rate of decline in memory-related indicators (ADNI-MEM and MMSE). This finding aligns with the main characteristics of Alzheimer’s disease, which include deteriorating memory function. These results may offer new insights for developing more precise intervention strategies for different populations with cognitive dysfunction.
Some advantages existed in our study. Firstly, the large sample size and the long follow-up period increased the reliability of our study. Secondly, two models were used to assess risk factors for cognitive decline in A+ participants. The generalizability of these results is subject to certain limitations. Firstly, our study is an observational study with unavoidable bias and confounding, so more randomized controlled trials will be needed in the future. Secondly, although our study briefly described the risk factors of cognitive decline in A+ participants and provided clues for the prevention of dementia, more detailed mechanism studies are needed in the future. Third, Aβ pathology is closely related to tau pathology. The study did not assess the effect of tau pathology in detail. Subgroup analyses were conducted for tau content to observe its impact on the results. Fourth, our study only analyzed baseline risk factors; however, changes in risk factors over time are also important. Future research should incorporate a longitudinal analysis of risk factors.
In conclusion, our study identified low diastolic pressure, low BMI, retired status, a history of drug abuse, Parkinsonism, depression, urinary disease, musculoskeletal diseases, as well as no prior dermatologic-connective tissue diseases or major surgical procedures as risk factors for a cognitive decline in A+ participants. The findings of this study will be more targeted to prevent cognitive decline in A+ people and have important implications for future dementia prevention practices.
Electronic supplementary material
Below is the link to the electronic supplementary material.
Acknowledgements
Data collection and sharing for this project was funded by the Alzheimer’s Disease Neuroimaging Initiative (ADNI) (National Institutes of Health Grant U01 AG024904) and DOD ADNI (Department of Defense award number W81XWH-12-2-0012). ADNI is funded by the National Institute on Aging, the National Institute of Biomedical Imaging and Bioengineering, and through generous contributions from the following: AbbVie, Alzheimer’s Association; Alzheimer’s Drug Discovery Foundation; Araclon Biotech; BioClinica, Inc.; Biogen; Bristol-Myers Squibb Company; CereSpir, Inc.; Cogstate; Eisai Inc.; Elan Pharmaceuticals, Inc.; Eli Lilly and Company; EuroImmun; F. Hoffmann-La Roche Ltd and its affiliated company Genentech, Inc.; Fujirebio; GE Healthcare; IXICO Ltd.; Janssen Alzheimer Immunotherapy Research & Development, LLC.; Johnson & Johnson Pharmaceutical Research & Development LLC.; Lumosity; Lundbeck; Merck & Co., Inc.; Meso Scale Diagnostics, LLC.; NeuroRx Research; Neurotrack Technologies; Novartis Pharmaceuticals Corporation; Pfizer Inc.; Piramal Imaging; Servier; Takeda Pharmaceutical Company; and Transition Therapeutics. The Canadian Institutes of Health Research is providing funds to support ADNI clinical sites in Canada. Private sector contributions are facilitated by the Foundation for the National Institutes of Health (www.fnih.org). The grantee organization is the Northern California Institute for Research and Education, and the study is coordinated by the Alzheimer’s Therapeutic Research Institute at the University of Southern California. ADNI data are disseminated by the Laboratory for Neuro Imaging at the University of Southern California.
Abbreviations
- AD
Alzheimer’s disease
- Aβ
Amyloid-beta
- A+
Amyloid-beta-positive
- T+
Tau positivity
- ADNI
The Alzheimer’s Disease Neuroimaging Initiative
- PET
Positron emission tomography
- CN
Cognitively normal
- MCI
Mild cognitive impairment
- ADNI-MEM
ADNI Composite Memory Score
- ADNI-EF2
ADNI Composite Executive Function 2 Score
- HRs
Hazard ratios
- GDS
The Geriatric Depression Scale
- HIS
Hachinski Ischemic Scale
- SCD
Subjective cognitive decline
- CSF
Cerebrospinal fluid
- MMSE
Mini-Mental State Examination
- MoCA
Montreal Cognitive Assessment
Author contributions
H.H. concepted and designed the study, analyzed the data, and drafted the manuscript. L.T. concepted and designed the study, and drafted the manuscript. A.Y.W. extracted, analyzed and interpreted the data, and drafted the manuscript. H.Y.H. analyzed the data and drafted the manuscript. L.Y.H. extracted and analyzed the data. C.Y.X. analyzed the data. Q.Y.L analyzed the data. All authors have contributed to the manuscript writing and revision. All authors reviewed the manuscript.
Funding
This work was supported by grants from the National Natural Science Foundation of China (81971032, 82271475, and 82201587). The funding sources had no role in the design and conduct of the study; collection, management, analysis, and interpretation of the data; preparation, review, or approval of the manuscript; and decision to submit the manuscript for publication.
Data availability
The datasets supporting the conclusions of this article are available in the publicly available ADNI database. The datasets used and/or analyzed during the current study are available from the corresponding author on reasonable request.
Declarations
Ethics approval and consent to participate
The study procedures were approved by the institutional review boards of all participating centres (http://adni.loni.usc.edu/wp-content/uploads/how_to_apply/ADNI_Acknowledgement_List.pdf), and written informed consent was obtained from all participants or their authorised representatives according to the Declaration of Helsinki (consent for research). Ethics approval was obtained from the institutional review boards of each institution involved: Oregon Health and Science University; University of Southern California; University of California—San Diego; University of Michigan; Mayo Clinic, Rochester; Baylor College of Medicine; Columbia University Medical Center; Washington University, St. Louis; University of Alabama at Birmingham; Mount Sinai School of Medicine; Rush University Medical Center; Wien Center; Johns Hopkins University; New York University; Duke University Medical Center; University of Pennsylvania; University of Kentucky; University of Pittsburgh; University of Rochester Medical Center; University of California, Irvine; University of Texas Southwestern Medical School; Emory University; University of Kansas, Medical Center; University of California, Los Angeles; Mayo Clinic, Jacksonville; Indiana University; Yale University School of Medicine; McGill University, Montreal-Jewish General Hospital; Sunnybrook Health Sciences, Ontario; U.B.C. Clinic for AD & Related Disorders; Cognitive Neurology—St. Joseph’s, Ontario; Cleveland Clinic Lou Ruvo Center for Brain Health; Northwestern University; Premiere Research Inst (Palm Beach Neurology); Georgetown University Medical Center; Brigham and Women’s Hospital; Stanford University; Banner Sun Health Research Institute; Boston University; Howard University; Case Western Reserve University; University of California, Davis—Sacramento; Neurological Care of CNY; Parkwood Hospital; University of Wisconsin; University of California, Irvine—BIC; Banner Alzheimer’s Institute; Dent Neurologic Institute; Ohio State University; Albany Medical College; Hartford Hospital, Olin Neuropsychiatry Research Center; Dartmouth-Hitchcock Medical Center; Wake Forest University Health Sciences; Rhode Island Hospital; Butler Hospital; UC San Francisco; Medical University South Carolina; St. Joseph’s Health Care Nathan Kline Institute; University of Iowa College of Medicine; Cornell University and University of South Florida: USF Health Byrd Alzheimer’s Institute. The investigators within the ADNI contributed to the design and implementation of the ADNI and/or provided data but did not participate in analysis or writing of this report. A complete listing of ADNI investigators can be found online (http://adni.loni.usc.edu/wp-content/uploads/how_to_apply/ADNI_Acknowledgement_List.pdf).
Consent for publication
Not applicable.
Competing interests
The authors declare no competing interests.
Footnotes
Publisher’s Note
Springer Nature remains neutral with regard to jurisdictional claims in published maps and institutional affiliations.
Contributor Information
Lan Tan, Email: dr.tanlan@163.com.
Hao Hu, Email: qingdaoshennei@163.com.
References
- 1.Estimation of the global prevalence of dementia. In 2019 and forecasted prevalence in 2050: an analysis for the global burden of Disease Study 2019. Lancet Public Health. 2022;7(2):e105–25. 10.1016/S2468-2667(21)00249-8 [DOI] [PMC free article] [PubMed] [Google Scholar]
- 2.Lane CA, Hardy J, Schott JM. Alzheimer’s disease. Eur J Neurol. 2018;25(1):59–70. 10.1111/ene.13439 [DOI] [PubMed] [Google Scholar]
- 3.Jia L, Quan M, Fu Y, Zhao T, Li Y, Wei C, et al. Dementia in China: epidemiology, clinical management, and research advances. Lancet Neurol. 2020;19(1):81–92. 10.1016/S1474-4422(19)30290-X [DOI] [PubMed] [Google Scholar]
- 4.Global regional, national burden of neurological disorders. 1990–2016: a systematic analysis for the global burden of Disease Study 2016. Lancet Neurol. 2019;18(5):459–80. 10.1016/S1474-4422(18)30499-X [DOI] [PMC free article] [PubMed] [Google Scholar]
- 5.Montine TJ, Phelps CH, Beach TG, Bigio EH, Cairns NJ, Dickson DW, et al. National Institute on Aging-Alzheimer’s Association guidelines for the neuropathologic assessment of Alzheimer’s disease: a practical approach. Acta Neuropathol. 2012;123(1):1–11. 10.1007/s00401-011-0910-3 [DOI] [PMC free article] [PubMed] [Google Scholar]
- 6.Thal DR, Walter J, Saido TC, Fändrich M. Neuropathology and biochemistry of Aβ and its aggregates in Alzheimer’s disease. Acta Neuropathol. 2015;129(2):167–82. 10.1007/s00401-014-1375-y [DOI] [PubMed] [Google Scholar]
- 7.Scheltens P, De Strooper B, Kivipelto M, Holstege H, Chételat G, Teunissen CE, et al. Alzheimer’s disease. Lancet. 2021;397(10284):1577–90. 10.1016/S0140-6736(20)32205-4 [DOI] [PMC free article] [PubMed] [Google Scholar]
- 8.Aisen PS, Cummings J, Jack CR Jr., Morris JC, Sperling R, Frölich L, et al. On the path to 2025: understanding the Alzheimer’s disease continuum. Alzheimers Res Ther. 2017;9(1):60. 10.1186/s13195-017-0283-5 [DOI] [PMC free article] [PubMed] [Google Scholar]
- 9.Nabers A, Perna L, Lange J, Mons U, Schartner J, Güldenhaupt J et al. Amyloid blood biomarker detects Alzheimer’s disease. EMBO Mol Med. 2018;10(5). [DOI] [PMC free article] [PubMed]
- 10.Jack CR Jr., Bennett DA, Blennow K, Carrillo MC, Dunn B, Haeberlein SB, et al. NIA-AA Research Framework: toward a biological definition of Alzheimer’s disease. Alzheimers Dement. 2018;14(4):535–62. 10.1016/j.jalz.2018.02.018 [DOI] [PMC free article] [PubMed] [Google Scholar]
- 11.Roe CM, Fagan AM, Grant EA, Hassenstab J, Moulder KL, Maue Dreyfus D, et al. Amyloid imaging and CSF biomarkers in predicting cognitive impairment up to 7.5 years later. Neurology. 2013;80(19):1784–91. 10.1212/WNL.0b013e3182918ca6 [DOI] [PMC free article] [PubMed] [Google Scholar]
- 12.Soldan A, Pettigrew C, Cai Q, Wang MC, Moghekar AR, O’Brien RJ, et al. Hypothetical preclinical Alzheimer Disease groups and Longitudinal Cognitive Change. JAMA Neurol. 2016;73(6):698–705. 10.1001/jamaneurol.2016.0194 [DOI] [PMC free article] [PubMed] [Google Scholar]
- 13.Dominguez LJ, Veronese N, Vernuccio L, Catanese G, Inzerillo F, Salemi G et al. Nutrition, Physical Activity, and other Lifestyle factors in the Prevention of Cognitive decline and Dementia. Nutrients. 2021;13(11). [DOI] [PMC free article] [PubMed]
- 14.Campbell NL, Unverzagt F, LaMantia MA, Khan BA, Boustani MA. Risk factors for the progression of mild cognitive impairment to dementia. Clin Geriatr Med. 2013;29(4):873–93. 10.1016/j.cger.2013.07.009 [DOI] [PMC free article] [PubMed] [Google Scholar]
- 15.Crous-Bou M, Minguillón C, Gramunt N, Molinuevo JL. Alzheimer’s disease prevention: from risk factors to early intervention. Alzheimers Res Ther. 2017;9(1):71. 10.1186/s13195-017-0297-z [DOI] [PMC free article] [PubMed] [Google Scholar]
- 16.Xu W, Tan L, Wang HF, Jiang T, Tan MS, Tan L, et al. Meta-analysis of modifiable risk factors for Alzheimer’s disease. J Neurol Neurosurg Psychiatry. 2015;86(12):1299–306. [DOI] [PubMed] [Google Scholar]
- 17.Ge T, Sabuncu MR, Smoller JW, Sperling RA, Mormino EC. Dissociable influences of APOE ε4 and polygenic risk of AD dementia on amyloid and cognition. Neurology. 2018;90(18):e1605–12. 10.1212/WNL.0000000000005415 [DOI] [PMC free article] [PubMed] [Google Scholar]
- 18.Chau E, Kim JR. α-synuclein-assisted oligomerization of β-amyloid (1–42). Arch Biochem Biophys. 2022;717:109120. 10.1016/j.abb.2022.109120 [DOI] [PMC free article] [PubMed] [Google Scholar]
- 19.Aisen PS, Petersen RC, Donohue MC, Gamst A, Raman R, Thomas RG, et al. Clinical core of the Alzheimer’s Disease Neuroimaging Initiative: progress and plans. Alzheimers Dement. 2010;6(3):239–46. 10.1016/j.jalz.2010.03.006 [DOI] [PMC free article] [PubMed] [Google Scholar]
- 20.Shaw LM, Vanderstichele H, Knapik-Czajka M, Clark CM, Aisen PS, Petersen RC, et al. Cerebrospinal fluid biomarker signature in Alzheimer’s disease neuroimaging initiative subjects. Ann Neurol. 2009;65(4):403–13. 10.1002/ana.21610 [DOI] [PMC free article] [PubMed] [Google Scholar]
- 21.Elman JA, Panizzon MS, Gustavson DE, Franz CE, Sanderson-Cimino ME, Lyons MJ, et al. Amyloid-β positivity predicts cognitive decline but Cognition predicts progression to Amyloid-β positivity. Biol Psychiatry. 2020;87(9):819–28. 10.1016/j.biopsych.2019.12.021 [DOI] [PMC free article] [PubMed] [Google Scholar]
- 22.Landau SM, Breault C, Joshi AD, Pontecorvo M, Mathis CA, Jagust WJ, et al. Amyloid-β imaging with Pittsburgh compound B and florbetapir: comparing radiotracers and quantification methods. J Nucl Med. 2013;54(1):70–7. 10.2967/jnumed.112.109009 [DOI] [PMC free article] [PubMed] [Google Scholar]
- 23.Araque Caballero M, Brendel M, Delker A, Ren J, Rominger A, Bartenstein P, et al. Mapping 3-year changes in gray matter and metabolism in Aβ-positive nondemented subjects. Neurobiol Aging. 2015;36(11):2913–24. 10.1016/j.neurobiolaging.2015.08.007 [DOI] [PMC free article] [PubMed] [Google Scholar]
- 24.Silva MVF, Loures CMG, Alves LCV, de Souza LC, Borges KBG, Carvalho MDG. Alzheimer’s disease: risk factors and potentially protective measures. J Biomed Sci. 2019;26(1):33. 10.1186/s12929-019-0524-y [DOI] [PMC free article] [PubMed] [Google Scholar]
- 25.Meyer PF, Pichet Binette A, Gonneaud J, Breitner JCS, Villeneuve S. Characterization of Alzheimer Disease Biomarker discrepancies using Cerebrospinal Fluid Phosphorylated Tau and AV1451 Positron Emission Tomography. JAMA Neurol. 2020;77(4):508–16. 10.1001/jamaneurol.2019.4749 [DOI] [PMC free article] [PubMed] [Google Scholar]
- 26.Dodge HH, Zhu J, Harvey D, Saito N, Silbert LC, Kaye JA, et al. Biomarker progressions explain higher variability in stage-specific cognitive decline than baseline values in Alzheimer disease. Alzheimers Dement. 2014;10(6):690–703. 10.1016/j.jalz.2014.04.513 [DOI] [PMC free article] [PubMed] [Google Scholar]
- 27.Gibbons LE, Carle AC, Mackin RS, Harvey D, Mukherjee S, Insel P, et al. A composite score for executive functioning, validated in Alzheimer’s Disease Neuroimaging Initiative (ADNI) participants with baseline mild cognitive impairment. Brain Imaging Behav. 2012;6(4):517–27. 10.1007/s11682-012-9176-1 [DOI] [PMC free article] [PubMed] [Google Scholar]
- 28.Crane PK, Carle A, Gibbons LE, Insel P, Mackin RS, Gross A, et al. Development and assessment of a composite score for memory in the Alzheimer’s Disease Neuroimaging Initiative (ADNI). Brain Imaging Behav. 2012;6(4):502–16. 10.1007/s11682-012-9186-z [DOI] [PMC free article] [PubMed] [Google Scholar]
- 29.Molgaard CA. Multivariate analysis of Hachinski’s scale for discriminating senile dementia of the Alzheimer’s type from multiinfarct dementia. Neuroepidemiology. 1987;6(3):153–60. 10.1159/000110111 [DOI] [PubMed] [Google Scholar]
- 30.Lebedeva A, Westman E, Lebedev AV, Li X, Winblad B, Simmons A, et al. Structural brain changes associated with depressive symptoms in the elderly with Alzheimer’s disease. J Neurol Neurosurg Psychiatry. 2014;85(8):930–5. 10.1136/jnnp-2013-307110 [DOI] [PubMed] [Google Scholar]
- 31.Wen C, Hu H, Ou YN, Bi YL, Ma YH, Tan L, et al. Risk factors for subjective cognitive decline: the CABLE study. Transl Psychiatry. 2021;11(1):576. 10.1038/s41398-021-01711-1 [DOI] [PMC free article] [PubMed] [Google Scholar]
- 32.Bürger née Buch K, Padberg F, Nolde T, Teipel SJ, Stübner S, Haslinger A, et al. Cerebrospinal fluid tau protein shows a better discrimination in young old (< 70 years) than in old old patients with Alzheimer’s disease compared with controls. Neurosci Lett. 1999;277(1):21–4. 10.1016/S0304-3940(99)00845-9 [DOI] [PubMed] [Google Scholar]
- 33.Hardy JA, Higgins GA. Alzheimer’s disease: the amyloid cascade hypothesis. Science. 1992;256(5054):184–5. 10.1126/science.1566067 [DOI] [PubMed] [Google Scholar]
- 34.Tahami Monfared AA, Byrnes MJ, White LA, Zhang Q. Alzheimer’s Disease: Epidemiology and Clinical Progression. Neurol Ther. 2022;11(2):553–69. 10.1007/s40120-022-00338-8 [DOI] [PMC free article] [PubMed] [Google Scholar]
- 35.Tosun D, Demir Z, Veitch DP, Weintraub D, Aisen P, Jack CR Jr., et al. Contribution of Alzheimer’s biomarkers and risk factors to cognitive impairment and decline across the Alzheimer’s disease continuum. Alzheimers Dement. 2022;18(7):1370–82. 10.1002/alz.12480 [DOI] [PMC free article] [PubMed] [Google Scholar]
- 36.Lim YY, Kalinowski P, Pietrzak RH, Laws SM, Burnham SC, Ames D, et al. Association of β-Amyloid and apolipoprotein E ε4 with memory decline in preclinical Alzheimer Disease. JAMA Neurol. 2018;75(4):488–94. 10.1001/jamaneurol.2017.4325 [DOI] [PMC free article] [PubMed] [Google Scholar]
- 37.Yano Y, Griswold M, Wang W, Greenland P, Lloyd-Jones DM, Heiss G, et al. Long-term blood pressure level and variability from midlife to later life and subsequent cognitive change: the ARIC Neurocognitive Study. J Am Heart Assoc. 2018;7(15):e009578. 10.1161/JAHA.118.009578 [DOI] [PMC free article] [PubMed] [Google Scholar]
- 38.Mathew A, Mesa RA, Nahodyl L, Tremblay J, Rundek T, Zeki Al Hazzouri A, et al. Diastolic blood pressure and cognitive functioning: differences by systolic blood pressure among US adults. Am J Alzheimers Dis Other Demen. 2023;38:15333175231172283. 10.1177/15333175231172283 [DOI] [PMC free article] [PubMed] [Google Scholar]
- 39.Buchman AS, Wilson RS, Bienias JL, Shah RC, Evans DA, Bennett DA. Change in body mass index and risk of incident Alzheimer disease. Neurology. 2005;65(6):892–7. 10.1212/01.wnl.0000176061.33817.90 [DOI] [PubMed] [Google Scholar]
- 40.Ma LZ, Huang YY, Wang ZT, Li JQ, Hou XH, Shen XN, et al. Metabolically healthy obesity reduces the risk of Alzheimer’s disease in elders: a longitudinal study. Aging. 2019;11(23):10939–51. 10.18632/aging.102496 [DOI] [PMC free article] [PubMed] [Google Scholar]
- 41.Mathys J, Gholamrezaee M, Henry H, von Gunten A, Popp J. Decreasing body mass index is associated with cerebrospinal fluid markers of Alzheimer’s pathology in MCI and mild dementia. Exp Gerontol. 2017;100:45–53. 10.1016/j.exger.2017.10.013 [DOI] [PubMed] [Google Scholar]
- 42.Maltais M, De Souto Barreto P, Hooper C, Payoux P, Rolland Y, Vellas B. Association between Brain β-Amyloid and Frailty in older adults. J Gerontol Biol Sci Med Sci. 2019;74(11):1747–52. 10.1093/gerona/glz009 [DOI] [PubMed] [Google Scholar]
- 43.Oberlin LE, Erickson KI, Mackey R, Klunk WE, Aizenstein H, Lopresti BJ, et al. Peripheral inflammatory biomarkers predict the deposition and progression of amyloid-β in cognitively unimpaired older adults. Brain Behav Immun. 2021;95:178–89. 10.1016/j.bbi.2021.03.015 [DOI] [PMC free article] [PubMed] [Google Scholar]
- 44.Lee EB. Obesity, leptin, and Alzheimer’s disease. Ann N Y Acad Sci. 2011;1243:15–29. 10.1111/j.1749-6632.2011.06274.x [DOI] [PMC free article] [PubMed] [Google Scholar]
- 45.Qu Y, Hu HY, Ou YN, Shen XN, Xu W, Wang ZT, et al. Association of body mass index with risk of cognitive impairment and dementia: a systematic review and meta-analysis of prospective studies. Neurosci Biobehav Rev. 2020;115:189–98. 10.1016/j.neubiorev.2020.05.012 [DOI] [PubMed] [Google Scholar]
- 46.Fu C, Li Z, Mao Z. Association between Social activities and cognitive function among the Elderly in China: a cross-sectional study. Int J Environ Res Public Health. 2018;15(2). [DOI] [PMC free article] [PubMed]
- 47.Grassi MP, Perin C, Clerici F, Zocchetti C, Borella M, Cargnel A, et al. Effects of HIV seropositivity and drug abuse on cognitive function. Eur Neurol. 1997;37(1):48–52. 10.1159/000117405 [DOI] [PubMed] [Google Scholar]
- 48.Meier MH, Caspi A, A RK, Hall W, Ambler A, Harrington H, et al. Long-term Cannabis Use and Cognitive reserves and hippocampal volume in midlife. Am J Psychiatry. 2022;179(5):362–74. 10.1176/appi.ajp.2021.21060664 [DOI] [PMC free article] [PubMed] [Google Scholar]
- 49.Taipale H, Hamina A, Lampela P, Tanskanen A, Tiihonen J, Karttunen N, et al. Is Alzheimer’s Disease Associated with previous opioid use? Pain Med. 2018;19(11):2115–21. 10.1093/pm/pnx210 [DOI] [PubMed] [Google Scholar]
- 50.Karila L, Roux P, Rolland B, Benyamina A, Reynaud M, Aubin HJ, et al. Acute and long-term effects of cannabis use: a review. Curr Pharm Des. 2014;20(25):4112–8. 10.2174/13816128113199990620 [DOI] [PubMed] [Google Scholar]
- 51.Kodidela S, Gerth K, Haque S, Gong Y, Ismael S, Singh A et al. Extracellular Vesicles: A Possible Link between HIV and Alzheimer’s Disease-Like Pathology in HIV Subjects? Cells. 2019;8(9). [DOI] [PMC free article] [PubMed]
- 52.Umoh IO, Dos Reis HJ, de Oliveira ACP. Molecular Mechanisms Linking Osteoarthritis and Alzheimer’s Disease: Shared Pathways, Mechanisms and Breakthrough Prospects. Int J Mol Sci. 2024;25(5). [DOI] [PMC free article] [PubMed]
- 53.Stamouli EC, Politis AM. [Pro-inflammatory cytokines in Alzheimer’s disease]. Psychiatriki. 2016;27(4):264–75. 10.22365/jpsych.2016.274.264 [DOI] [PubMed] [Google Scholar]
- 54.Dungan CM, Valentino T, Vechetti IJ Jr., Zdunek CJ, Murphy MP, Lin AL, et al. Exercise-mediated alteration of hippocampal dicer mRNA and miRNAs is associated with lower BACE1 gene expression and Aβ(1–42) in female 3xTg-AD mice. J Neurophysiol. 2020;124(6):1571–7. 10.1152/jn.00503.2020 [DOI] [PMC free article] [PubMed] [Google Scholar]
- 55.Sun HL, Yao XQ, Lei L, Jin WS, Bai YD, Zeng GH, et al. Associations of blood and cerebrospinal fluid Aβ and tau levels with renal function. Mol Neurobiol. 2023;60(9):5343–51. 10.1007/s12035-023-03420-w [DOI] [PubMed] [Google Scholar]
- 56.Tian DY, Cheng Y, Zhuang ZQ, He CY, Pan QG, Tang MZ, et al. Physiological clearance of amyloid-beta by the kidney and its therapeutic potential for Alzheimer’s disease. Mol Psychiatry. 2021;26(10):6074–82. 10.1038/s41380-021-01073-6 [DOI] [PubMed] [Google Scholar]
- 57.Kotagal V, Bohnen NI, Müller ML, Koeppe RA, Frey KA, Albin RL. Cerebral amyloid deposition and serotoninergic innervation in Parkinson disease. Arch Neurol. 2012;69(12):1628–31. 10.1001/archneurol.2012.764 [DOI] [PMC free article] [PubMed] [Google Scholar]
- 58.Lashley T, Holton JL, Gray E, Kirkham K, O’Sullivan SS, Hilbig A, et al. Cortical alpha-synuclein load is associated with amyloid-beta plaque burden in a subset of Parkinson’s disease patients. Acta Neuropathol. 2008;115(4):417–25. 10.1007/s00401-007-0336-0 [DOI] [PubMed] [Google Scholar]
- 59.Compta Y, Parkkinen L, O’Sullivan SS, Vandrovcova J, Holton JL, Collins C, et al. Lewy- and Alzheimer-type pathologies in Parkinson’s disease dementia: which is more important? Brain. 2011;134(Pt 5):1493–505. 10.1093/brain/awr031 [DOI] [PMC free article] [PubMed] [Google Scholar]
- 60.Petrou M, Dwamena BA, Foerster BR, MacEachern MP, Bohnen NI, Müller ML, et al. Amyloid deposition in Parkinson’s disease and cognitive impairment: a systematic review. Mov Disord. 2015;30(7):928–35. 10.1002/mds.26191 [DOI] [PMC free article] [PubMed] [Google Scholar]
- 61.Brendel M, Pogarell O, Xiong G, Delker A, Bartenstein P, Rominger A. Depressive symptoms accelerate cognitive decline in amyloid-positive MCI patients. Eur J Nucl Med Mol Imaging. 2015;42(5):716–24. 10.1007/s00259-014-2975-4 [DOI] [PMC free article] [PubMed] [Google Scholar]
- 62.Moon YS, Kang SH, No HJ, Won MH, Ki SB, Lee SK, et al. The correlation of plasma Aβ42 levels, depressive symptoms, and cognitive function in the Korean elderly. Prog Neuropsychopharmacol Biol Psychiatry. 2011;35(7):1603–6. 10.1016/j.pnpbp.2011.05.013 [DOI] [PubMed] [Google Scholar]
- 63.Hermida AP, McDonald WM, Steenland K, Levey A. The association between late-life depression, mild cognitive impairment and dementia: is inflammation the missing link? Expert Rev Neurother. 2012;12(11):1339–50. 10.1586/ern.12.127 [DOI] [PMC free article] [PubMed] [Google Scholar]
- 64.Hasan SMN, Clarke C, Strand T, Bambico FR. Putative pathological mechanisms of late-life depression and Alzheimer’s disease. Brain Res. 2023;1813:148423. 10.1016/j.brainres.2023.148423 [DOI] [PubMed] [Google Scholar]
- 65.Lim YY, Maruff P, Pietrzak RH, Ellis KA, Darby D, Ames D, et al. Aβ and cognitive change: examining the preclinical and prodromal stages of Alzheimer’s disease. Alzheimers Dement. 2014;10(6):743–e511. 10.1016/j.jalz.2013.11.005 [DOI] [PubMed] [Google Scholar]
- 66.Policicchio S, Ahmad AN, Powell JF, Proitsi P. Rheumatoid arthritis and risk for Alzheimer’s disease: a systematic review and meta-analysis and a mendelian randomization study. Sci Rep. 2017;7(1):12861. 10.1038/s41598-017-13168-8 [DOI] [PMC free article] [PubMed] [Google Scholar]
- 67.Lin TM, Chen WS, Sheu JJ, Chen YH, Chen JH, Chang CC. Autoimmune rheumatic diseases increase dementia risk in middle-aged patients: a nationwide cohort study. PLoS ONE. 2018;13(1):e0186475. 10.1371/journal.pone.0186475 [DOI] [PMC free article] [PubMed] [Google Scholar]
- 68.Lim GP, Yang F, Chu T, Chen P, Beech W, Teter B, et al. Ibuprofen suppresses plaque pathology and inflammation in a mouse model for Alzheimer’s disease. J Neurosci. 2000;20(15):5709–14. 10.1523/JNEUROSCI.20-15-05709.2000 [DOI] [PMC free article] [PubMed] [Google Scholar]
Associated Data
This section collects any data citations, data availability statements, or supplementary materials included in this article.
Supplementary Materials
Data Availability Statement
The datasets supporting the conclusions of this article are available in the publicly available ADNI database. The datasets used and/or analyzed during the current study are available from the corresponding author on reasonable request.