Abstract
While eukaryotic Argonautes and long prokaryotic Argonautes (pAgos) cleave nucleic acids, some short pAgos lack nuclease activity and hydrolyze NAD(P)+ to induce bacterial cell death1. We present a hierarchical activation pathway for SPARTA, a short pAgo consisting of an Ago protein and an associated protein TIR-APAZ2. SPARTA progresses through distinct oligomeric forms, including a monomeric apo state, a monomeric RNA/DNA-bound state, two dimeric RNA/DNA-bound states, and a tetrameric RNA/DNA-bound active state. These snapshots together identify oligomerization as a mechanistic principle of SPARTA activation. Apo SPARTA is inactive, its RNA/DNA-binding channel occupied an auto-inhibitory motif in TIR-APAZ. Upon RNA/DNA binding, SPARTA transitions from a monomer to a symmetric and then an asymmetric dimer, in which two TIR domains interact via charge and shape complementarity. Next, two dimers assemble into a tetramer with a central TIR cluster responsible for hydrolyzing NAD(P)+. Additionally, we observed unique features of SPARTA-RNA/DNA interactions, including competition between the DNA 3’ end and the auto-inhibitory motif, interactions between the RNA G2 nucleotide and Ago, and splaying of the RNA-DNA duplex by two loops exclusive to short pAgos. Together, our findings contribute a mechanistic basis for the activation of short pAgos, a large section of the Ago superfamily.
Argonaute systems (Agos) govern many biological processes in all domains of life3–5. Eukaryotic Agos (eAgos) are composed of an N domain, an L1 domain, a Piwi-Argonaute-Zwille (PAZ) domain, an L2 domain, a MID domain, and a PIWI domain5 (Extended Data Fig. 1a). eAgos use small RNAs as guides to bind and cleave target RNA, a process known as RNA interference (RNAi)6.
In contrast with eAgos, prokaryotic Agos (pAgos) display diverse functions including and beyond RNAi7,8. pAgos can be classified into long pAgos and short pAgos8. Long pAgos have domains similar to eAgos. Long pAgos preferentially target DNA, although a small group of them have recently been discovered to target RNA7–12. Physiological roles of long pAgos include genome decatenation and cleavage of invading nucleic acids3,11,13–17. Unlike eAgos and long pAgos, short pAgos lack the catalytic tetrad for cleaving nucleic acids, thereby incapable of RNAi1,8 (Fig. 1a). Another critical difference is that short pAgos have a partner protein containing the “analog of PAZ” (APAZ) domain18,19 (Fig. 1a). The APAZ domain is generally fused to a Toll/interleukin-1 receptor (TIR) domain, a Silent information regulator 2 (SIR2) domain, or a DUF4365 domain1.
Fig. 1 |. Apo monomeric MapSPARTA.
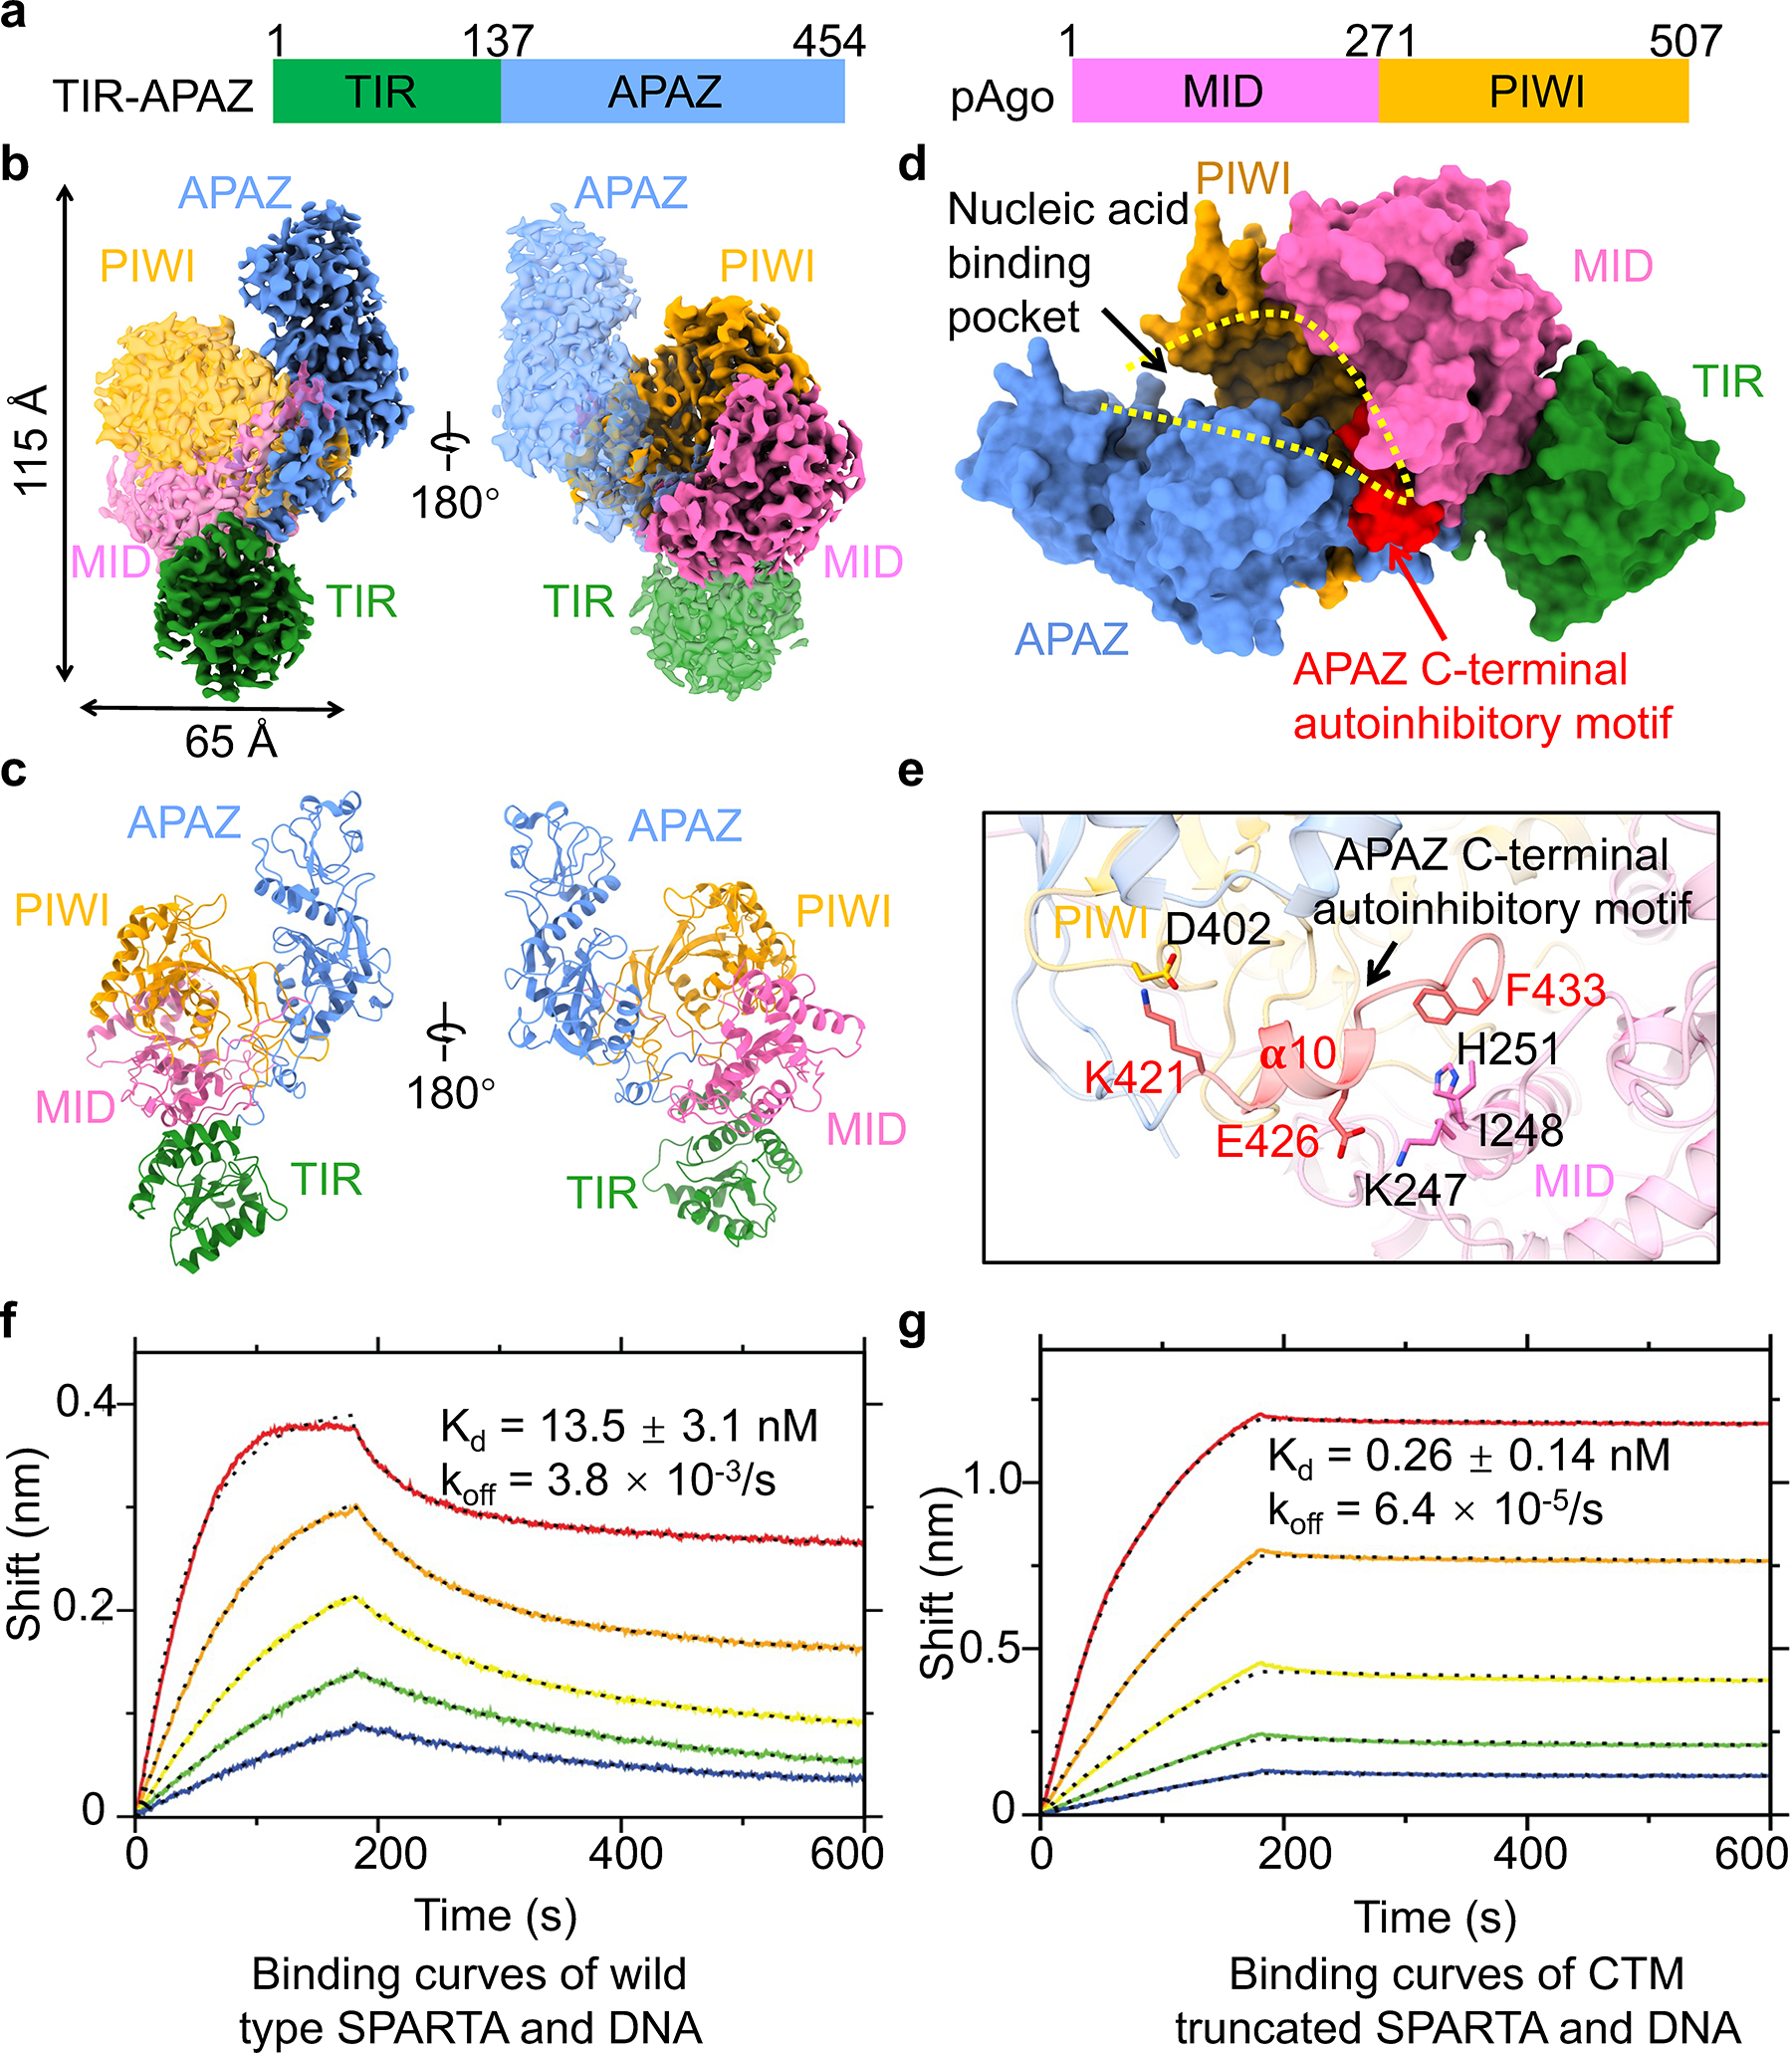
a, Domain architecture of TIR-APAZ and pAgo that together form MapSPARTA. The TIR domain is indicated in green, APZA blue, MID in magenta, and PIWI in yellow.
b, c, Cryo-EM density map (b) and ribbon diagrams (c) of apo monomeric MapSPARTA with domains colored as in a.
d, Surface representation of apo monomeric MapSPARTA with the nucleic acid-binding pocket indicated with yellow dashed lines and the auto-inhibitory C-terminal motif (CTM) of APAZ shown in red.
e, Detailed interactions between APAZ CTM and pAgo.
f, g, BLI sensorgrams of wildtype (f) and C-terminal motif (CTM)-truncated MapSPARTA (g) binding the target DNA. From top curve to bottom, the proteins were two-fold serial dilutions from 50 nM.
Recent studies uncovered a role of short pAgos in bacterial cell death, broadening the functional landscape of the Ago superfamily2,20,21. An example of interest is a Maribacter polysiphoniae pAgo system called SPARTA (hereafter, MapSPARTA), which assembles into a tetramer upon detecting invading nucleic acids, killing compromised bacteria by hydrolyzing NAD(P)+.
A particularly elegant biochemical study of MapSPARTA prompted us to unveil structural mechanisms underlying its activation2. We depict a dynamic pathway featuring hierarchical oligomerization, which is atypical of previously studied Ago systems. Our findings corroborate previously proposed mechanisms2, and allow unprecedented high-resolution visualization of distinct conformational states throughout MapSPARTA assembly, offering fundamental insights into a diverse and yet elusive part of the Ago superfamily.
Apo monomer
We first purified (Extended Data Fig. 1b–e, Supplementary Figure 1) and determined the 3.1 Å cryo-electron microscopy (cryo-EM) structure (Extended Data Fig. 1f–h, Extended Data Table 1) of the apo monomeric MapSPARTA. TIR-APAZ and Ago form a binary complex with dimensions of 115 × 65 × 55 Å (Fig. 1a–c). The complex resembles a conch shell with the TIR domain as the spiral tip. TIR-APAZ adopts an elongated structure with the N-terminal TIR domain and C-terminal APAZ domain connected by a long linker (Extended Data Fig. 2a), whereas Ago is compact, with a cleft between the PIWI and MID domains (Extended Data Fig. 2b). The compact Ago is nested in the middle of elongated TIR-APAZ (Fig. 1b, c). TIR, MID, and PIWI domains resemble homologous domains in other proteins, whereas APAZ adopts a fold that is quite unique (Extended Data Fig. 2c–h).
TIR-APAZ interacts extensively with Ago with a total buried interfacial area of around 2,246 Å2 (Fig. 1d, Extended Data Fig. 3a, b). The APAZ domain engages both MID and PIWI while the TIR mainly packs against MID (Fig. 1d, e, Extended Data Fig. 3a). The interface between APAZ and PIWI is the largest (buried area of around 1,700 Å2), containing both hydrophobic and polar interactions (Extended Data Fig. 3b, c). The interface between APAZ and MID is relatively small (buried area of around 680 Å2), containing primarily polar interactions (Extended Data Fig. 3b, d). TIR is sequestered by MID domain through polar and hydrophobic interactions (Extended Data Fig. 3e).
The apo monomeric MapSPARTA structure allowed direct visualization of the molecular differences between short pAgos and other Agos1,19. First, short pAgos lack nuclease activity, evidenced by the loss-of-function mutation of the catalytic tetrad (DEDX in the PIWI domain of other Agos) to VEAK in MapSPARTA2,22 (Extended Data Fig. 2h, Supplementary Figure 2). Second, although other Agos have the PAZ domain critical for recognizing siRNA22–25, short pAgos lack PAZ (Extended Data Fig. 2d–g). Third, the APAZ domain of MapSPARTA structurally resembles the N domain in other Agos1,19,26, although it was partially superimposed with the L1 and L2 in long pAgos (Extended Data Fig. 2g). Fourth, the extra TIR domain responsible for NAD(P)+ hydrolysis is ordered and visible1 (Extended Data Fig. 2a).
Aside from these differences, the relative positions of the domains of MapSPARTA display modest divergence from those described for other pAgos23,25 (Extended Data Fig. 2d–f), indicating evolutionary conservation at the structural level among members of the Ago superfamily.
Auto-inhibition
The structure of apo monomeric MapSPARTA demonstrated how TIR-APAZ maintains Ago in an inactive state. The C-terminal motif (CTM) of TIR-APAZ, notably the 𝛂-10 helix, folds back to occupy the nucleic acid-binding channel, through direct interactions with the MID and PIWI domains of Ago (Fig. 1d, e). These interactions comprise charge-charge interactions between APAZ E426 and MID K247 and between APAZ K421 and PIWI D402, as well as hydrophobic interactions between APAZ F433 and MID I248/H251 (Fig. 1e). Therefore, APAZ CTM sterically hinders the binding of the RNA-DNA duplex, an intriguing mechanism not observed in other Agos (Extended Data Fig. 2d–f). Indeed, MapSPARTA containing or lacking APAZ CTM displayed contrasting affinities towards the target DNA in bio-layer interferometry (BLI) measurements (Fig. 1f, g). While wild type MapSPARTA displayed high affinity for the nucleic acid substrate (Kd = 13.5 nM, koff = 3.8 × 10⁻³/s) (Fig. 1f), the truncated form lacking the auto-inhibitory APAZ CTM exhibited remarkably higher affinity (around 50-fold and 60-fold for Kd and koff, respectively) (Fig. 1g). The contrasting Kd values mainly reflected differences in koff, but not kon. Notably, the NAD+ hydrolysis activities were comparable between wildtype and CTM-truncated MapSPARTA (Extended Data Fig. 3f–g), indicating that the effect of CTM on catalysis was undetectable using our NADase assay. Together, these data support the role of the CTM in impeding DNA binding to MapSPARTA.
Fully assembled tetramer
To reveal the active state, we determined the 2.7 Å cryo-EM structure of tetrameric MapSPARTA bound to guide RNA-target DNA duplexes (Fig. 2a, b, Extended Data Fig. 1e, 4, 5, Extended Data Table 1). The tetramer resembles a butterfly with dimensions of 205 × 150 Å (Fig. 2a, b).
Fig. 2 |. RNA/DNA-bound tetramer.
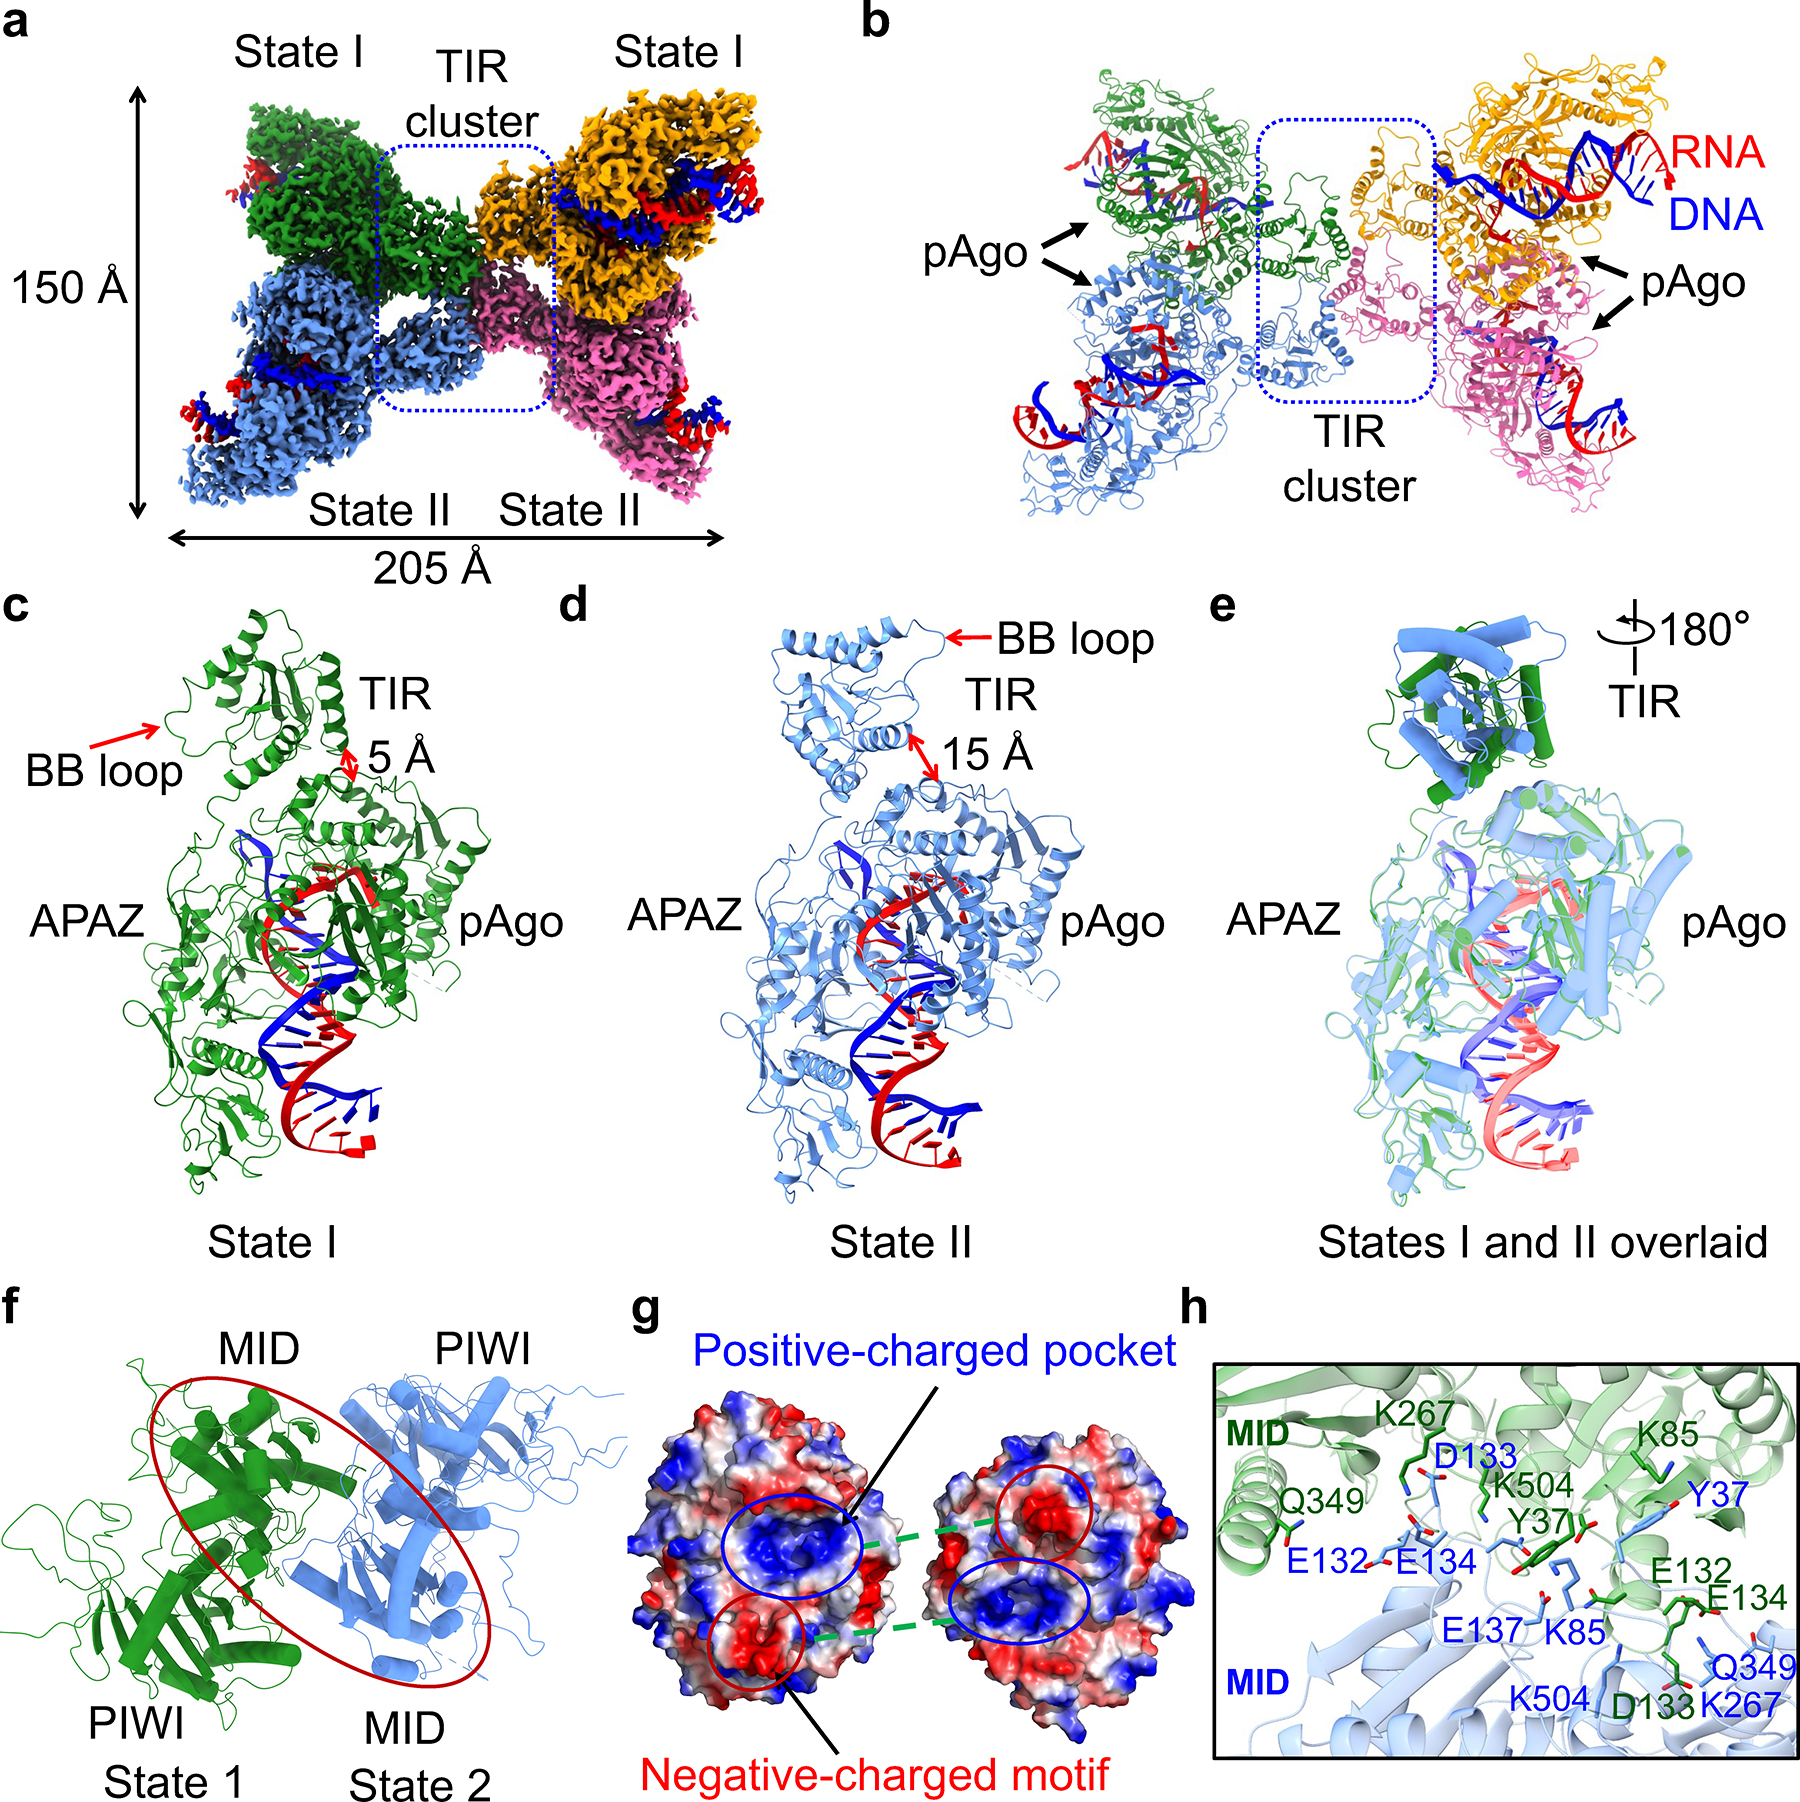
a, b, Cryo-EM density (a) and ribbon diagrams (b) of tetrameric MapSPARTA in complex with guide RNA (red)-target DNA (blue) duplex. The four protomers of MapSPARTA are colored in green, blue, yellow, and pink, respectively. The four protomers in adopt two different conformations, indicated as State I and State II.
c, d, Ribbon diagrams of MapSPARTA in State I (c) and State II (d). TIR is tightly associated with Ago in State I and loosely in State II.
e, Overlaid structures of MapSPARTA in State I and State II, revealing a dramatic 180º rotation in the TIR domain.
f, Ribbon diagram of MID-MID interaction. The region of interest in shown as a red oval.
g, Electrostatically complementary interface between two MID domains.
h, Detailed MID-MID interactions with interfacial residues highlighted in sticks.
Although seemingly four-fold symmetrical, the tetramer lacks strict symmetry. Local refinement (Extended Data Fig. 4, 5) revealed two conformations – State I and State II –denoted as SPARTAS1 and SPARTAS2 hereafter (Fig. 2a). One SPARTAS1 and one SPARTAS2 form an asymmetric dimer via Ago-Ago and TIR-TIR interactions. Two SPARTAS1-SPARTAS2 dimers stack in a head-to-head manner via TIR-TIR interactions. In each SPARTAS1-SPARTAS2 dimer, the MID-PIWI-APAZ domains are related by a two-fold axis whereas the TIR domains are parallel to each other (Fig. 2b).
SPARTAS1 and SPARTAS2 mainly differ in the orientation of TIR relative to the APAZ-MID-PIWI domains (Fig. 2c–e). Overlay of the APAZ-MID-PIWI domains of SPARTAS1 and SPARTAS2 revealed a misalignment of TIR by a 180º rotation (Fig. 2e). This orientational difference underlies the proximity of TIR to MID in SPARTAS1 (Fig. 2c) but not SPARTAS2 (Fig. 2d). Detailed examination of the SPARTAS1-SPARTAS2 interface revealed extensive intermolecular contacts spanning the MID-MID interface (about 1,292 Å2), dominated by charge-charge interactions and hydrogen bonds (Fig. 2f–h). A negatively charged motif from one MID is inserted into a positively charged pocket in the other MID, suggesting charge and shape complementarity (Fig. 2g, h).
TIR cluster
Besides MID-MID contacts (Fig. 2f–h), MapSPARTA assembly enabled TIR-TIR interactions by clustering (Fig. 3a). The TIR cluster is at the center of the tetrameric MapSPARTA butterfly (Fig. 2a, b) and consists of two pairs of anti-parallel TIR dimers (Fig. 3a, b). In each TIR dimer (TIRIA-TIRIIA, or TIRIB-TIRIIB), the two protomers are arranged asymmetrically in a head-to-tail manner (Fig. 3b). The two pairs of asymmetric dimers (TIRIA-TIRIIA and TIRIB-TIRIIB) are related through a 21 axis, culminating in the tetrameric cluster with a translational distance of around 17Å (Fig. 3a).
Fig. 3 |. Central TIR cluster.
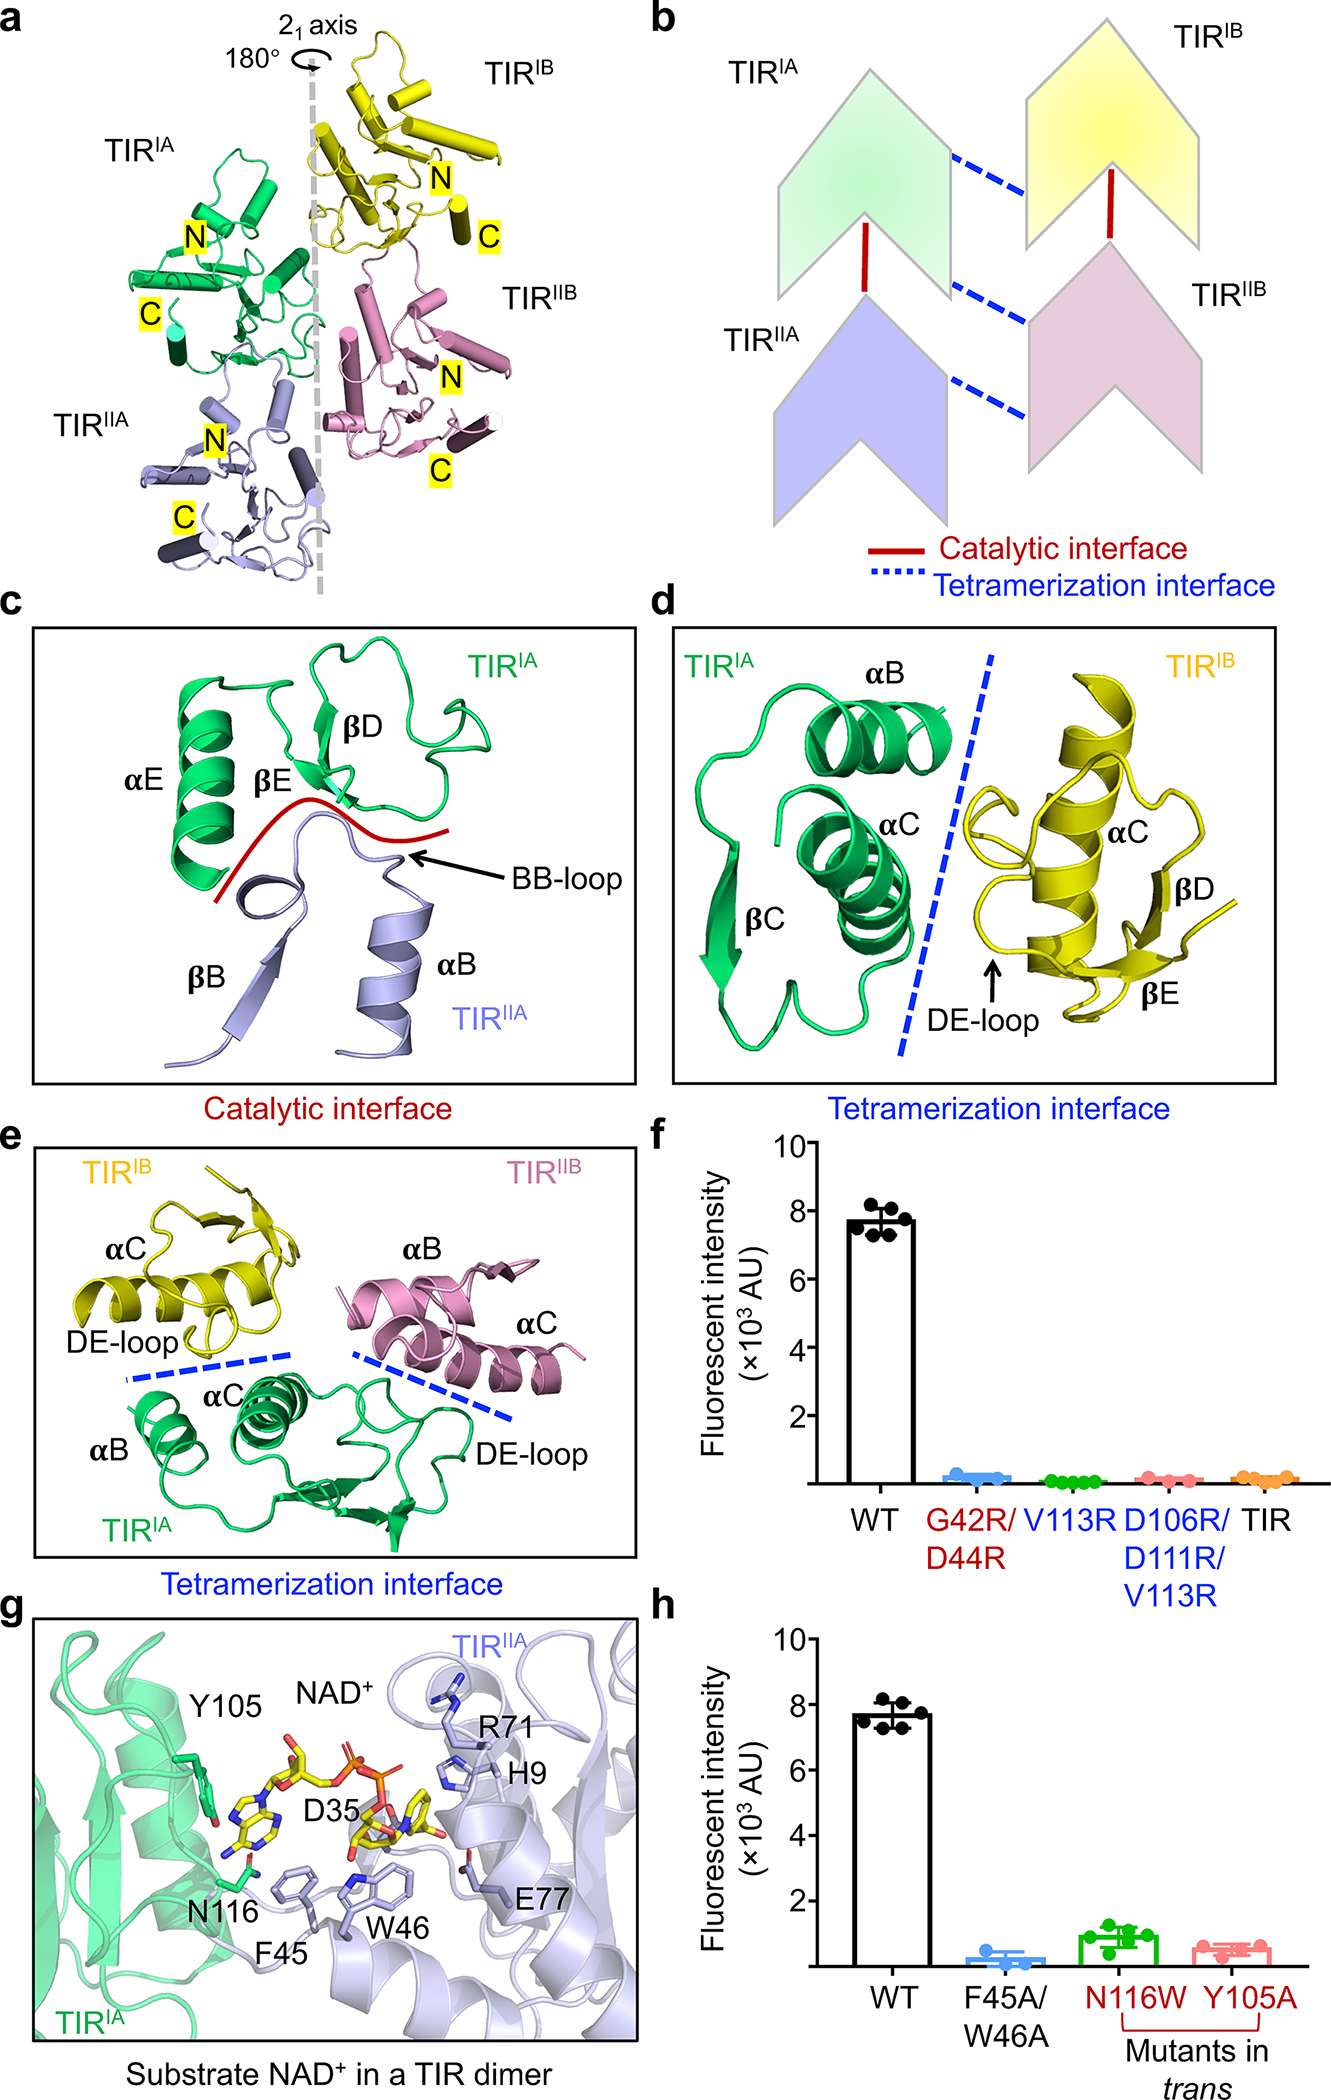
a, Ribbon diagram of the TIR tetramer with each TIR colored individually. The TIRs are related by a 21-screw axis.
b, Schematic diagram illustrating the stacking and interfaces of TIRs.
c, Catalytic interface between TIRIA and TIRIIA mediated by BB loop of TIRIIA and 𝛂E and DE loop of TIRIA.
d, Tetramerization interface between TIRIA and TIRIB formed by 𝛂B and 𝛂C of TIRIA and DE loop of TIRIB.
e, Interactions of TIRIA with TIRIB and TIRIIB via the same tetramerization interface.
f, Lack of NAD+ hydrolase activity in mutants with compromised TIR-TIR interactions. V113R and V113R/D106R/D111R disrupt TIR tetramerization while G42R/D44R disrupts TIR dimerization. TIR domain alone also lacked catalytic activity. Data are mean ± SD from more than 3 replicates as indicated (Wild type, n=6; G42R/D44R, n=3; V113R, n=5; V113R/D106R/D111R, n=3; TIR, n=5).
g, An expanded view of the catalytic interface with NAD+ shown as sticks.
h, Mutations of residues coordinating NAD+ impaired NAD+ hydrolysis. Data are mean ± SD from more than 3 replicates as indicated (Wild type, n=6; F45A/W46A, n=3; N116W, n=6; Y105A, n=4).
Functionally, TIR-TIR contacts can be categorized into tetramerization interfaces (between TIRIA and TIRIB, TIRIA and TIRIIB, TIRIIA and TIRIIB) and catalytic interfaces (where the substrate NAD+ binds, between TIRIA and TIRIIA, TIRIB and TIRIIB) (Fig. 3b, Extended Data Fig. 6a–c).
The tetramerization interfaces are formed either by the α-B and α-C of TIRIA (or TIRIIA) and the DE loop of TIRIB (or TIRIIB) (Fig. 3d, Extended Data Fig. 6c), or by the DE loop of TIRIA and the α-C of TIRIB (Fig. 3e, Extended Data Fig. 6b). We reasoned that tetramerization interfaces are required for the hydrolase activity of MapSPARTA2. To test this hypothesis, we mutated residues at tetramerization interfaces. Mutants including V113R and V113R/D106R/D111R cannot form a tetramer in the presence of duplex RNA/DNA (Extended Data Fig. 6d, e). As expected, in enzymatic experiments using a fluorogenic substrate as the readout, these mutants exhibited no hydrolase activity (Fig. 3f, Extended Data Fig. 6f). Furthermore, TIR domain alone, a monomer (Extended Data Fig. 6g), also lost hydrolase activity (Fig. 3f, Extended Data Fig. 6f). Together, these data underscore the importance of TIR domain oligomerization for catalysis.
Having demonstrated that the tetramerization interfaces promote NAD(P)+ hydrolysis, we next investigated the catalytic interfaces. Catalytic interfaces are defined by the BB loop of TIRIIA (or TIRIIB) extending into TIRIA (or TIRIB), featuring charge-charge interactions formed between the BB loop of the former and the DE loop and α-E of the latter (Fig. 3c, Extended Data Fig. 6a, h). Mutation of G42R/D44R on the catalytic interface abolished the hydrolase activity of the MapSPARTA (Fig. 3f, Extended Data Fig. 6f). Notably, the BB loop of TIR varies conformationally between apo monomeric and tetrameric MapSPARTA (Extended Data Fig. 6i–k), consistent with its involvement in catalytic interfaces (Extended Data Fig. 6l).
To identify important residues at the catalytic interfaces, we determined the cryo-EM structure of MapSPARTA in complex with NAD+, revealing two NAD+-binding sites in the tetramer (Extended Data Fig.7a–e). Similar to human SARM1 TIR27(Extended Data Fig. 7f), NAD+ is positioned between TIRIA (or TIRIB) and TIRIIA (or TIRIIB) in MapSPARTA, simultaneously coordinated by residues in both TIRs (Fig. 3g). By structural similarity among TIR domains, it can be inferred that that NAD+ should bind to the dimeric TIR interface in MkTIR-SAVED TIR and SfTIR-STING TIR27–29(Extended Data Fig. 7g, h, Supplementary Figure 3), although experiments will be necessary for validation. Both catalytic residues, D35 and E77, are contributed by one TIR (TIRIIA or TIRIIB), in contrast with the SfTIR-STING TIR filament in which the active site is formed by residues residing in different TIRs29. H9, W46, and R71 in TIRIIA (or TIRIIB) coordinate the nicotinamide and phosphate groups of NAD+, while F45 in TIRIIA (or TIRIIB) and residues in TIRIA (or TIRIB) including Y105 and N116 coordinate the adenosine group of NAD+ (Fig. 3g). Consistently, mutations of coordinating residues, including F45A/W46A, Y105A, and N106W, impaired hydrolase activity (Fig. 3h, Supplementary Figure 3).
Interaction with nucleic acid
Our cryo-EM densities allowed unambiguous tracing of 21 nucleotides of the guide RNA and 20 nucleotides of the target DNA. The traced duplex spans around 74 Å, occupying a positively charged channel formed by PIWI, MID, and APAZ domains (Fig. 4a, b). Examination of DNA/RNA-MapSPARTA contacts revealed several unique features of nucleic acid binding (Fig. 4c–i).
Fig. 4 |. Recognition of nucleic acid.
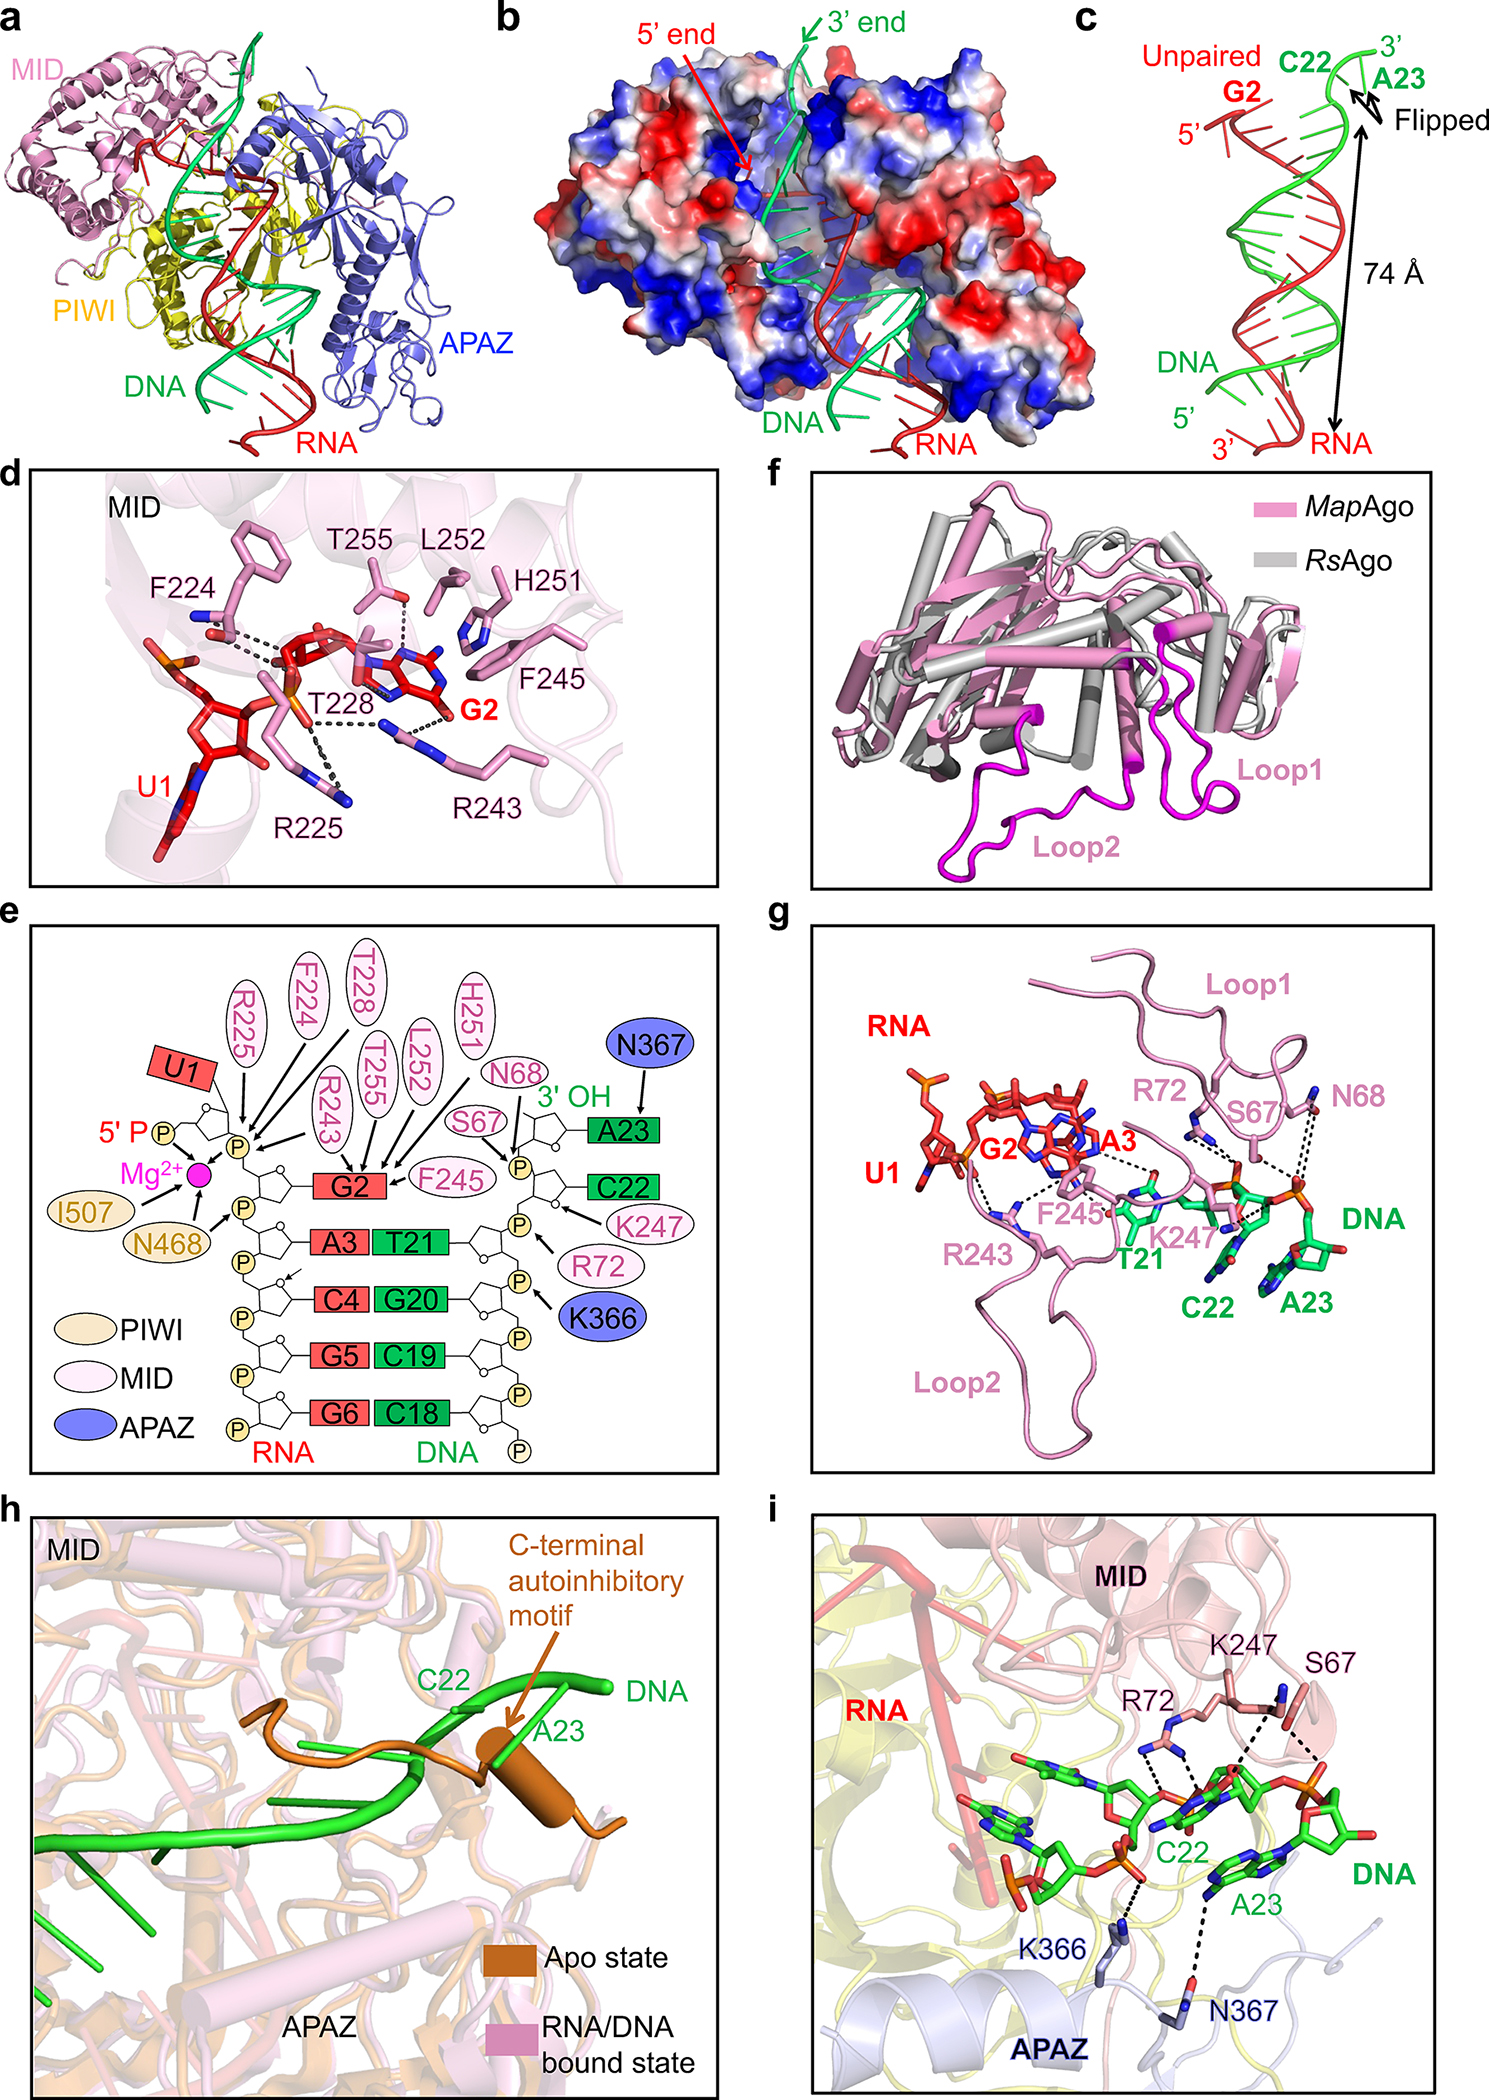
a, Ribbon diagram of MapSPARTA bound to guide RNA (red) and target DNA (green). TIR is omitted because of its lack of interaction with nucleic acids.
b, Electrostatic surface representation of MapSPARTA in complex with the RNA-DNA duplex.
c, Structure of the guide RNA-target DNA duplex.
d, Detailed interactions between the G2 nucleotide of guide RNA and the MID domain of pAgo, with key residues shown as sticks.
e, Coordination of G2 of guide RNA and C22 and A23 of target DNA by MapSPARTA. Residues from PIWI domain, MID domain and APAZ domain are colored in yellow, pink, and blue, respectively.
f, Structural comparison of MapAgo (Ago of MapSPARTA) and Cereibacter sphaeroides Ago (RsAgo), revealing the two long loops unique to MapAgo.
g, Lack of Watson-Crick pairing between RNA and DNA due to steric interference by the two long loops of pAgo. Key residues in the long loops are shown as sticks.
h, Overlaid structures of MapSPARTA in apo monomer and RNA/DNA-bound tetramer states, revealing the clash of DNA with the CTM of APAZ in the apo state.
i, Detailed interactions of the DNA 3’ end with the MID domain of pAgo (pink) and the APAZ domain of APAZ-TIR (blue). Key residues coordinating DNA are shown as sticks.
First, RNA nucleotides 3 through 17 form a stable duplex with target DNA via Watson-Crick pairing (Fig. 4c). The sugar backbone extensively contacts PIWI and APAZ domains via hydrogen bonds and charge-charge interactions (Extended Data Fig. 8a). RNA nucleotides 3 through 13 interact with both PIWI and APAZ domains, while RNA nucleotides 14 through 21 interact with only APAZ (Extended Data Fig. 8a–c). Comparison with apo monomeric MapSPARTA revealed conformational changes in MID upon RNA/DNA binding, particularly the tilting of the negative-charged motif critical for mediating MID-MID interactions (Extended Data Fig. 8d).
Second, the guide RNA G2 nucleotide does not form a Watson-Crick pair with the target DNA, but rather is captured by MID (Fig. 4b, c). The base of G2 packs against bulky residues of MID, including F245, H251, and L252, and forms hydrogen bonds with T228, R243, and T255 (Fig. 4d). The phosphate group of G2 interacts with R225 and the carbonyl group of F224 (Fig. 4d). R225, T228, R243, F245, and T255 are conserved among short pAgos (Supplementary Figure 2), consistent with their role in coordinating the RNA G2 nucleotide. These new observations do not apply to other Agos30, where Watson-Crick pairing starts at the second nucleotide of the guide RNA.
Third, the DNA C22 and A23 nucleotides protrude towards MID, forming interactions with two loops (loop 1 and loop 2) of MID (Fig. 4f, g). The two loops are exclusive of short pAgos and either truncated or absent in eAgos and long pAgos31 (Supplementary Figure 2). Sequestration of DNA C22 and A23 by the MID loops is in line with the lack of Watson-Crick pairing at RNA G2 and U1 (Fig. 4g).
Fourth, unlike eAgos which recognize the 5’-phosphate of RNA in a Mg2+-independent manner (Extended Data Fig. 9a), both short pAgos and long pAgos utilize a conserved Mg2+-bound pocket within the MID domain to anchor the RNA 5’-phosphate5,31,32 (Extended Data Fig. 9b, c). As such, MapSPARTA binds the flipped U1 and G2 nucleotides of RNA through extensive polar and hydrophobic interactions (Extended Data Fig. 9b). MapSPARTA utilized a HK motif (H207, K211) to coordinate the U1 nucleotide, contrasting with the YK motif in RsAgo and human Ago2 (Extended Data Fig. 9b–d). Although earlier research suggested that MapSPARTA prefers guide RNAs with adenosines at the first and second positions2, we did not notice differences in coordination though structural modeling, binding kinetics, and NAD+ hydrolysis when we used such a guide RNA (Extended Data Fig. 9e–l), suggesting that this preference may be context-specific.
Fifth, linking back to the apo structure, we deduced how RNA/DNA lifts auto-inhibition to trigger MapSPARTA assembly. The auto-inhibitory APAZ CTM occupies the same niche as the activating RNA/DNA (Fig. 4h). In apo MapSPARTA, residue K247 of Ago is sequestered by APAZ CTM, whereas in active MapSPARTA, the same K247 forms a hydrogen bond with DNA C22 (Fig. 1e, 4i). Residues R72 and S62 of pAgo and residues K366 and N367 of APAZ further stabilize the DNA 3’ end (Fig. 4i). Therefore, the steric hindrance conferred by the APAZ CTM may be relieved through binding of target DNA.
Hierarchical assembly
The apo monomeric and RNA/DNA-bound tetrameric structures represent the initial and final stages, respectively, of MapSPARTA activation. To draw a comprehensive picture, we captured intermediate states, including an RNA/DNA-bound monomer (Fig. 5a–c, Extended Data Fig. 10) and two RNA/DNA-bound dimers (Fig. 5d–h, Extended Data Fig. 4, 11a–f).
Fig. 5 |. Intermediate states.
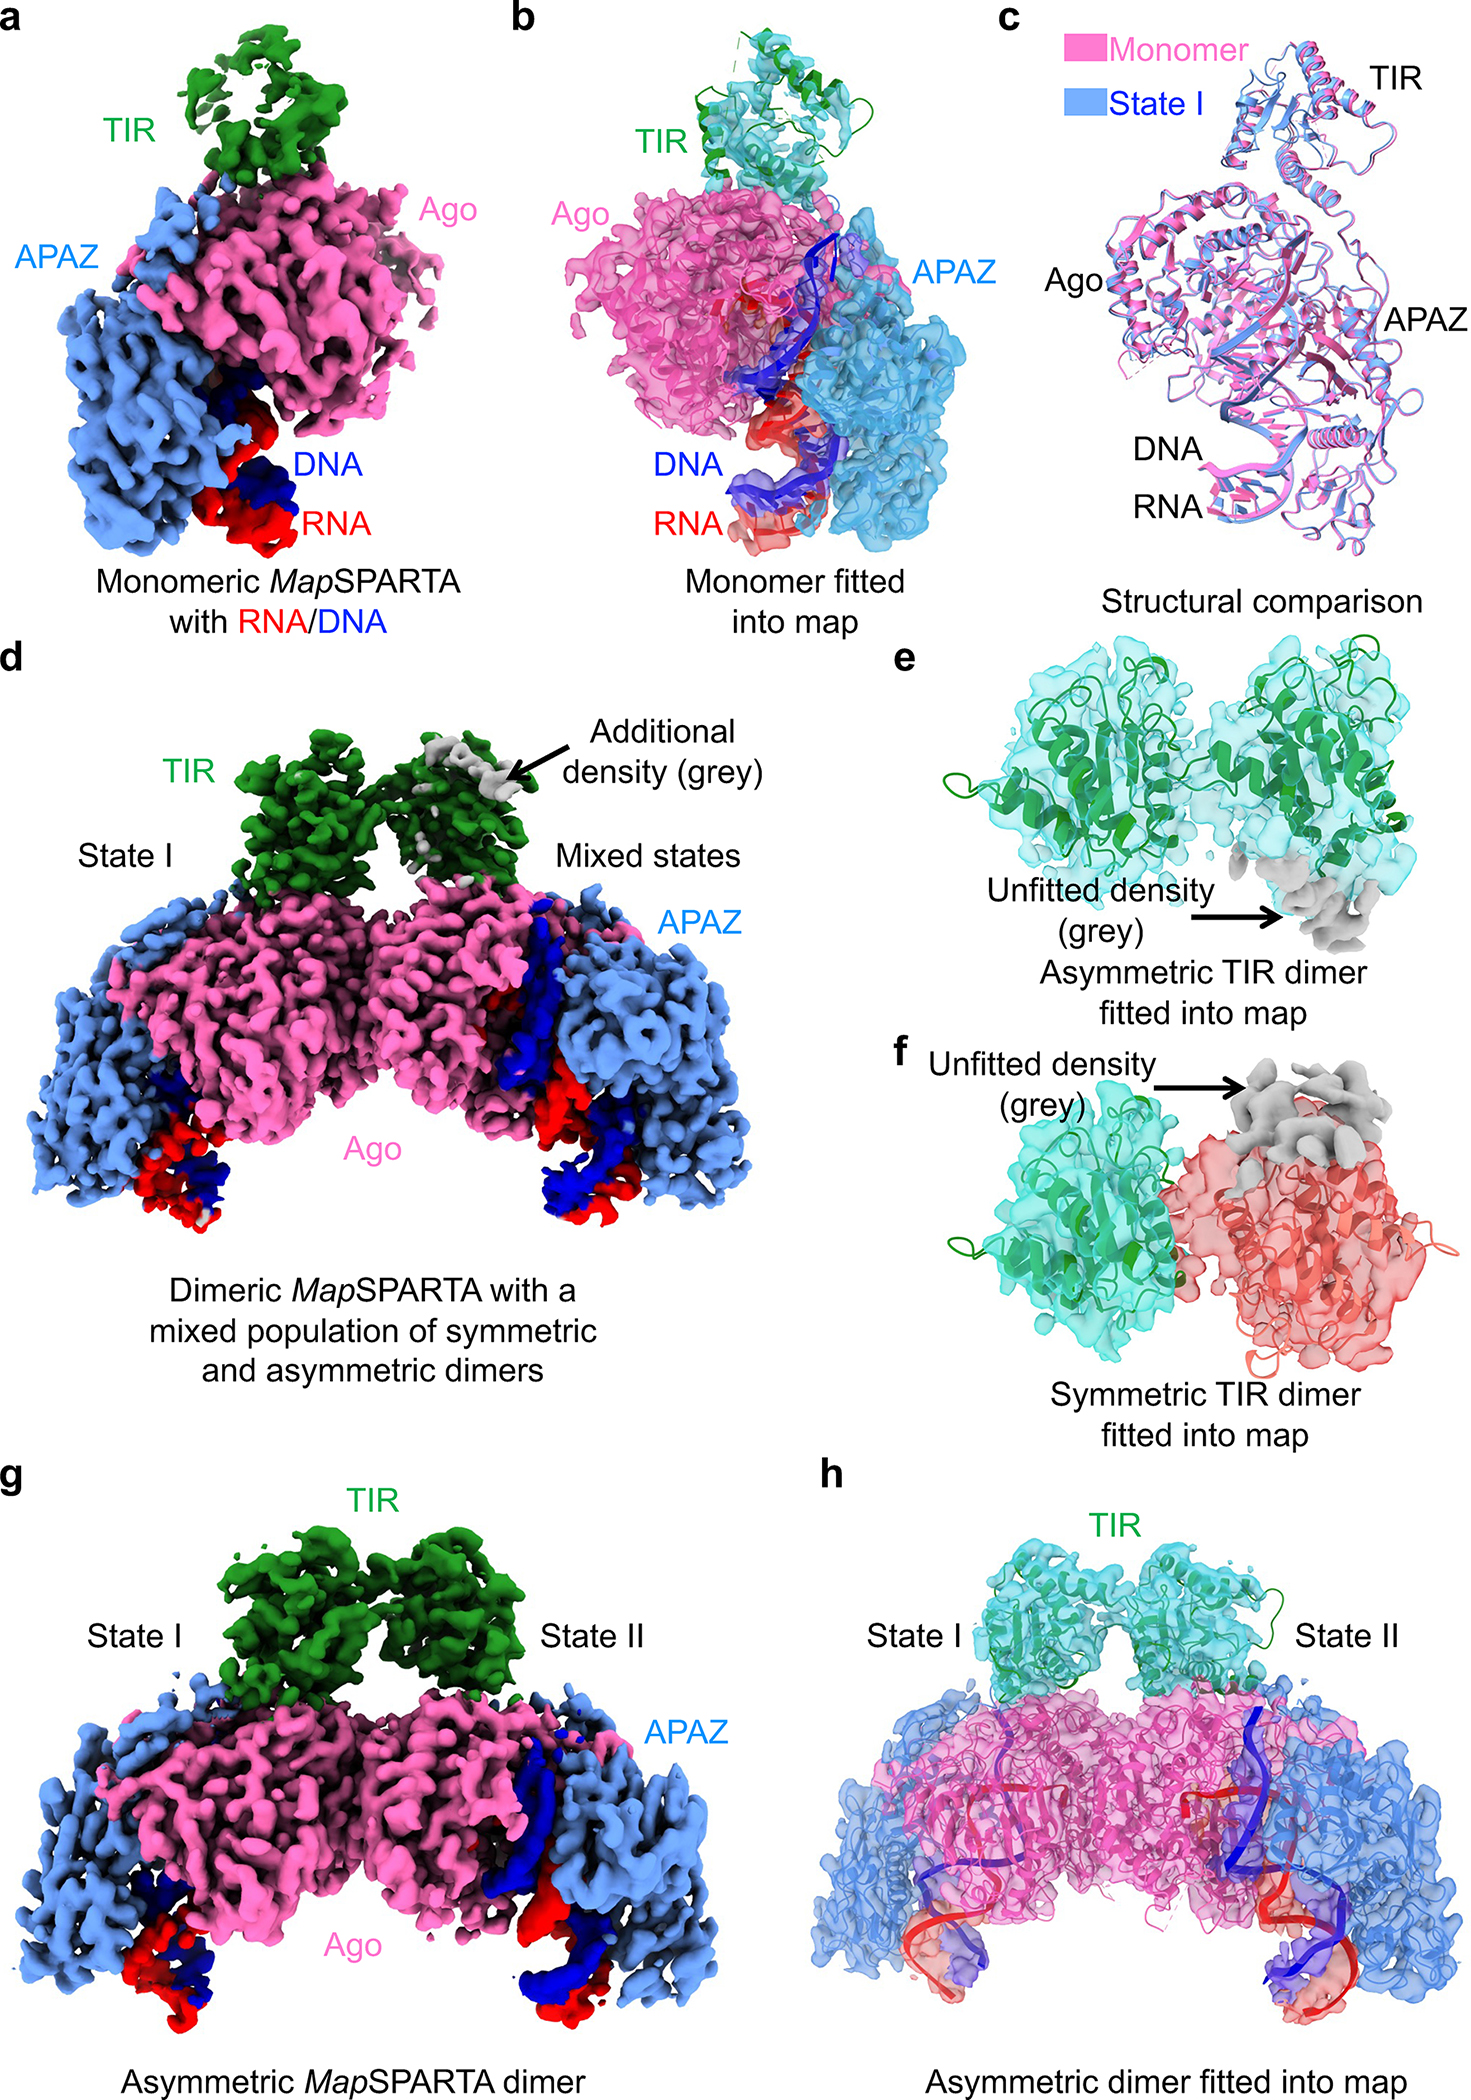
a, b, Cryo-EM map (a) and structure fitted into the map (b) of monomeric MapSPARTA in complex with RNA/DNA.
c, Overlaid structures of RNA/DNA-bound monomeric MapSPARTA (pink) with MapSPARTA State I in the tetramer (blue).
d-f, Cryo-EM map of likely mixed RNA/DNA-bound MapSPARTA dimers (d) showing additional densities (grey) regardless of whether asymmetric TIRs (e) or symmetric TIRs (f) were fitted.
g, h, Cryo-EM map (g) and structure fitted into the map (h) of an asymmetric RNA/DNA-bound MapSPARTA dimer.
The overall structure of the RNA/DNA-bound monomer resembles MapSPARTAS1 in the tetramer (Fig. 2c, 5c). The TIR domain in this monomer had a relatively poor density (Fig. 5a, b), suggesting its flexibility, consistent with its orientational variability in the fully assembled tetramer (Fig. 2c–e).
Regarding RNA/DNA-bound dimers, we were initially able to dock two TIRs either symmetrically or asymmetrically into the cryo-EM map with some additional unfitted densities (Fig. 5d–f). We hypothesized that this is due to incomplete partitioning of symmetric and asymmetric conformations. Therefore, we performed further classification and obtained two different maps, the asymmetric one at 3.5 Å (Extended Data Fig. 11c, d) and the symmetric one at a lower resolution. The high-resolution asymmetric map clearly revealed that the two TIRs are joined head-to-tail (Fig. 5g, h, 6a, b), consistent with the relative orientations of TIRs in the tetramer (Extended Data Fig. 11e). The fact that the symmetric map is at a relatively poor resolution is likely due to its instability (Fig. 6c, d, Extended Data Fig. 11f).
Fig. 6 |. Hierarchical assembly.
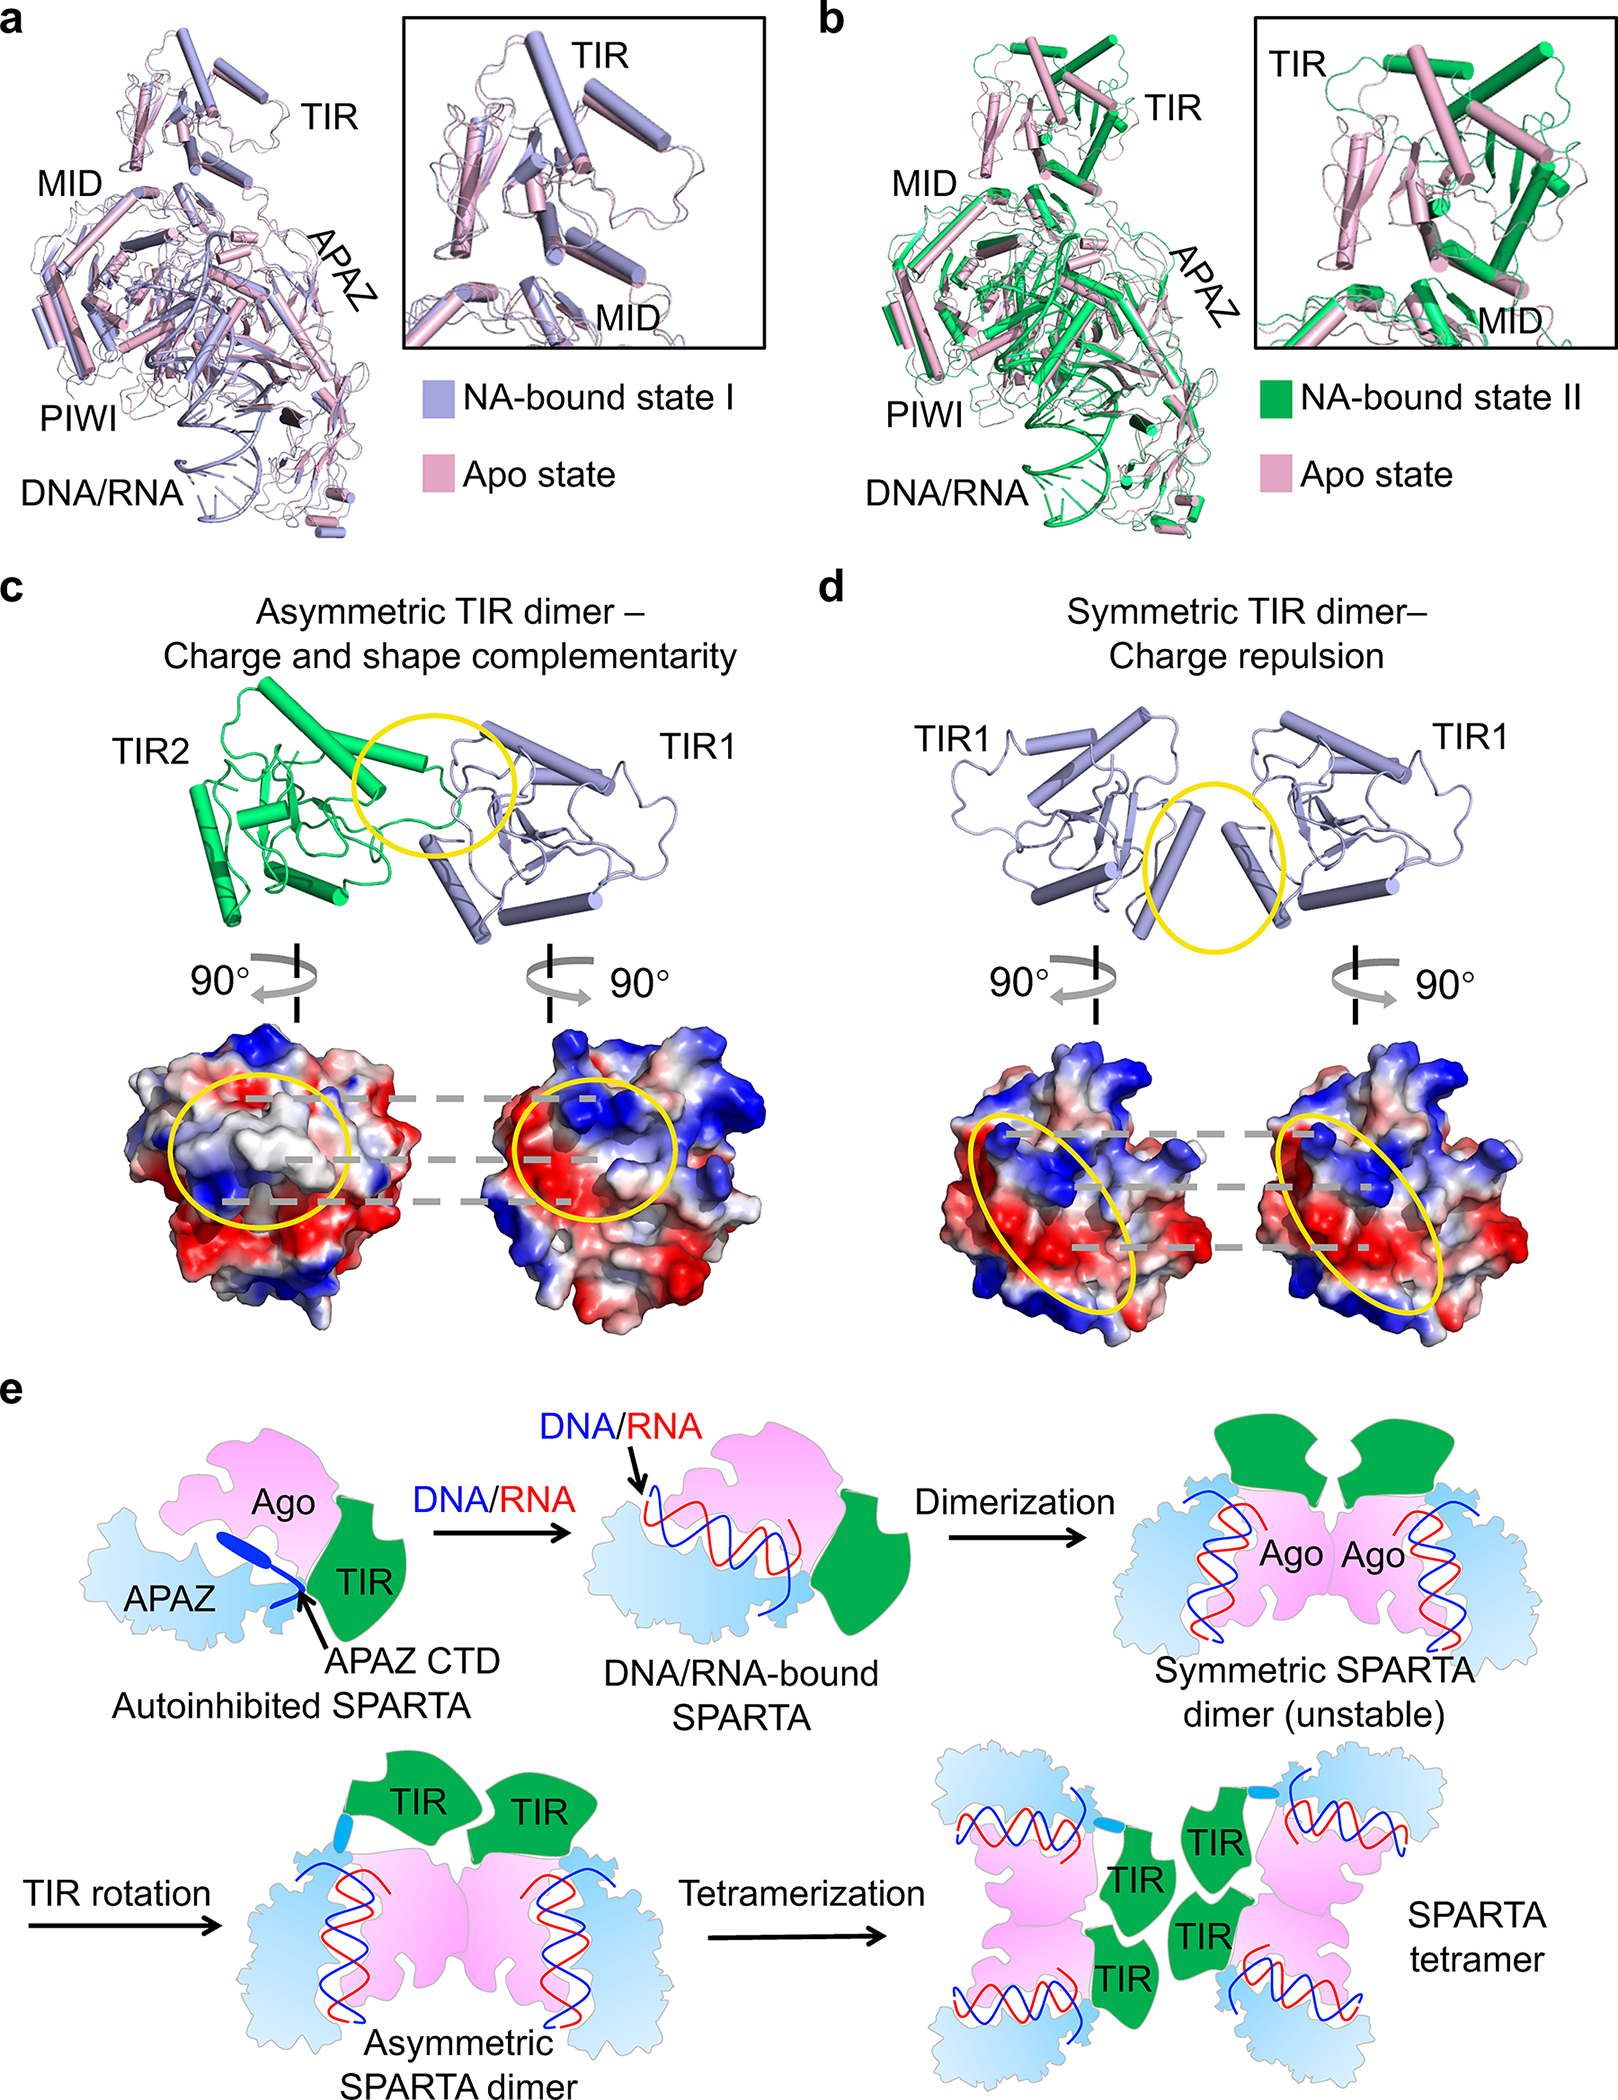
a, b, Structure of MapSPARTA in apo state (pink) overlaid with MapSPARTA state I (blue, a) and state II (green, b). The TIR domain is enlarged.
c, d, Charge and shape complementarity between asymmetric TIRs (c) and electrostatic repulsion between symmetric TIRs (d).
e, Schematic diagram illustrating the assembly of MapSPARTA tetramer upon RNA/DNA binding.
The Ago E134R mutant, whose MID-MID interface is disrupted, remained monomeric in the presence of RNA/DNA (Extended Data Fig. 11g), suggesting the importance of MID-MID interactions for MapSPARTA dimerization. Arginine mutation of V113, located at tetramerization interfaces, in TIR-APAZ led to monomer and dimer peaks during size exclusion chromatography (Extended Data Fig. 6d), suggesting that monomers and dimers are intermediate states in the tetramerization of MapSPARTA.
We were curious why the intermediate dimer is preferably asymmetric (Fig. 5g–h). While the TIR domain of MapSPARTAS1 resembles that of apo MapSPARTA (Fig.6a), the TIR domain of MapSPARTAS2 differs by a large rigid-body rotation of about 180º (Fig. 6b). The rotated TIR in MapSPARTAS2 neatly engages the TIR in MapSPARTAS1 through charge and shape complementarity (Fig. 6c). By contrast, a symmetric MapSPARTA dimer may be destabilized by electrostatic repulsion (Fig. 6d). As such, although the symmetric dimer possibly exists, it may be a relatively unstable intermediate.
Together, our structures and functional assays suggest that MapSPARTA activation is a hierarchical assembly process (Fig. 6e), which starts as an apo auto-inhibited monomer and ends as an active RNA/DNA-bound tetramer, with intermediate states including an RNA/DNA-bound monomer, an asymmetric dimer, and possibly a symmetric dimer.
Discussion
Using MapSPARTA as an example, we built upon previous studies2 and visualized hierarchical assembly as an activation pathway for short pAgos with a TIR domain. The assembly starts with RNA/DNA binding, which overcomes auto-inhibition of MapSPARTA by APAZ CTM. Afterwards, increasing degrees of oligomerization of MapSPARTA present a molecular platform on which TIR domains cluster to acquire hydrolase activity. While the guide RNA alone is not sufficient to trigger MapSPARTA oligomerization (Extended Data Fig. 11h), unique molecular features including diverse modes of protein-protein as well as protein-nucleic acid interactions may together drive assembly.
MapSPARTA evolved as an elegant anti-plasmid system in bacteria2. An open question is the in vivo function of the CTM, which may present a checkpoint during MapSPARTA-mediated defense. From a translational perspective, our mechanistic findings provide the foundation for the design of synthetic biology tools. Short pAgos like MapSPARTA may be engineered as sensors of exogeneous nucleic acids and conditional executioners of host cell death. Although such application has been preliminarily demonstrated in in vitro and in bacteria2,33, its adaptation to mammalian cells may offer broader therapeutic avenues.
Methods
Expression and purification of apo MapSPARTA
The vector encoding MapSPARTA (pBK086) was obtained from Addgene (plasmid #183145), and all the mutations were made through the site direction mutagenesis. WT MapSPARTA and all the other mutants were purified using a modified method based on Swarts lab procedures as previously described2. Specifically, the plasmid used for protein expression was transformed into E. coli BL21 Star (DE3) cell (ThermoFisher Scientific, C601003) cultured in LB medium containing 50 μg/ml kanamycin at 37°C. When an OD600 of 0.6–0.8 was reached, protein expression was induced at 18°C by adding 0.3 mM IPTG. Cells were harvested after overnight induction (~16h) and resuspended in lysis buffer (50mM Tris-HCl pH8, 500mM NaCl, 20mM imidazole). After sonication, the supernatant of lysate was collected through centrifugation at 30 000 × g, 4°C for 30min. The clarified lysate was loaded onto a pre-equilibrated Ni2+-NTA agarose column, and then the column was washed with 10 column volumes (CV) of Ni2+-NTA wash buffer (50mM Tris-HCl pH8, 500mM NaCl, 25mM imidazole). The protein was eluted in Ni2+-NTA elution buffer (50mM Tris-HCl pH8, 150mM NaCl, 250mM imidazole, 0.4mM TECP), and the eluates containing protein of interest were loaded onto an Amylose resin column. The column was washed with 5 CV Amylose wash buffer I (50mM HEPES pH7.4, 150mM NaCl) and 5 CV Amylose wash buffer II (20mM HEPES pH7.4, 250mM KCl, 2mM EDTA), and the protein was eluted in Amylose elution buffer (20mM HEPES pH7.4, 250mM KCl, 2mM EDTA, 50mM Maltose, 0.4mM TECP). The eluates containing MapSPARTA were pooled, and TEV protease was added into the eluates in a 1:100 (w/w) ratio. After Ni2+-affinity, Amylose-affinity purification and TEV cleavage, heparin cation exchange was performed. The protein sample was applied to the HiTrap Heparin column using a syringe fitted to the luer connector and eluted with Heparin elution buffer (20mM HEPES pH7.4, 1M KCl, 0.4mM TECP) with a continuous gradient from 50mM KCl to 1M KCl. All eluates and peak fractions were analyzed and confirmed by SDS-PAGE following Coomassie Brilliant Blue staining (Supplementary Figure 1). The desired protein sample was then desalted to the SEC buffer (20 mM HEPES pH7.4, 125mM KCl, 0.4mM TECP, 2mM MgCl2) and concentrated to 1 mg/ml concentration for further use.
Reconstitution of the MapSPARTA-RNA/DNA complex
The MapSPARTA was purified as described above and incubated with nucleic acids (NA) duplex according to previously reported2. A 5’-phosphorylated guide RNA (”-P-UGACGGCUCUAAUCUAUUAGU-”) was added to the purified MapSPARTA in a 1:1 molar ratio, followed by adding the same molar mass of target DNA (”-CAACTAATAGATTAGAGCCGTCAAT-”) to the mixture (a final molar ratio of 1:1:1). The protein-nucleic acid complex was incubated at 33°C for 30 minutes and then carried out by size exclusion chromatography, using Superdex 200 Increase 10/300 GL column in the presence of the SEC buffer. The desired peak fractions were confirmed by SDS-PAGE and pooled for Cryo-EM analysis.
NADase assay
To test the hydrolase activity of the MapSPARTA, ε-NAD+ assays was performed using a modified method based on Swarts lab protocols2. Specifically, a reaction mixture containing 1 μM SPARTA complex, 1 μM RNA guide, 50 μM ε-NAD+, 10 mM MES pH 6.5, 125 mM KCl, and 2 mM MgCl2 was prepared on ice in a 96-well plate. Then DNA target was added to each well with a final concentration of 1 μM and the plate was transferred to a preheated Spark Multimode Microplate reader (TECAN) immediately. All measurements took place at 33 °C with an excitation wavelength of 360 nm and emission wavelength of 465 nm, and the excitation bandwidth and emission bandwidth are both 35 nm. All the experiments were repeated at least three times.
Binding affinity measurement
The binding affinity between protein and oligonucleotides (same RNA and DNA as in structural analyses), was performed by bio-layer interferometry (BLI) using the Octet R9 (Sartorius). All experiments were performed at 25 °C. SA sensor tips were pre-equilibrated in the buffer for at least 10 min before use in experiments. Protein was first incubated with gRNA oligo at 25 °C as 1:1 molar ration for 30 min before use. Biotin labeled ssDNA oligo was loaded onto SA biosensors for 60 second. For multiple cycle kinetics, six sensors were immersed with pre-incubated protein-RNA complex with concentrations in the range from 3.125 nM to 50 nM (and buffer as a control) for 180 second for the association step, and then in buffer for 600 second for the dissociation step. The data was analyzed using Octet Analysis Studio 12.2.2.26.
Cryo-EM data collection
A 3 μl drop of MapSPARTA heterodimeric complex sample at 0.3 mg/ml was applied to a glow-discharged Quantifoil R1.2/1.3 400 mesh gold grid (Electron Microscopy Sciences), blotted for 4 s in 100% humidity at 4 °C and plunged into liquid ethane using an FEI Vitrobot Mark IV (Thermo Fisher). A 3 μl drop of oligomerized MapSPARTA-NA duplex complex sample at 0.7 mg/ml was applied to a glow-discharged Quantifoil R1.2/1.3 400 mesh gold grid (Electron Microscopy Sciences), blotted for 5 s in 100% humidity at 4 °C and plunged into liquid ethane using an FEI Vitrobot Mark IV. For MapSPARTA tetramer bound with NAD+, 5 mM β-NAD sodium salt (Sigma-Aldrich) was added to sample and incubated for 10 min at 4 °C, followed waited for 10 s on the grids, blotted for 4 s, and plunged into liquid ethane. All grids were screened using a ThermoFisher Glacios microscope (OSU Center for Electron Microscopy and Analysis).
3,464 micrographs of MapSPARTA heterodimeric complex were collected using a 300 kV Titan Krios microscope equipped with a K3 direct electron detector (Thermo Fisher) in super-resolution mode with a nominal magnification of 81,000×, and a physical pixel size of 1.0694 Å with defocus values ranging from −1.0 to −2.5 μm. Each micrograph stack containing 40 frames were exposed to a total electron exposure of 50 e−/Å2 over 2.796 s.
6,566 movies of gRNA/tDNA duplex bound MapSPARTA monomer were collected using a 300 kV Titan Krios microscope equipped with a Thermo Fisher Scientific Falcon 4 Detector and a Selectris X Imaging Filter in counting mode, and a physical pixel size of 0.95 Å. Each micrograph stack was exposed to a total electron exposure of 50 e−/Å2 and a dose per frame of 1.5 e−/Å2, with defocus values ranging from −0.5 to −2.0 μm.
4,823 micrographs of tetramerized MapSPARTA-NA duplex were collected using a 300 kV Titan Krios microscope equipped with a Thermo Fisher Scientific Falcon 4 Detector and a Selectris X Imaging Filter in counting mode, and a physical pixel size of 0.95 Å. Each micrograph stack was exposed to a total electron exposure of 50 e−/Å2 and a dose per frame of 1.5 e−/Å2, with defocus values ranging from −1.5 to −2.1 μm.
4,215 movies of MapSPARTA tetramer with NAD+ were collected using a 300 kV Titan Krios microscope equipped with a K3 direct electron detector (Thermo Fisher) in super-resolution mode with a nominal magnification of 81,000×, and a physical pixel size of 0.899 Å with defocus values ranging from −0.5 to −2.0 μm. Each micrograph stack containing 40 frames were exposed to a total electron exposure of 50 e−/Å2 over 2.57 s.
Cryo-EM data processing
The flowcharts for data processing of all the datasets are illustrated in Extended Fig.2, 7, 11, respectively. The datasets were imported into cryoSPARC(v4.1.1) implementation of patch motion correction, and patch contrast transfer function(CTF) estimation 34. First, 100 of the motion-corrected micrographs were selected to perform blob picking and generate initial 2D classes. Representative 2D classes were then selected as templates for the template picking using all the micrographs.
For the MapSPARTA heterodimeric complex alone dataset, a total number of 9,423,011 particles were picked and extracted. Two rounds of 2D classification were performed, 2,920,243 particles were selected and merged for further ab-initio reconstruction to generate two initial models. One better model with a class of 1,877,578 particles were processed for 3D classification into 5 classes and heterogeneous refinement. And then, the best class of 360,155 particles was selected for another further heterogeneous refinement. A final class of 217,517 particles were kept for a non-uniform refinement with C1 symmetry, resulted to a 3.07 Å map.
For the gRNA/tDNA duplex bound MapSPARTA monomer dataset, a total number of 10,736,069 particles were picked and extracted. Two rounds of 2D classification were performed, 5,101,825 particles were selected and merged for further ab-initio reconstruction to generate three initial models. One best model with a class of 1,014,198 particles were processed for heterogeneous refinement. And then, the better class of 534,729 particles was selected for further homogeneous and non-uniform refinement, resulted to a 3.04 Å map.
For the tetramerized MapSPARTA-NA complex dataset, a similar data processing procedure was carried out with slight modification. First, a total number of 2,941,885 particles were picked and extracted. Two rounds of 2D classification were performed, and 1,265,215 particles were selected and merged for further ab-initio reconstruction to generate two initial models. Then, one better model of 822,366 particles were processed for a further heterogeneous refinement with two same volume inputs. Next, a better class of 619,908 particles were processed for a homogeneous refinement with C1 symmetry in a 2.93 Å map. To further push the map resolution, diverse refinement methods, including heterogeneous, homogeneous, and non-uniform refinement were combined to keep a final class of 490,999 particles to generate a 2.79 Å. To improve the local map quality, five different local tight masks generated by cryoSPARC and Chimera34,35, by extending the dilation radius by 5 pixels and applying a 3-pixel soft padding width, were used to perform five independent local refinements with the dataset of 490,999 particles in cryoSPARC resulting five quality improved maps, at resolution of 2.64 Å, 2.74 Å, 2.51 Å, 2.71 Å and 2.74 Å, separately. Finally, a high-quality composite EM map was generated via the 5 focused refined maps. The incomplete tetramer class were processed for determination of symmetric and asymmetric dimer of MapSPARTA. Specifically, 208, 458 particles were performed a 3D classification, the better class of 63,761 particles was selected for a further non-uniform refinement, resulted to a 3.33 Å map, which is a mixture state for both symmetric and asymmetric dimer of MapSPARTA. A further heterogeneous refinement was performed, and the better class was selected for a final non-uniform refinement, resulted to a 3.52 Å map for asymmetric dimer of MapSPARTA. In the meantime, 242,613 monomeric particles were also merged for further ab-initio reconstruction to generate two initial models, following a heterogeneous refinement, and a better class of 163,800 was performed a non-uniform refinement, resulted to a 3.28 Å which has more visible area than the map processed from the MapSPARTA monomer dataset with gRNA/tDNA duplex bound.
For the MapSPARTA tetramer with NAD+ dataset, a total number of 2,209,672 particles were picked and extracted. Two rounds of 2D classification were performed, and 1,317,121 particles were merged for further ab-initio reconstruction to generate two initial models. Then, one better model of 913,279 particles were processed for a further heterogeneous refinement with two same volume inputs. Next, a tetramer class of 847,719 particles were processed for further non-uniform refinement with C1 symmetry in a 2.98 Å map.
All reported resolutions were estimated based on the gold-standard Fourier shell correlation (FSC) = 0.143 criterion36.
Model building and refinement
Two initial models of TIR-APAZ and short_pAgo for the MapSPARTA heterodimeric complex were predicted by AlphaFold, and fitted as a rigid body into the MapSPARTA heterodimeric complex Cryo-EM map using Chimera35. Then, manual adjustments were done using Coot to yield the final atomic model37. Following, real-space refinement was performed to refine the model against cryo-EM density map with secondary structure and geometry restraints in PHENIX38.
The finalized model of the apo sated was used to fit into the other maps for model building. All the models were manually adjusted in COOT followed by real-space refinement in PHENIX38.
The all-atom contacts and geometry for the final models were validated by Molprobity (Table S1)39. All the structural figures were generated using PyMOL40, Chimera35 and ChimeraX41.
Extended Data
Extended Data Fig. 1 |. Purification and structural reconstruction of MapSPARTA.
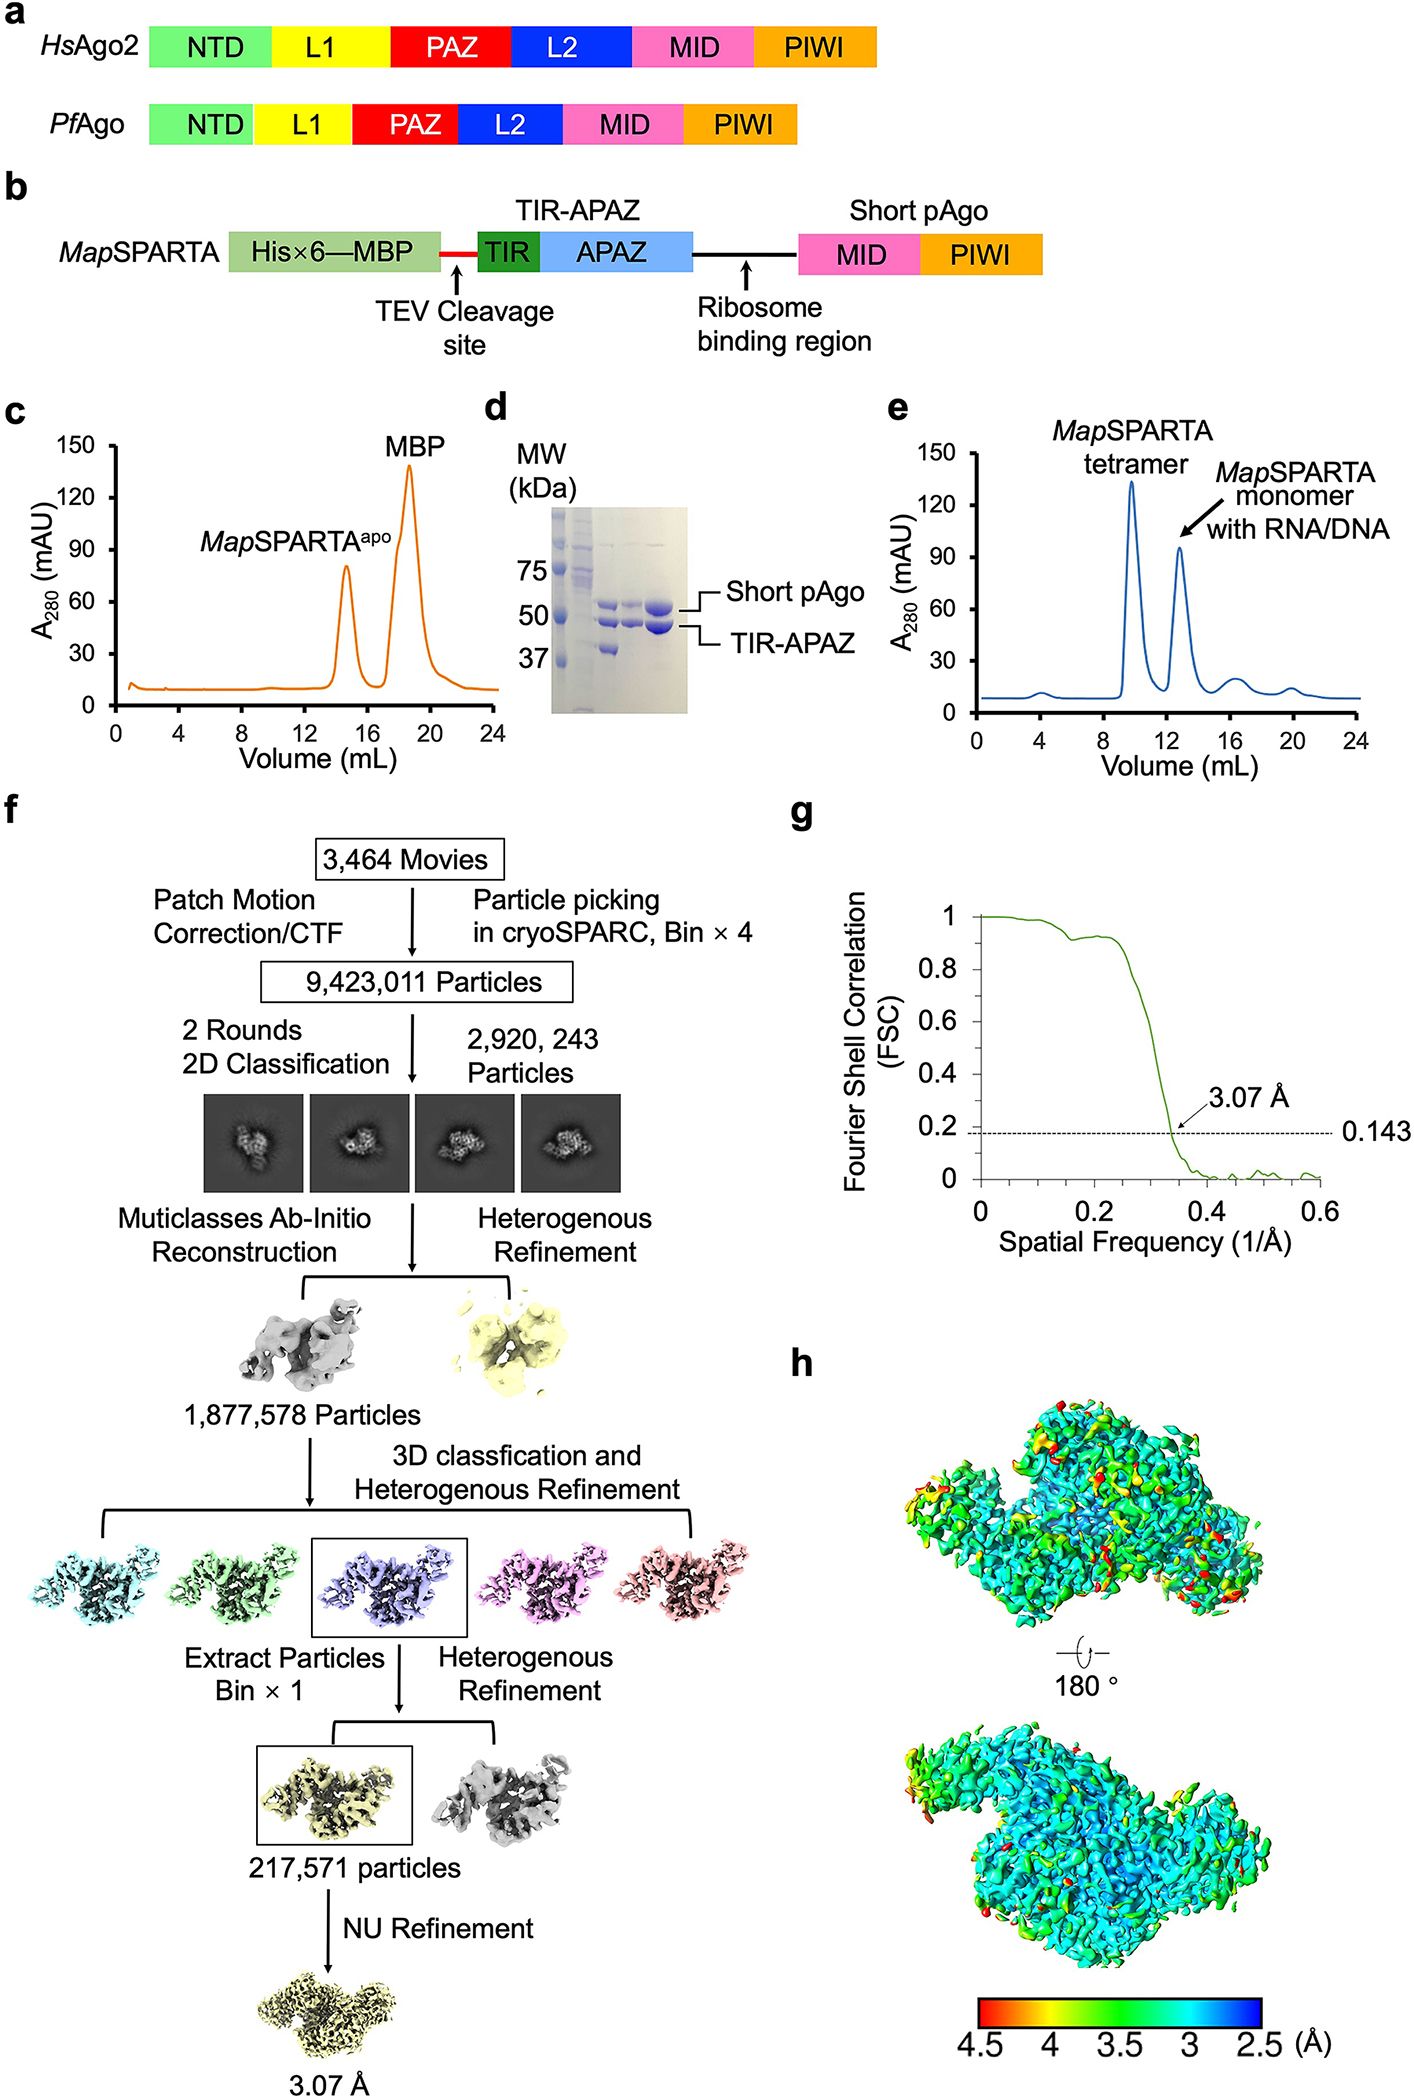
a, Domain arrangement of Homo sapiens Ago2 (an eAgo) and Pyrococcus furiosus Ago (a long pAgo).
b, Diagram of the construct for MapSPARTA expression. TIR-APARZ and short pAgo are cloned into a ploy-cistron for expression.
c, Gel filtration profile of MapSAPRTA in apo state purification.
d, SDS-PAGE of samples from gel filtration in panel c, demonstrating the purity of MapSPARTA.
e, Gel filtration profile of MapSPARTA in complex with DNA-RNA duplex, revealing a monomeric peak and a tetrameric peak.
f, Workflow of 3D reconstruction of MapSPARTA in apo state using cryoSPARC.
g, Fourier shell correlation (FSC) curve of 3D reconstructed of MapSPARTA in apo state.
h, Local resolutions of the reconstructions correlating with the final map in panel g. Resolutions are color-coded by scale bars.
Extended Data Fig. 2 |. Structural comparison.
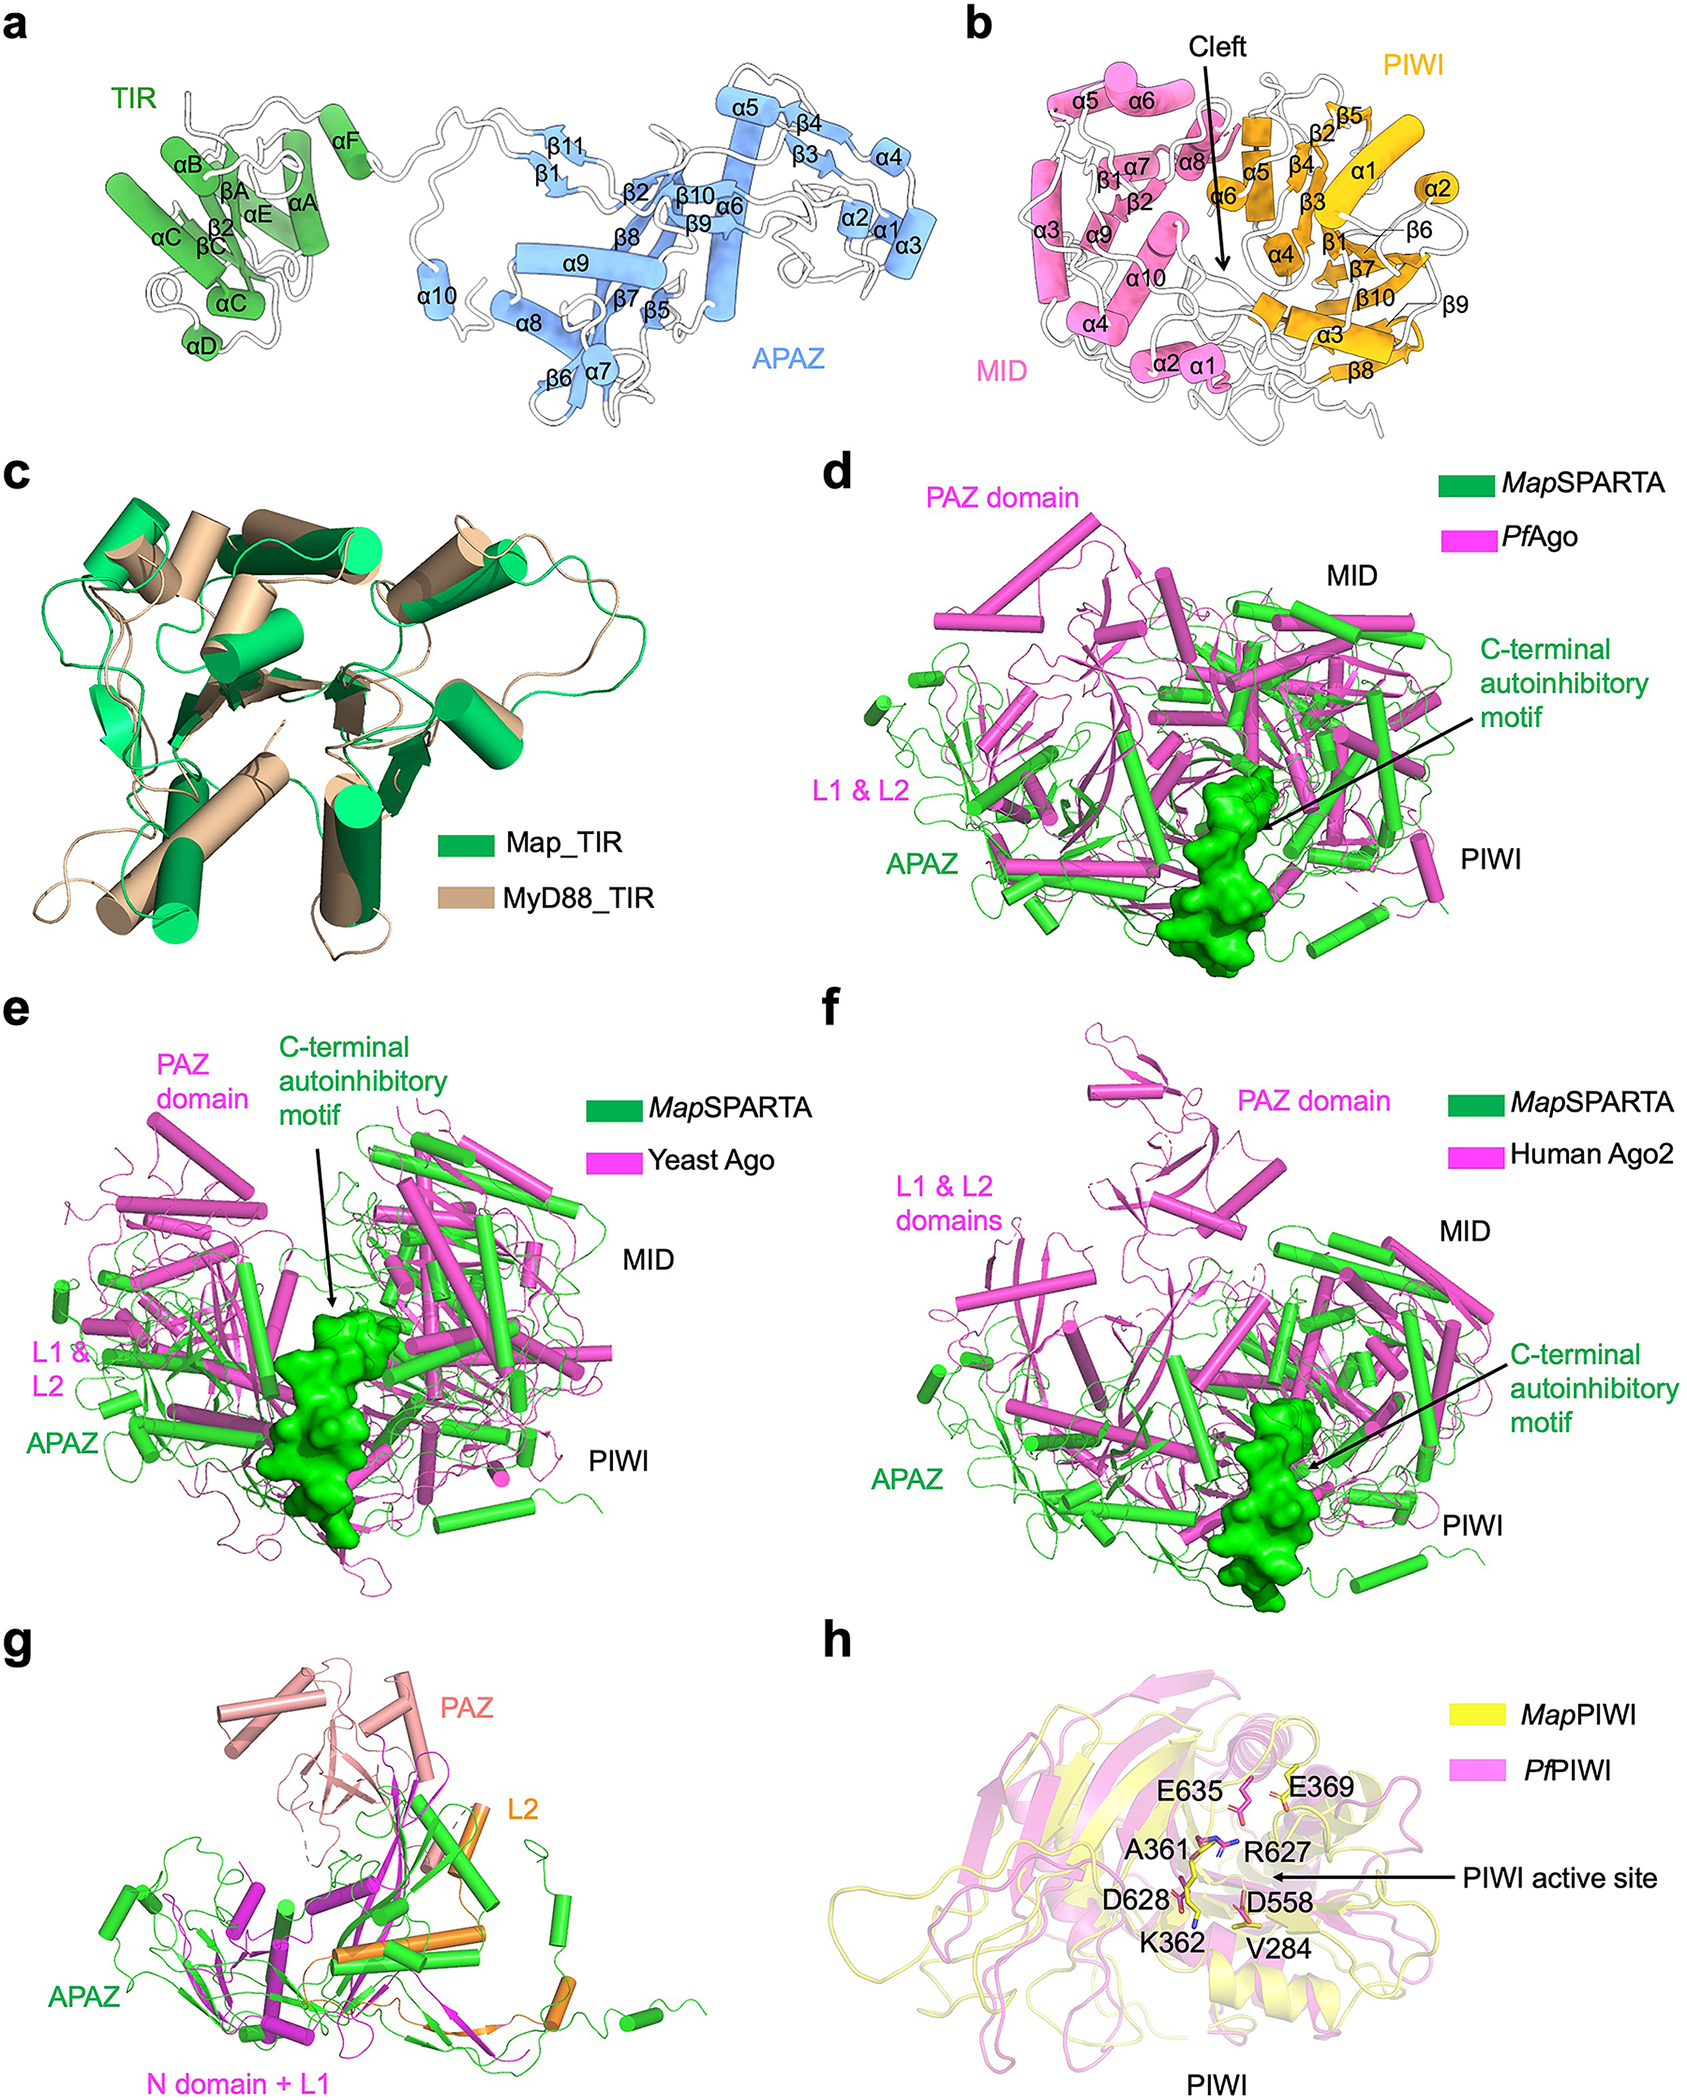
a, Ribbon diagram of TIR-APAZ with secondary structures labelled.
b, Ribbon diagram of pAgo, in which PIWI (yellow) and MID (magenta) form a cleft in the middle.
c, Overlaid structures of TIR domains from TIR-APAZ (green) and MyD88 (wheat, PDB ID 7BEQ).
d-f, Superimposed structures of MapSPARTA (green) with Pyrococcus furiosus Ago (PfAgo, magenta PDB ID 1U04, d), yeast Ago (magenta PDB ID 4F1N, e), and human Ago2 (magenta PDB ID 4EI1, f), respectively. The unique auto-inhibitory C-terminal motif of MapSPARTA is highlighted in surface representation (green).
g, Overlaid structures of APAZ domain (green) and the N domain (magenta), PAZ domain (pink), L1(magenta) and L2 (orange) domain of PfAgo.
h, Overlaid structures of PIWI domains from MapAgo (yellow) and PfAgo (magenta) with catalytic residues in sticks.
Extended Data Fig. 3 |. Interfaces between TIR-APAZ and pAgo.
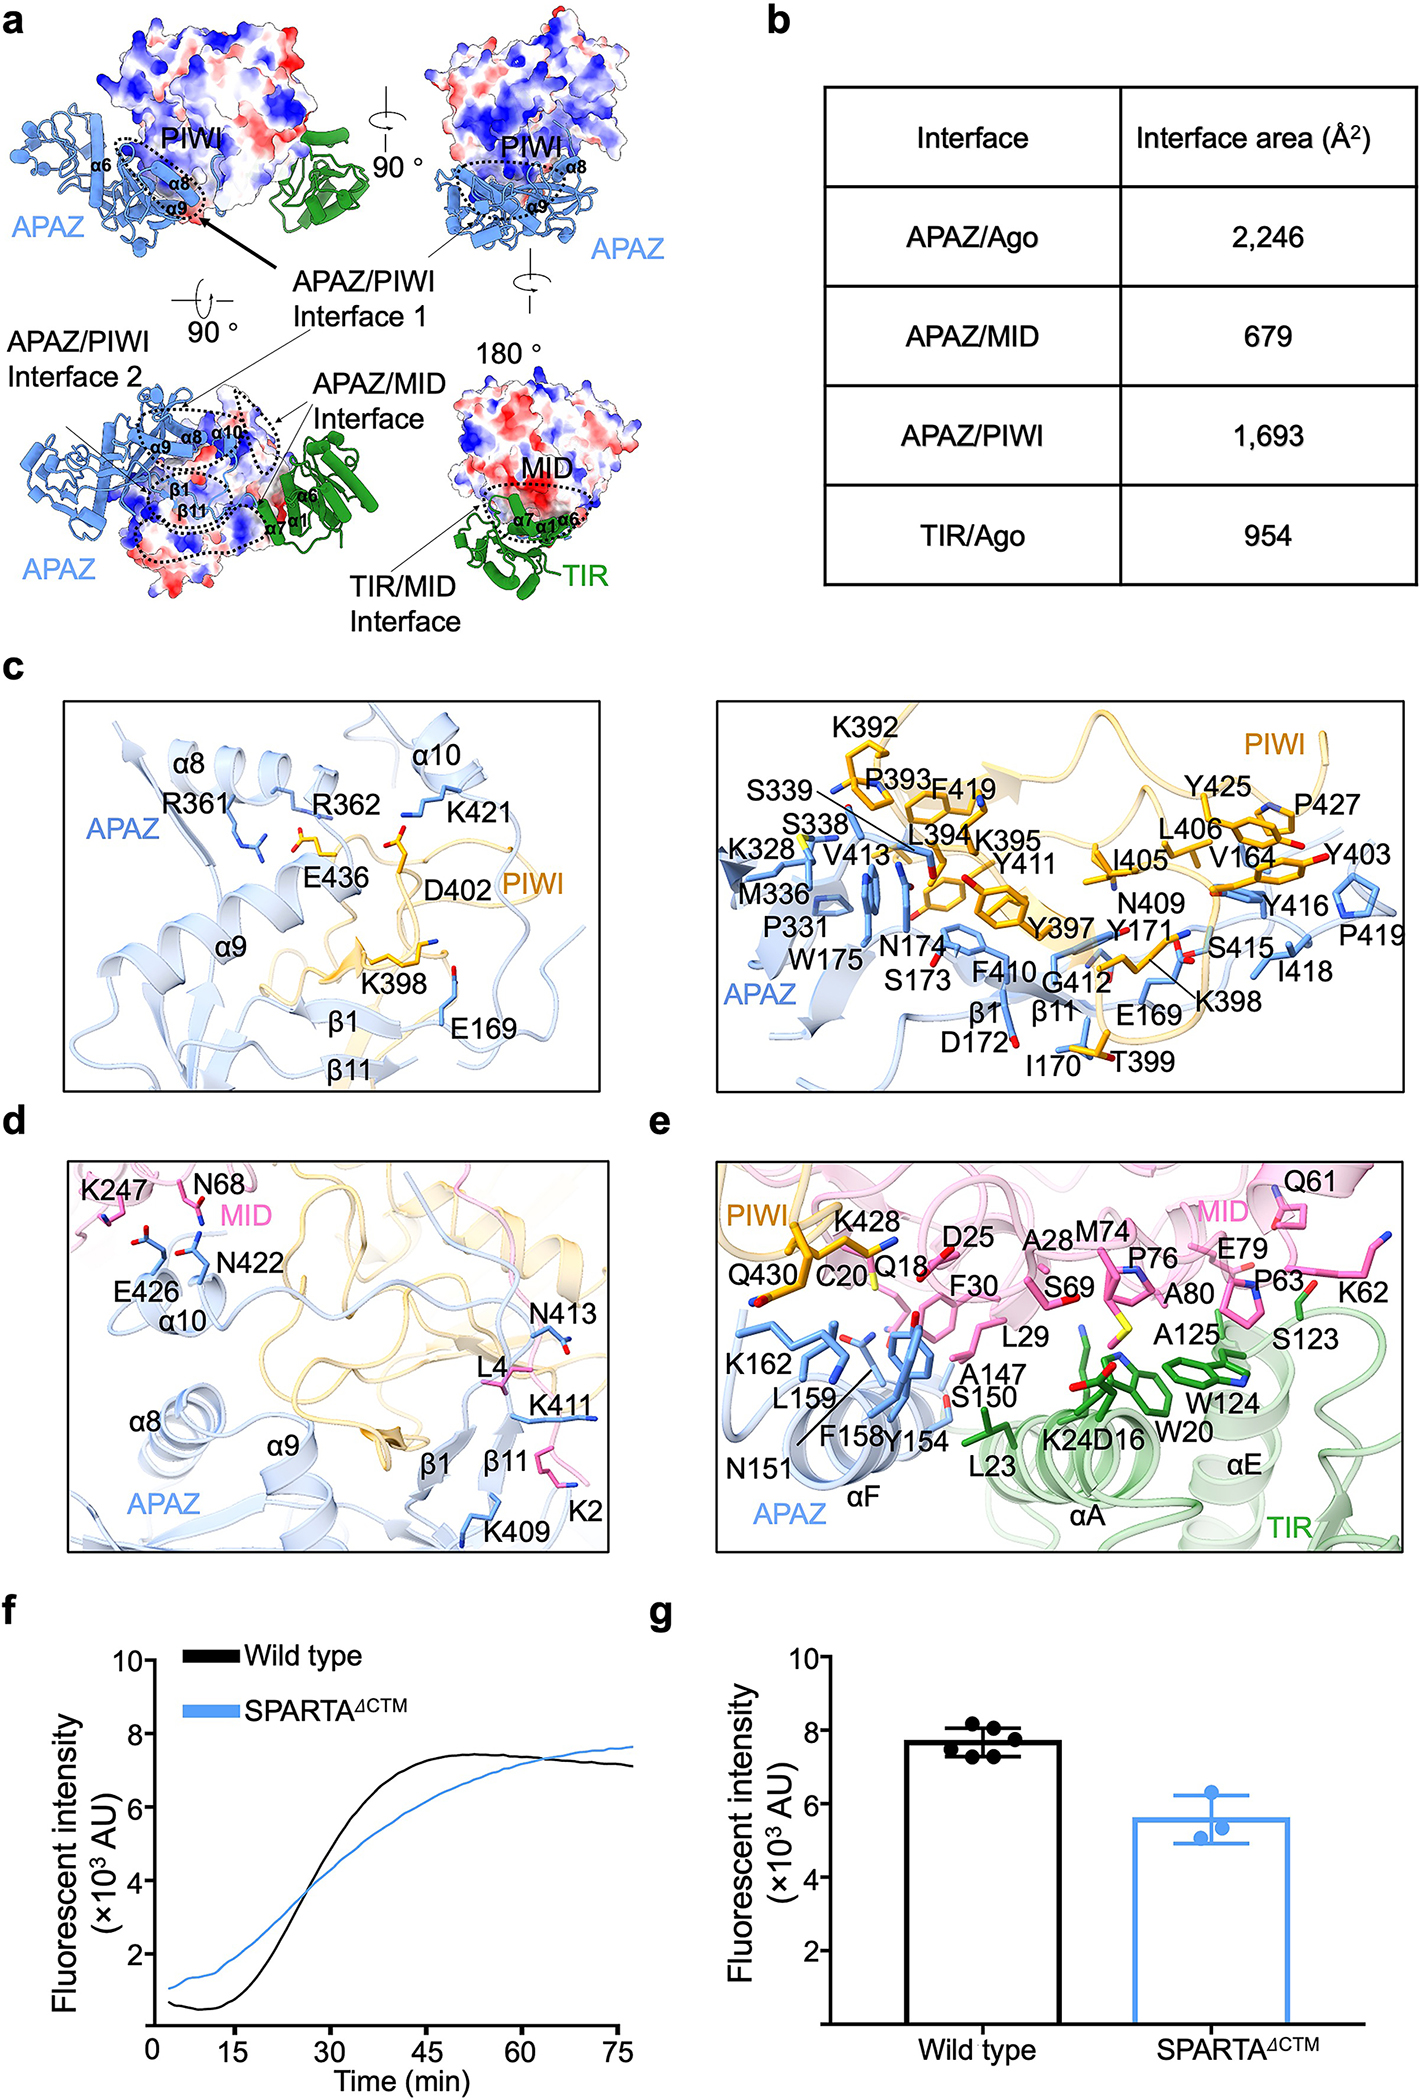
a, Interfaces between TIR-APAZ and pAgo with pAgo showing in electrostatic surface and TIR-APAZ in ribbon diagram.
b, Surface areas of different interfaces illustrated in panel a.
c, Interfaces between the APAZ domain and the PIWI domain. Key residues on the interfaces were highlighted in sticks.
d, Interfaces between the APAZ domain and the MID domain. Key residues on the interfaces were highlighted in sticks.
e, Detailed interactions between the TIR domain and the MID domain. Key residues on the interfaces were highlighted in sticks.
f, Representative kinetics data of NAD+ hydrolysis by wildtype and CTM-truncated MapSPARTA.
g, Quantitation of the catalytic activities of wildtype and CTM-truncated MapSPARTA. Data are mean ± SD from 3 or more replicates as indicated (Wild type, n=6; CTM-truncated SPARTA, n=3).
Extended Data Fig. 4 |. Reconstruction of the MapSPARTA tetramer, dimer, and monomer.
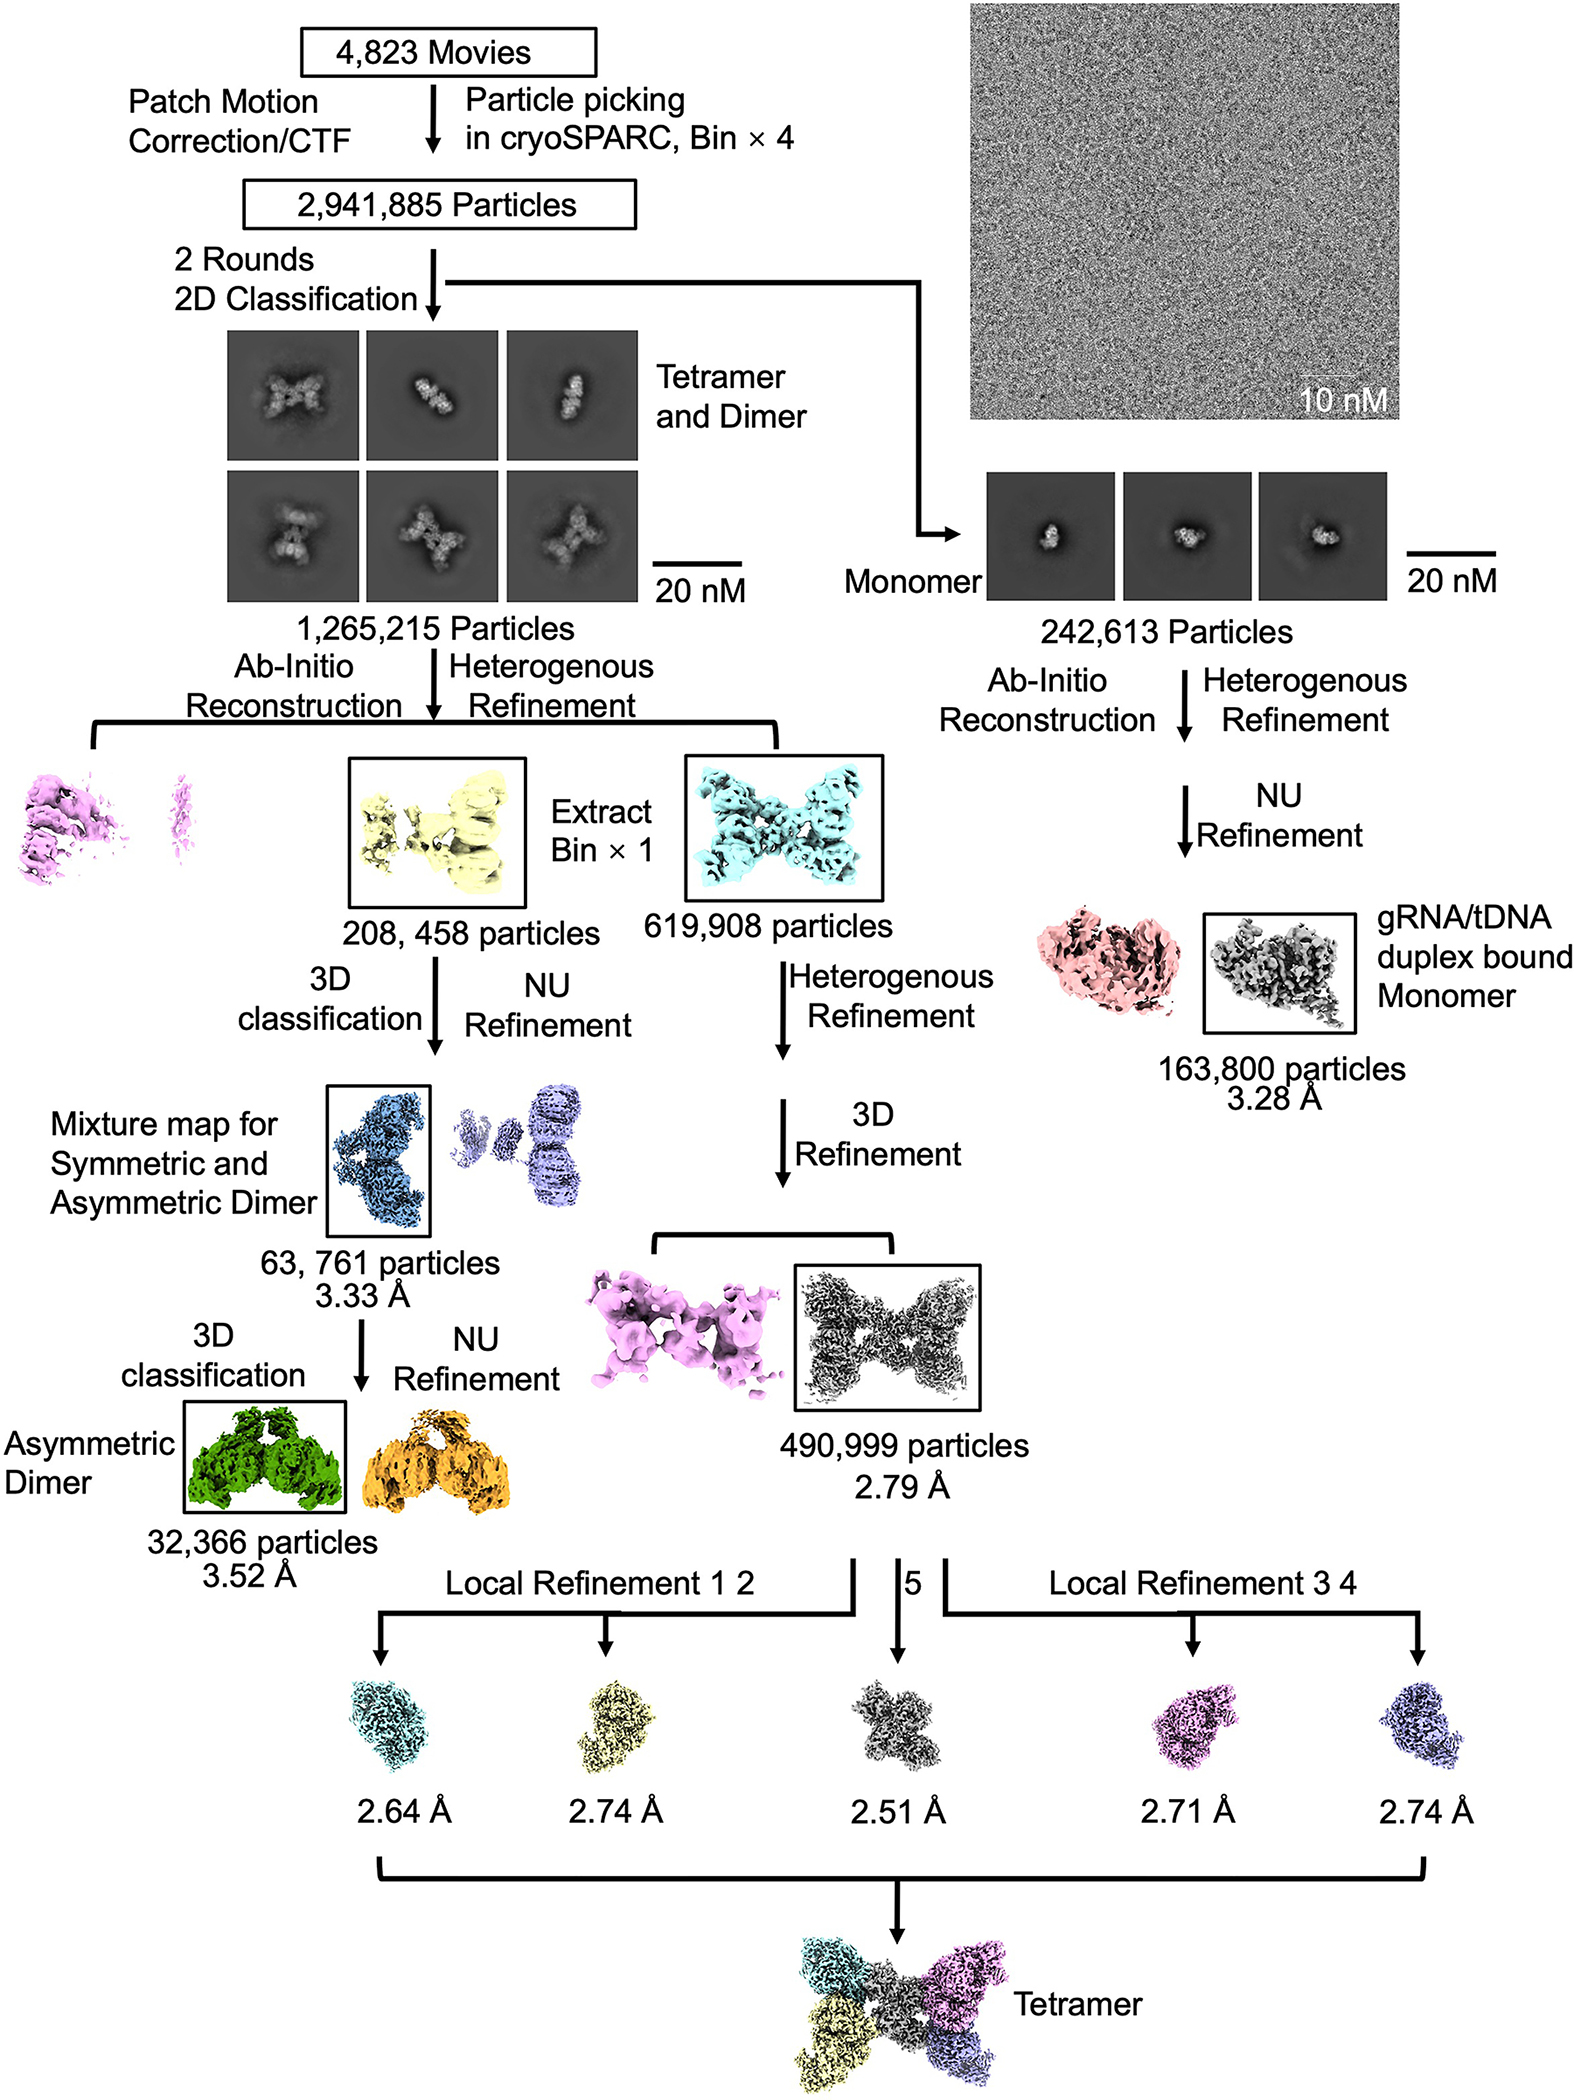
Workflow of 3D reconstruction of MapSPARTA tetramer, dimer, and monomer using cryoSPARC.
Extended Data Fig. 5 |. Resolutions of the MapSPARTA tetramer.
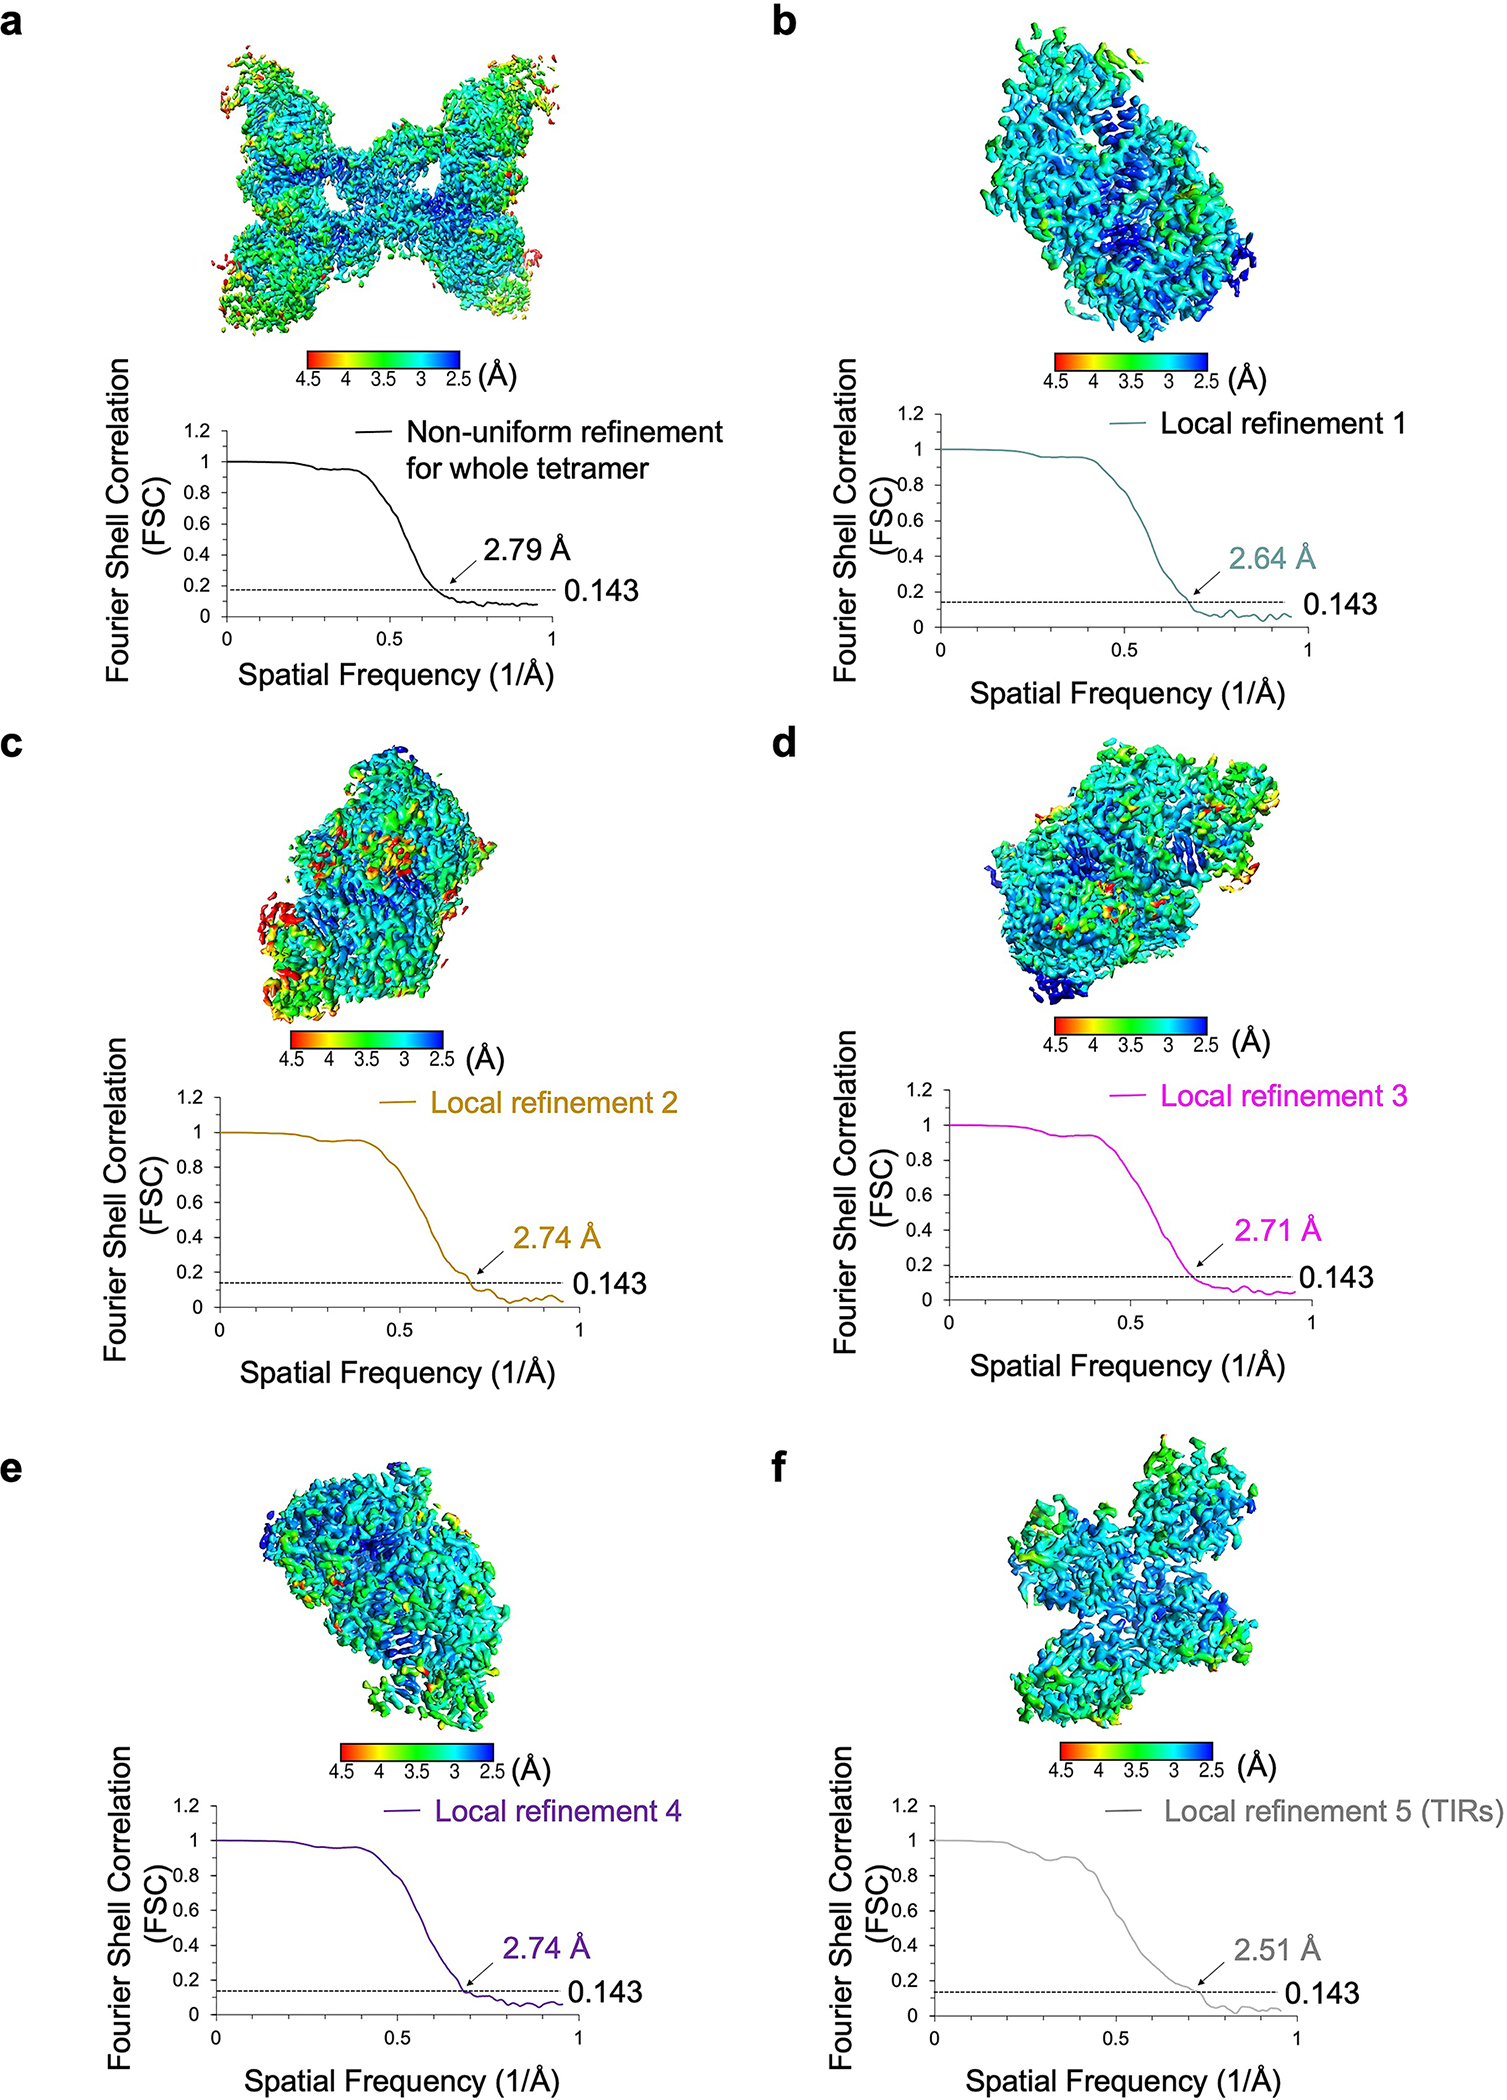
Local resolutions and FSC curves of reconstructed MapSPARTA tetramer (a), each protomer of the tetramer (b-e), and TIR domains (f).
Extended Data Fig. 6 |. Mechanism of TIR tetramerization.
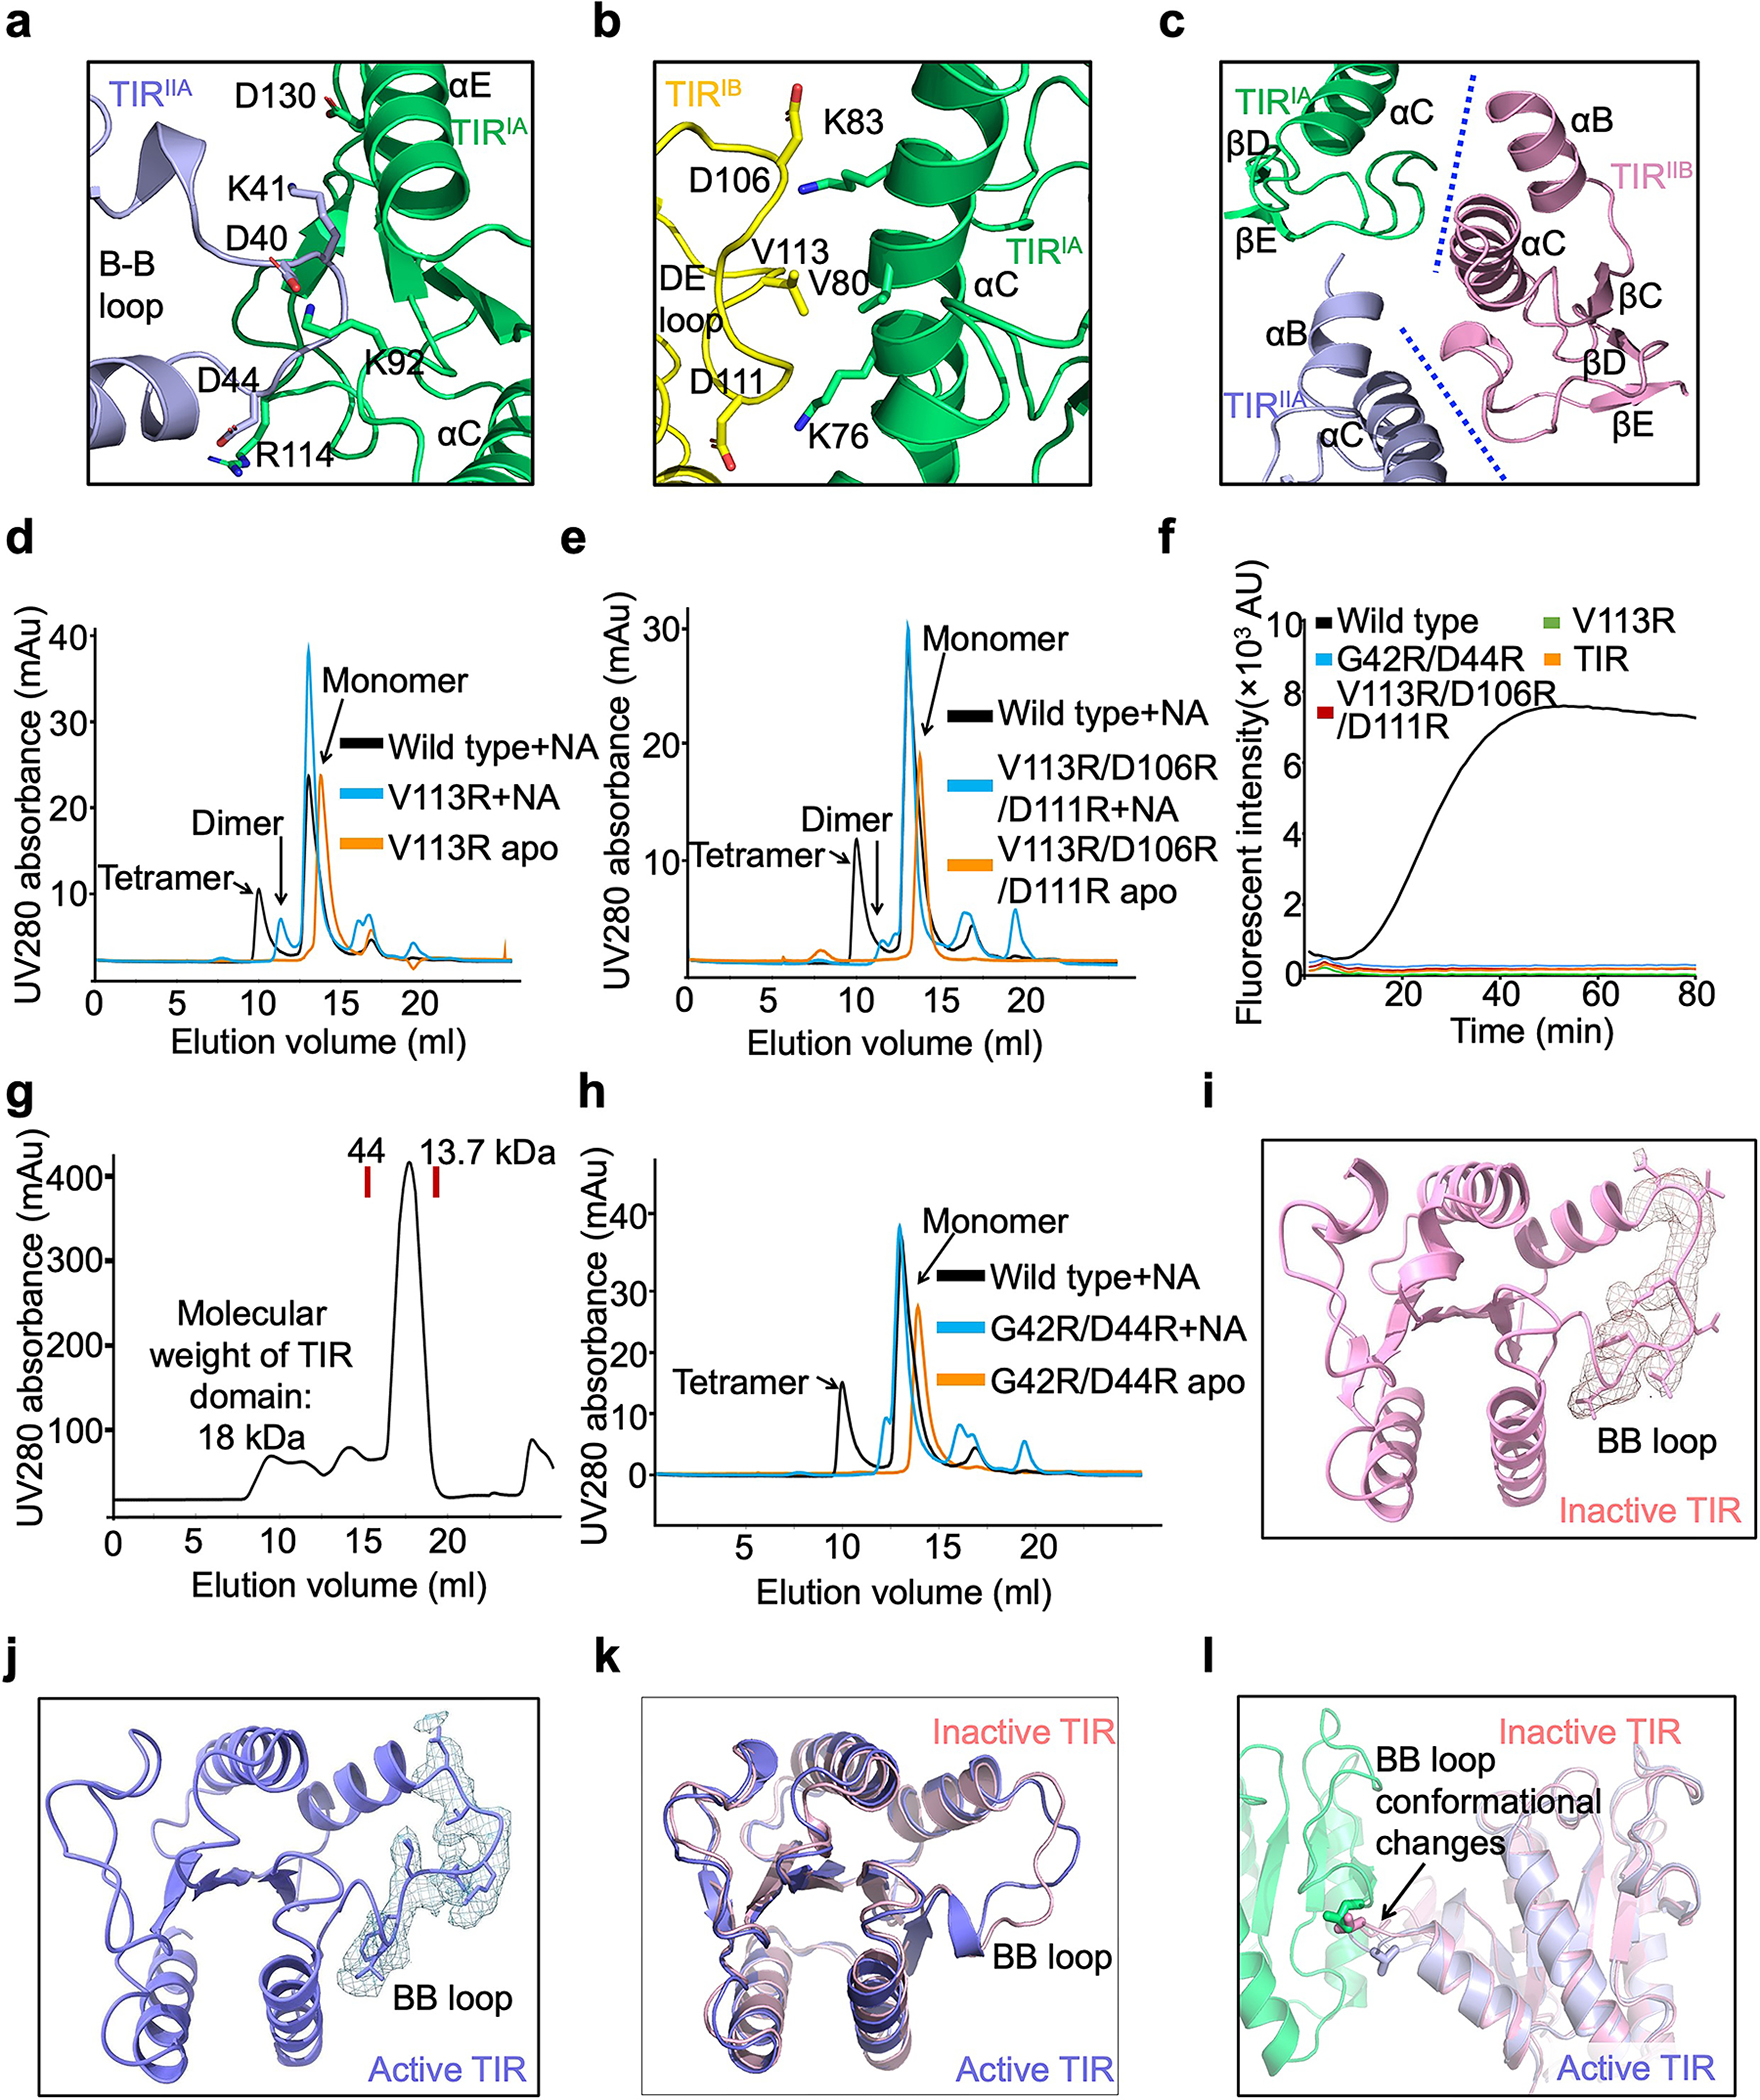
a, Detailed interactions between TIRIA and TIRIIA with interfacial residues in sticks.
b, Interface between TIR and TIR with key residues highlighted in sticks.
c, TIRIIB engages with TIRIA and TIRIIA via tetramerization interfaces.
d, Compared to wild type, V113R eluted as dimers and monomers in the presence of RNA/DNA.
e, Compared to wild type, V113R/D106R/D111R eluted as dimers and monomers in the presence of RNA/DNA.
f, Representative kinetic data of NAD+ hydrolysis by wild type and mutant MapSPARTA.
g, Gel filtration profile of TIR domain alone, showing that TIR domain eluted as a monomer.
h, Compared to wild type, G42R/D44R eluted as monomers in the presence of RNA/DNA.
i, j, BB loop in TIR in inactive state (i) and active state (j) fitted into cryo-EM densities at 2.0 𝛔.
k, Overlaid structures of TIR in inactive state (pink) and in active state (blue), revealing conformational changes of the BB-loop.
l, BB loop conformational changes are critical for the formation of the asymmetric dimer. Inactive TIR modelled into the asymmetric dimer revealed that the BB loop in inactive state could clash with the other protomer.
Extended Data Fig. 7 |. MapSPARTA with NAD+ and catalytic mechanism of TIR.
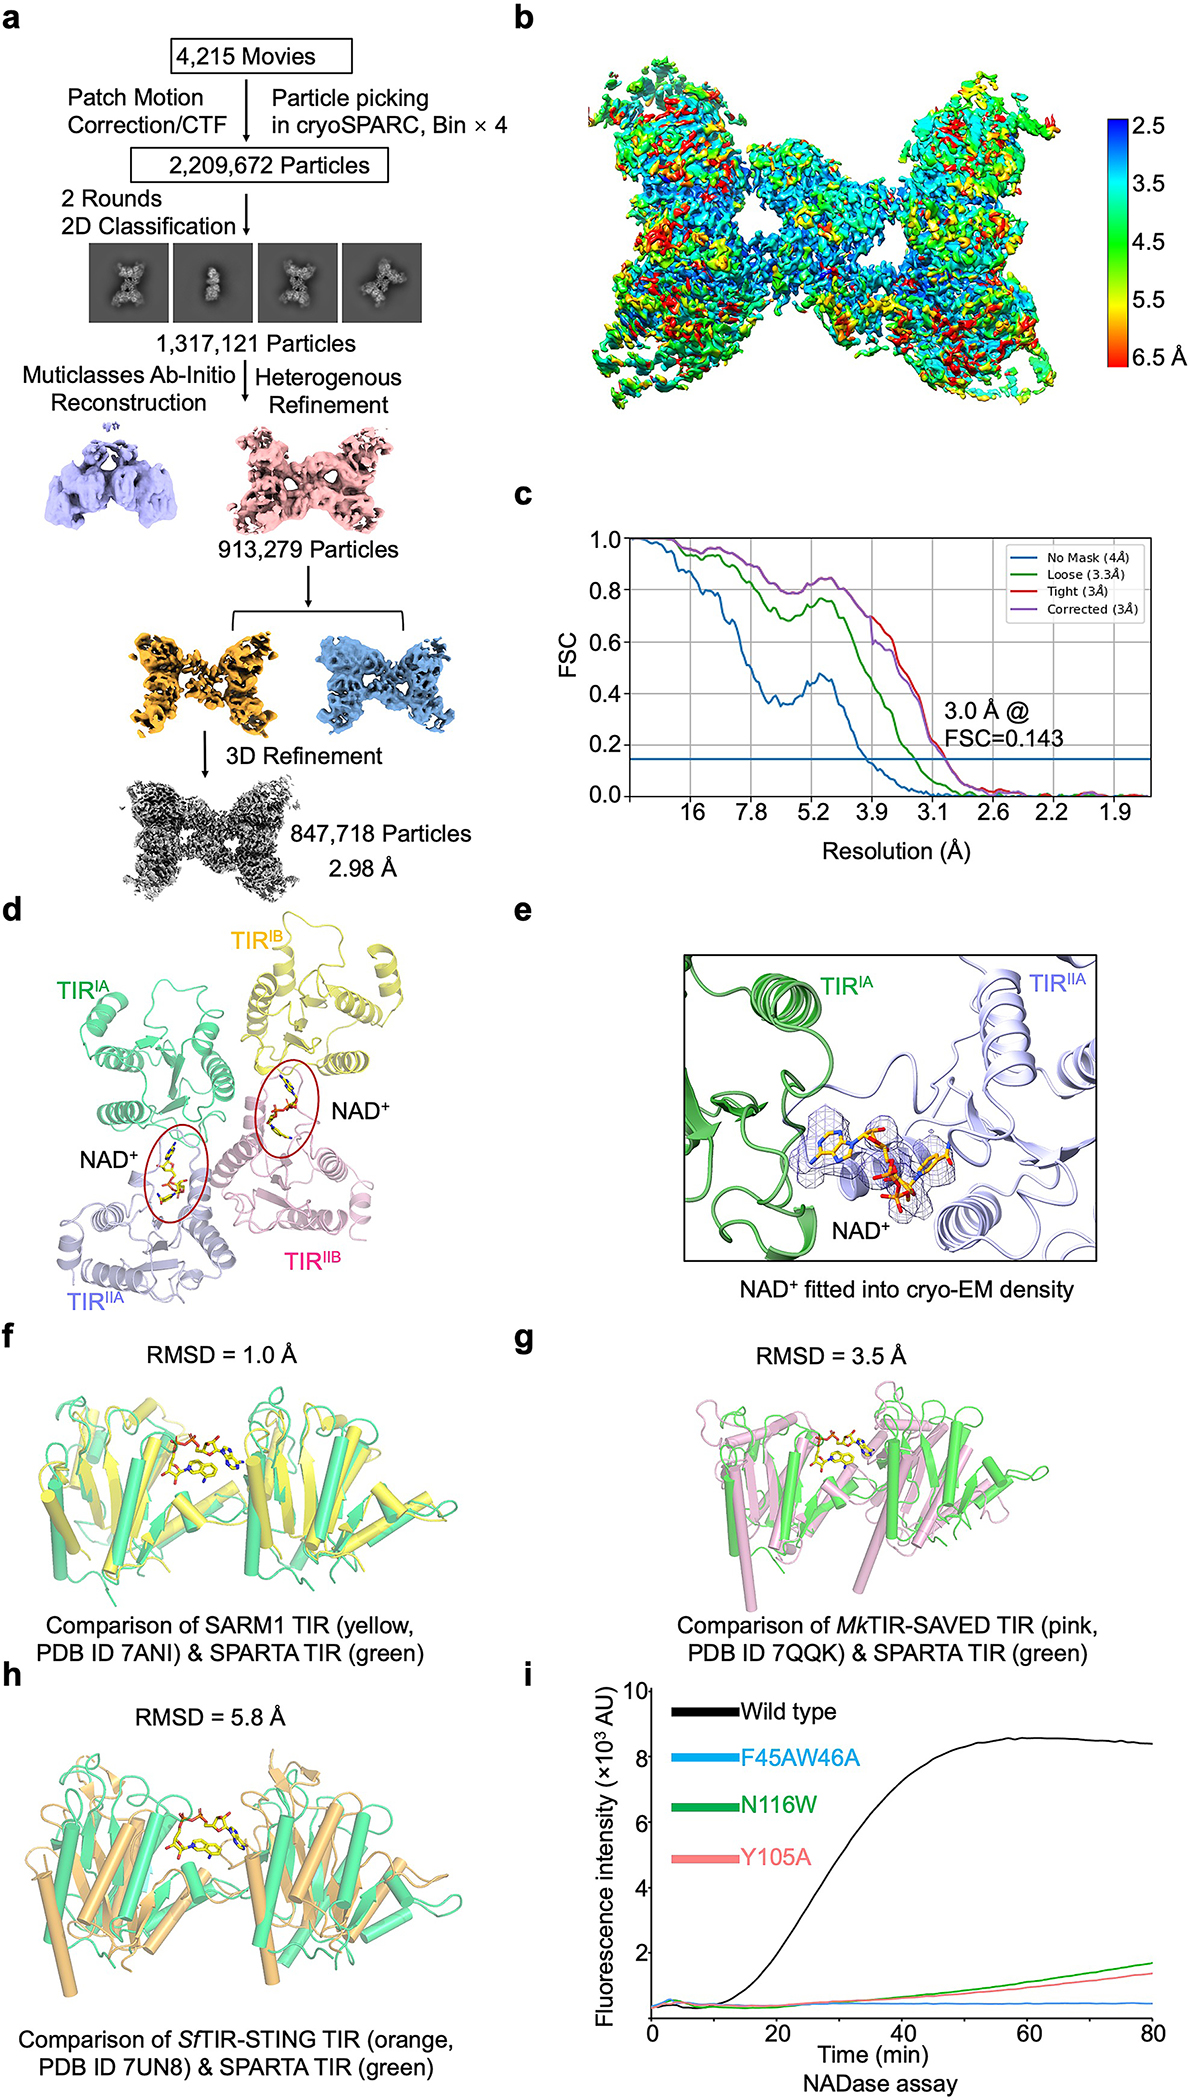
a, Workflow of 3D reconstruction of MapSPARTA tetramer with NAD+.
b, Local resolutions of reconstructed MapSPARTA tetramer with NAD+.
c, FSC curves of reconstructed MapSPARTA tetramer.
d, TIR tetramer in complex with NAD+, revealing two NAD+ binding sites in the tetramer.
e, NAD+ fitted into cryo-EM density at 2.0 𝛔.
f, Overlaid structures of TIR domains from MapSPARTA and human SARM1 with a root-mean-square deviation (RMSD) of 1.0 Å.
g, Overlaid structures of TIR domains from MapSPARTA and Microbacterium ketosireducens (Mk) TIR-SAVED with an RMSD of 3.5 Å.
h, Overlaid structures of TIR domains from MapSPARTA and Sphingobacterium faecium (Sf) TIR-STING with an RMSD of 5.8 Å.
i, Representative kinetic data of NAD+ hydrolysis by MapSPARTA wildtype and NAD+ coordinating mutants.
Extended Data Fig. 8 |. Interfaces between MapSPARTA and RNA/DNA duplex.
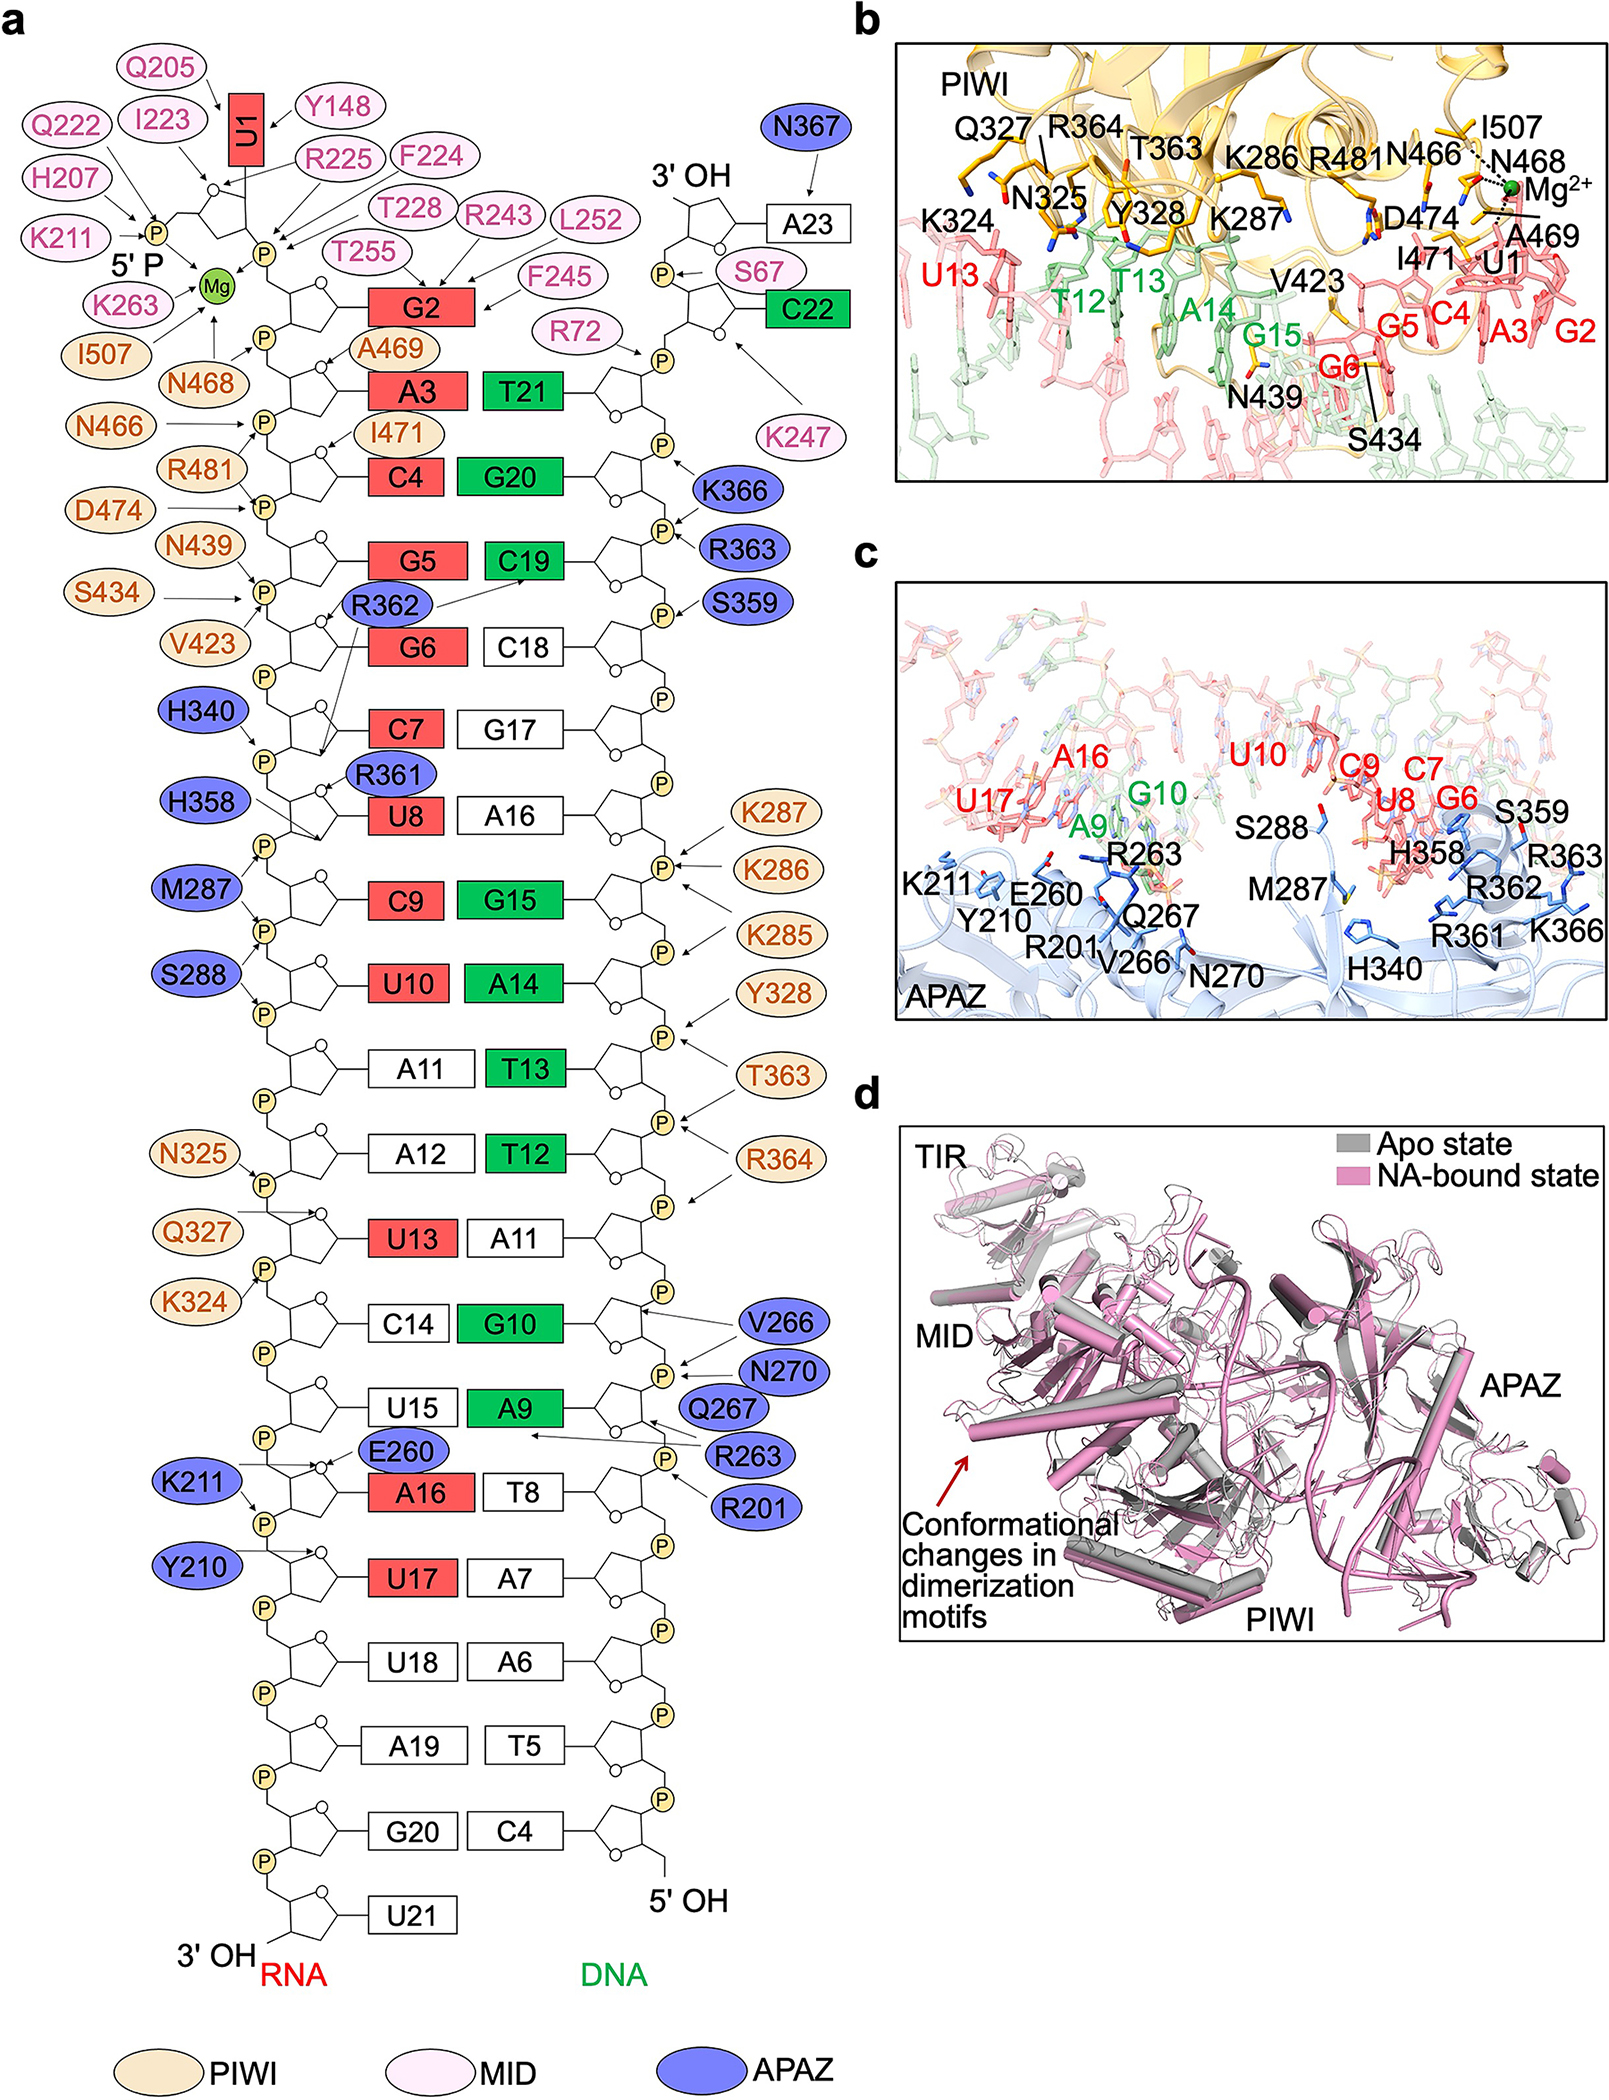
a,Schematic depiction of the detailed interactions between MapSPARTA and RNA/DNA duplex. Residues from PIWI domain, MID domain and APAZ domain are colored in yellow, pink, and blue, respectively.
b,Detailed interactions between PIWI domain and RNA-DNA duplex. Residues involved in coordinating RNA-DNA duplex are highlighted in sticks. DNA and RNA bases are labelled in green and red, respectively.
c, An enlarged view of the interface between APAZ and RNA-DNA duplex. Residues involved in interacting with RNA-DNA duplex are highlighted in sticks. DNA and RNA bases are labelled in green and red, respectively.
d, Overlaid structures of apo MapSPARTA and MapSPARTA with RNA/DNA, revealing the tilting of negative-charged motif and positive-charged pocket critical for MID-MID interactions mediated dimerization.
Extended Data Fig. 9 |. Recognition of RNA by MapSPARTA.
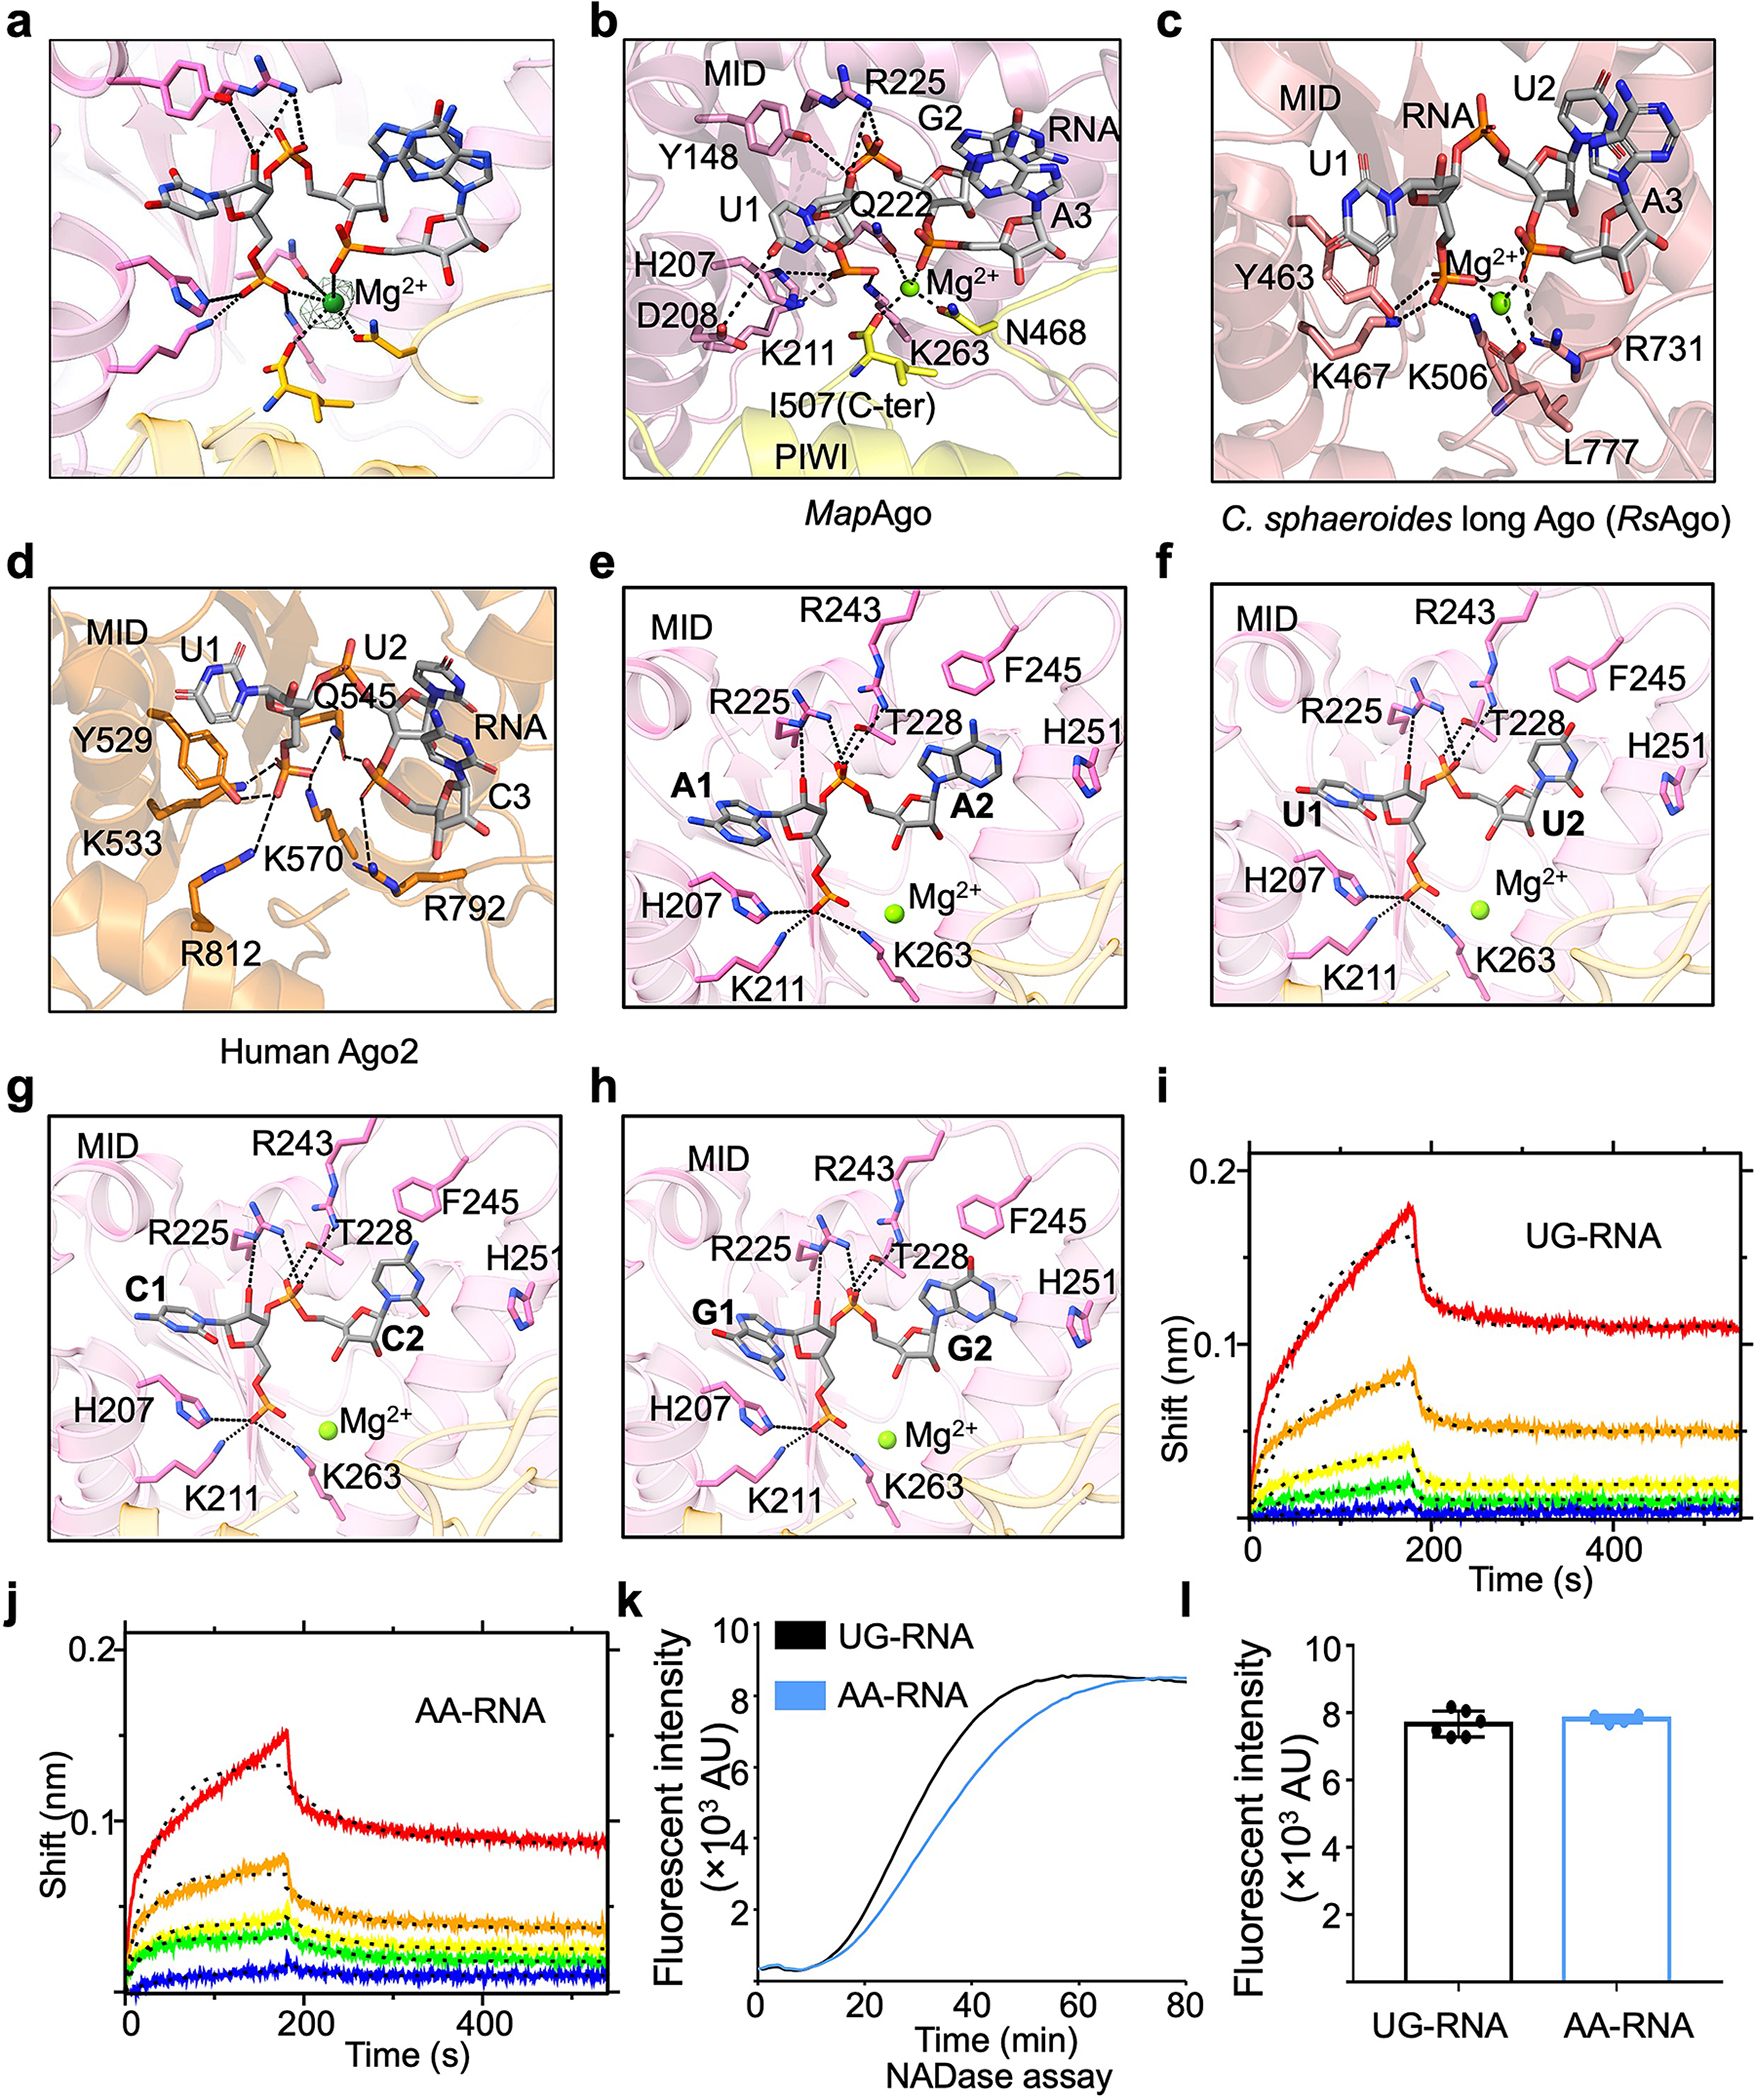
a, A Magnesium ion fitted into cryo-EM density at 2.5 𝛔.
b-d, Expanded views of the 5’ nucleotide of guide RNA coordinated by residues in pockets of MID domains from MapAgo (b), Cereibacter sphaeroides long Ago (PDB ID 5AWH, c), and human Ago2 (PDB ID 4W5T, d). Magnesium ions in spheres are responsible in coordinating guide RNA by interacting with phosphate groups. Residues involved in coordinating guide RNA are highlighted in sticks.
e-h, AA (e), UU (f), CC (g), and GG (h) as the first and second RNA nucleotides were modelled into the binding pocket, revealing a similar mechanism of being recognized by MapSPARTA.
i, j, The sensorgrams of wild type SPARTA binding to the chip-immobilized RNAs, UG-RNA (i) and AA-RNA (j), are expressed in shift versus time. The protein concentrations were 50, 25, 12.5, 6.25, and 3.12 nM (from top to bottom).
k, Representative kinetic data of NAD+ hydrolysis by MapSPARTA in the presence of UG-RNA or AA-RNA.
l, Plotted graphs of MapSPARTA catalysis stimulated by UG-RNA or AA-RNA. Data are mean ± SD from more than 3 replicates as indicated (UG-RNA, n=6; AA-RNA, n=4).
Extended Data Fig. 10 |. Reconstruction of MapSPARTA monomer in complex with RNA/DNA.
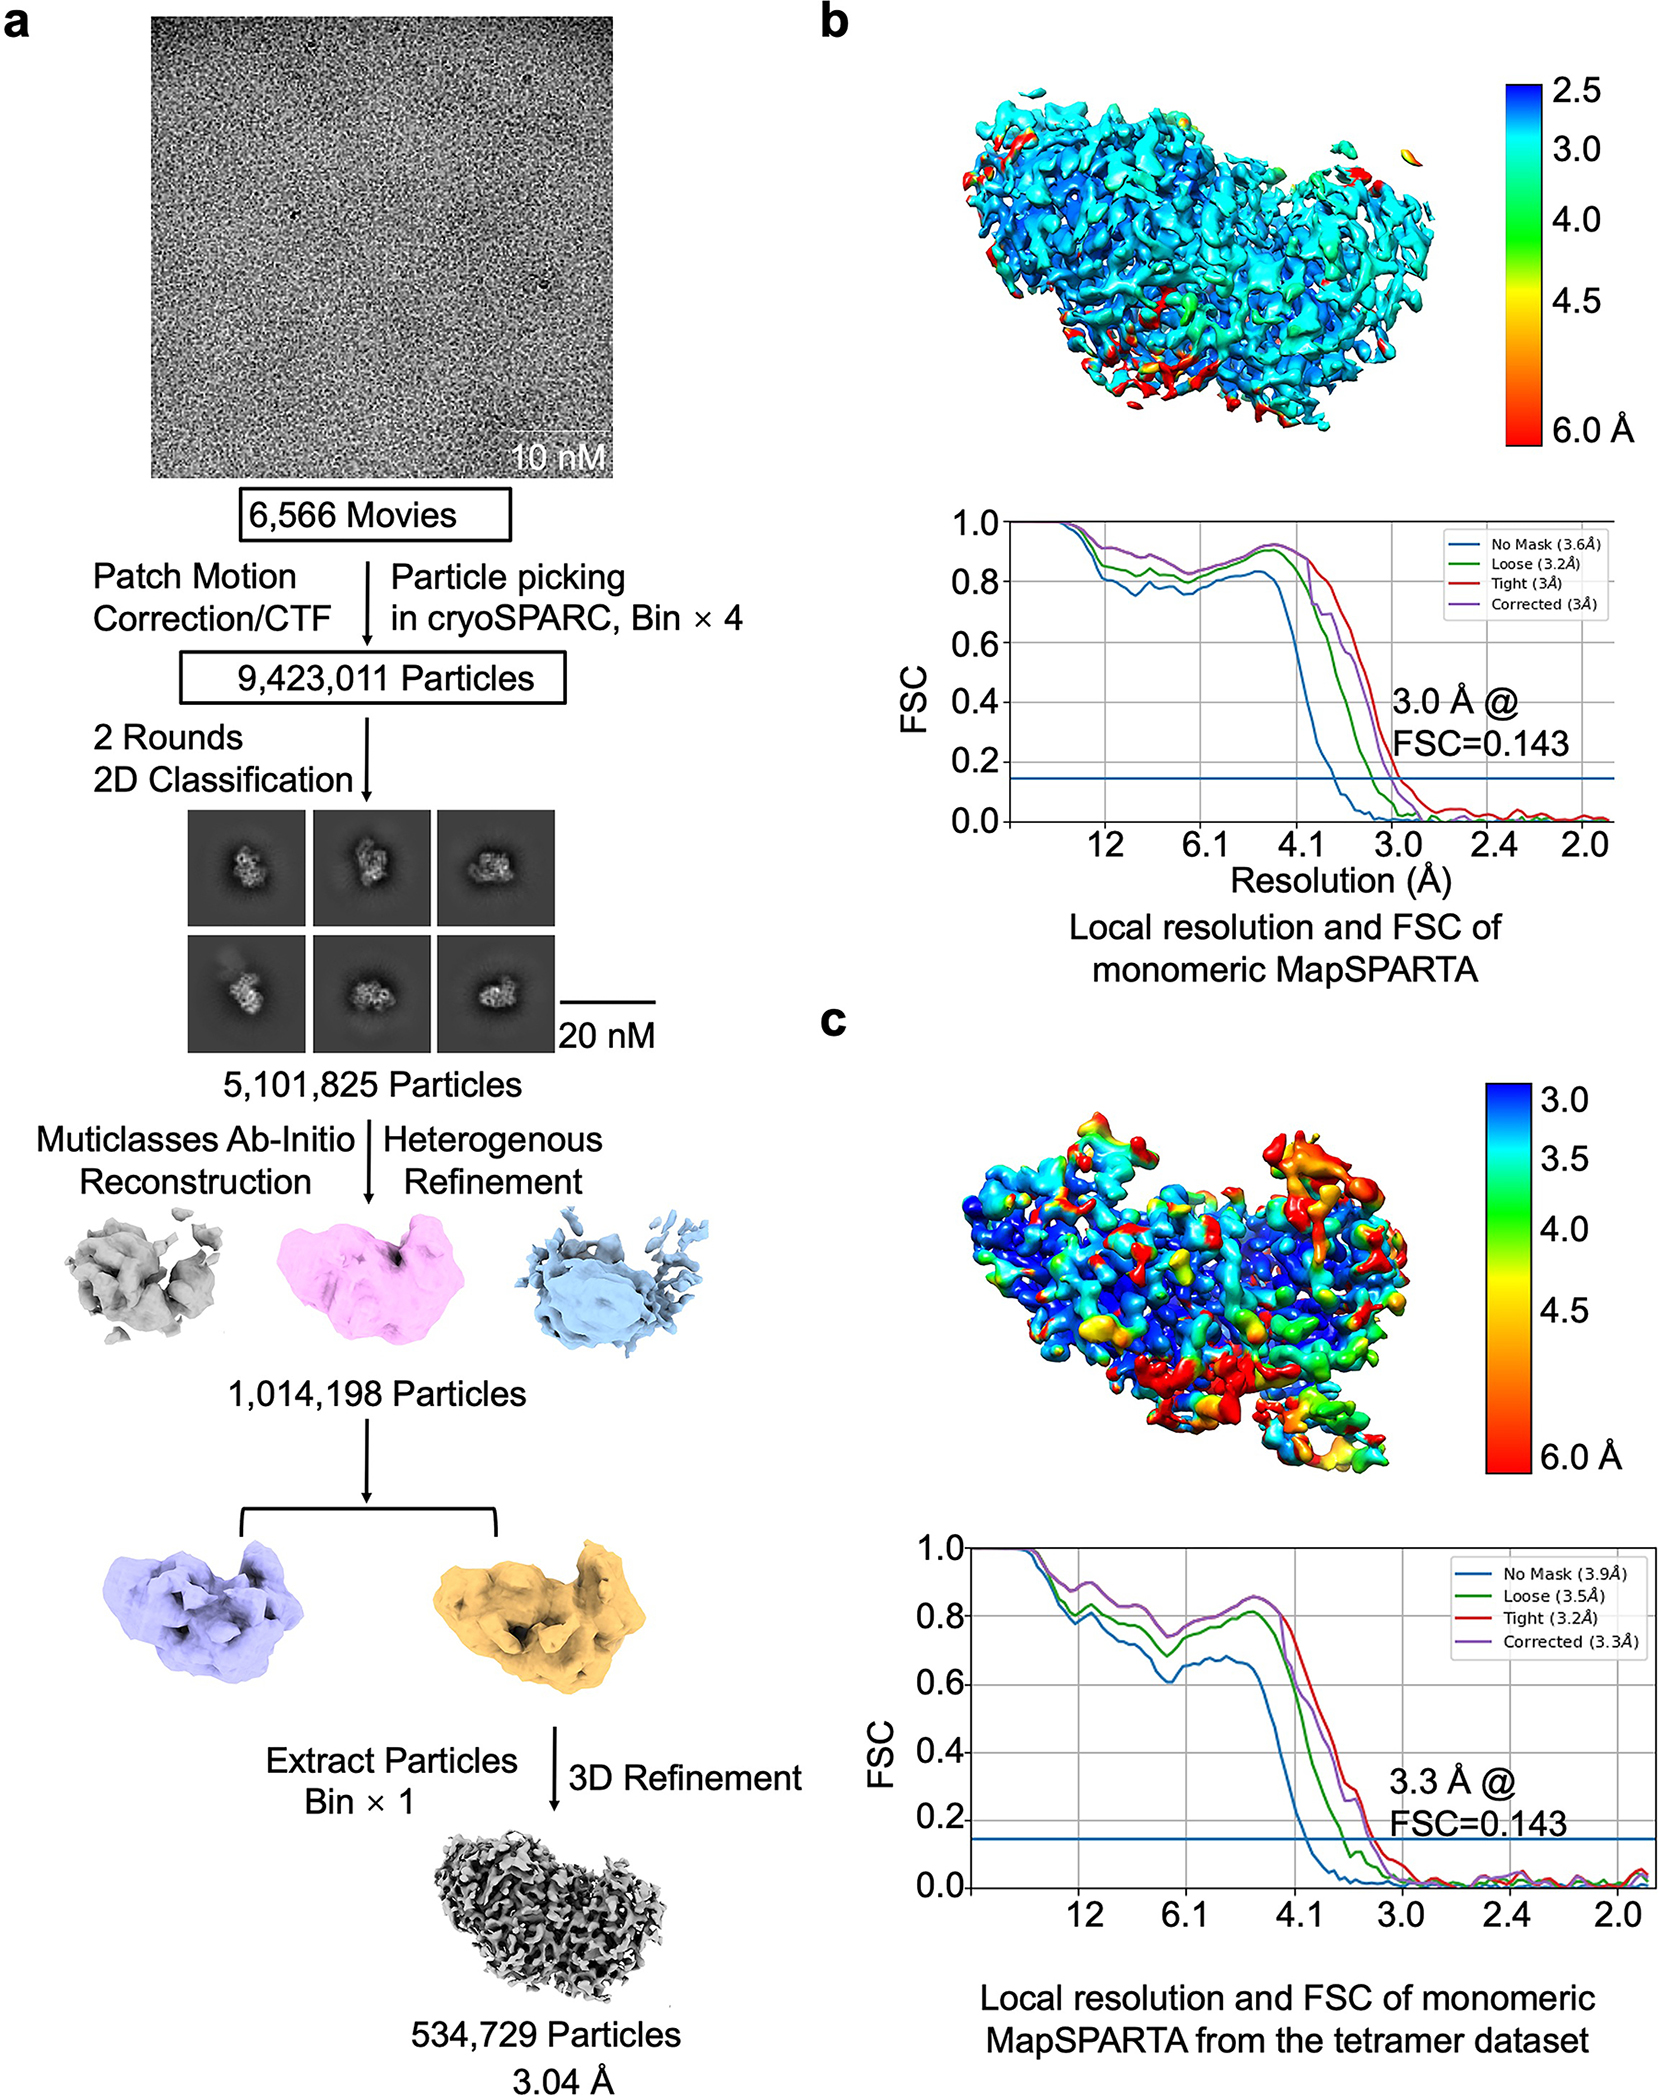
a, Workflow of 3D reconstruction of MapSPARTA monomer with RNA/DNA. b, Local resolutions and FSC curves of reconstructed MapSPARTA monomer with RNA/DNA from monomeric peak on gel filtration.
c, Local resolutions and FSC curves of reconstructed MapSPARTA monomer with RNA/DNA from the tetramer dataset.
Extended Data Fig. 11 |. RNA/DNA-bound MapSPARTA dimers.
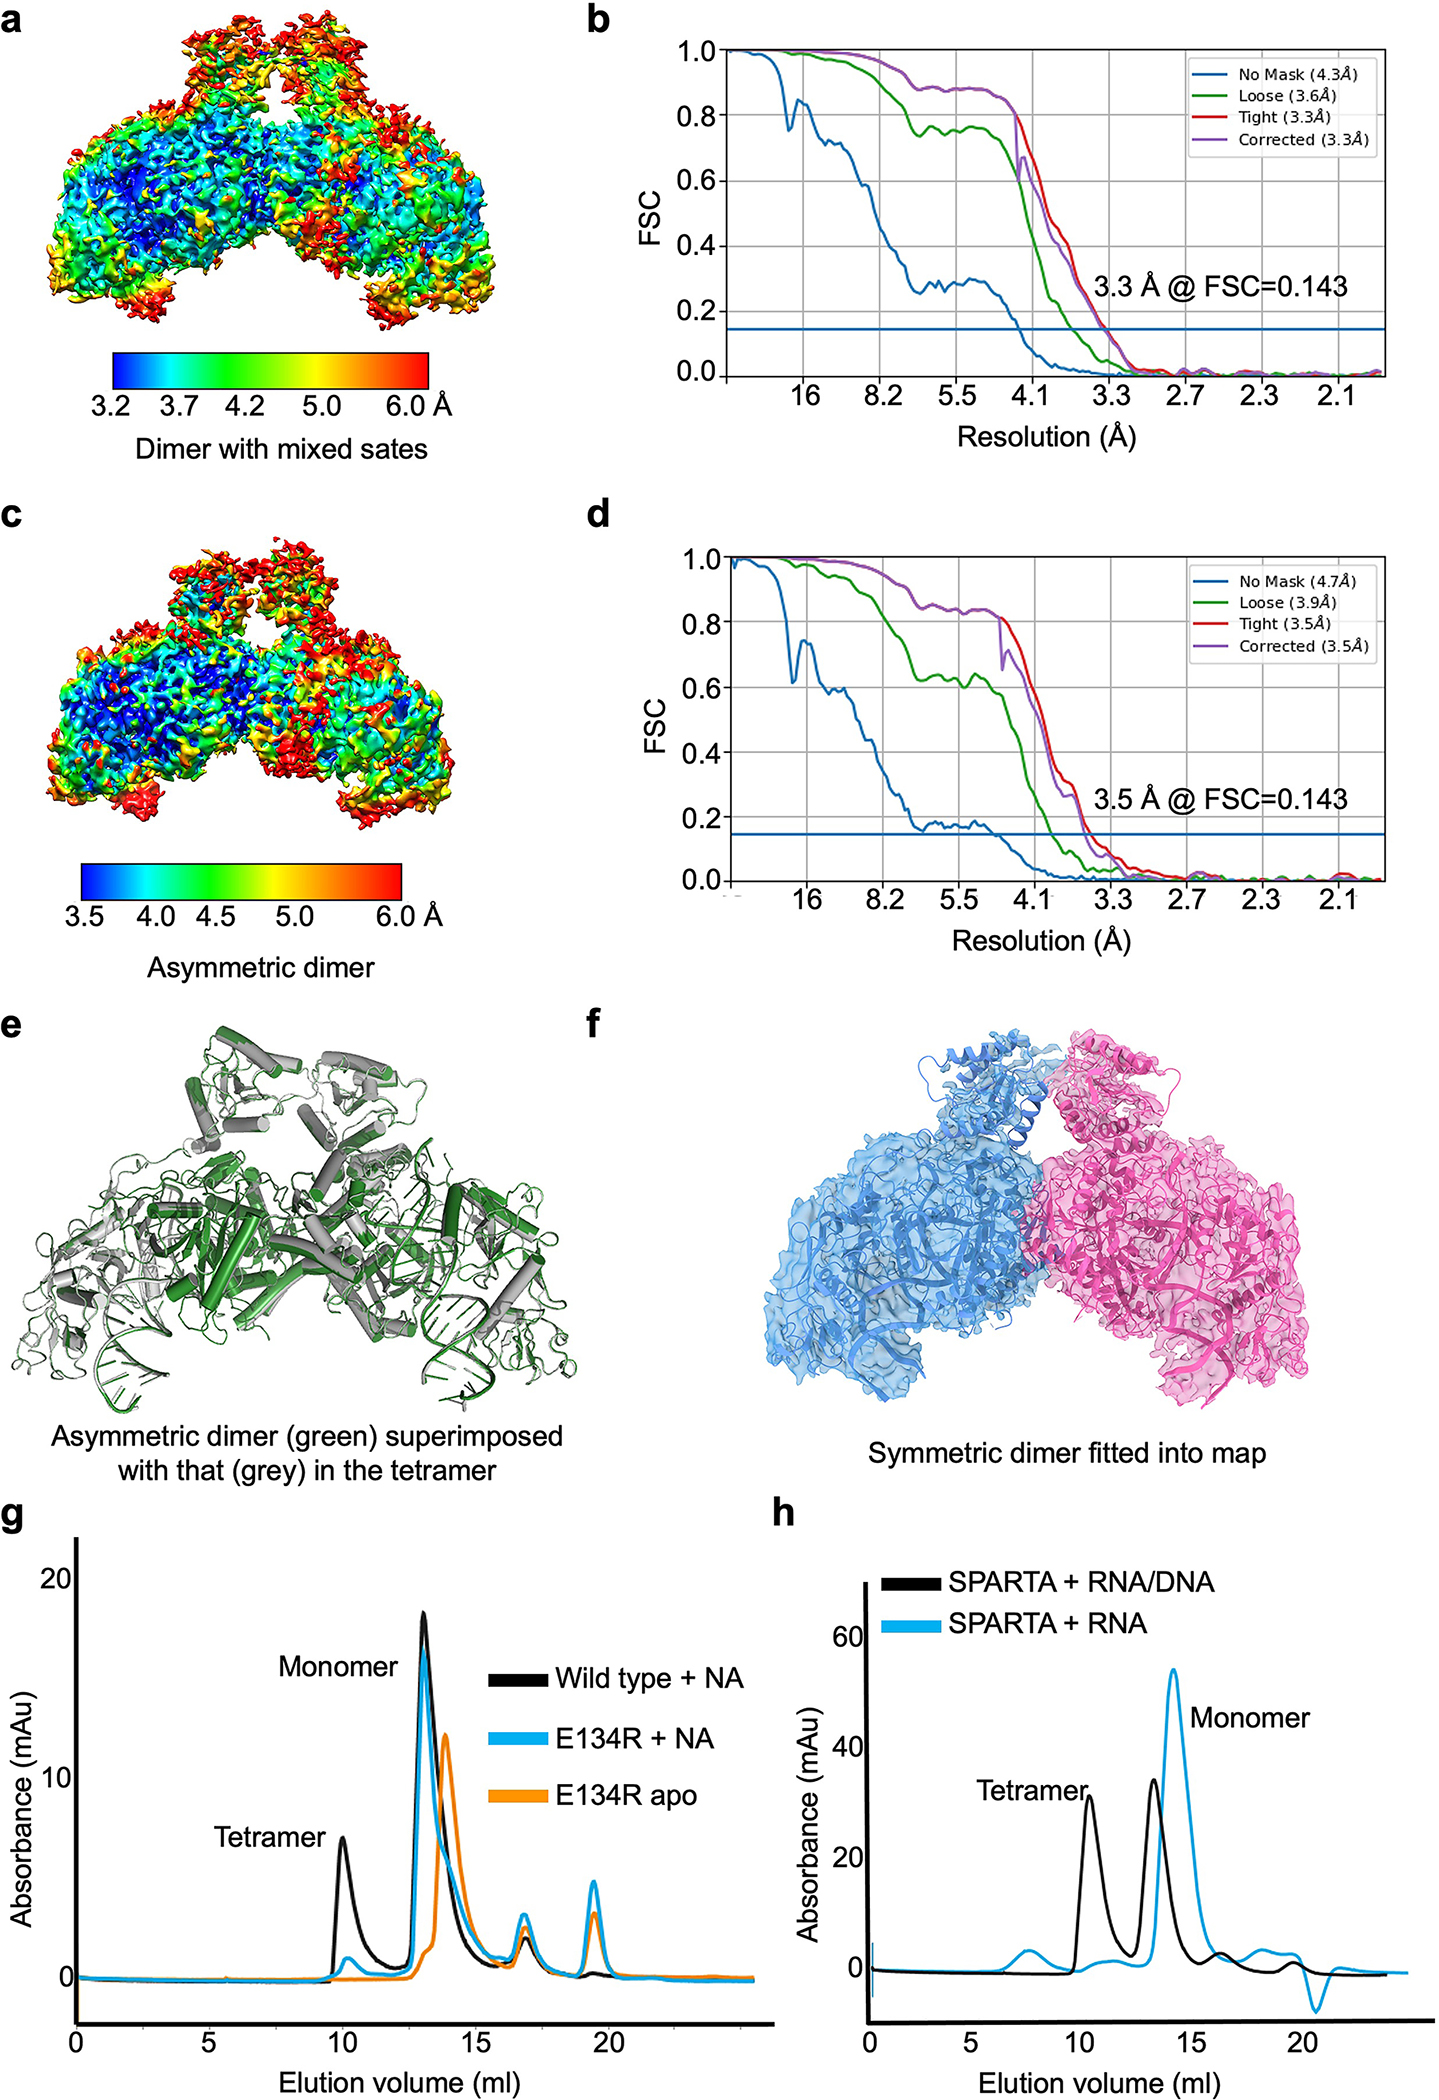
a, Local resolutions of MapSPARTA dimer in mixed states.
b, FSC curves of reconstructed MapSPARTA dimer in mixed states.
c, Local resolutions of MapSPARTA asymmetric dimer.
d, FSC curves of reconstructed MapSPARTA asymmetric dimer.
e, Overlaid structures of asymmetric dimer (green) and that (grey) in the tetramer, revealing their similarity.
f, Symmetric dimer fitted into cryo-EM map.
g, E134R, disrupting MID-MID interactions, eluted as monomers in the presence of RNA/DNA.
h, MapSPARTA eluted as monomer in the presence of RNA.
Extended Data Table 1 |.
Cryo-EM data collection, refinement, and validation statistics.
| Apo monomer (EMDB-29033) (PDB 8FEX) | RNA/DNA bound monomer (map1) (EMDB-40679) (PDB N/A) | RNA/DNA bound monomer (EMDB-40670) (PDB 8SQU) | Symmetric dimer (EMDB-40672) (PDB 8SP0) | Asymmetric dimer (EMDB-40673) (PDB 8SP3) | Tetramer (EMDB-29043) (PDB 8FFI) | Tetramer with NAD+ (EMDB-40680) (PDB 8SPO) | |
|---|---|---|---|---|---|---|---|
|
| |||||||
| Data collection and processing | |||||||
| Magnification | 81,000 | 81,000 | 81,000 | 81,000 | 81,000 | 81,000 | 81,000 |
| Voltage (kV) | 300 | 300 | 300 | 300 | 300 | 300 | 300 |
| Electron exposure (e–/Å2) | 50 | 50 | 50 | 50 | 50 | 50 | 50 |
| Defocus range (μm) | 1.0 – 2.5 | 0.5 – 2.0 | 0.5 – 2.1 | 0.5 – 2.1 | 0.5 – 2.1 | 0.5 – 2.1 | 0.5 – 2.0 |
| Pixel size (Å) | 1.0694 | 0.95 | 0.95 | 0.95 | 0.95 | 0.95 | 0.899 |
| Symmetry imposed | C1 | C1 | C1 | C1 | C1 | C1 | C1 |
| Initial images (no.) | 3,464 | 6,566 | 4,823 | 4,823 | 4,823 | 4,823 | 4,215 |
| Initial particle images (no.) | 9,423,011 | 10,736,069 | 2,941,885 | 2,941,885 | 2,941,885 | 2,941,885 | 2,209,672 |
| Final particle images (no.) | 217,571 | 534,729 | 163,800 | 63,761 | 32,366 | 490,999 | 847,718 |
| Map resolution (Å) | 3.07 | 3.04 | 3.28 | 3.33 | 3.52 | 2.70 | 2.98 |
| FSC threshold | 0.143 | 0.143 | 0.143 | 0.143 | 0.143 | 0.143 | 0.143 |
| Map resolution range (Å) | 3.07 – 4.5 | 3.04 – 6.0 | 3.28 – 6.0 | 3.33 – 6.0 | 3.52 – 6.0 | 2.51 – 4.5 | 2.98 – 6.5 |
| Refinement | |||||||
| Initial model used (PDB code) | AlphaFold | N/A | AlphaFold | AlphaFold | AlphaFold | AlphaFold | AlphaFold |
| Model resolution (Å) | 3.2 | N/A | 3.8 | 3.8 | 4.1 | 2.9 | 3.7 |
| FSC threshold | 0.5 | 0.5 | 0.5 | 0.5 | 0.5 | 0.5 | |
| Map sharpening B factor (Å2) | -115.5 | -178.6 | -170.1 | -107.8 | -95.7 | -95.9, -97.7, -73.6, -95.0, -99.1 | -55.3 |
| Model composition | |||||||
| Non-hydrogen atoms | 7302 | N/A | 7768 | 16270 | 16270 | 32540 | 32628 |
| Protein residues | 891 | 842 | 1776 | 1776 | 3552 | 3552 | |
| Ligands | 0 | MG: 1 | MG: 2 | MG: 2 | MG: 4 | MG: 4 NAD+: 2 |
|
| Nucleotide | 0 | 41 | 82 | 82 | 164 | 164 | |
| B factors (Å2) | N/A | ||||||
| Protein | 63.65 | 44.11 | 45.04 | 44.84 | 49.19 | 49.19 | |
| Ligand | 30.86 | 26.92 | 26.92 | 27.07 | 38.10 | ||
| Nucleotide | 61.31 | 60.06 | 60.06 | 62.11 | 62.11 | ||
| R.m.s. deviations | N/A | ||||||
| Bond lengths (Å) | 0.004 | 0.006 | 0.005 | 0.004 | 0.004 | 0.004 | |
| Bond angles (°) | 0.910 | 1.016 | 1.024 | 0.965 | 0.918 | 0.991 | |
| Validation | N/A | ||||||
| MolProbity score | 1.80 | 1.77 | 1.70 | 1.73 | 1.59 | 1.98 | |
| Clashscore | 7.41 | 6.95 | 5.71 | 6.06 | 3.83 | 10.59 | |
| Poor rotamers (%) | 0.00 | 0.40 | 0.38 | 0.31 | 0.00 | 0.35 | |
| Ramachandran plot | N/A | ||||||
| Favored (%) | 94.24 | 94.34 | 94.27 | 94.16 | 93.57 | 93.34 | |
| Allowed (%) | 5.76 | 5.42 | 5.50 | 5.73 | 6.26 | 6.29 | |
| Disallowed (%) | 0.00 | 0.24 | 0.23 | 0.11 | 0.17 | 0.37 | |
Supplementary Material
Acknowledgments
We thank Dr. Wen Tang at the Ohio State University (OSU) and Dr. Michael Elowitz at California Institute of Technology and Howard Hughes Medical Institute for helpful discussion, Dr. Qingpeng Lin at OSU for help with structural data collection and processing, Dr. Michael Kearse at OSU for technical assistance on the NADase assay, and Alexander Day at Case Western Reserve University for technical assistance on binding assays. Grid screening were performed at OSU CEMAS with the assistance of Drs. Giovanna Grandinetti and Yoshie Narui. Cryo-EM data were collected with the assistance of Drs. Chengsong Zhang and Patrick Mitchell at the Stanford-SLAC Cryo-Electron Microscopy Center supported by grants from the NIH National Institute of Health Common Fund Transformative High Resolution Cryo-Electron Microscopy program, Dr. Omar Davulcu at PNCC, and Drs. Giovanna Grandinetti and Yoshie Narui at OSU CEMAS, respectively. K.N. is supported by NIH grants R01GM124320 and R01GM138997. S.X. is supported by a postdoctoral fellowship from the Jane Coffin Childs Fund.
Footnotes
Competing interests
All authors declare they have no competing interests.
Reporting summary
Further information on research design is available in the Nature Portfolio Reporting Summary linked to this article.
Data availability
Accession numbers for apo monomeric MapSPARTA, RNA-DNA bound monomeric MapSAPRTA, symmetric MapSPARTA dimer, asymmetric MapSPARTA dimer, and MapSPARTA tetramer, and MapSPARTA tetramer with NAD+ are as follows: (coordinates of atomic models: 8FEX, 8SQU, 8SP0, 8SP3, 8FFI, and 8SPO, deposited to Protein Data Bank), and (density map: EMD-29033, EMD-40679, EMD-40670, EMD-40672, EMD-40673, EMD-29043, and EMD-40680, deposited to Electron Microscopy Data Bank). All data needed to evaluate the conclusions are present in the paper.
References
- 1.Koopal B, Mutte SK & Swarts DC A long look at short prokaryotic Argonautes. Trends Cell Biol, doi: 10.1016/j.tcb.2022.10.005 (2022). [DOI] [PubMed] [Google Scholar]
- 2.Koopal B et al. Short prokaryotic Argonaute systems trigger cell death upon detection of invading DNA. Cell 185, 1471–1486 e1419, doi: 10.1016/j.cell.2022.03.012 (2022). [DOI] [PMC free article] [PubMed] [Google Scholar]
- 3.Swarts DC et al. The evolutionary journey of Argonaute proteins. Nat Struct Mol Biol 21, 743–753, doi: 10.1038/nsmb.2879 (2014). [DOI] [PMC free article] [PubMed] [Google Scholar]
- 4.Vaucheret H Plant ARGONAUTES. Trends Plant Sci 13, 350–358, doi: 10.1016/j.tplants.2008.04.007 (2008). [DOI] [PubMed] [Google Scholar]
- 5.Nakanishi K Anatomy of four human Argonaute proteins. Nucleic Acids Res 50, 6618–6638, doi: 10.1093/nar/gkac519 (2022). [DOI] [PMC free article] [PubMed] [Google Scholar]
- 6.Peters L & Meister G Argonaute proteins: mediators of RNA silencing. Mol Cell 26, 611–623, doi: 10.1016/j.molcel.2007.05.001 (2007). [DOI] [PubMed] [Google Scholar]
- 7.Lisitskaya L, Aravin AA & Kulbachinskiy A DNA interference and beyond: structure and functions of prokaryotic Argonaute proteins. Nat Commun 9, 5165, doi: 10.1038/s41467-018-07449-7 (2018). [DOI] [PMC free article] [PubMed] [Google Scholar]
- 8.Ryazansky S, Kulbachinskiy A & Aravin AA The Expanded Universe of Prokaryotic Argonaute Proteins. mBio 9, doi: 10.1128/mBio.01935-18 (2018). [DOI] [PMC free article] [PubMed] [Google Scholar]
- 9.Kuzmenko A et al. DNA targeting and interference by a bacterial Argonaute nuclease. Nature 587, 632–637, doi: 10.1038/s41586-020-2605-1 (2020). [DOI] [PubMed] [Google Scholar]
- 10.Swarts DC et al. DNA-guided DNA interference by a prokaryotic Argonaute. Nature 507, 258–261, doi: 10.1038/nature12971 (2014). [DOI] [PMC free article] [PubMed] [Google Scholar]
- 11.Zander A et al. Guide-independent DNA cleavage by archaeal Argonaute from Methanocaldococcus jannaschii. Nat Microbiol 2, 17034, doi: 10.1038/nmicrobiol.2017.34 (2017). [DOI] [PMC free article] [PubMed] [Google Scholar]
- 12.Li W et al. A programmable pAgo nuclease with RNA target preference from the psychrotolerant bacterium Mucilaginibacter paludis. Nucleic Acids Res 50, 5226–5238, doi: 10.1093/nar/gkac315 (2022). [DOI] [PMC free article] [PubMed] [Google Scholar]
- 13.Swarts DC et al. Argonaute of the archaeon Pyrococcus furiosus is a DNA-guided nuclease that targets cognate DNA. Nucleic Acids Res 43, 5120–5129, doi: 10.1093/nar/gkv415 (2015). [DOI] [PMC free article] [PubMed] [Google Scholar]
- 14.Kuzmenko A, Yudin D, Ryazansky S, Kulbachinskiy A & Aravin AA Programmable DNA cleavage by Ago nucleases from mesophilic bacteria Clostridium butyricum and Limnothrix rosea. Nucleic Acids Res 47, 5822–5836, doi: 10.1093/nar/gkz379 (2019). [DOI] [PMC free article] [PubMed] [Google Scholar]
- 15.Hegge JW et al. DNA-guided DNA cleavage at moderate temperatures by Clostridium butyricum Argonaute. Nucleic Acids Res 47, 5809–5821, doi: 10.1093/nar/gkz306 (2019). [DOI] [PMC free article] [PubMed] [Google Scholar]
- 16.Jolly SM et al. Thermus thermophilus Argonaute Functions in the Completion of DNA Replication. Cell 182, 1545–1559 e1518, doi: 10.1016/j.cell.2020.07.036 (2020). [DOI] [PMC free article] [PubMed] [Google Scholar]
- 17.Olovnikov I, Chan K, Sachidanandam R, Newman DK & Aravin AA Bacterial argonaute samples the transcriptome to identify foreign DNA. Mol Cell 51, 594–605, doi: 10.1016/j.molcel.2013.08.014 (2013). [DOI] [PMC free article] [PubMed] [Google Scholar]
- 18.Makarova KS, Wolf YI & Koonin EV Comprehensive comparative-genomic analysis of type 2 toxin-antitoxin systems and related mobile stress response systems in prokaryotes. Biol Direct 4, 19, doi: 10.1186/1745-6150-4-19 (2009). [DOI] [PMC free article] [PubMed] [Google Scholar]
- 19.Burroughs AM, Ando Y & Aravind L New perspectives on the diversification of the RNA interference system: insights from comparative genomics and small RNA sequencing. Wiley Interdiscip Rev RNA 5, 141–181, doi: 10.1002/wrna.1210 (2014). [DOI] [PMC free article] [PubMed] [Google Scholar]
- 20.Zaremba M et al. Short prokaryotic Argonautes provide defence against incoming mobile genetic elements through NAD+ depletion. Nat Microbiol 7, 1857–1869, doi: 10.1038/s41564-022-01239-0 (2022). [DOI] [PubMed] [Google Scholar]
- 21.Zeng Z et al. A short prokaryotic Argonaute activates membrane effector to confer antiviral defense. Cell Host Microbe 30, 930–943 e936, doi: 10.1016/j.chom.2022.04.015 (2022). [DOI] [PubMed] [Google Scholar]
- 22.Song JJ, Smith SK, Hannon GJ & Joshua-Tor L Crystal structure of Argonaute and its implications for RISC slicer activity. Science 305, 1434–1437, doi: 10.1126/science.1102514 (2004). [DOI] [PubMed] [Google Scholar]
- 23.Nakanishi K, Weinberg DE, Bartel DP & Patel DJ Structure of yeast Argonaute with guide RNA. Nature 486, 368–374, doi: 10.1038/nature11211 (2012). [DOI] [PMC free article] [PubMed] [Google Scholar]
- 24.Elkayam E et al. The structure of human argonaute-2 in complex with miR-20a. Cell 150, 100–110, doi: 10.1016/j.cell.2012.05.017 (2012). [DOI] [PMC free article] [PubMed] [Google Scholar]
- 25.Schirle NT & MacRae IJ The crystal structure of human Argonaute2. Science 336, 1037–1040, doi: 10.1126/science.1221551 (2012). [DOI] [PMC free article] [PubMed] [Google Scholar]
- 26.Zaremba M et al. Short prokaryotic Argonautes provide defence against incoming mobile genetic elements through NAD(+) depletion. Nat Microbiol 7, 1857–1869, doi: 10.1038/s41564-022-01239-0 (2022). [DOI] [PubMed] [Google Scholar]
- 27.Shi Y et al. Structural basis of SARM1 activation, substrate recognition, and inhibition by small molecules. Mol Cell 82, 1643–1659 e1610, doi: 10.1016/j.molcel.2022.03.007 (2022). [DOI] [PMC free article] [PubMed] [Google Scholar]
- 28.Hogrel G et al. Cyclic nucleotide-induced helical structure activates a TIR immune effector. Nature 608, 808–812, doi: 10.1038/s41586-022-05070-9 (2022). [DOI] [PubMed] [Google Scholar]
- 29.Morehouse BR et al. Cryo-EM structure of an active bacterial TIR-STING filament complex. Nature 608, 803–807, doi: 10.1038/s41586-022-04999-1 (2022). [DOI] [PMC free article] [PubMed] [Google Scholar]
- 30.Wang Y et al. Nucleation, propagation and cleavage of target RNAs in Ago silencing complexes. Nature 461, 754–761, doi: 10.1038/nature08434 (2009). [DOI] [PMC free article] [PubMed] [Google Scholar]
- 31.Miyoshi T, Ito K, Murakami R & Uchiumi T Structural basis for the recognition of guide RNA and target DNA heteroduplex by Argonaute. Nat Commun 7, 11846, doi: 10.1038/ncomms11846 (2016). [DOI] [PMC free article] [PubMed] [Google Scholar]
- 32.Frank F, Sonenberg N & Nagar B Structural basis for 5’-nucleotide base-specific recognition of guide RNA by human AGO2. Nature 465, 818–822, doi: 10.1038/nature09039 (2010). [DOI] [PubMed] [Google Scholar]
- 33.Potocnik A & Swarts DC Short prokaryotic Argonaute system repurposed as a nucleic acid detection tool. Clin Transl Med 12, e1059, doi: 10.1002/ctm2.1059 (2022). [DOI] [PMC free article] [PubMed] [Google Scholar]
- 34.Punjani A, Rubinstein JL, Fleet DJ & Brubaker MA cryoSPARC: algorithms for rapid unsupervised cryo-EM structure determination. Nat Methods 14, 290–296, doi: 10.1038/nmeth.4169 (2017). [DOI] [PubMed] [Google Scholar]
- 35.Pettersen EF et al. UCSF Chimera--a visualization system for exploratory research and analysis. J Comput Chem 25, 1605–1612, doi: 10.1002/jcc.20084 (2004). [DOI] [PubMed] [Google Scholar]
- 36.Rosenthal PB & Henderson R Optimal determination of particle orientation, absolute hand, and contrast loss in single-particle electron cryomicroscopy. J Mol Biol 333, 721–745, doi: 10.1016/j.jmb.2003.07.013 (2003). [DOI] [PubMed] [Google Scholar]
- 37.Emsley P & Cowtan K Coot: model-building tools for molecular graphics. Acta Crystallogr D Biol Crystallogr 60, 2126–2132, doi: 10.1107/S0907444904019158 (2004). [DOI] [PubMed] [Google Scholar]
- 38.Adams PD et al. PHENIX: a comprehensive Python-based system for macromolecular structure solution. Acta Crystallogr D Biol Crystallogr 66, 213–221, doi: 10.1107/S0907444909052925 (2010). [DOI] [PMC free article] [PubMed] [Google Scholar]
- 39.Williams CJ et al. MolProbity: More and better reference data for improved all-atom structure validation. Protein Sci 27, 293–315, doi: 10.1002/pro.3330 (2018). [DOI] [PMC free article] [PubMed] [Google Scholar]
- 40.Schrödinger L. a. D., W.,. The PyMOL Molecular Graphics System. Version 2.5 Schrödinger, LLC; (2022). [Google Scholar]
- 41.Pettersen EF et al. UCSF ChimeraX: Structure visualization for researchers, educators, and developers. Protein Sci 30, 70–82, doi: 10.1002/pro.3943 (2021). [DOI] [PMC free article] [PubMed] [Google Scholar]
Associated Data
This section collects any data citations, data availability statements, or supplementary materials included in this article.
Supplementary Materials
Data Availability Statement
Accession numbers for apo monomeric MapSPARTA, RNA-DNA bound monomeric MapSAPRTA, symmetric MapSPARTA dimer, asymmetric MapSPARTA dimer, and MapSPARTA tetramer, and MapSPARTA tetramer with NAD+ are as follows: (coordinates of atomic models: 8FEX, 8SQU, 8SP0, 8SP3, 8FFI, and 8SPO, deposited to Protein Data Bank), and (density map: EMD-29033, EMD-40679, EMD-40670, EMD-40672, EMD-40673, EMD-29043, and EMD-40680, deposited to Electron Microscopy Data Bank). All data needed to evaluate the conclusions are present in the paper.


