

Abstract
Recombinant adeno-associated virus (rAAV)-based gene therapies are expanding in their application. Despite progress in manufacturing, current analytical methods for product quantification and characterization remain largely unchanged. Although critical for product and process development, in-process testing, and batch release, current analytical methods are labor-intensive, costly, and hampered by extended turnaround times and low throughput. The field requires more efficient, cost-effective analytical techniques capable of handling large sample quantities to accelerate product and process development. Here, we evaluated Stunner from Unchained Labs for quantifying and characterizing rAAVs and compared it with established analytical methods. Stunner is a combinatorial analytic technology platform that interpolates ultraviolet-visible (UV-Vis) absorption with static and dynamic light scattering (SLS/DLS) analysis to determine capsid and genomic titer, empty and full capsid ratio, and assess vector size and polydispersity. The platform offers empirical measurements with minimal sample requirements. Upon testing hundreds of rAAV vectors, comprising various serotypes and transgenes, the data show a strong correlation with established analytical methods and exhibit high reproducibility and repeatability. Some analyses can be applied to in-process samples from different purification stages and processes, fulfilling the demand for rapid, high-throughput analysis during development. In sum, the pipeline presented streamlines small- and large-batch analytics.
Keywords: rAAV, DLS; SLS; UV-vis; empty and full capsids; aggregates; process development; vector development
Graphical abstract
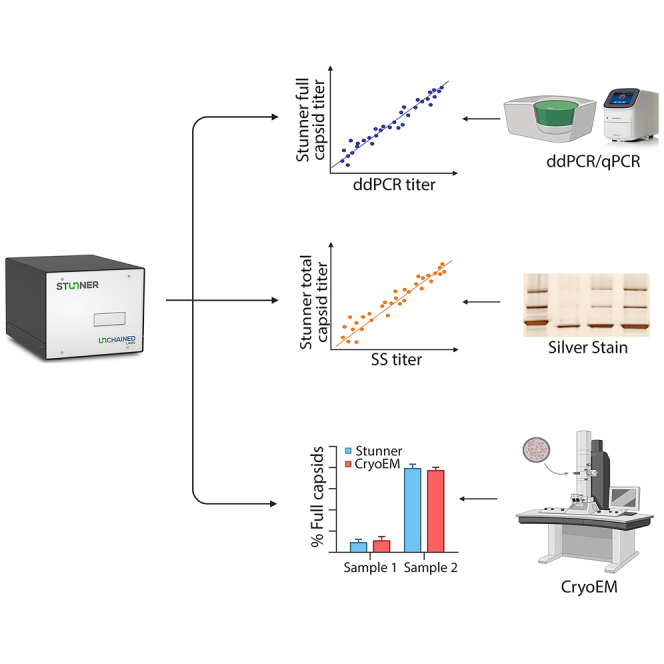
Liu and colleagues demonstrate the utility of Stunner for accurate and straightforward evaluation of vector particles for a variety of serotypes after AAV production, and its utility for qualitative assessment in-process development.
Introduction
The use of recombinant adeno-associated virus (rAAV) as the de facto viral vector for gene therapy was solidified after the approval by the Food and Drug Administration of LUXTURNA for Leber congenital amaurosis (LCA) in 2017, and ZOLGENSMA for spinal muscular atrophy (SMA) in 2019.1,2 rAAV owes its commercial appeal and success to its low immunogenicity, low-pathogenic nature when applied at low doses, expansive tropism provided by existing and emerging capsid variants, and prolonged transgene persistence in non-dividing cells.3,4 There are currently over 200 rAAV-based gene therapy clinical trials worldwide, with many in or close to clinical phase III, and over a thousand more in preclinical stages of development.3,5,6,7,8,9 rAAVs are used either as active pharmaceutic ingredients or as crucial intermediate products, placing them in high demand and necessitating premium quality.10,11,12 Scaling up rAAV biomanufacturing while maintaining high-performance quality attributes requires the use of standardized analytical methods. However, while rAAV manufacturing technology has improved dramatically in recent years, analytical methods used for product and process characterization have lagged and have struggled to adequately support the rapid development of therapeutics.13,14,15,16,17,18,19
rAAV products are characterized by critical quality attributes (CQAs), which define product quality and process robustness, and highlight the relationship between functional potency and process parameters. Virus titer and purity are the two most important CQAs for process development.20 Virus titer, a quantified measurement of vector productivity, is represented by genomic titer in vector genomes or genomic copies per milliliter (VG/mL or GC/mL). Capsid titer is expressed as capsid particles per milliliter or viral particles per milliliter (CP/mL or VP/mL). Vector purity is defined by the presence or absence of contaminants or product-related impurities such as empty capsids, vectors containing truncated genomes, packaging plasmids, host cell DNA, and vector aggregates. Purity has an impact on safety, efficacy, consistency, and durability. Both titer and purity are influenced by the design of the vector construct and the manufacturing process. Titer and purity are important to demonstrate the robustness of the process and serve as indicators of the efficacy and safety of rAAV-mediated gene therapy products.21 Therefore, these should be optimized at early development stages. Among the array of rAAV quantification methods, genome titer is usually determined by droplet digital PCR (ddPCR), digital PCR (dPCR), or quantitative PCR (qPCR), and capsid titer by ELISA or silver stain/SDS-PAGE gel.22,23,24,25,26 While often the choice for batch release assays, PCR and ELISA-based methods are time-intensive and laborious, demand significant sample volumes, and are not well suited for high-throughput screening during development.27 In a quest for more efficient alternatives, rapid quantification techniques such as bulk optical density (OD) or ultraviolet-visible (UV/Vis) spectrophotometry, have been developed.28 UV is a direct and simple assay that can quantify both protein (OD280) and genomic (OD260) titers. Once the extinction coefficient is determined, the assay makes titer determination readily accessible and empty/full particle ratio evaluation straightforward. However, for in-process samples, interference by iodixanol, cellular protein, and DNA impurities impede the readout and can affect accuracy.29 Nevertheless, for purified products, the computation is fast and readily understood. The analysis can be performed quickly and reliably with very little sample consumption, which makes this method ideal for rapid, high-throughput screening.
Methods for purity determination rely on techniques like cryo-electronic microscopy (cryo-EM), analytical ultracentrifugation sedimentation velocity (AUC-SV), charge detection mass spectroscopy (CDMS), ion-exchange chromatography with multi-angle light scattering (IEC-MALS), size exclusion chromatography with multi-angle light scattering (SEC-MALS), and surface plasmon resonance (SPR).30,31,32,33,34,35,36,37 However, these methods require specialized skills and instruments, making them less useful for early-stage research and development. Consequently, the rigorous assessment of vector purity often takes a backseat during vector screening and optimization. To address this gap, some research groups have used light scattering to characterize and quantify rAAV vectors. However, light scattering is a bulk measurement and is non-selective.30 While not impacted by the extinction coefficient of chromophores present in the sample, the scattering profile does not distinguish main analytes from other components. Large impurities, even when present in small amounts, can distort the apparent distribution and skew the size determination.30 As a result, light scattering is often paired with composite analytical techniques like IEC-MALS or SEC-MALS, which are used to determine the molecular weight, size, and distribution of polymers and large biomolecules.36,37 However, while these methods capture CQAs, the assays are low throughput and highly complex. This approach also increases cost, making it less feasible for discovery and pre-clinic studies.
As such, there is an unmet need to develop and adapt methods for cost-effective, simple, rapid, high-throughput evaluation of vector quantity and purity during early development stages. Here, we evaluated the use of Stunner, which combines static light scattering (SLS), dynamic light scattering (DLS), and UV-Vis spectrophotometry data (Figure 1) and qualified its capabilities with hundreds of purified rAAV vectors encompassing various serotypes and transgenes, as well as in-process samples from two different purification methods. The platform integrates UV-Vis and DLS/SLS analysis to simultaneously determine capsid and genomic titers and assess vector purity and quality.
Figure 1.

Three detection methods in the Stunner AAV Quant platform
(A) DLS produces a distribution of particles by size that can be analyzed for the relative intensity of light scattered by capsids and aggregates. (B) SLS is quantified as a Rayleigh Ratio and is the scattering intensity during a DLS experiment correlated to capsid titer, with full and empty capsids scattering different light intensities. (C) UV-Vis spectroscopy is utilized to quantify amounts of ssDNA and protein to calculate the empty/full ratio.
Results
Stunner correlates with ddPCR or qPCR for titer
Droplet digital PCR (ddPCR) and quantitative real-time PCR (qPCR) are widely accepted methods commonly used to quantify the concentration of encapsidated viral genomes present in an rAAV sample either directly, or indirectly via a standard curve. To explore the relationship between Stunner full capsid titer and genome titer determined by ddPCR or qPCR, we conducted Pearson correlation studies on two groups of purified rAAV samples representing an array of serotypes and transgenes (Table 1 and Figure 2). Both comparisons showed a strong positive correlation for Stunner full capsid titer vs. ddPCR genomic titer (r = 0.91, p < 0.001), and for Stunner full capsid titer vs. qPCR genomic titer (r = 0.82, p < 0.001). Scatterplots and linear regression models generated in the log10 scale for Stunner vs. ddPCR (Figure 2A) and Stunner vs. qPCR (Figure 2B) showed a linear correlation.
Table 1.
Pearson correlation study of different comparison groups
| Comparison group | Pearson correlation (r) | p value | R2 (regression) | Sample size |
|---|---|---|---|---|
| Stunner full capsid titer vs. ddPCR genomic titer | 0.91 | p < 0.001 | 0.83 | n = 150 |
| Stunner full capsid titer vs. qPCR genomic titer | 0.82 | p < 0.001 | 0.67 | n = 60 |
| Stunner total capsid titer vs. silver stain particle titer | 0.84 | p < 0.001 | 0.71 | n = 150 |
Figure 2.

Titer correlation studies between Stunner UV-Vis/DLS/SLS platform and conventional methods
(A) Scatterplot and regression line for ddPCR from 150 samples (A; R2 = 0.83, Pearson r = 0.9; p < 0.001). (B) Scatterplot and regression line generated from 60 samples, R2 = 0.67, Pearson r = 0.82; p < 0.001). (C) Sample serotypes used in (A). (D) ddPCR primer-probe used in (A). (E) Comparison between samples assayed using WPRE probes (blue; n = 77, R2 = 0.78, Pearson r = 0.88, p < 0.001) and other primer-probe assays (red; n = 73, R2 = 0.86, Pearson r = 0.93, p < 0.001). (F) Serotype information for the 60 serotypes used for qPCR in (B). (G) Primer/probes for qPCR include eGFP probes and transgene-specific probes assessed in (B). (H) Correlation between eGFP qPCR assays with Stunner full titer (blue; n = 31, R2 = 0.56, Pearson r = 0.75, p < 0.001) or other transgene assays (red; n = 29, R2 = 0.80, Pearson r = 0.90, p < 0.001). (I) Correlation between Stunner total capsid titer and SDS-PAGE/silver stain particle titer (SS titer) from 150 samples (R2 = 0.71, Pearson r = 0.84, p < 0.001). (J) Serotype information for (I). (K) Correlation between naturally occurring serotypes (blue; n = 103, R2 = 0.74, Pearson r = 0.86, p < 0.001) and engineered capsids (red; n = 47, R2 = 0.57, Pearson r = 0.75, p < 0.001).
For the comparison of Stunner full capsid titer vs. ddPCR genomic titer, we utilized a total of 150 rAAV samples, which included 108 unique vectors and 15 vectors from different production lots of AAV1, AAV2, AAV5, AAV6, AAV8, and AAV9 vectors as well as engineered ones. In total, there were 66% standard serotypes and 34% of engineered serotypes (Figure 2C). The samples contained approximately 92 unique transgenes, including seven self-complementary constructs. All 150 samples quantified by Stunner AAV Quant and ddPCR used either transgene-specific or ITR primer-probe sets. A total of 15 different sets of ddPCR primer-probe were used, with the ITR primer-probe used in 13% of total samples and the WPRE primer-probe employed in 51% of samples (Figure 2D). The effect of the primer-probe set, WPRE vs. “Other” for ddPCR was investigated. The data show that there was no statistical difference (p = 0.168) between the WPRE and “Other” groups (Figure 2E).
In the comparison of Stunner full capsid titer vs. qPCR genomic titer, a total of 60 rAAV samples were included, with serotypes AAV1, AAV2, AAV5, AAV6, AAV7, AAV8, and AAV9 accounting for 92% of the samples while the remaining 8% of samples contained novel engineer capsids (Figure 2F). The sample set comprised 32 unique transgenes including two double-stranded rAAV vectors. Samples were quantified on qPCR using transgene-specific primer-probe sets and by Stunner AAV Quant. In total, there were 16 transgene-specific primer-probe sets, with the eGFP primer-probe being used in 45% of the samples (Figure 2G). Both the eGFP-specific and “Other” primer-probe sets in qPCR showed a positive correlation with Stunner (Figure 2H) and there was no significant difference between the two (p = 0.072).
Stunner total capsid titer correlates with traditional particle titer method
SDS-PAGE/silver stain was employed to determine the particle titer of highly purified rAAV using a reference vector with a known titer.26 A total of 150 rAAV samples were quantified by both SDS-PAGE/silver stain and Stunner. Titers determined by SDS-PAGE/silver stain and Stunner showed a strong correlation of 0.84 (p < 0.001; Table 1). Scatterplot showed a linear correlation (R2 = 0.71, Figure 2I). Within the dataset, there were 131 unique vectors, including 104 unique transgenes, 103 conventional serotypes, and 47 novel-engineered serotypes (Figure 2J). A comparison of the correlations between SDS-PAGE/silver stain (SS titer) and Stunner (Stunner total) in samples with conventional capsids with known amino acids (N = 103), and in samples with engineered novel serotypes with undisclosed amino acids (N = 47), was also conducted. Correlation between SS titer and Stunner total for the conventional group was 0.86 and for the engineered group was 0.75. The use of conventional or novel capsids did not show a significant difference (p = 0.078; Figure 2K).
Bootstrapping studies on the correlation comparison groups
To further test the robustness of the correlation in a smaller sample set, a nonparametric bootstrapping study was performed by randomly selecting one-sixth of the total samples 10,000 times. For the ddPCR group, 25 out of 150 samples were randomly selected, 10,000 times, and the correlation distribution curve resulted in a median of 0.91 with a 95% confidence interval (CI) range of 0.81–0.96 (Figure 3A). Similarly, for the same sample size in the silver stain group, the 95% CI for the mean correlation was 0.85, with a range of 0.64–0.93 (Figure 3C). For the smaller qPCR sample group, a subset of 10 samples was used and yielded an estimated median correlation of 0.83 with a 95% CI range between 0.53 and 0.94 (Figure 3B).
Figure 3.

Bootstrapping studies for the three correlation groups
(A) For ddPCR genomic titer and Stunner full capsid titer, a subset of 25 samples was randomly selected 10,000 times to generate a correlation distribution curve, resulting in a 95% confidence interval (CI) median of 0.91 and a range of [0.81–0.96]. (B) For qPCR genomic titer and Stunner full capsid titer, a subset of 10 samples was randomly selected 10,000 times to generate a correlation distribution curve, resulting in a 95% CI median of 0.83 and range of [0.53–0.94]. (C) For silver stain particle titer and Stunner total capsid titer, a subset of 25 samples was randomly selected 10,000 times to generate a correlation distribution curve, resulting in a 95% CI median of 0.85 and range of [0.64–0.93].
Stunner full and empty measurement correlates with cryo-EM data and pre-mixed ratios
To validate the ability of the Stunner UV-Vis/DLS/SLS platform to identify empty and full capsids and to determine the percent empty and full capsids, we tested three samples (two purified rAAV vectors and their 1:1 mixture) by cryo-EM and Stunner and compared the percent full capsids (% Full). The cryo-EM-derived and Stunner-based %Full in each of the three samples showed no significant difference (Figures 4A and 4B), confirming the correlation with Stunner obtained with ddPCR, qPCR, and SDS-PAGE/silver stain.
Figure 4.

Stunner UV-Vis/DLS/SLS identifies empty and full capsids and recapitulates data determined by cryo-EM
(A) Percent full capsids were measured by cryo-EM (blue) and Stunner UV-Vis/DLS/SLS platform (green) on two purified AAV vectors and a 1:1 mixture of both vectors. Data represent mean ± SD (n = 3). (B) Cryo-EM images from samples 1 and 2 show full and empty capsids, respectively. (C) Stunner readout on %Full (open bars) and %Empty (gray) capsids compared with the pre-mixed ratios. Data represent mean ± SD (n = 4).
In addition, we diluted a known quantity of full capsids with empty capsids at known ratios (100/0, 80/20, 60/40, 40/60, 20/80, and 0/100) and then quantified the mixtures on Stunner. The Stunner readout effectively captured the pre-determined mixed ratios in the sample group, as shown in Figure 4C. A linear regression test on % Full comparing the readout by Stunner measurement with the titration ratio yielded an equation of y = 0.9699∗x (R2 = 0.9944, p < 0.001), and the slope at 95% CI ranged from 0.903 to 1.036.
Stunner measurement identifies vector particle size and aggregates
To assess Stunner’s capability to identify particle size and aggregation, purified rAAV (Lot#RVC0997), pre-concentrated, and 36-fold concentrated vector samples were evaluated. Stunner AAV Quant provides the intensity distribution of rAAV particles by plotting particle size (hydrodynamic diameter) to signal strength (amplitude). Based on particle size and area under the curve, the software provides the percentage of single particles, aggregates, and small particles or fragments. The pre-concentrated sample showed a main peak with a hydrodynamic diameter of 24.5 nm and a capsid intensity of 92.2%, as well as a small peak of aggregates with a hydrodynamic diameter of around 200 nm and an intensity of 7.8% (Figure 5A). In the concentrated sample, the main peak broadened to hydrodynamic diameters ranging from ∼20 nm to ∼700 nm with capsid intensity dropping to 34.9% and aggregate intensity increasing to 64.9%. Because of the range of the peak, a capsid diameter could not be defined. A small particle peak with a hydrodynamic diameter of 4 nm and an intensity of 0.2%, representing breakdown products, appeared in the concentrated sample (Figure 5B). The data confirm the ability of Stunner to identify particle size, aggregates, and breakdown products.
Figure 5.

Stunner DLS measures particle size and identifies aggregates
(A) DLS particle distribution of a vector sample before concentration, displaying a narrow capsid peak with an average capsid diameter at 24.5 nm and aggregate intensity of 7.8%. (B) DLS particle distribution of the sample after 36-fold concentration showing an aggregation intensity of 64.9%. Capsid diameter could not be determined.
Stunner characterization of in-process samples
To evaluate whether Stunner could be used for qualitative analysis of in-process samples, we tested samples collected from two vectors, one purified by cesium chloride (CsCl) gradient ultracentrifugation and another purified by AAVX affinity column chromatography. For the CsCl purification process, four in-process samples (crude harvest, concentrated, first CsCl, and second CsCl) were collected and tested by Stunner for UV-Vis absorbance spectrum (Figure 6A), particle intensity distribution (Figure 6B), titer (Figure 6C), and percentage of full and empty (Figure 6D). The UV-Vis absorbance values of single-stranded DNA (ssDNA) (260 nm), protein (280 nm), total spectrum, and impurity levels were high in the crude harvest sample. Impurity levels further increased after concentration but decreased dramatically after each subsequent CsCl density gradient (Figure 6A). This trend was also evident in the titer quantification plot, showing a 3-fold increase in total protein/ssDNA (capsid-associated, free, and aggregated) after concentration. Following the first CsCl purification, protein levels decreased approximately 30-fold and DNA levels decreased approximately 4-fold, with both seeing further reduction after the second CsCl (Figure 6C). Capsid and genome titer increased as rAAV particles were enriched through the purification process from crude harvest to the second CsCl (Figure 6C). This is reflected in the DLS-based intensity distribution where the capsid intensity increased as the aggregates intensity decreased (Figure 6B). The percentage of full capsids was similar in the crude harvest and concentrated samples (∼35%), then increased to 90% after the first CsCl and close to 100% after the second CsCl enrichment (Figure 6D). While quantitative analysis of in-process samples is challenging due to the presence of impurities that can inhibit or enhance the readout, the data presented here demonstrate that Stunner can be used for qualitative analysis of in-process samples.
Figure 6.

Stunner UV-Vis/DLS/SLS for qualitative assessment of in-process samples during CsCL density gradient purification
Stunner analysis of in-process samples from four subsequent steps in vector purification: crude harvest, concentrated, first CsCl spin, and second CsCl spin. Output graphs are presented for each in-process sample and grouped in (A)–(D) as (A) UV-VIS absorbance spectrum, showing total spectrum (black), ssDNA (green), protein (blue), impurity (purple), and turbidity (gray); (B) DLS particle distribution displays capsids of interest (green), small particles, and large particles or aggregates (gray); (C) titers, showing total capsid titer (dark blue), full capsid titer (dark green), free and aggregate protein (light blue), and free and aggregate ssDNA (light green); (D) percentages of full (yellow) and empty (maroon) particles.
Next, we tested Stunner using a rAAV vector purified by POROS CaptureSelect AAVX affinity chromatography. Stunner data were gathered from two aliquots of the affinity chromatography, during the flow-through stage as well as the elution (peak collection) stage (Figure 7). In the flow-through sample, the UV-Vis absorbance values were high due to the presence of free and aggregated protein and DNA, showing high levels of aggregates at the expected particle size (Figure 7A). In contrast, the elution (peak collection) sample had a lower absorbance value with no free and aggregated protein and DNA detected, 100% capsid intensity with 85% full capsid (Figure 7B).
Figure 7.

Stunner UV-Vis/DLS/SLS characterize in-process samples in affinity chromatography purification
(A) Stunner analysis output of flow-through sample. (B) Stunner analysis output of peak collection sample.
Discussion
The accurate and rapid assessment of rAAV samples is essential for advancing gene therapy research and development. In this study, we evaluated Stunner’s capacity to analyze rAAV vector titer, purity, aggregation, and percent full and empty, both during and after the purification process. To ascertain broad utility for a variety of rAAVs, we used hundreds of rAAV samples representing various serotypes and different expression cassettes. Our findings highlight the effectiveness of Stunners’ integrated UV-Vis/DLS/SLS analysis and comprehensive characterization and quantification of rAAV. The small 2-μL sample needed for high-throughput analysis in a 96-well plate format marks a significant advancement by eliminating the need for large quantities of purified vectors, reference standards, sample preparation, or labeling, thereby streamlining early-stage AAV vector and process development.
A key outcome of our investigation is the statistically significant correlations between Stunner measurements and established genomic and particle titering assays in purified product, as presented in Table 1 and Figure 2. Analyses on small samples using bootstrapping corroborated Stunner’s quantification capability. Notably, ddPCR exhibited the highest Pearson correlation coefficient, regression R2, and mean correlation at a 95% CI, as expected due to its technological advantages over qPCR and SDS-PAGE/silver stain.20,24,25,38,39 In a sub-study comparing engineered to conventional capsids, engineered capsids had lower Pearson correlation coefficients and regression R2 values. The latter is likely because amino acid sequences for the proprietary engineered capsids were not available and capsid extinction coefficients were estimated for the analysis. These findings underscore the effectiveness of the deconvolution algorithm employed in the analysis. Overall, the correlation data presented collectively support the reliability and accuracy of the UV-VIS/DLS/SLS technology in measuring rAAV titer, offering results comparable to conventional methods.
The quantification method based on OD 260/280, previously reported by Wright et al., has been a cornerstone for the quantification of full and empty capsids.28 OD 260/280 offers a rapid and reliable alternative to the capsid ELISA or silver stain gel electrophoresis in conjunction with genome qPCR or ddPCR, and electron microscopy. However, OD 260/280 is limited to purified rAAV as it is unable to differentiate capsid-associated from non-capsid-associated proteins, DNA, or aggregates. To overcome this limitation, others adapted the method and utilized the A260/A280 ratio in tandem for in-process samples, such as multi-monitor HPLC assays equipped with dual-wavelength UV monitoring in combination with intrinsic fluorescence, extrinsic fluorescence, and light scattering.40 However, this approach requires a large capital investment and intensive training. In contrast, the integrated DLS and SLS technology provided by Stunner provides a comprehensive solution for qualitative analysis of in-process samples. The analysis provides multi-attribute sample information such as the amount of capsid-associated proteins and DNA, free and aggregated proteins and DNA, capsids of interest, small particles, aggregates, empty and full capsids, sample turbidity, and impurities. These physical attributes are important for product and process development. While Stunner, similar to other technologies, is affected by impurities present in non-purified in-process samples and may not be suitable for exact vector quantification in non-purified samples, the technology provides a fast and comprehensive multi-attribute qualitative analysis allowing comparison of vector samples during process development using a single instrument.
As yields and vector concentrations increase, there are increasing concerns about aggregation and vector stability.41 As highlighted in this study, the various parameters captured by Stunner revealed changes that occurred during the purification and concentration process, including aggregation and breakdown products. Thus, Stunner can be used for offline real-time monitoring and assessment during manufacturing and process development, and as a stability-indicating assay, enable researchers to make informed decisions and effectively prioritize resources for downstream purification.
Stunner offers an empirical and comprehensive assessment that surpasses conventional methods. For example, in PCR-based genomic quantification assays, amplicon choices and the effect of DNase treatment on vector stability can affect titer measurements.24,31,42,43 Particle titer by SDS-PAGE/silver stain or ELISA can be affected by the standards used or antibody employed in the assay. Unlike these methods, Stunner provides a direct measurement of vector samples though UV-Vis SLS/DLS, eliminating the dependence on standards or amplification efficiency. This may account for the observed discrepancies in some samples between Stunner and ddPCR or qPCR titers and aligns with the sub-studies that show no significant difference between various PCR assays or amplicons used. Moreover, Stunner’s capability to distinguish between empty and full capsids, along with its ability to quantify free and aggregated proteins and DNA, and to assess particle size and size distribution, in a single measurement marks a significant advancement.
Other approaches to characterize rAAV remain important but require additional resources and skills, making them cumbersome for early-stage development.20 As an example, analytical ultracentrifugation (AUC) allows for a high-resolution determination of empty and full capsids in a sample and provides a reliable quantification of partially packaged vector populations.44 However, the high cost of acquisition, the low throughput, and larger volume sample requirements make AUC impractical to most. Comparison between Stunner and AUC showed a strong correlation in the determination of empty and full capsids (Figure S1). IEC-MALS and SEC-MALS have also been used in tandem to characterize rAAVs.36,37 While these technologies can be used to characterize rAAV particles and payload, the sample volume requirement for SEC-MALS is 25-times larger than what is required for Stunner, which is impractical in early discovery. In addition, the computation of relevant characteristics must be performed offline.37 Consequently, due to its economic implications and low throughput, SEC-MALS is less suited than Stunner for daily routine usage at high throughput.
A downside of Stunner is that it does not report on partially filled capsids. Recent studies have demonstrated that multiplexed PCR reactions and capillary electrophoresis can be used to evaluate viral genome integrity and vector therapeutic payload.24,45,46 These assays can be used in addition to Stunner to assess particles with partially filled or truncated genomes. Other options include combining Stunner’s analysis with other conventional assays, such as capillary gel electrophoresis for assessing packaged genomes, or employing multiple ddPCR reactions targeting different segments across the same genome.
During the product discovery and development stage, it is crucial for researchers to gain insight into the rAAV vector biophysical properties and their relationships to therapeutic effectiveness. Orthogonal assays are needed to fully assess rAAV quantitatively and qualitatively, as previously described.47 However, it is impractical to perform orthogonal techniques at the early discovery and development stage due to technology limitations and resource constraints. Stunner fills the gap, not only by facilitating rapid vector quality control but also by supporting vector screening, development, and optimization. In addition, Stunner offers insights into the vector’s physical and qualitative characteristics through a multi-parametric analysis.
Like any technology, the workable range and limitations of the Stunner UV-Vis/DLS/SLS platform need to be well understood. We demonstrated that Stunner can be used with a high level of accuracy to quantify and characterize purified vectors with titers ranging from low-1012 to mid-1013 vg/mL. The platform tolerates salt, surfactants, and other common buffers, except for iodixanol, which is known to interfere with OD260/280 determinations even at low concentrations, as previously described.28 Stunner calculates the percentage of empty and full capsids based on total DNA and protein, assuming the ratio between empty and full particles is the same for both the capsid of interest and aggregates. However, this assumption may prove inaccurate when capsid-associated protein levels are negligible, leading to misleading data, especially in less pure or in-process samples. For instance, Figure 7A demonstrates that although no assembled capsids were detected in the flow-through sample, the reported percent of full and empty capsids was inflated due to the higher amount of free and aggregate protein and DNA in the sample. Therefore, it is important for Stunner users to thoroughly understand the parameters being measured and the analysis methodology employed to fully leverage the platform’s capabilities. The platform is designed to be used as a comprehensive toolbox, capturing and storing a significant amount of biophysical data. However, only selected data directly related to protein concentration and DNA titer, as well as empty and full capsids, are currently presented on the AAV Quant interface. Data, including molecular weight of empty and full particles, peak of interest mass, and mode diameter, are measured and available for analysis but are not currently displayed on the user interface. It would be beneficial in future iterations of Stunner software if users could preset the range for the capsid of interest, as the broadness of the full capsid particle peak in a test article appears to be affected by the purity.
In summary, our findings support the Stunner UV-Vis/DLS/SLS platform as a valuable stand-alone or supplementary tool in rAAV development. Although it does not replace standard product release assays like PCR, SDS-PAGE gels, and AUC, it can serve as a powerful complementary tool for vector quantification in purified vector samples and product characterization, offering quick and accurate direct particle assessment and real-time process/production monitoring. With its high-throughput format, small sample requirement, ability to handle a reasonable titer range, and tolerance for varying formulations, the Stunner UV-Vis/DLS/SLS technology presents an efficient tool for vector manufacturing.
Materials and methods
Stunner AAV quant application
Stunner (Unchained Labs, Pleasanton, CA) combines static light scattering (SLS), dynamic light scattering (DLS), and UV-Vis spectrophotometry data in its AAV Quant application to produce rapid, multi-attribute characterization of rAAV vectors (Figure 1). Analysis of a single rAAV sample produces multiple outputs, including capsid titer (listed as “total capsid titer”), genome titer (listed as “full capsid titer”), empty/full ratio, particle size, polydispersity, and quantification of the total amount of protein and DNA, including free and aggregated protein and DNA.
Stunner experimental setup and analysis
A 2-μL sample was loaded onto specialized 96-well plates, which include microfluidic channels and dual-cuvettes (Unchained Labs, Pleasanton, CA). Samples were typically loaded in triplicates unless otherwise specified. The AAV Quant application was selected in the Lunatic & Stunner Client software (version 7.2.0.164), and data were acquired using a customized DLS setting that consisted of 10 acquisitions, each lasting 5 s. Water blanking was used to mitigate the risk of overcorrecting from buffer blanking during UV-Vis deconvolution. While the buffers were not used for the background correction, they were also measured to rule out any artifactual contribution. Sample information including serotype and viral genome size was entered to ensure accurate titer determinations. Data analysis was fully automated using the Lunatic & Stunner Analysis Software (version 8.1.0.244). Detailed methodology and parameters are delineated in the supplemental methods section.
rAAV production, purification, and concentration
rAAV vectors were produced by transient transfection of adherent human embryonic kidney epithelial cells (HEK293) and purified by cesium chloride (CsCl) density gradient or column chromatography as previously described.48,49,50,51 Purified empty and full vectors were collected separately, formulated in phosphate-buffered saline containing 0.005% Pluronic F-68, and sterile-filtered (0.2 μm) before final fill. For certain production lots, in-process samples at each purification step were also collected for analysis. To reach a desired titer, some purified vectors were concentrated using a Vivaspin 6 centrifugal concentrator (MWCO 100 kDa) according to the manufacturer’s instructions (Sartorius, Germany).
Vector genome titration by ddPCR
Digital droplet polymerase chain reaction (ddPCR) was used to quantify DNase-resistant, genome-containing particles via transgene-specific or ITR-specific primer probes. Briefly, 5 μL of vector (test article) was treated with 5 units of DNase I (Invitrogen, Waltham, MA) at room temperature for 30 min, followed by serial dilutions with sample diluent buffer as previously described.25 Three dilutions ranging from 104- to 108-fold were chosen for amplification reactions based on the expected titers. According to the manufacturer’s instruction, ddPCR reactions were assembled with ddPCR Supermix for Probes (No dUTP) (Bio-Rad, Hercules, CA), 0.9-mM primers, and 0.2-mM probe (IDT, Coralville, IA) in a final volume of 20 μL, partitioned into droplets via QX-100 droplet generator (Bio-Rad, Hercules, CA). Droplets were transferred to a 96-well PCR plate and sealed with foil seal using a PX1 PCR plate sealer set to 180°C for 5 s. PCR amplifications were performed on SimpliAmp Thermal Cycler (Invitrogen, Waltham, MA) according to the following protocol: 37°C for 30 min, 95°C for 10 min, followed by 36 cycles of 95°C for 30 s, 60°C for 1 min, 72°C for 15 s, and a final 98°C heat treatment for 10 min. Upon completion of the amplification, the plate was left at 4.0°C for at least 30 min. Then, PCR plates were transferred and scanned in the QX200 Droplet Reader (Bio-Rad, Hercules, CA). Data were captured and analyzed with the Direct Quantification experiment program in the QuantaSoft Manager Software Regulatory Edition (Bio-Rad, Hercules, CA). Datasets associated with low total droplets (<12,000 droplets/well) as well as sets with an abnormal positive droplet count in the no-template control (NTC) well were excluded from the analysis. Qualified titer (GC/mL) was calculated using concentration (copies/μL), reaction volume, sample input volume, and dilution factor from the wells containing 200 to 10,000 positive droplets. The final vector titer and the coefficient of variation were computed from three dilutions.
Vector genome titration by Taqman real-time qPCR
Vector quantification by real-time quantitative PCR (qPCR) was achieved through a transgene-specific primer-probe and a standard curve generated from plasmid DNA containing the same amplicon (usually a cis plasmid containing the same transgene, not shown). Plasmid DNA was linearized with a single cutter restriction enzyme, gel-purified, quantified by UV absorbance using the NanoDrop 2000/2000c Spectrophotometers (ThermoFisher Scientific, Waltham, MA), and then serially diluted based on molecular weight.26 This resulted in six standards ranging from 106 to 1011 genome copies (GC) per milliliter. For each test article, three dilutions were used (1:1,000, 1:5,000, and 1:25,000) following DNase I treatment at room temperature for 30 min and vector lysis in 0.2% SDS/5 mM EDTA/200 mM NaCl at 95°C for 10 min. An aliquot of standard or vector dilution (4.5 μL) was added to three replicated wells each containing 5.5 μL of reaction mix. PCR was carried out on an Applied Biosystems 7900HT Fast Real-time PCR System. Vector genome titers were calculated by multiplying the copies per well interpolated from the standard curve with the above dilution factors, assuming that one copy of the double-stranded plasmid DNA is equivalent to two single-stranded vector genomes or one self-complementary vector genome.
Vector particle titration by SDS-PAGE electrophoresis and silver stain
Test article (in duplicate) and reference standards were prepared with Novex NuPAGE 4X LDS sample loading buffer and 10X reducing agent, heated at 95°C for 5 min, and then run on a 10% Bis-Tris NuPAGE Gel (Invitrogen, Waltham, MA). Following electrophoresis, the gel was stained using SilverXpress Staining Kit (Invitrogen) and dried using DryEase Mini-Gel Drying kit (Invitrogen) according to the manufacturer’s protocols, then scanned by Epson Perfection V600 Photo using Epson Scan software “Film” setting (Epson, Nagano, Japan). The image was then converted to grayscale and quantified with ImageJ.52 Densitometry measurement and linear regression analysis of the VP1 bands were performed. A standard curve was generated by plotting the amount of reference standard loaded vs. band intensity. Linear regression analysis yielded an equation that allows calculating the amount of particle loaded from each test article based on the intensity of the VP1 band.26 The particle titer of the rAAV vector was then computed from the interpolated vector amount and testing volume, averaged, and qualified with %CV less than 10% and R2 > 0.98.
Empty and full capsids quantification by cryo-EM
Approximately 3–5 μL of an rAAV vector sample was loaded onto Quantifoil holey carbon grids and frozen using a Vitrobot Mark IV cryo plunger. Grids were imaged using a Titan Krios G3i microscope with a K3 Summit Direct Detector camera and Bioquantum GIF energy filter. Data were acquired with EPU (ThermoFisher Scientific) and processed using cryoSPARC. Electron Microscopy Resource Lab Core Facility performed the above at the Perelman School of Medicine of the University of Pennsylvania (RRID:SCR_022375). Empty and full capsids were classified and quantified based on the particle’s internal density. Regions of uncertainty resulting from overlapping capsids, ice formation, and low image contrast settings were excluded from the analysis. The percentages of empty and full capsids were determined based on a total of 3,000 particles. Each sample was evaluated independently by three different operators.
Statistical analysis
Correlations of titers obtained from Stunner AAV Quant and other conventional methods were tested for normality using the Shapiro-Wilk test on log-transformed titer data and expressed using the Pearson correlation coefficient. The nonparametric (Spearman’s) correlation test was used for datasets without a normal distribution. In the sub-group studies, the differences between Pearson correlations were tested with a normal test (Z score) after Fisher’s Z transformation. Scatterplots, correlations, and p values were generated using the ggplot2 package in R programs (R Foundation). Bootstrapping (a nonparametric algorithm), where approximately one-sixth of the large sample sets is randomly selected 10,000 times (resampling with replacement), was carried out to confirm the robustness of the correlations in situations where the sample size was small (using a 95% CI). These analyses were performed in RStudio 2022.07.2 Build 576. For cryo-EM and empty/full data, statistical analyses were performed with GraphPad Prism v9. All results were presented as mean ± standard deviation. The Student’s t test was used for comparison between the two groups. Results were considered statistically significant at p < 0.05.
Figure generation
The graphical abstract was created using BioRender.
Data and code availability
Correlation study datasets and the R programming codes for statistical analysis are available on request with approval from the Children’s Hospital of Philadelphia Office of Technology Transfer.
Acknowledgments
The authors thank the Children’s Hospital of Philadelphia Research Institute for funding support, Carolyn M. Yrigollen for her guidance and help on Adobe Illustrator and figure creation, and Nancy Robinson-Garvin for helpful discussions and manuscript review.
Author contributions
X.L., B.L.D., and J.C.M.v.d.L. designed the study and wrote the paper. X.L. and J.B. performed experiments. X.L., L.Z., and R.Y. generated vectors. X.L. and C.C. performed statistical analyses. X.L., R.J.-G., K.L., J.C.M.v.d.L., and B.L.D. evaluated the data, wrote and edited the paper.
Declaration of interests
B.L.D. serves an advisory role and/or receives sponsored research support for her laboratory from Roche, Resilience, and Latus Bio. R.J.-G. and K.L. are employees of Unchained Labs. J.C.M.v.d.L. serves as consultant and/or scientific advisor for 4BIO Capital, Avantor, Vibalogics, and Vyriad.
Footnotes
Supplemental information can be found online at https://doi.org/10.1016/j.omtm.2024.101298.
Contributor Information
Johannes C.M. van der Loo, Email: vanderlooj@chop.edu.
Beverly L. Davidson, Email: davidsonbl@chop.edu.
Supplemental information
References
- 1.Dunbar C.E., High K.A., Joung J.K., Kohn D.B., Ozawa K., Sadelain M. Gene therapy comes of age. Science. 2018;359 doi: 10.1126/science.aan4672. [DOI] [PubMed] [Google Scholar]
- 2.Keeler A.M., Flotte T.R. Recombinant Adeno-Associated Virus Gene Therapy in Light of Luxturna (and Zolgensma and Glybera): Where Are We, and How Did We Get Here? Annu. Rev. Virol. 2019;6:601–621. doi: 10.1146/annurev-virology-092818-015530. [DOI] [PMC free article] [PubMed] [Google Scholar]
- 3.Li C., Samulski R.J. Engineering adeno-associated virus vectors for gene therapy. Nat. Rev. Genet. 2020;21:255–272. doi: 10.1038/s41576-019-0205-4. [DOI] [PubMed] [Google Scholar]
- 4.Hastie E., Samulski R.J. Adeno-associated virus at 50: a golden anniversary of discovery, research, and gene therapy success--a personal perspective. Hum. Gene Ther. 2015;26:257–265. doi: 10.1089/hum.2015.025. [DOI] [PMC free article] [PubMed] [Google Scholar]
- 5.Wang D., Gao G. State-of-the-art human gene therapy: part I. Gene delivery technologies. Discov. Med. 2014;18:67–77. [PMC free article] [PubMed] [Google Scholar]
- 6.Kuzmin D.A., Shutova M.V., Johnston N.R., Smith O.P., Fedorin V.V., Kukushkin Y.S., van der Loo J.C.M., Johnstone E.C. The clinical landscape for AAV gene therapies. Nat. Rev. Drug Discov. 2021;20:173–174. doi: 10.1038/d41573-021-00017-7. [DOI] [PubMed] [Google Scholar]
- 7.Manini A., Abati E., Nuredini A., Corti S., Comi G.P. Adeno-Associated Virus (AAV)-Mediated Gene Therapy for Duchenne Muscular Dystrophy: The Issue of Transgene Persistence. Front. Neurol. 2021;12 doi: 10.3389/fneur.2021.814174. [DOI] [PMC free article] [PubMed] [Google Scholar]
- 8.Jablonka S., Hennlein L., Sendtner M. Therapy development for spinal muscular atrophy: perspectives for muscular dystrophies and neurodegenerative disorders. Neurol. Res. Pract. 2022;4:2. doi: 10.1186/s42466-021-00162-9. [DOI] [PMC free article] [PubMed] [Google Scholar]
- 9.Wills C.A., Drago D., Pietrusko R.G. Clinical holds for cell and gene therapy trials: Risks, impact, and lessons learned. Mol. Ther. Methods Clin. Dev. 2023;31 doi: 10.1016/j.omtm.2023.101125. [DOI] [PMC free article] [PubMed] [Google Scholar]
- 10.Bulcha J.T., Wang Y., Ma H., Tai P.W.L., Gao G. Viral vector platforms within the gene therapy landscape. Signal Transduct. Targeted Ther. 2021;6:53. doi: 10.1038/s41392-021-00487-6. [DOI] [PMC free article] [PubMed] [Google Scholar]
- 11.Wang D., Tai P.W.L., Gao G. Adeno-associated virus vector as a platform for gene therapy delivery. Nat. Rev. Drug Discov. 2019;18:358–378. doi: 10.1038/s41573-019-0012-9. [DOI] [PMC free article] [PubMed] [Google Scholar]
- 12.Naso M.F., Tomkowicz B., Perry W.L., 3rd, Strohl W.R. Adeno-Associated Virus (AAV) as a Vector for Gene Therapy. BioDrugs. 2017;31:317–334. doi: 10.1007/s40259-017-0234-5. [DOI] [PMC free article] [PubMed] [Google Scholar]
- 13.Tang Q., Keeler A.M., Zhang S., Su Q., Lyu Z., Cheng Y., Gao G., Flotte T.R. Two-Plasmid Packaging System for Recombinant Adeno-Associated Virus. Biores. Open Access. 2020;9:219–228. doi: 10.1089/biores.2020.0031. [DOI] [PMC free article] [PubMed] [Google Scholar]
- 14.Robert M.A., Chahal P.S., Audy A., Kamen A., Gilbert R., Gaillet B. Manufacturing of recombinant adeno-associated viruses using mammalian expression platforms. Biotechnol. J. 2017;12:1600193. doi: 10.1002/biot.201600193. [DOI] [PubMed] [Google Scholar]
- 15.Yuan Z., Qiao C., Hu P., Li J., Xiao X. A versatile adeno-associated virus vector producer cell line method for scalable vector production of different serotypes. Hum. Gene Ther. 2011;22:613–624. doi: 10.1089/hum.2010.241. [DOI] [PMC free article] [PubMed] [Google Scholar]
- 16.Kurasawa J.H., Park A., Sowers C.R., Halpin R.A., Tovchigrechko A., Dobson C.L., Schmelzer A.E., Gao C., Wilson S.D., Ikeda Y. Chemically Defined, High-Density Insect Cell-Based Expression System for Scalable AAV Vector Production. Mol. Ther. Methods Clin. Dev. 2020;19:330–340. doi: 10.1016/j.omtm.2020.09.018. [DOI] [PMC free article] [PubMed] [Google Scholar]
- 17.Gao G.P., Lu F., Sanmiguel J.C., Tran P.T., Abbas Z., Lynd K.S., Marsh J., Spinner N.B., Wilson J.M. Rep/Cap gene amplification and high-yield production of AAV in an A549 cell line expressing Rep/Cap. Mol. Ther. 2002;5:644–649. doi: 10.1006/mthe.2001.0591. [DOI] [PubMed] [Google Scholar]
- 18.Smith R.H., Levy J.R., Kotin R.M. A simplified baculovirus-AAV expression vector system coupled with one-step affinity purification yields high-titer rAAV stocks from insect cells. Mol. Ther. 2009;17:1888–1896. doi: 10.1038/mt.2009.128. [DOI] [PMC free article] [PubMed] [Google Scholar]
- 19.Miyake K., Miyake N., Yamazaki Y., Shimada T., Hirai Y. Serotype-independent method of recombinant adeno-associated virus (AAV) vector production and purification. J. Nippon Med. Sch. 2012;79:394–402. doi: 10.1272/jnms.79.394. [DOI] [PubMed] [Google Scholar]
- 20.Gimpel A.L., Katsikis G., Sha S., Maloney A.J., Hong M.S., Nguyen T.N.T., Wolfrum J., Springs S.L., Sinskey A.J., Manalis S.R., et al. Analytical methods for process and product characterization of recombinant adeno-associated virus-based gene therapies. Mol. Ther. Methods Clin. Dev. 2021;20:740–754. doi: 10.1016/j.omtm.2021.02.010. [DOI] [PMC free article] [PubMed] [Google Scholar]
- 21.Wright J.F. Product-Related Impurities in Clinical-Grade Recombinant AAV Vectors: Characterization and Risk Assessment. Biomedicines. 2014;2:80–97. doi: 10.3390/biomedicines2010080. [DOI] [PMC free article] [PubMed] [Google Scholar]
- 22.Werling N.J., Satkunanathan S., Thorpe R., Zhao Y. Systematic Comparison and Validation of Quantitative Real-Time PCR Methods for the Quantitation of Adeno-Associated Viral Products. Hum. Gene Ther. Methods. 2015;26:82–92. doi: 10.1089/hgtb.2015.013. [DOI] [PMC free article] [PubMed] [Google Scholar]
- 23.Martinez-Fernandez de la Camara C., McClements M.E., MacLaren R.E. Accurate Quantification of AAV Vector Genomes by Quantitative PCR. Genes. 2021;12:601. doi: 10.3390/genes12040601. [DOI] [PMC free article] [PubMed] [Google Scholar]
- 24.Dobnik D., Kogovsek P., Jakomin T., Kosir N., Tusek Znidaric M., Leskovec M., Kaminsky S.M., Mostrom J., Lee H., Ravnikar M. Accurate Quantification and Characterization of Adeno-Associated Viral Vectors. Front. Microbiol. 2019;10:1570. doi: 10.3389/fmicb.2019.01570. [DOI] [PMC free article] [PubMed] [Google Scholar]
- 25.Sanmiguel J., Gao G., Vandenberghe L.H. Quantitative and Digital Droplet-Based AAV Genome Titration. Methods Mol. Biol. 2019;1950:51–83. doi: 10.1007/978-1-4939-9139-6_4. [DOI] [PMC free article] [PubMed] [Google Scholar]
- 26.Su Q., Sena-Esteves M., Gao G. Analysis of Recombinant Adeno-Associated Virus (rAAV) Purity Using Silver-Stained SDS-PAGE. Cold Spring Harb. Protoc. 2020;2020 doi: 10.1101/pdb.prot095679. [DOI] [PubMed] [Google Scholar]
- 27.Wright J.F. Manufacturing and characterizing AAV-based vectors for use in clinical studies. Gene Ther. 2008;15:840–848. doi: 10.1038/gt.2008.65. [DOI] [PubMed] [Google Scholar]
- 28.Sommer J.M., Smith P.H., Parthasarathy S., Isaacs J., Vijay S., Kieran J., Powell S.K., McClelland A., Wright J.F. Quantification of adeno-associated virus particles and empty capsids by optical density measurement. Mol. Ther. 2003;7:122–128. doi: 10.1016/s1525-0016(02)00019-9. [DOI] [PubMed] [Google Scholar]
- 29.Zolotukhin S., Byrne B.J., Mason E., Zolotukhin I., Potter M., Chesnut K., Summerford C., Samulski R.J., Muzyczka N. Recombinant adeno-associated virus purification using novel methods improves infectious titer and yield. Gene Ther. 1999;6:973–985. doi: 10.1038/sj.gt.3300938. [DOI] [PubMed] [Google Scholar]
- 30.Minton A.P. Recent applications of light scattering measurement in the biological and biopharmaceutical sciences. Anal. Biochem. 2016;501:4–22. doi: 10.1016/j.ab.2016.02.007. [DOI] [PMC free article] [PubMed] [Google Scholar]
- 31.Werle A.K., Powers T.W., Zobel J.F., Wappelhorst C.N., Jarrold M.F., Lyktey N.A., Sloan C.D.K., Wolf A.J., Adams-Hall S., Baldus P., Runnels H.A. Comparison of analytical techniques to quantitate the capsid content of adeno-associated viral vectors. Mol. Ther. Methods Clin. Dev. 2021;23:254–262. doi: 10.1016/j.omtm.2021.08.009. [DOI] [PMC free article] [PubMed] [Google Scholar]
- 32.Katsikis G., Hwang I.E., Wang W., Bhat V.S., McIntosh N.L., Karim O.A., Blus B.J., Sha S., Agache V., Wolfrum J.M., et al. Weighing the DNA Content of Adeno-Associated Virus Vectors with Zeptogram Precision Using Nanomechanical Resonators. Nano Lett. 2022;22:1511–1517. doi: 10.1021/acs.nanolett.1c04092. [DOI] [PubMed] [Google Scholar]
- 33.Wu Z., Wang H., Tustian A., Qiu H., Li N. Development of a Two-Dimensional Liquid Chromatography-Mass Spectrometry Platform for Simultaneous Multi-Attribute Characterization of Adeno-Associated Viruses. Anal. Chem. 2022;94:3219–3226. doi: 10.1021/acs.analchem.1c04873. [DOI] [PubMed] [Google Scholar]
- 34.Pierson E.E., Keifer D.Z., Asokan A., Jarrold M.F. Resolving Adeno-Associated Viral Particle Diversity With Charge Detection Mass Spectrometry. Anal. Chem. 2016;88:6718–6725. doi: 10.1021/acs.analchem.6b00883. [DOI] [PMC free article] [PubMed] [Google Scholar]
- 35.Khasa H., Kilby G., Chen X., Wang C. Analytical band centrifugation for the separation and quantification of empty and full AAV particles. Mol. Ther. Methods Clin. Dev. 2021;21:585–591. doi: 10.1016/j.omtm.2021.04.008. [DOI] [PMC free article] [PubMed] [Google Scholar]
- 36.Wagner C., Innthaler B., Lemmerer M., Pletzenauer R., Birner-Gruenberger R. Biophysical Characterization of Adeno-Associated Virus Vectors Using Ion-Exchange Chromatography Coupled to Light Scattering Detectors. Int. J. Mol. Sci. 2022;23 doi: 10.3390/ijms232112715. [DOI] [PMC free article] [PubMed] [Google Scholar]
- 37.McIntosh N.L., Berguig G.Y., Karim O.A., Cortesio C.L., De Angelis R., Khan A.A., Gold D., Maga J.A., Bhat V.S. Comprehensive characterization and quantification of adeno associated vectors by size exclusion chromatography and multi angle light scattering. Sci. Rep. 2021;11:3012. doi: 10.1038/s41598-021-82599-1. [DOI] [PMC free article] [PubMed] [Google Scholar]
- 38.Kotin R.M., Wright J.F. Recombinant Adeno-Associated Virus Quality Control for Non-Clinical and Clinical Vectors: How an Unregulated Commercial Sector Can Compromise Development of New Gene Therapies. Hum. Gene Ther. 2019;30:1447–1448. doi: 10.1089/hum.2019.29099.rmk. [DOI] [PubMed] [Google Scholar]
- 39.Lock M., Alvira M.R., Chen S.J., Wilson J.M. Absolute determination of single-stranded and self-complementary adeno-associated viral vector genome titers by droplet digital PCR. Hum. Gene Ther. Methods. 2014;25:115–125. doi: 10.1089/hgtb.2013.131. [DOI] [PMC free article] [PubMed] [Google Scholar]
- 40.Gagnon P., Goricar B., Mencin N., Zvanut T., Peljhan S., Leskovec M., Strancar A. Multiple-Monitor HPLC Assays for Rapid Process Development, In-Process Monitoring, and Validation of AAV Production and Purification. Pharmaceutics. 2021;13 doi: 10.3390/pharmaceutics13010113. [DOI] [PMC free article] [PubMed] [Google Scholar]
- 41.Croyle M.A., Cheng X., Wilson J.M. Development of formulations that enhance physical stability of viral vectors for gene therapy. Gene Ther. 2001;8:1281–1290. doi: 10.1038/sj.gt.3301527. [DOI] [PubMed] [Google Scholar]
- 42.Wang F., Cui X., Wang M., Xiao W., Xu R. A reliable and feasible qPCR strategy for titrating AAV vectors. Med. Sci. Monit. Basic Res. 2013;19:187–193. doi: 10.12659/MSMBR.883968. [DOI] [PMC free article] [PubMed] [Google Scholar]
- 43.Su Q., Sena-Esteves M., Gao G. Titration of Recombinant Adeno-Associated Virus (rAAV) Genome Copy Number Using Real-Time Quantitative Polymerase Chain Reaction (qPCR) Cold Spring Harb. Protoc. 2020;2020 doi: 10.1101/pdb.prot095646. [DOI] [PubMed] [Google Scholar]
- 44.Burnham B., Nass S., Kong E., Mattingly M., Woodcock D., Song A., Wadsworth S., Cheng S.H., Scaria A., O'Riordan C.R. Analytical Ultracentrifugation as an Approach to Characterize Recombinant Adeno-Associated Viral Vectors. Hum. Gene Ther. Methods. 2015;26:228–242. doi: 10.1089/hgtb.2015.048. [DOI] [PubMed] [Google Scholar]
- 45.Prantner A., Maar D. Genome concentration, characterization, and integrity analysis of recombinant adeno-associated viral vectors using droplet digital PCR. PLoS One. 2023;18 doi: 10.1371/journal.pone.0280242. [DOI] [PMC free article] [PubMed] [Google Scholar]
- 46.Barnes L.F., Draper B.E., Chen Y.T., Powers T.W., Jarrold M.F. Quantitative analysis of genome packaging in recombinant AAV vectors by charge detection mass spectrometry. Mol. Ther. Methods Clin. Dev. 2021;23:87–97. doi: 10.1016/j.omtm.2021.08.002. [DOI] [PMC free article] [PubMed] [Google Scholar]
- 47.Cole L., Fernandes D., Hussain M.T., Kaszuba M., Stenson J., Markova N. Characterization of Recombinant Adeno-Associated Viruses (rAAVs) for Gene Therapy Using Orthogonal Techniques. Pharmaceutics. 2021;13 doi: 10.3390/pharmaceutics13040586. [DOI] [PMC free article] [PubMed] [Google Scholar]
- 48.Ayuso E., Mingozzi F., Montane J., Leon X., Anguela X.M., Haurigot V., Edmonson S.A., Africa L., Zhou S., High K.A., et al. High AAV vector purity results in serotype- and tissue-independent enhancement of transduction efficiency. Gene Ther. 2010;17:503–510. doi: 10.1038/gt.2009.157. [DOI] [PubMed] [Google Scholar]
- 49.Nass S.A., Mattingly M.A., Woodcock D.A., Burnham B.L., Ardinger J.A., Osmond S.E., Frederick A.M., Scaria A., Cheng S.H., O'Riordan C.R. Universal Method for the Purification of Recombinant AAV Vectors of Differing Serotypes. Mol. Ther. Methods Clin. Dev. 2018;9:33–46. doi: 10.1016/j.omtm.2017.12.004. [DOI] [PMC free article] [PubMed] [Google Scholar]
- 50.Florea M., Nicolaou F., Pacouret S., Zinn E.M., Sanmiguel J., Andres-Mateos E., Unzu C., Wagers A.J., Vandenberghe L.H. High-efficiency purification of divergent AAV serotypes using AAVX affinity chromatography. Mol. Ther. Methods Clin. Dev. 2023;28:146–159. doi: 10.1016/j.omtm.2022.12.009. [DOI] [PMC free article] [PubMed] [Google Scholar]
- 51.Lu H., Chen L., Wang J., Huack B., Sarkar R., Zhou S., Xu R., Ding Q., Wang X., Wang H., Xiao W. Complete correction of hemophilia A with adeno-associated viral vectors containing a full-size expression cassette. Hum. Gene Ther. 2008;19:648–654. doi: 10.1089/hum.2007.0182. [DOI] [PMC free article] [PubMed] [Google Scholar]
- 52.Schneider C.A., Rasband W.S., Eliceiri K.W. NIH Image to ImageJ: 25 years of image analysis. Nat. Methods. 2012;9:671–675. doi: 10.1038/nmeth.2089. [DOI] [PMC free article] [PubMed] [Google Scholar]
Associated Data
This section collects any data citations, data availability statements, or supplementary materials included in this article.
Supplementary Materials
Data Availability Statement
Correlation study datasets and the R programming codes for statistical analysis are available on request with approval from the Children’s Hospital of Philadelphia Office of Technology Transfer.