

Abstract
Background
Adherence to complex regimens for people with chronic kidney disease (CKD) and diabetes is often poor. Interventions to enhance adherence require intensive education and behavioural counselling. However, whether the existing evidence is scientifically rigorous and can support recommendations for routine use of educational programmes in people with CKD and diabetes is still unknown. This is an update of a review first published in 2011.
Objectives
To evaluate the benefits and harms of education programmes for people with CKD and diabetes.
Search methods
We searched the Cochrane Kidney and Transplant Register of Studies up to 19 July 2024 using search terms relevant to this review. Studies in the Register are identified through searches of CENTRAL, MEDLINE, and EMBASE, conference proceedings, the International Clinical Trials Registry Platform (ICTRP) Search Portal, and ClinicalTrials.gov.
Selection criteria
We included randomised controlled trials (RCTs) and quasi‐RCTs investigating the benefits and harms of educational programmes (information and behavioural instructions and advice given by a healthcare provider, who could be a nurse, pharmacist, educator, health professional, medical practitioner, or healthcare provider, through verbal, written, audio‐recording, or computer‐aided modalities) for people 18 years and older with CKD and diabetes.
Data collection and analysis
Two authors independently screened the literature, determined study eligibility, assessed quality, and extracted and entered data. We expressed dichotomous outcomes as risk ratios (RR) with 95% confidence intervals (CI) and continuous data as mean difference (MD) with 95% CI. Data were pooled using the random‐effects model. The certainty of the evidence was assessed using the Grades of Recommendation, Assessment, Development and Evaluation (GRADE) approach.
Main results
Eight studies (13 reports, 840 randomised participants) were included. The overall risk of bias was low for objective outcomes and attrition bias, unclear for selection bias, reporting bias and other biases, and high for subjective outcomes.
Education programmes compared to routine care alone probably decrease glycated haemoglobin (HbA1c) (4 studies, 467 participants: MD ‐0.42%, 95% CI ‐0.53 to ‐0.31; moderate certainty evidence; 13.5 months follow‐up) and may decrease total cholesterol (179 participants: MD ‐0.35 mmol/L, 95% CI ‐0.63 to ‐00.07; low certainty evidence) and low‐density lipoprotein (LDL) cholesterol (179 participants: MD ‐0.40 mmol/L, 95% CI ‐0.65 to ‐0.14; low certainty evidence) at 18 months of follow‐up.
One study (83 participants) reported education programmes for people receiving dialysis who have diabetes may improve the diabetes knowledge of diagnosis, monitoring, hypoglycaemia, hyperglycaemia, medication with insulin, oral medication, personal health habits, diet, exercise, chronic complications, and living with diabetes and coping with stress (all low certainty evidence). There may be an improvement in the general knowledge of diabetes at the end of the intervention and at the end of the three‐month follow‐up (one study, 97 participants; low certainty evidence) in people with diabetes and moderately increased albuminuria (A2).
In participants with diabetes and moderately increased albuminuria (A2) (one study, 97 participants), education programmes may improve a participant’s beliefs in treatment effectiveness and total self‐efficacy at the end of five weeks compared to routine care (low certainty evidence). Self‐efficacy for in‐home blood glucose monitoring and beliefs in personal control may increase at the end of the three‐month follow‐up (low certainty evidence). There were no differences in other self‐efficacy measures.
One study (100 participants) reported an education programme may increase change in behaviour for general diet, specific diet and home blood glucose monitoring at the end of treatment (low certainty evidence); however, at the end of three months of follow‐up, there may be no difference in any behaviour change outcomes (all low certainty evidence). There were uncertain effects on death, serious hypoglycaemia, and kidney failure due to very low certainty evidence. No data was available for changes in kidney function (creatinine clearance, serum creatinine, doubling of serum creatinine or proteinuria).
For an education programme plus multidisciplinary, co‐ordinated care compared to routine care, there may be little or no difference in HbA1c, kidney failure, estimated glomerular filtration rate (eGFR), systolic or diastolic blood pressure, hypoglycaemia, hyperglycaemia, and LDL and high‐density lipoprotein (HDL) cholesterol (all low certainty evidence in participants with type‐2 diabetes mellitus and documented advanced diabetic nephropathy). There were no data for death, patient‐orientated measures, change in kidney function (other than eGFR and albuminuria), cardiovascular disease morbidity, quality of life, or adverse events.
Authors' conclusions
Education programmes may improve knowledge of some areas related to diabetes care and some self‐management practices. Education programmes probably decrease HbA1c in people with CKD and diabetes, but the effect on other clinical outcomes is unclear. This review only included eight studies with small sample sizes. Therefore, more randomised studies are needed to examine the efficacy of education programmes on important clinical outcomes in people with CKD and diabetes.
Keywords: Humans; Bias; Diabetes Mellitus; Diabetes Mellitus/therapy; Diabetes Mellitus, Type 2; Diabetes Mellitus, Type 2/therapy; Glycated Hemoglobin; Glycated Hemoglobin/metabolism; Medication Adherence; Patient Education as Topic; Patient Education as Topic/methods; Quality of Life; Randomized Controlled Trials as Topic; Renal Insufficiency, Chronic; Renal Insufficiency, Chronic/therapy
Plain language summary
Do education programmes improve outcomes in people with both chronic kidney disease and diabetes?
Key messages
• For people with both chronic kidney disease (a long‐term condition where the kidneys do not work effectively) and diabetes (a lifelong condition that causes a person's blood sugar level to become too high), education programmes (planned activities designed to improve a person's ability to manage their condition) may improve their knowledge of diabetes, their ability to manage their condition, and self‐management behavioural changes.
• However, the small number of people enrolled in these studies and the wide range of outcomes reported means our findings must be interpreted cautiously. Larger, well‐designed studies with common outcomes and longer follow‐ups are needed.
Why is improving diabetes care important for people with kidney disease?
Chronic kidney disease (a long‐term condition where the kidneys do not work effectively) and diabetes (a lifelong condition that causes a person's blood sugar level to become too high) are chronic conditions that bring on many challenges for people, particularly when they have to manage both at the same time. Diabetes can accelerate the development of kidney disease and is the leading cause of kidney failure (a condition where the kidneys no longer function well enough to keep a person alive). While sticking to complex treatment plans can be challenging, successful self‐management in the early stages of kidney disease can improve outcomes later in life and delay the need for dialysis or a kidney transplant.
What are education programmes?
Education programmes are any set of planned activities designed to improve a person's ability to manage their condition and delay the progression of their kidney disease. These activities can aim to improve a person's knowledge of their disease, self‐care activities, and their ability to self‐monitor the disease, thus encouraging and motivating them to create healthy lifestyle changes, improve their treatment compliance, and improve quality of life.
What did we want to find out?
We wanted to find out whether an education programme designed for people with both kidney disease and diabetes helps them understand their condition and recognise the importance of strategies aimed at slowing its progression and preventing long‐term complications.
What did we do?
We searched for randomised studies (studies in which participants are assigned randomly to two or more treatment groups) that compared education programmes to usual care for people with both kidney disease and diabetes. We compared and summarised the results and rated our confidence in the evidence based on factors such as study methods and sizes.
What did we find?
We included eight studies involving 840 people 18 years or older with both kidney disease and diabetes. Four studies were undertaken in multiple centres, and four studies were performed in single centres. The duration of follow‐up ranged from 12 weeks to four years. Most of the education programmes were designed to increase a person's knowledge of their condition and improve self‐management behaviours. One study focused on reducing stress using mindfulness (a person's ability to be aware of where they are and what they are doing), and it was adapted to include practices for complex thoughts and feelings related to diabetes, and one study used a co‐ordinated medical care approach with multiple practitioners involved in a person's care.
Overall, education programmes probably lower blood glucose levels and may lower total cholesterol and blood pressure, but may make little or no difference to kidney function, abnormally low or high blood sugar, and cardiovascular disease (disorders of the heart and blood vessels).
For people with diabetes on dialysis (a procedure to remove waste products and excess fluid from the blood when the kidneys stop working properly), an education programme may improve their knowledge of diabetes, self‐management behaviour for checking their feet, using lotion, wearing appropriate shoes and socks, and coping with stress.
For people with moderately increased protein in the urine, there may be an improvement in their general knowledge of diabetes, their confidence in monitoring their blood sugar levels at home, their beliefs in their personal control, as well as behavioural changes to their diet. There may be no behavioural changes to exercise, foot care, or quitting smoking.
What are the limitations of the evidence?
We have low confidence in education programmes improving the understanding of diabetes in people with kidney disease. This is because the number of studies reporting outcomes of interest was low, and the education programmes varied, so we were unable to properly analyse the results.
How up‐to‐date is the evidence?
The evidence is current to July 2024.
Summary of findings
Summary of findings 1. Education programmes plus routine care versus routine care alone for people with chronic kidney disease and diabetes.
| Education programmes plus routine care versus routine care alone for people with CKD and diabetes | |||||
| Patient or population: people with CKD and diabetes Settings: multiple settings Intervention: education programmes plus routine care Comparator: routine care alone | |||||
| Outcomes | Illustrative comparative risks* (95% CI) | Relative effect 95% CI |
No. of participants (RCTs) |
Quality of the evidence (GRADE) | |
| Assumed risk | Corresponding risk | ||||
| Routine care alone | Education programmes plus routine care | ||||
| All‐cause death Follow‐up: 9 months |
41 per 1000 | 34 per 1000 (13 to 91) | 0.83 (0.31 to 2.19) | 424 (4) | ⊕ ⊕ ⊖ ⊖ LOW 1,2 |
| Serious hypoglycaemia Follow‐up: 18 months |
67 per 1000 | 5 per 1000 (0 to 90) | 0.08 (0.0 to 1.33) | 179 (1) | ⊕ ⊕ ⊖ ⊖ LOW 1,3 |
| HbA1c (%) Mean follow‐up: 13.5 months |
The mean HbA1c was 0.42% lower with education programmes plus routine care (0.53% lower to 0.31% lower) compared to routine care alone | ‐ | 467 (4) | ⊕ ⊕ ⊖ ⊖ MODERATE 1 | |
| Behaviour change: home blood glucose monitoring (SDSCA) (higher score better) Follow‐up: immediately post‐intervention | The mean change in home blood glucose monitoring score was 2.13 higher with education programmes plus routine care (1.18 higher to 3.08 higher) compared to routine care alone | ‐ | 100 (1) | ⊕ ⊕ ⊖ ⊖ LOW 1,3 | |
| Behaviour change: home blood glucose monitoring (SDSCA) (higher score better) Follow‐up: 3 months |
The mean change in home blood glucose monitoring score was 11.28 higher with education programmes plus routine care (1.92 higher to 20.64 higher) compared to routine care alone | ‐ | 79 (1) | ⊕ ⊖ ⊖ ⊖ VERY LOW 3,4 |
|
| Quality of life: PHQ stress score (lower score better) Follow‐up: 12 months |
The mean PHQ stress score was ‐1.70 lower with education programmes plus routine care (‐3.09 lower to ‐0.31 lower) compared to routine care alone | ‐ | 103 (1) | ⊕ ⊖ ⊖ ⊖ VERY LOW3,4 | |
| General knowledge of diabetes (ADDQoL) (higher score better) Follow‐up: 3 months |
The mean ADDQoL general knowledge score was 14.39 higher with education programmes plus routine care (7.45 higher to 21.33 higher) compared to routine care alone | ‐ | 97 (1) | ⊕ ⊕ ⊖ ⊖ LOW 1,3 | |
| Self‐efficacy at the end of education intervention (ADDQoL) (higher score better) Follow‐up: 5 weeks |
The mean ADDQoL self‐efficacy total score was 19.00 higher with education programmes plus routine care (12.58 higher to 25.42 higher) compared to routine care alone | ‐ | 97 (1) | ⊕ ⊕ ⊖ ⊖ LOW1,3 |
|
| *The basis for the assumed risk (e.g. the median control group risk across studies) is provided in footnotes. The corresponding risk (and its 95% CI) is based on the assumed risk in the comparison group and the relative effect of the intervention (and its 95% CI). ADDQoL: Audit of Diabetes Dependent Quality of Life; CI: Confidence interval; CKD: Chronic kidney disease; MD: Mean difference; PHQ: Patient Health Questionnaire; RR: Risk ratio; SDSCA: Summary of Diabetes Self‐Care Activities | |||||
| GRADE Working User Group grades of evidence High quality: Further research is very unlikely to change our confidence in the estimate of effect. Moderate quality: Further research is likely to have an important impact on our confidence in the estimate of effect and may change the estimate. Low quality: Further research is very likely to have an important impact on our confidence in the estimate of effect and is likely to change the estimate. Very low quality: We are very uncertain about the estimate. | |||||
1 Due to serious risk of bias
2 Due to serious imprecision (due to low events)
3 Due to serious imprecision
4 Due to very serious risk of bias
Background
Description of the condition
Chronic kidney disease (CKD) is a global health problem affecting 5% to 10% of the global population, contributing to over 1.1 million deaths worldwide in 2015 (GBD 2015; KDIGO 2009). Diabetes mellitus (DM) can accelerate CKD development, and it is recognised as the leading cause of kidney failure and results in a poorer prognosis for patients (AIHW 2024; Chantrel 1999; Kasper 2005; KDOQI 2007; KDOQI 2012; KHA 2010; Narres 2016; Shen 2016; Toto 2002; USRDS 1998; USRDS 2005; USRDS 2009). Diabetic kidney disease (DKD) is a progressive disease revealed by clinical assessment, including measurement of albuminuria, reduced glomerular filtration rate (GFR), or both. Patients ordinarily have the presence of severely elevated albuminuria > 300 mg/24 hours (or > 200 μg/min) or a urinary albumin‐creatinine ratio (UACR) > 300 mg/g (confirmed in at least two of three samples), as well as diabetic retinopathy and the absence of signs of other forms of kidney disease. Patients will usually have raised blood pressure (BP) and more significant cardiovascular morbidity and death (De Boer 2011; Persson 2018). More than 90% of people with DM have type 2 diabetes (T2DM), and the annual growth rate of DM‐related CKD is expected to grow dramatically due to an increase in people with T2DM. In 2020, within a primary care setting, the estimated prevalence of CKD stages 3 to 5 (eGFR < 60 mL/min/1.73 m2) in T2DM patients was estimated at 24.4% (95% confidence interval (CI) 21.9 to 27.0) (Jitraknatee 2020).
The clinical manifestations of DKD have changed over recent years, and the definition of DKD has expanded. Typically, the first clinical signs of DKD were an increase in urine albumin excretion, worsening to albuminuria, followed by a loss of GFR. In comparison, it is now not uncommon to see patients who have a steady decline in GFR without albuminuria (approximately 6% of DKD patients); this is possibly due to advancement in early detection and treatment (Afkarian 2016; Foley 2009; Gheith 2016; Selvin 2007; White 2014). Alarmingly, approximately 20% to 50% of T2DM patients and nearly half of patients with type 1 DM (T1DM) develop DKD throughout their lifetime, and National Health and Nutrition Examination Survey (NHANES) data found approximately 8.2 million adults with DM (95% CI 6.5 to 9.9 million adults) had albuminuria, reduced eGFR, or both from 2009 to 2014 (Afkarian 2016; Gheith 2016; Ritz 1999).
Recent evidence suggests that the overall prevalence of DKD has not significantly changed over time from 28.4% (95% CI 23.8% to 32.9%) between 1988 and 1994 to 26.2% (95% CI 22.6% to 29.9%) between 2009 and 2014 (prevalence ratio, 0.95, 95% CI 0.86 to 1.06; adjusting for age, sex, and race/ethnicity; P = 0.39 for trend). However, the population of existing patients whose kidney failure was caused by DM (tripled from 1990 to 2000) is expected to grow 10‐fold by 2030, to 1.3 million (Collins 2005). This significant burden will further stress already struggling healthcare systems worldwide (Aziz 2018). In the USA, DKD accounts for 50% of kidney failure, up from 18% in 1980 (De Boer 2011; KDOQI 2007). It is estimated that 10% of deaths in T2DM patients are attributable to kidney failure (van Dieren 2010). DM and CKD are common and are synergistically associated with premature death in the general population (Middleton 2006; Narres 2016; Shen 2016). The survival of patients with DKD decreases once kidney failure occurs and is estimated as low as 40% in five years (Shen 2016). Furthermore, data from studies conducted in the USA show a high economic burden associated; the medicare costs spent on the kidney failure programme were about 26.8 billion US dollars in 2008 (De Boer 2011; USRDS 2000; USRDS 2001).
Description of the intervention
People who are well‐equipped to self‐manage their condition are likely to be more empowered to make better health‐related decisions (Anekwe 2018; Chen 2016; Slama‐Chaudhry 2019). Education interventions can potentially reduce the economic burden and demand for health service provision (Chen 2016). These factors justify the intensive efforts needed to prevent CKD and DM progression through education to improve self‐management. The success of strategies to promote glycaemic control and minimise the progression of DKD depends on patients' ability and willingness to change and subsequently maintain appropriate lifestyle behaviours regarding diet, physical activity, adjusting to psychological and social demands, managing complex medication regimens, self‐monitoring, and engaging in effective interactions with health care providers and medical follow‐up visits (Anekwe 2018; Captieux 2018; Slama‐Chaudhry 2019). Adherence to complex regimens remains challenging, and a multifactorial treatment approach that includes patient education can support self‐management for people with both CKD and diabetes (Persson 2018). For this review's purpose, education programmes are defined as any set of planned educational activities designed to improve the person's ability to manage and delay the progression of their CKD.
How the intervention might work
Behaviour can be modified in many ways to minimise disease burden across all stages of DM and CKD. A well‐designed education programme is a vital resource to support behaviour change and may provide advice to help people make more informed health choices and adhere to recommended medical regimes (Aziz 2018; Kim 2019). Education interventions may improve knowledge of their disease and empower and motivate them to create healthy preventative strategies that ultimately slow the progression of CKD and DM.
Other education interventions might be more hands‐on, involving training for self‐care activities or disease self‐monitoring. This may include the patient's caregivers or a multidisciplinary care team (Baig 2015; Shi 2016). For some people, having more responsibility for day‐to‐day disease management makes them feel more in control of their condition. It may improve their quality of life (QoL), emotional well‐being, and other DM and CKD outcomes (Windrum 2016). Similar interventions might be more directed at improving medication adherence. Patients with a good grasp of their condition have better compliance and satisfaction with their medical regimen and fewer missed appointments (Kaplan‐Lewis 2013).
The efficacy of educational programmes for those with DM has been studied comprehensively for several decades (ADA 2001; Boulton 1998; Calman 1994; Captieux 2018; Duke 2009; Hawthorne 2008; KDOQI 2007; Norris 2002; Pecoraro 1990). Several meta‐analyses and systematic reviews of education interventions have demonstrated that they are effective in producing positive patient outcomes in terms of glycaemic control, weight management, adherence to medications, and improvement of psychological well‐being and QoL in diverse socio‐economic and ethnic communities (Brown 1990; Captieux 2018; Dorresteijn 2014; Ellis 2004; Gary 2003; Norris 2002; Steed 2003). Similar findings have been found in systematic reviews in the general CKD population, with the addition of improvement in knowledge, self‐efficacy, lifestyle modification (exercise and diet), death, dialysis therapy initiation, and important clinical outcomes (serum albumin, proteinuria, and haemoglobin) (Lopez‐Vargas 2016; Persson 2018).
Overall, DM is primarily a self‐managed disease, and in turn, so is having both CKD and DM, particularly in the early stages of CKD progression (Windrum 2016). Given the complex nature of managing both CKD and DM concurrently, it is likely that interventions will need to be tailored to each patient's circumstances to meet the needs of patients with diverse ethnic, cultural, literacy, and geographical backgrounds, particularly when other co‐morbidities are taken into account. Other essential factors that must be considered include ethnic, cultural, literacy, cognitive, and geographical factors, as recognised in recent guidelines (KDIGO 2022). In many cases, patients will work together with several healthcare professionals, and the overall care plan for the patient is usually dynamic. The healthcare professionals may include a general practitioner, nephrologist, diabetes specialist, health care navigator, nurse‐educator, dietician, psychologist, podiatrist, family member or caregiver, and social worker. The type of education conveyed may also influence how effective the intervention is. Evidence from the DM population has suggested that having “patient‐centred education”, where self‐management plans are developed and maintained through a collaboration between patients and their health care providers, is more effective at improving glycaemic control, changing behaviours, and maintaining compliance compared to when the patient has little involvement (Windrum 2016). Background knowledge of both CKD and DM helps patients understand their disease and recognise the importance of strategies aimed at secondary and tertiary prevention of DKD, hyperglycaemia and hypertension.
Why it is important to do this review
Evidence suggests that educational programmes aimed at lifestyle modification might be effective in slowing down the progression of coexisting CKD and DM. Early intervention and advice to patients about regular screening and medical adherence are important to stop DM and CKD from accelerating and leading to kidney failure. There is the potential to reduce the risk of death and other clinical outcomes and improve the QoL. Whether the existing evidence is scientifically rigorous and can support recommendations for the routine use of educational programmes in coexisting CKD and DM is still unknown.
Objectives
To evaluate the benefits and harms of education programmes for people with both CKD and DM.
Methods
Criteria for considering studies for this review
Types of studies
All randomised controlled trials (RCTs) and quasi‐RCTs (in which allocation to treatment was obtained by alternation, use of alternate medical records, date of birth or other predictable methods) looking at the benefits and harms of educational programmes for people with both CKD and DM were included. In randomised cross‐over studies, only the first period before cross‐over was included.
Types of participants
Inclusion criteria
People aged 18 years or over with both CKD and T1DM or T2DM, or DKD were included.
Definition of CKD
Participants with CKD stages G1 to G5 (people with G1 required moderately (A2) to severely (A3) increased albuminuria, including kidney replacement therapy (KRT) or transplant) as outlined in KDIGO 2022a.
Definition of DM
According to WHO criteria (WHO 1999), fasting plasma glucose ≥ 7.0 mmol/L and two‐hour plasma glucose ≥ 11.1 mmol/L.
Definition of DKD
DKD is defined by albuminuria (urinary albumin excretion (UAE) ≥ 3.4 mg/mmol (30 mg/g)) and progressive reduction in estimated (e)GFR in the setting of a long duration of diabetes (> 10 years' duration of T1DM diabetes; may be present at diagnosis in T2DM) and is typically associated with retinopathy.
Exclusion criteria
People with kidney damage due to DM other than T1DM or T2DM, such as gestational diabetes, were excluded.
Types of interventions
Any educational programme (or programmes that include education) used for people with both CKD and DM to prevent the progression of CKD, improve diabetic control, and improve QoL.
Educational programmes have to comprise information and behavioural instructions and advice given by a healthcare provider, who could be a nurse, pharmacist, educator, health professional, medical practitioner, or healthcare provider, through verbal, written, audio‐recording, or computer‐aided modalities.
The educational intervention could occur in the emergency department, hospital, the person's home, or in the community.
Interventions that included pharmacological therapies in the intervention arm alone were excluded. Standard care across both arms, including pharmacological interventions, was included.
The mode of delivery and reach of the intervention depended on the aim of the intervention, but all types were included in this review. Examples of delivery modes may include but were not limited to, face‐to‐face, over the phone, group sessions, computer, DVD, mobile application, or a mix.
Interventions that compare technology, such as medical device aids, were excluded.
Types of outcome measures
The time intervals at which outcome assessment takes place may affect the outcomes of educational programmes. If the data were available, we considered six months, one, and two years as standard time intervals.
Primary outcomes
Death: (including all causes of death; DKD‐related death (total and specific death rates from causes attributable to DKD); cardiovascular‐related death)
Glycated haemoglobin (HbA1c); attaining a HbA1c target
Kidney failure
Patient‐oriented measures of knowledge, self‐management, and behavioural changes: attitude scales; knowledge of DKD/DM; patient empowerment and self‐efficacy; patient behavioural changes (including smoking cessation, increased exercise, diet modification, and adherence to medications); any other self‐management measures.
Secondary outcomes
Kidney function measures during follow‐up: creatinine clearance, eGFR, serum creatinine (SCr), doubling SCr, proteinuria, and albuminuria
BP (changes in or mean): total, systolic (SBP), and diastolic (DBP)
Glycaemic events: hypoglycaemia, severe hypoglycaemia (measured as having low blood glucose levels that require assistance from another person to treat)
Cardiovascular (CV) morbidity (non‐fatal): total CV disease events (stroke, myocardial infarction (MI), heart failure, any other reported CV events); the incidence of peripheral heart disease
Measures of QoL (any scale); health‐related QoL (any scale)
Lipids: total cholesterol; low‐density lipoprotein (LDL); high‐density lipoprotein (HDL); triglycerides
Adverse events: any adverse events related to the educational programmes (e.g. deteriorating QoL or biomedical parameters).
Search methods for identification of studies
Electronic searches
We searched the Cochrane Kidney and Transplant Register of Studies up to 19 July 2024 through contact with the Information Specialist using search terms relevant to this review. The Register contains studies identified from the following sources:
Monthly searches the Cochrane Central Register of Controlled Trials (CENTRAL)
Weekly searches of MEDLINE OVID SP
Hand searching of kidney‐related journals and the proceedings of major kidney conferences
Searching the current year of EMBASE OVID SP
Weekly current awareness alerts for selected kidney and transplant journals
Searches of the International Clinical Trials Registry Platform (ICTRP) Search Portal and ClinicalTrials.gov.
Studies in the Register are identified through searches of CENTRAL, MEDLINE, and EMBASE based on Cochrane Kidney and Transplant's scope. Details of search strategies and a list of hand‐searched journals, conference proceedings and current awareness alerts are available in the Specialised Register section of information about Cochrane Kidney and Transplant.
See Appendix 1 for search terms used in strategies for this review.
Searching other resources
The previous version of the review (Li 2011) searched the following databases and resources for the initial review. Please note the databases listed below were not searched for this 2024 update.
Four Chinese medicine databases: CBM‐disc (1979 to December 2009), Chinese Science and Technique Journals Database (VIP) (until December 2009), China National Infrastructure (CNKI) (until December 2009) and the WanFang database (until December 2009)
Education Resources Information Centre (ERIC) (www.eric.ed.gov) (July 2010)
Campbell Collaboration's Social, Psychological, Educational and Criminological Trials Register (geb9101.gse.upenn.edu)
European Medicines Agency (EMEA) (www.emea.europa.eu/index/indexh1.htm) (July 2010).
The previous version of the review (Li 2011) and the 2024 update also sought information from the following.
Reference lists of review articles, relevant studies and clinical practice guidelines
Letters seeking information about unpublished or incomplete studies were sent to investigators known to be involved in previous studies.
Data collection and analysis
Selection of studies
The search strategy described was performed to identify eligible studies. Two authors (BC, TC) independently determined each study's eligibility, identified by the search, by reading the title, abstract, and, if necessary, the full text. Disagreements were resolved in consultation with a third author (DT). Studies and reviews that might include relevant data or information on studies were retained initially. The review authors then independently eliminated studies that did not satisfy the inclusion criteria and obtained full copies of the remaining studies.
Two review authors (BC, TC) independently read these reports to select relevant studies. We included studies regardless of whether measured outcome data were reported in a 'usable' way.
Where duplication reports of the same study were confirmed, the initial first complete publication (index publication) was selected. It was the primary data source, but additional prior or subsequent reports were also included. These other prior or subsequent reports containing supplementary outcome data (e.g. longer‐term follow‐up or different outcomes) also contributed to the meta‐analysis.
Data extraction and management
Two authors (BC, TC) independently extracted data using a standard form and checked for agreement before entry into Review Manager. Unclear data were clarified by contacting the author of the study report, and any relevant data obtained in this manner were included in the review.
We included information about the type of education intervention, the number of participants treated, the study design (standard of care or active control), the study duration and follow‐up, important kidney function, diabetic, cardiovascular, and QoL outcome measures and results, withdrawals, and adverse events.
We collected the studies' characteristics in sufficient detail to complete the table of the included studies' characteristics. In the event of disagreement, a third review author adjudicated (DT).
Assessment of risk of bias in included studies
The following items were assessed independently by two authors (BC, TC) using the risk of bias assessment tool (Higgins 2022) (seeAppendix 2).
Was there adequate sequence generation (selection bias)?
Was allocation adequately concealed (selection bias)?
-
Was knowledge of the allocated interventions adequately prevented during the study?
Participants and personnel (performance bias)
Outcome assessors (detection bias)
Was incomplete outcome data adequately addressed (attrition bias)?
Are reports of the study free of suggestion of selective outcome reporting (reporting bias)?
Measures of treatment effect
For dichotomous outcomes (e.g. incidence of all‐cause death, DKD‐related death, CV disease‐related death, incidence of kidney death during follow‐up, kidney failure, CV disease events, self‐management, behavioural change, adverse events), results were expressed as risk ratios (RR) with a 95% CI.
Where continuous scales of measurement were used to assess the effects of educational programmes (e.g. eGFR, SCr, albuminuria, UACR, proteinuria, BP, lipids, blood glucose, QoL, behaviour change), the mean difference (MD) was used, or the standardised mean difference (SMD) if different scales were used with 95% CI.
Unit of analysis issues
If non‐standard designs were found, such as cluster RCTs and cross‐over studies, then the analysis would have been conducted following the guidelines in the Cochrane Handbook to avoid unit‐of‐analysis errors (Higgins 2022).
Dealing with missing data
Any further information required from the original author was requested by correspondence, and any relevant information obtained in this manner was included in the review. Where a study reported outcome data after excluding some randomised participants from the denominator, further information required from the original author was requested by email, and any relevant information obtained in this manner was included in the review. Evaluation of important numerical data such as screened, randomised patients, as well as intention‐to‐treat (ITT), as‐treated and per‐protocol population, were carefully performed. Attrition rates, for example, drop‐outs, losses to follow‐up and withdrawals were investigated. Issues of missing data and imputation methods (e.g. the last observation carried forward) were critically appraised (Higgins 2022). We used a modified ITT analysis where the ITT population consisted of participants who were randomised, received at least one dose of the assigned study treatment and provided at least one post‐baseline assessment. We assigned missing participants zero improvements wherever possible.
Assessment of heterogeneity
We first assessed for statistical heterogeneity visually by inspecting forest plots of standardised mean effect sizes and risk ratios. Furthermore, we applied a Chi2 test to assess heterogeneity. With P < 0.10 used to denote statistical significance and with I2 calculated to measure the proportion of total variation in the estimates of treatment effect due to heterogeneity beyond chance (Higgins 2022), we used conventions of interpretation that were defined by Higgins 2003. However, the limited amount of study data published did not enable meaningful interpretation. We had also planned to conduct subgroup analysis and meta‐regression to evaluate potential sources of heterogeneity, but this was not possible because of the small number of studies of paired interventions.
Assessment of reporting biases
If sufficient RCTs were identified, an attempt was made to examine for publication bias using a funnel plot (Higgins 2022). We planned to assess publication bias using a method designed to detect the amount of unpublished data with a null effect required to make any result clinically irrelevant (usually taken to mean a number needed to treat (NNT) of 10 or higher) (Higgins 2022). Insufficient studies were identified to assess publication bias.
Data synthesis
Data were abstracted from individual studies and then pooled using random‐effects meta‐analysis. The random‐effects model was chosen because it provides a more conservative estimate of effect in the presence of known or unknown potential heterogeneity (Deeks 2001). The statistical method used was Mantel‐Henzel meta‐analysis for dichotomous data and generic inverse variance meta‐analysis for continuous data.
Subgroup analysis and investigation of heterogeneity
Subgroup analysis was to be used to explore possible sources of heterogeneity (e.g. participants, interventions and study quality). Heterogeneity amongst participants could be related to age, type of diabetes, and CKD (e.g. pre‐dialysis patients, patients on dialysis, and transplant patients). Heterogeneity in educational programme interventions could be related to educational content (e.g. BP programmes, diabetes programmes, weight control programmes), the healthcare providers, mode, and administration duration. Adverse effects were to be tabulated and assessed with descriptive techniques as they were likely different for the various educational programmes used. The risk difference (RD) with 95% CI was to be calculated for each adverse effect, compared with no administration of education programmes. There were insufficient studies identified to undertake subgroup analysis.
Sensitivity analysis
The following sensitivity analyses were considered.
Repeating the analysis, excluding unpublished studies
Repeating the analysis, taking account of the risk of bias, as specified
Repeating the analysis, excluding any very long or large studies to establish how much they dominate the results
Repeating the analysis excluding studies using the following filters: language of publication, source of funding (industry versus other), and country the study was conducted in.
However, insufficient data were available to determine the influence of the effect size.
Summary of findings and assessment of the certainty of the evidence
We have presented the main results of the review in the summary of findings tables. These tables present key information concerning the quality of the evidence, the magnitude of the effects of the interventions examined, and the sum of the available data for the main outcomes (Schünemann 2022a). The summary of findings tables also include an overall grading of the evidence related to each of the main outcomes using the Grades of Recommendation, Assessment, Development and Evaluation (GRADE) approach (GRADE 2008; GRADE 2011). The GRADE approach defines the certainty of the evidence as to the extent to which one can be confident that an estimate of effect or association is close to the true quantity of specific interest. The quality of a body of evidence involves considering the within‐trial risk of bias (methodological quality), the directness of evidence, heterogeneity, the precision of effect estimates, and publication bias (Schünemann 2022b).
In the summary of findings table for the comparison of an education programme plus routine care versus routine care, we presented the following outcomes.
Death (all causes)
Glycaemic events: serious hypoglycaemia
HbA1c (%)
Behaviour change at the end of treatment (five weeks): home blood glucose monitoring (HBGM)
Behaviour change at three months follow‐up: home blood glucose monitoring
QoL: Patient Health Questionnaire (PHQ) stress score
Self‐efficacy at the end of education intervention
General knowledge of diabetes at the end of education intervention
No summary of findings tables were presented for other comparisons due to insufficient data.
Results
Description of studies
The following section contains broad descriptions of the studies considered in this review. For further details on each individual study, please see Characteristics of excluded studies; Characteristics of included studies; Characteristics of ongoing studies; Characteristics of studies awaiting classification.
Results of the search
For this update, we searched the Cochrane Kidney and Transplant Register of Studies (up to 19 July 2024) and identified 177 reports. Five new studies (nine reports) were included, 37 studies (55 reports) were excluded, and one ongoing study (one report) was identified. One new study is awaiting classification (recently completed; no data available). We also identified 110 new reports of existing excluded studies.
We reassessed and reclassified one excluded study as an included study (Fogelfeld 2017), and one ongoing study has now been completed and moved to Studies awaiting classification as no data have been published (NCT00782847). Finally, eight excluded studies have been deleted (not randomised, wrong population or intervention).
Eight studies were included (13 reports, 840 randomised participants), 59 were excluded, two are awaiting classification, and one study is ongoing (Figure 1).
1.
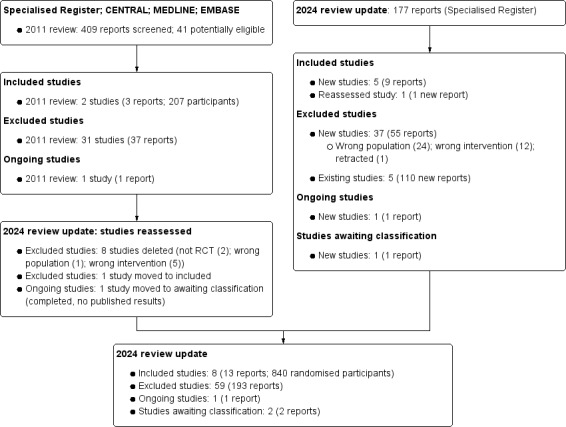
Flow chart showing study selection
Included studies
Eight studies were included (13 reports, 840 randomised participants) (C‐DIRECT 2019; Fogelfeld 2017; Guo 2022; Kopf 2012; McMurray 2002; MEMO 2011; MESMI 2010; Steed 2005).
See Characteristics of included studies.
All studies enrolled adults. C‐DIRECT 2019 reported participants older than 21 years, Fogelfeld 2017 included participants between 18 and 70 years, Kopf 2012 included participants between 30 and 70 years, MESMI 2010 included participants > 18 years, and Steed 2005 included adults < 70 years of age. Guo 2022, McMurray 2002, and MEMO 2011 did not report the age range.
C‐DIRECT 2019, McMurray 2002, MEMO 2011 and Steed 2005 were multicentre studies, while the remaining were single‐centre studies.
There was some variation between the type of DM, albuminuria and CKD stage included in the studies. All studies included T2DM participants, while McMurray 2002 and MESMI 2010 also included participants with T1DM. MEMO 2011 included participants with moderately increased albuminuria or overt proteinuria with a SCr < 180 µmol/L. Fogelfeld 2017 included participants with a documented advanced diabetic nephropathy defined as impaired kidney function (eGFR calculated by the Modified Diet in Renal Disease (MDRD) equation) corresponding to CKD stages 3 to 4 (moderate‐severe, i.e. eGFR > 15 and < 60 mL/min) and presence of proteinuria or albuminuria as follows:
The current presence of severely increased albuminuria (A3)
The current presence of moderately increased albuminuria (A2) and documentation of previous severely increased albuminuria (A3)
The current presence of moderately increased albuminuria (A2) and documentation of diabetic retinopathy or laser therapy
If only moderately increased albuminuria (A2) and A, B, or C criteria are not fulfilled, then renal ultrasound should be done to demonstrate normal‐sized kidneys.
Participants from Kopf 2012 had albuminuria (> 20 mg/L in two separate spot urines) and a documented history of moderate albuminuria (A2) in at least two separate urine samples (UAE > 30 mg/24 hours or > 20 mg/L). In addition to having DM, McMurray 2002 included participants with kidney failure who required KRT with either haemodialysis (HD) or peritoneal dialysis (PD) for more than 30 months. Steed 2005 included participants with moderately increased albuminuria (A2) (indicated by two or more UACR > 3.0 mg/mmol or 24 hours UAE > 30 mg/24 h) and stage 3 DKD. MESMI 2010 included participants with an eGFR > 15 and < 60 mL/min/ 1.73 m2 or DKD (moderately increased UACR > 2.0 mg/mmol for men, > 3.5 mg/mmol for women) and systolic hypertension >130 mm Hg treated with prescribed antihypertensive medication. Finally, Guo 2022 included DKD participants who met the diagnostic criteria of DKD in the uraemic phase.
Interventions and comparisons
C‐DIRECT 2019, MESMI 2010, MEMO 2011, Fogelfeld 2017 and Guo 2022 were described in the text as multifactorial interventions focusing on improving self‐management. In addition to being multifactorial, Fogelfeld 2017 and Guo 2022 used a co‐ordinated medical care approach. Multiple practitioners from various disciplines were present at the participants' appointments and shared the decision‐making for their treatments. For this reason, this comparison was analysed separately. The Fogelfeld 2017 and Guo 2022 comparison was "Multidisciplinary, multifactorial education programmes versus routine care". The C‐DIRECT 2019 intervention delivered education sessions at the bedside while participants underwent HD and were delivered by nurses, typically taking 30 to 60 minutes. The intervention was modelled on the (HED‐SMART) renal programme (Griva 2018). However, its context and delivery were tailored to the needs and context of co‐existing DM and kidney failure, as identified in a previous mixed methods study (Griva 2011; Griva 2015).
In MESMI 2010, the participants received standard care offered to participants with both CKD and DM attending diabetes and nephrology outpatient clinics at the hospital. BP control was the most important aspect of routine care, and treatment was provided depending on the patient’s circumstances and morbidity. Data were collected from the control group at the same time as the intervention group. The multifactorial intervention consisted of the following:
Self‐monitoring of BP, individualised medication review, 20‐minute DVD, and fortnightly motivational interviewing follow‐up telephone contact for 12 weeks (to support BP control and optimal medication self‐management).
Delivered by an intervention nurse with a kidney specialist and doctoral qualifications and trained in motivational interviewing using a checklist and standing script for fidelity purposes.
Participants in the intervention group were taught how to take their BP, which involved sitting every morning after breakfast and taking their medications using their non‐dominant arm with an A&D Medical Pty. Ltd. A digital BP monitor (Model UA‐787, Saitama, Japan), which was supplied for the study.
Participants recorded their daily BP for approximately three months in a specific booklet issued for this purpose. The individualised medication review involved the intervention nurse drawing up a chart of the participant’s prescribed medications, including the drug's generic name, what the medication was for, the dose and when to take it, and targets for which to aim.
The 20‐minute DVD involved an interactive, psychosocial approach to motivating people to take medication, appealing to knowledge, thoughts and feelings underpinned by the modified Health Belief Model.
In MEMO 2011, both treatment groups received a similar routine of care by their own clinician according to local guidelines, consistent with the National Institute of Clinical Excellence (NICE) guidance on managing individuals with T2DM and DKD. It also provides additional information on managing individuals with T2DM of South Asian ethnicity. Participants in the control group were not seen or treated by the study physician or team and had usual access to education provided as part of standard diabetes care in either primary or secondary care. Like MESMI 2010, the intervention focused on self‐monitoring and followed up on goal setting for medical adherence and lifestyle changes during individual three‐month visits. The participants discussed and recorded lifestyle changes and medication adherence in record books, including general information on DM. It is unclear how or if these differed between the groups.
Kopf 2012 was the only mindfulness‐based stress reduction education intervention study. It was adapted to include practices for complex thoughts and feelings related to DM. It consisted of an eight‐week programme based on body and meditation practices to increase openness, awareness and acceptance of all internal and external experiences. A psychologist and a resident in internal medicine led this.
McMurray 2002 and Steed 2005 also focused on improving self‐management through education, diabetes care monitoring, and management, and both were led face‐to‐face by a diabetes specialist and dietician. To guarantee standardised medical treatment as usual according to diabetes guidelines in both arms, all participants were seen regularly by a physician in the outpatient clinic.
The routine treatment group for McMurray 2002 included diet control, glycaemic control (e.g. insulin injection), antihypertensive drugs, and HD or PD therapy. The diabetes care manager provided the education and care management programme for the participants in the treatment group, which lasted for 12 months.
In Steed 2005, the routine treatment group received no additional education or attention other than completing assessments and receiving 'routine treatment' (not reported in detail).
Excluded studies
Fifty‐nine studies were excluded. The reasons for exclusion were:
Wrong population (42 studies)
Wrong intervention (16 studies)
Study retracted (one study).
Ongoing studies
One ongoing study (NCT03413215) plans to compare additional counselling and education by a diabetes nurse educator and medical social worker over 12 months with standard care.
Studies awaiting classification
Two studies (NCT00782847; Suvamat 2023) have been completed and are awaiting classification, as there are currently no published results.
NCT00782847 compared the DiaNE consultation and support programme given over four weeks with standard care.
Suvamat 2023 compared face‐to‐face group activities with motivational interviews with usual care.
Risk of bias in included studies
Figure 2 summarises the risks of bias for the studies overall, and Figure 3 reports the risks of bias in each individual study.
2.
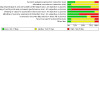
Risk of bias graph: review authors' judgements about each risk of bias item presented as percentages across all included studies.
3.

Risk of bias summary: review authors' judgements about each risk of bias item for each included study.
Allocation
Random sequence generation
One study was judged to be a high risk of bias for random sequence generation (McMurray 2002) due to an inadequate randomisation method. The HD participants were randomised to the treatment or control groups according to the date of undergoing HD therapy (patients who underwent HD on Monday, Wednesday and Friday were assigned to the study group; Tuesday, Thursday and Saturday patients were assigned to the control group). Insufficient detail was reported for PD patients, and patients were deemed "numerically randomised". No details of the randomisation sequence were provided.
Five studies were judged to have an unclear risk of bias. The studies were described as RCTs and reports randomly assigning participants to one of two groups. However, the methods used to carry out the randomisation process were not described sufficiently (McMurray 2002; Fogelfeld 2017; Guo 2022; MEMO 2011; Steed 2005).
Two studies were judged to have a low risk of bias and provided sufficient details on how the randomisation process was carried out. These included a random assignment to one of the two groups (1:1 ratio) and stratified block randomisation (Kopf 2012; MESMI 2010).
Allocation concealment
Seven studies were judged to have an unclear risk of bias for allocation concealment. Methods used to ensure the allocation of treatment groups were concealed and were not mentioned in six studies (C‐DIRECT 2019; Fogelfeld 2017; Guo 2022; Kopf 2012; McMurray 2002; MEMO 2011). One study provided insufficient information about allocation concealment (Steed 2005).
One study was judged to have a low risk of bias by providing sufficient details on how the allocation of treatment groups was concealed. Following recruitment, participants were allocated code numbers before enrolment and randomised to the intervention or control group (1:1 ratio) by an off‐site statistician. The people collecting data and assessing outcomes were blinded to group assignment. The identity of all enrolled and randomised participants to receive the intervention was kept in a locked cabinet in the chief researcher’s office (MESMI 2010).
Blinding
Performance bias
The blinding of participants and personnel was assessed separately based on whether the outcomes were subjective or objective. Objective outcomes are unlikely to be influenced by the blinding of participants and personnel compared to subjective outcomes.
For objective outcomes, six studies were judged to have a low risk of bias for blinding participants and personnel (Fogelfeld 2017; Kopf 2012; MEMO 2011; MESMI 2010; Steed 2005; McMurray 2002), and two judged unclear (C‐DIRECT 2019; Guo 2022).
For subjective outcomes, all but one study (McMurray 2002) were judged to be at high risk of bias for blinding of participants and personnel (C‐DIRECT 2019; Fogelfeld 2017; Guo 2022; Kopf 2012; Steed 2005; MEMO 2011; MESMI 2010). McMurray 2002 judged a low risk of bias, as cross‐over of participants and study personnel was maintained throughout the study.
Detection bias
The blinding of outcome assessors was assessed separately based on whether the outcomes were subjective or objective. Compared to subjective outcomes, the blinding of outcome assessors is unlikely to influence some objective outcomes.
For objective outcomes, seven studies were judged to have a low risk of bias detection bias for blinding outcome assessors (C‐DIRECT 2019; Kopf 2012; Fogelfeld 2017; MEMO 2011; MESMI 2010; Steed 2005; McMurray 2002). Guo 2022 was judged to have an unclear risk of detection bias.
For subjective outcomes, five studies were judged to have a high risk of bias for blinding outcome assessors (Fogelfeld 2017; Guo 2022; Kopf 2012; McMurray 2002; Steed 2005). C‐DIRECT 2019, MEMO 2011 and MESMI 2010 were judged to have a low risk of bias.
Incomplete outcome data
Two studies were judged to have a high risk for attrition bias (Kopf 2012; Steed 2005). There was low to moderate loss‐to‐follow‐up at 12 months. Loss to follow‐up was 2% in the intervention group and 11% in the control group. No reasons were provided for loss‐to‐follow‐up (Kopf 2012). Kopf 2012 also had a higher proportion of patients in the intervention group with a history of myocardial infarction compared to the control group at baseline (22.0% versus 4.26%). The attrition rate for Steed 2005 was high (28%); however, they reported the individuals who did and did not complete follow‐up assessments did not differ significantly at baseline. The self‐management programme's efficacy reported that drop‐outs had significantly higher baseline HbA1c than people who completed the education programme.
Fogelfeld 2017 had an unclear risk of bias for incomplete data. Each group had low to moderate attrition rates: the multifactorial education intervention group (23%) and the usual care control group (12%).
Five studies were judged to have a low risk of bias for incomplete data (C‐DIRECT 2019; Guo 2022; McMurray 2002; MEMO 2011; MESMI 2010). McMurray 2002 had no loss to follow‐up. MEMO 2011 and Guo 2022 accounted for all participants from the start to the end of the studies. The attrition rate was low (< 10% in each treatment arm). MESMI 2010 accounted for all participants from the start to the end of the study. Overall, the attrition rates of both arms were low: education (7.7%) and usual care (4.8%). Not all participants had their blood test results included for eGFR and SCr because tests conducted in primary care were not always recorded in the participant’s hospital medical history. According to the Cochrane Handbook for Systematic Reviews of Interventions, we recalculated ITT using 'Case Available Analysis' (dichotomous data) or 'Last Observation Carried Forward' (continuous data) (Higgins 2022).
Selective reporting
Six studies were judged to have an unclear risk of bias for selective reporting (Fogelfeld 2017; Guo 2022; Kopf 2012; McMurray 2002; MESMI 2010; Steed 2005). Kopf 2012 had some results missing for outcomes recorded at baseline (anxiety and eating disorder components of the PHQ). All planned outcomes (as reported in the methods section) were reported in the results for all eight studies. However, no trial registration or a priori‐published protocols were available. McMurray 2002 had some clinically important outcomes missing, such as the incidence of CV disease.
One study was judged to have a low risk of bias. All outcomes planned in the trial registration and a priori‐published protocol were reported methods for MESMI 2010.
C‐DIRECT 2019 had a high risk of bias because some outcomes in the protocol were not reported in the study publication.
Other potential sources of bias
Fogelfeld 2017 was judged to be at high risk of bias. Conflicts of interest or disclosures were not reported, the study received pharmaceutical funding from Sanofi, and the management of this potential conflict was not made explicit.
C‐DIRECT 2019 had a low risk of bias.
The risk of bias for the remaining six studies was judged to be unclear (Guo 2022; Kopf 2012; MEMO 2011; MESMI 2010; McMurray 2002; Steed 2005).
Effects of interventions
See: Table 1
Education programmes plus routine care versus routine care alone
Death
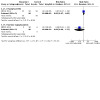
All‐cause death
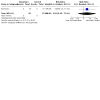
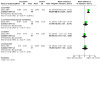
Education programmes plus routine care compared to routine care alone may make little or no difference to all‐cause death at a mean of nine months follow‐up (Analysis 1.1.1 (4 studies, 424 participants): RR 0.83 95% CI 0.31 to 2.19; I2 = 0%; low certainty evidence) (C‐DIRECT 2019; Kopf 2012; MEMO 2011; MESMI 2010).
1.1. Analysis.
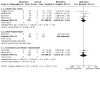
Comparison 1: Educational programmes plus routine care versus routine care alone, Outcome 1: Death
McMurray 2002 (83 participants) reported that the all‐cause death was not different at 12 months, but the specific number of events was not reported. We attempted to contact the authors for details but received no response.
DKD‐related death (total and specific death rates from causes attributable to DKD)
Kopf 2012 (110 participants) reported zero DKD‐related deaths in the intervention and routine care group at 12 months follow‐up (Analysis 1.1.2)
CV disease‐related death
We are uncertain if the education programmes made any difference to CV disease‐related death at a mean of 12 months follow‐up due to very low certainty evidence (Analysis 1.1.3 (2 studies, 289 participants): RR 0.85, 95% CI 0.26 to 2.73; I2 = 0%) (Kopf 2012; MEMO 2011).
HbA1c
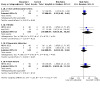
HbA1c (%)
C‐DIRECT 2019, Kopf 2012, MEMO 2011, MESMI 2010 and Steed 2005 reported HbA1c (%).
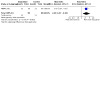
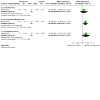
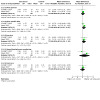
Education programmes, compared to routine care alone, probably decrease HbA1c (%) at a mean of 13.5 months follow‐up (Analysis 1.2 (4 studies, 467 participants): MD ‐0.42%, 95% CI ‐0.53 to ‐0.31; I2 = 0%; moderate certainty evidence) (Kopf 2012; MEMO 2011; Steed 2005; C‐DIRECT 2019).
1.2. Analysis.

Comparison 1: Educational programmes plus routine care versus routine care alone, Outcome 2: HbA1c [%]
MESMI 2010 (80 participants) reported the median and interquartile range for HbA1c (%). In the education programme plus routine care group, the median HbA1c was 7% at three months, 7.5% at six months, and 7% at nine months follow‐up. For the routine care group, it was 7% at three months, 7% at six months, and 8% at nine months.
McMurray 2002 (83 participants) reported that HbA1c levels declined from 6.9% to 6.2% in the education programmes group, whereas the routine care group results were unchanged at 7% (P < 0.005). They also reported that the reduction in blood glucose and HbA1c levels wasn't associated with increased hypoglycaemia. We attempted to contact the authors for the mean and standard deviation but received no reply.
Attaining a HbA1c ≤ 6.5% (48 mmol/mol)
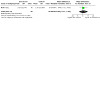
MEMO 2011 reported that attaining an HbA1c ≤ 6.5% (48 mmol/mol) at 18 months may be decreased with routine care, compared to the education programmes (Analysis 1.3 (179 participants): RR 2.43, 95% CI 1.37 to 4.32; low certainty evidence).
1.3. Analysis.
Comparison 1: Educational programmes plus routine care versus routine care alone, Outcome 3: Attaining HbA1c < 6.5%
Kidney failure
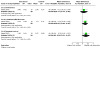
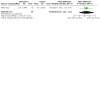
Kopf 2012 reported the incidence of kidney failure, but the effect is unclear due to few reported events (Analysis 1.4 (110 participants): RR 3.22, 95% CI 0.13 to 77.41) (very low certainty evidence).
1.4. Analysis.
Comparison 1: Educational programmes plus routine care versus routine care alone, Outcome 4: Kidney failure
Patient‐orientated measures of knowledge, self‐management, and behavioural changes
Attitude scales
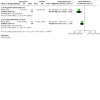
Steed 2005 (97 participants) reported a MD in participants' attitude scales for seriousness, treatment effectiveness and personal control in participants who had an education programme plus routine care group compared to routine care at five weeks (end of treatment) and three months follow‐up.
Education programmes compared to routine care may make little or no difference in the attitude toward the seriousness of disease at the end of treatment (Analysis 1.5.1: MD 0.09, 95% CI ‐0.24 to 0.42) and at the end of follow‐up (Analysis 1.6.1: MD 0.11, 95% CI ‐0.24 to 0.46) (low certainty evidence). However, a difference was reported between the groups for the attitude scale for treatment effectiveness at the end of treatment (Analysis 1.5.2: MD 0.25, 95% CI 0.07 to 0.43) and at the end of follow‐up (Analysis 1.6.2: MD 0.24, 95% CI ‐0.00 to 0.48) (low certainty evidence).
1.5. Analysis.
Comparison 1: Educational programmes plus routine care versus routine care alone, Outcome 5: Patient‐oriented measures: beliefs at the end of treatment (attitude scales)
1.6. Analysis.
Comparison 1: Educational programmes plus routine care versus routine care alone, Outcome 6: Patient‐oriented measures: beliefs at the end of follow‐up (attitude scales)
Education programmes, compared to routine care, may make little or no difference in attitude (personal control) at the end of treatment (Analysis 1.5.3: MD 0.31, 95% CI ‐0.03 to 0.65). However, personal control at three months follow‐up may be slightly increased with the education programmes compared to routine care (Analysis 1.6.3: MD 0.31 95% CI 0.01 to 0.61) (low certainty evidence).
Knowledge of diabetes
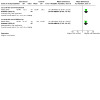
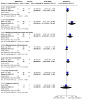
McMurray 2002 (83 participants) reported that after 12 months of follow‐up, education programmes compared to routine care may increase all 11 items related to specific diabetes knowledge in people receiving dialysis (Analysis 1.7) (all low certainty evidence).
1.7. Analysis.

Comparison 1: Educational programmes plus routine care versus routine care alone, Outcome 7: Patient‐oriented measures: knowledge of diabetes at the end of treatment
Diagnosis (MD 0.80, 95% CI 0.54 to 1.06)
Monitoring (MD 1.30, 95% CI 0.92 to 1.68)
Hypoglycaemia (MD 1.10, 95% CI 0.81 to 1.39)
Hyperglycaemia (MD 0.50, 95% CI 0.22 to 0.78)
Medication (insulin) (MD 1.40, 95% CI 0.90 to 1.90)
Oral medication (MD 0.70, 95% CI 0.38 to 1.02)
Personal health habits (MD 1.40, 95% CI 1.06 to 1.74)
Diet (MD 0.40, 95% CI 0.07 to 0.73)
Exercise (MD 0.80, 95% CI 0.49 to 1.11)
Chronic complications (MD 0.90, 95% CI 0.59 to 1.21)
Living with diabetes and coping with stress (MD 0.60, 95% CI 0.21 to 0.99).
Steed 2005 (97 participants) reported that education programmes plus routine care may improve general knowledge of diabetes at the end of the five‐week intervention (Analysis 1.8.1: MD 15.82, 95% CI 8.39 to 23.25) and after three months of follow‐up (Analysis 1.8.2: MD 14.39, 95% CI 7.45 to 21.33) (low certainty evidence) compared to routine care alone.
1.8. Analysis.
Comparison 1: Educational programmes plus routine care versus routine care alone, Outcome 8: Patient‐oriented measures: general knowledge of diabetes
Measures of patient empowerment and self‐efficacy
Steed 2005 (97 participants) reported education programmes plus routine care may improve patient total self‐efficacy at the end of the five‐week intervention (Analysis 1.9.1: MD 19.00, 95% CI 12.58 to 25.42), but no difference was reported at the end of the three‐month follow‐up (Analysis 1.10.1: MD 2.97, 95% CI ‐3.43 to 9.37) (low certainty evidence).
1.9. Analysis.
Comparison 1: Educational programmes plus routine care versus routine care alone, Outcome 9: Patient‐oriented measures: self‐efficacy at the end of treatment
1.10. Analysis.
Comparison 1: Educational programmes plus routine care versus routine care alone, Outcome 10: Patient‐oriented measures: self‐efficacy at the end of follow‐up
Steed 2005 (97 participants) reported education programmes may make little or no difference to self‐efficacy related to HBGM compared to routine care at the end of the five‐week intervention (Analysis 1.9.2: MD 6.96, 95% CI ‐2.87 to 16.79). However, education programmes may increase self‐efficacy related to HBGM after three months of follow‐up Analysis 1.10.2: MD 11.28, 95% CI 1.92 to 20.64) (low certainty evidence).
Steed 2005 (97 participants) reported education programmes may make little or no difference to diet after five weeks of education programmes (Analysis 1.9.3: MD 0.74, 95% CI ‐7.51 to 8.99) or after three months of follow‐up compared to routine care (Analysis 1.10.3: MD 3.46, 95% CI ‐4.32 to 11.24) (low certainty evidence).
Steed 2005 (97 participants) reported education programmes may make little or no difference to exercise after five weeks of education programmes (Analysis 1.9.4: MD 3.64, 95% CI ‐7.04 to 14.32) or after three months of follow‐up compared to routine care (Analysis 1.10.4: ME 8.28, 95% CI ‐2.04 to 18.60) (low certainty evidence).
C‐DIRECT 2019 (42 participants) reported there may be little or no difference between education programmes and routine care with the diabetes self‐efficacy scale after three months of follow‐up (Analysis 1.10.5: MD ‐0.57 95% CI ‐1.65 to 0.51) (low certainty evidence).
Patient behavioural changes
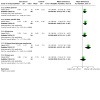
McMurray 2002 (83 participants) reported that education programmes compared to routine care may improve self‐management of checking feet (Analysis 1.11.1: RR 1.63, 95% CI 1.01 to 2.63), using lotion (Analysis 1.11.2: RR 9.71, 95% CI 2.45 to 38.56) and wearing appropriate shoes and socks (Analysis 1.11.3: RR 4.39, 95% CI 1.87 to 10.32), after 12 months of treatment. However, there may be little or no difference in HDGM (Analysis 1.11.4: RR 1.20, 95% CI 0.81 to 1.79), carrying carbohydrate (Analysis 1.11.5: RR 1.90, 95% CI 0.93 to 3.87) or eye examination (Analysis 1.11.6: RR 1.48, 95% CI 0.95 to 2.29).
1.11. Analysis.
Comparison 1: Educational programmes plus routine care versus routine care alone, Outcome 11: Patient‐oriented measures: self‐management behaviour changes at the end of treatment
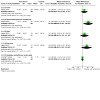
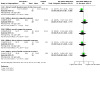
Steed 2005 (100 participants) reported there may be beneficial effects of educational programmes on behaviour change at the end of treatment for general diet (Analysis 1.12.1: MD 0.73, 95% CI 0.10 to 1.36), specific diet (Analysis 1.12.2: MD 1.02, 95% CI 0.42 to 1.62), and HBGM (Analysis 1.12.4: MD 2.13, 95% CI 1.18 to 3.08), but not for exercise (Analysis 1.12.3: MD 0.76, 95% CI ‐0.11 to 1.63), foot care (Analysis 1.12.5: MD 0.19, 95% CI ‐0.72 to 1.10) or quitting smoking (Analysis 1.11.7: RR 0.81, 95% CI 0.09 to 7.58).
1.12. Analysis.
Comparison 1: Educational programmes plus routine care versus routine care alone, Outcome 12: Patient‐oriented measures: behavioural changes at the end of treatment
The benefits were no longer seen at the end of follow‐up for general diet (Analysis 1.13.1 (2 studies, 142 participants): MD 0.09, 95% CI ‐0.46 to 0.64; I2 = 0%), specific diet (Analysis 1.13.2 (2 studies, 142 participants): MD 0.46 95% CI ‐0.02 to 0.93; I2 = 0%) or HBGM (Analysis 1.13.4 (2 studies, 142 participants): MD 0.62 95% CI ‐1.23 to 2.48; I2 = 76%). There may be little or no difference between the groups at the end of follow‐up for either exercise (Analysis 1.13.3 (2 studies, 142 participants): MD 0.45 95% CI ‐0.28 to 1.18; I2 = 0%) or foot care (Analysis 1.13.5 (2 studies, 142 participants): MD 0.06 95% CI ‐0.70 to 0.83; I2 = 0%) (all low certainty evidence).
1.13. Analysis.
Comparison 1: Educational programmes plus routine care versus routine care alone, Outcome 13: Patient‐oriented measures: behavioural changes at the end of follow‐up
Kidney function measures
Estimated glomerular filtration rate
MEMO 2011 (179 participants) reported there may be little or no difference in eGFR between the groups at 18 months follow‐up (Analysis 1.14: MD 0.46 mL/min/1.73 m2, 95% CI ‐3.71 to 4.63; low certainty evidence).
1.14. Analysis.
Comparison 1: Educational programmes plus routine care versus routine care alone, Outcome 14: Estimated GFR [mL/min/1.73 m2]
Kopf 2012 reported a median eGFR of 85.9 mL/min/1.73 m2 (interquartile range (IQR) 83.0 to 88.7; 52 participants) in the education programme group at one‐year follow‐up. The reported median for the routine care group was 87 mL/min/1.73 m2 (IQR 83.7 to 90.3; 48 participants) (P = 0.08). At the two‐year follow‐up, a median eGFR of 82.7 mL/min/1.73 m2 (IQR 79.0 to 86.5; 51 participants) was reported in the education programme group, and 84.4 mL/min/1.73 m2 (IQR 80.0 to 88.7; 43 participants) in the routine care group (P = 0.09).
MESMI 2010 reported at three months follow‐up, the median eGFR was 53 mL/min/1.73 m2 (IQR 35 to 64; 39 participants) in the education programme group and 40 mL/min/1.73 m2 (IQR 27 to 56; 41 participants) in the routine care group. At nine months follow‐up, the median eGFR was 48 mL/min/1.73 m2 (IQR 38 to 76; 39 participants) in the education programme group and 46 mL/min/1.73 m2 (IQR 32 to 72; 41 participants) in the routine care group.
Serum creatinine
Kopf 2012 reported a median SCr of 0.086 mmol/L (IQR 0.080 to 0.092; 47 participants) in the education programme group and 0.084 mmol/L (IQR 0.076 to 0.091; 42 participants) in the routine care group, at three years follow‐up (P = 0.10).
MESMI 2010 reported a median SCr of 0.117 mmol/L (IQR 0.082 to 0.144; 39 participants) in the education programme group and 0.108 mmol/L (IQR 0.089 to 0.171; 41 participants) in the routine care group at three years follow‐up.
Urinary albuminuria‐creatinine ratio
MEMO 2011 (189 participants) reported there may be little or no difference in UACR between the education programme group and routine care at 18 months of follow‐up (Analysis 1.15: MD 0.35 mg/g, 95% CI ‐1.01 to 1.71; low certainty evidence).
1.15. Analysis.
Comparison 1: Educational programmes plus routine care versus routine care alone, Outcome 15: Urinary albumin‐creatinine ratio [mg/g]
Kopf 2012 reported a median UACR of 32.2 mg/g (IQR 9.8 to 76.3; 47 participants) in the education programme group and 31.6 mg/g (IQR 12.1 to 83.0; 42 participants) in the routine care group, at three years follow‐up (P = 0.05).
Blood pressure
Systolic blood pressure
MEMO 2011 (179 participants) reported that SBP may be lower in the education programme group compared to the routine care group at 18 months follow‐up (Analysis 1.16.1: MD ‐11.12 mm Hg, 95% CI ‐16.38 to ‐5.86; low certainty evidence).
1.16. Analysis.
Comparison 1: Educational programmes plus routine care versus routine care alone, Outcome 16: Blood pressure [mm Hg]
Diastolic blood pressure
MEMO 2011 (179 participants) reported that DBP may be lower in the education programme group compared to the routine care group at 18 months follow‐up (Analysis 1.16.2: MD ‐5.43 mm Hg, 95% CI ‐9.12 to ‐1.74; low certainty evidence).
Glycaemic events
Hypoglycaemia
MEMO 2011 (179 participants) reported education programmes compared to routine care alone may make little or no difference to hypoglycaemia at 18 months follow‐up (Analysis 1.17.1: RR 0.85, 95% CI 0.67 to 1.08; low certainty evidence).
1.17. Analysis.
Comparison 1: Educational programmes plus routine care versus routine care alone, Outcome 17: Glycaemic events
Serious hypoglycaemia
MEMO 2011 (179 participants) reported education programmes compared to routine care alone may make little or no difference to serious hypoglycaemia at 18 months follow‐up (Analysis 1.17.2: RR 0.08, 95% CI 0.00 to 1.33; low certainty evidence).
McMurray 2002 reported no severe hypoglycaemic episodes in the education programme group, and it is unclear if this extends to the control group. We contacted the authors for the specific numbers, as these were not reported, but received no response.
Non‐fatal cardiovascular events
Kopf 2012 (110 participants) reported education programmes, compared to routine care alone, may make little or no difference to total cardiovascular events (Analysis 1.18.1: RR 1.25, 95% CI 0.45 to 3.49).
1.18. Analysis.
Comparison 1: Educational programmes plus routine care versus routine care alone, Outcome 18: Non‐fatal cardiovascular events
Education programmes compared to routine care alone may make little or no difference to stroke (Analysis 1.18.2 (2 studies, 289 participants): RR 4.06, 95% CI 0.45 to 36.26; I2 = 0%) or MI (Analysis 1.18.3 (2 studies, 289 participants): RR 1.18 95% CI 0.41, 3.43; I2 = 0%).
MEMO 2011 (179 participants) reported education programmes, compared to routine care alone, may make little or no difference to heart failure (Analysis 1.18.4: RR 1.98, 95% CI 0.18 to 21.42).
Quality of life
The PHQ was used to assess levels of stress, depression and other psychiatric co‐morbidities, with a lower score indicating less stress. Kopf 2012 (103 participants) reported a lower score with the education programme compared to routine care (Analysis 1.19.1: MD ‐1.70, 95% CI ‐3.09 to ‐0.31; 1 study, 103 participants) at 12 months follow‐up.
1.19. Analysis.
Comparison 1: Educational programmes plus routine care versus routine care alone, Outcome 19: Quality of life
C‐DIRECT 2019 (42 participants) reported CKD‐related QoL at three months follow‐up using the KDQoL questionnaire, with higher scores indicating better QoL. C‐DIRECT 2019 reported there may be no differences between the education programme group and the routine care group for the physical composite summary (Analysis 1.19.2: MD 2.13, 95% CI ‐5.14 to 9.40), the mental composite summary (Analysis 1.19.3: MD ‐8.43, 95% CI ‐22.69 to 5.83), the kidney disease composite summary (Analysis 1.19.4: MD ‐4.55, 95% CI ‐12.19 to 3.09), and the general health composite summary (Analysis 1.19.5: MD ‐0.63, 95 % CI‐5.31 to 4.05) (all low certainty evidence).
A questionnaire to evaluate the patient's QoL based on diabetes condition and complications was adapted from the standardised Diabetes Form 2.1 (Hoogwerf 1992). McMurray 2002 reported strong evidence for the improvement in the QoL assessment domains of diabetic symptoms (P < 0.001) and health perception (P < 0.002) in the education programme plus routine care group, compared to routine care. There was no improvement in the categories of social functioning, role limitations and mental health score reported.
Steed 2005 reported that diabetes‐specific QoL, using the Audit of Diabetes Dependent Quality of Life measure (ADDQoL) (Bradley 1999), and generic QoL using the UK SF‐36 (Jenkinson 1996). Patients who received the education programme only demonstrated improved diabetes‐specific QoL during follow‐up (for three months after the end of treatment) (ANCOVA = 9.33; P < 0.01) compared to the routine care group. UK SF‐36 data on general QoL was not reported.
We contacted the authors of McMurray 2002 and Steed 2005 for the data to include in our meta‐analysis but were unsuccessful.
See Appendix 3 for the assessment tools used.
Lipids
Total cholesterol
MEMO 2011 (179 participants) reported total cholesterol may be lower in the education programme group at 18 months follow‐up (Analysis 1.20.1: MD ‐0.35 mmol/L, 95% CI ‐0.63 to ‐0.07; low certainty evidence), compared to the routine care group.
1.20. Analysis.
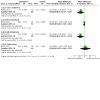
Comparison 1: Educational programmes plus routine care versus routine care alone, Outcome 20: Lipids [mmol/L]
HDL cholesterol
MEMO 2011 (179 participants) reported education programmes, compared to routine care, may make little or no difference to HLD cholesterol at 18 months follow‐up (Analysis 1.20.2: MD ‐0.03 mmol/L, 95% CI ‐0.09 to 0.03; low certainty evidence).
LDL cholesterol
MEMO 2011 (179 participants) reported LDL cholesterol may be lower in the education programme group at 18 months follow‐up (Analysis 1.20.3: MD ‐0.40 mmol/L, 95% CI ‐0.65 to ‐0.14; 179 participants; low certainty evidence) compared to the routine care group.
Triglycerides
MEMO 2011 (179 participants) reported education programmes, compared to routine care, may make little or no difference to triglycerides at 18 months follow‐up (Analysis 1.20.4: MD 0.07 mmol/L, 95% CI ‐0.38 to 0.52; low certainty evidence).
Adverse events
Non‐fatal adverse events
MEMO 2011 (179 participants) reported education programmes, compared to routine care, may make little or no difference to non‐fatal adverse events at 13.5 months follow‐up (Analysis 1.21: RR 1.03, 95% CI 0.89 to 1.18; low certainty evidence).
1.21. Analysis.
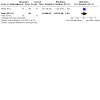
Comparison 1: Educational programmes plus routine care versus routine care alone, Outcome 21: Adverse events: non‐fatal (including hypoglycaemic and CVD events)
Serious adverse events (including deaths)
There may be little or no difference in serious adverse events between treatment groups at 18 months follow‐up (Analysis 1.22 (2 studies, 289 participants): RR 0.76, 95% CI 0.36 to 1.62; I2 = 58%; low certainty evidence).
1.22. Analysis.
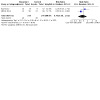
Comparison 1: Educational programmes plus routine care versus routine care alone, Outcome 22: Serious adverse events: emergency hospitalisation or death (including serious hypoglycaemic and CVD events)
McMurray 2002 reported no limb amputations in the education programme group, whereas the routine care group had five lower‐extremity amputations and two‐finger amputations during the 12‐month study. Overall, the education group had a significantly lower hospitalisation rate for diabetes, peripheral vascular disease, infection, and amputation‐related admissions (P < 0.05). The data could not be included in the meta‐analysis as not all the number of events were reported.
Multidisciplinary, multifactorial education programmes versus routine care
Death
None of the included studies reported all‐cause death, DKD‐related death, or CV disease‐related death.
HbA1c
Fogelfeld 2017 (120 participants) reported there may be little or no difference between the groups for HbA1c at 12 months follow‐up (Analysis 2.1: MD ‐0.40%, 95% CI ‐1.00 to 0.20; low certainty evidence). However, patients who received the education programme were more likely to attain a HbA1C% < 7% (53.0 mmol/mol) (50.0% versus 31.6%, P = 0.05) at follow‐up (low certainty evidence).
2.1. Analysis.
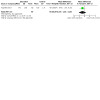
Comparison 2: Multidisciplinary, multifactorial education programmes versus routine care, Outcome 1: HbA1c [%]
Kidney failure
Fogelfeld 2017 (120 participants) reported there may be little or no difference between the groups for kidney failure at the end of the intervention (two years) (Analysis 2.2: RR 0.47, 95% CI 0.22 to 1.01; low certainty evidence).
2.2. Analysis.

Comparison 2: Multidisciplinary, multifactorial education programmes versus routine care, Outcome 2: Kidney failure
Patient‐oriented measures
None of the included studies reported behaviour change, knowledge or self‐efficacy.
Kidney function measures
eGFR
Fogelfeld 2017 (120 participants) reported there may be little or no difference between the groups for eGFR at the end of the intervention (two years) (Analysis 2.3: MD 2.03 mL/min/1.73 m2, 95% CI ‐3.44 to 7.50; low certainty evidence).
2.3. Analysis.
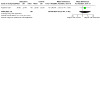
Comparison 2: Multidisciplinary, multifactorial education programmes versus routine care, Outcome 3: Estimated GFR [mL/min/1.73 m2]
Albuminuria
Fogelfeld 2017 reported a median UACR of 783.4 (IQR 215 to 2209) in the education group and 748.0 (IQR 218 to 2260) in the control group at two years follow‐up.
Blood pressure
Systolic blood pressure
Fogelfeld 2017 (120 participants) reported there may be little or no difference between the groups for SBP at the end of the intervention (two years) (Analysis 2.4.1: MD ‐0.19 mm Hg, 95% CI ‐6.41 to 6.03; very low certainty evidence).
2.4. Analysis.

Comparison 2: Multidisciplinary, multifactorial education programmes versus routine care, Outcome 4: Blood pressure [mm Hg]
Diastolic blood pressure
Fogelfeld 2017 (120 participants) reported there may be little or no difference between the groups for DBP at the end of the intervention (two years) (Analysis 2.4.2: MD ‐3.40 mm Hg, 95% CI ‐8.02 to 1.22; very low certainty evidence).
Glycaemic events
Hypoglycaemia
There may be little or no difference between treatment groups for hypoglycaemia at 12 months follow‐up (Analysis 2.5.1 (2 studies, 210 participants): RR 0.57, 95% CI 0.10, 3.36; I2 = 83%; low certainty evidence). The percentage of hypoglycaemia was either self‐measured blood glucose < 70 mg/dL or reported symptomatic hypoglycaemia in all six‐month visits.
2.5. Analysis.
Comparison 2: Multidisciplinary, multifactorial education programmes versus routine care, Outcome 5: Glycaemic events
Hyperglycaemia
Guo 2022 (90 participants) reported there may be little or no difference between the groups for hyperglycaemia (follow‐up unknown) (Analysis 2.5.2: RR 0.14, 95% CI 0.02 to 1.11; low certainty evidence).
Non‐fatal cardiovascular events
None of the included studies reported total CV disease events (stroke, MI, heart failure, or peripheral vascular disease).
Quality of life
None of the included studies reported QoL.
Lipids
HDL cholesterol
Fogelfeld 2017 (120 participants) reported there may be little or no difference between the groups for HDL cholesterol at the end of the intervention (two years) (Analysis 2.6.1: MD 0.03 mg/dL, 95% CI ‐4.39 to 4.45; very low certainty evidence).
2.6. Analysis.
Comparison 2: Multidisciplinary, multifactorial education programmes versus routine care, Outcome 6: Lipids [mg/dL]
LDL cholesterol
Fogelfeld 2017 (120 participants) reported there may be little or no difference between the groups for LDL cholesterol at the end of the intervention (two years) (Analysis 2.6.2: MD ‐5.87 mg/dL, 95% CI ‐20.11 to 8.37).
Triglycerides
Fogelfeld 2017 reported lower median triglycerides (125.0 mg/dL; IQR 80 to 187) in the education programme group compared to the routine care group (141.0 mg/dL; IQR 109 to 184) at the end of the intervention (two years).
Adverse events
None of the included studies reported adverse events.
Subgroup analysis
Pre‐specified subgroup analyses were not possible due to the limited number of studies included for each outcome.
Sensitive analysis
It was not possible to perform sensitivity analyses due to the limited number of included studies for each outcome.
Publication bias
It was not possible to check for publication bias due to the limited number of included studies for each outcome examined.
Discussion
Summary of main results
The eight studies, including 840 people with CKD (from early‐stage pre‐dialysis to dialysis) and DM, found that education programmes may improve knowledge about diagnosis, monitoring and regulating diabetes control, managing medications and personal health habits. These included diet and exercise, hypoglycaemia and hyperglycaemia, living with diabetes and coping with stress. Improvements in self‐efficacy after treatment were also evident in people who received an education programme compared to those who received routine care alone. The increased knowledge and self‐efficacy may have contributed to improved self‐management behaviours after treatment, such as checking feet, using lotion and wearing appropriate shoes and socks, monitoring blood glucose and improving diet, as well as lower HbA1c, LDL cholesterol and SBP and DBP. However, the limited effect on behaviour change at the end of the follow‐up suggests that ongoing education might be needed after treatment to ensure important self‐management behaviour continues. These important patient preference outcomes show potential benefits with little harm (SONG‐CKD 2018; Tong 2012).
Despite evidence of improved knowledge, self‐efficacy, and behaviour change, the studies included in this review had uncertainty around hard clinical endpoints such as death, kidney failure, and cardiovascular outcomes due to lack of events, likely because of the studies' short duration. Given the advanced stage of CKD and DM in many of the participants, it is unclear if there would be significant changes in these clinical endpoints even if the studies were of longer duration. Longer‐term studies that focus on validated surrogate outcomes, such as eGFR slope related to long‐term adverse kidney events, are necessary. These outcomes are particularly important for people with early‐stage CKD and DM.
Overall completeness and applicability of evidence
This review was based on a highly sensitive search. One major limitation is the small number of included studies, which may impact the generalisability of the findings for clinical practice.
Characteristics of participants
In this review, the included studies were not representative of all cultures, as studies were largely conducted in the USA, Japan, Germany, Australia, and the UK. It has been reported that cultural factors also play a role in the effectiveness of educational interventions (Hawthorne 2008). Ethnic minority groups in upper‐middle and high‐income countries tend to be socio‐economically disadvantaged and have a higher prevalence of T2DM than the majority population (Smedley 2002). They also have a higher burden of diabetes and CKD (Cowie 1989; Pugh 1988). A Cochrane review (Hawthorne 2008) showed that culturally appropriate diabetes health education appears to have short‐term effects on glycaemic control and knowledge of diabetes and healthy lifestyles. Whether education programmes have similar effects regarding content and delivery is still uncertain for people with different cultural backgrounds. It should also be noted that in C‐DIRECT 2019, both ITT and per‐protocol analysis showed ethnicity had a significant effect on several outcomes, indicating lower QoL, self‐management skills and higher depression for Chinese relative to non‐Chinese, irrespective of study arm.
Measurement of outcomes
It is well known that for those with both DM and CKD, the outlook is far worse than for either condition alone because this combination is a powerful predictor of major adverse cardiovascular events and death (KDOQI 2007; KDIGO 2022). The most important treatment goal for co‐existing DM and CKD is to reduce or delay the onset of cardiovascular events and kidney failure, ultimately prolonging survival and improving QoL (KDIGO 2022). However, the eight included studies focused mainly on surrogate endpoints (e.g. patients' knowledge of diabetes and self‐management behavioural changes). A limitation of this review is the short‐term follow‐up of the included studies and, in turn, the lack of sufficient follow‐up for important clinical outcomes, such as cardiovascular events. Strategies to promote glycaemic control and minimise CKD progression depend on the ability and willingness of the patients to change and subsequently maintain appropriate behaviours. A strength of this review was the reporting of patient‐important outcomes such as self‐efficacy and self‐management. Two meta‐analyses have demonstrated that enhancing adherence to a diabetes regimen resulted in better glycaemic control, particularly if the interventions were repetitive and ongoing (Ellis 2004; Norris 2001).
Adverse effects are as important as the efficacy of the interventions in clinical studies. Due to the lack of data, we were unable to report adverse events specifically resulting from educational programmes. It might be that the education programmes had little to no adverse effects. However, no conclusions can be made due to the limited reporting.
Quality of the evidence
In general, most studies exhibited study limitations, or there was limited reporting of methodological details. Not all studies had a published protocol or were registered in a clinical trial registry. The overall risk of bias was low for objective outcomes and attrition bias, unclear for selection bias, reporting bias and other biases, and high for subjective outcomes. The lack of blinding for subjective measures may impact the certainty of the evidence more so than objective outcomes. To control for this, we assessed blinding for subjective and objective outcomes separately.
Methodologically, less rigorous studies show larger differences between treatment and control groups than those conducted with better rigour (Kjaergard 1999; Moher 1998; Moher 2009; Schulz 1995). Schulz 1995 found that odd ratios were exaggerated by up to 30% for studies that did not have clear concealment and 41% for inadequately concealed studies. Many of the outcomes had limited data from only one study and included few participants, increasing imprecision.
It was also not possible to perform a funnel plot to assess the degree of publication bias because of the limited number of studies for each outcome. Although we have undertaken extensive searches for published material, we still can not exclude the possibility that studies with negative findings remain unpublished. To avoid potential publication bias, we also included relevant conference abstract publications and data from trial registries that may not have gone on to full publication.
Potential biases in the review process
This systematic review's strengths include the clear definition of the objectives and scope of research and the requirement that two authors reach a consensus on all data elements. Another major strength of this review is the collaboration of multidisciplinary researchers who participated in its development. This review was undertaken by investigators who are skilled at employing highly systematic and unbiased methods to collect, review and synthesise data from published literature. Throughout the course of this review, there was frequent input from the co‐investigators, who are clinical and methodological content experts. The review authors are independent and have no affiliation with any trial investigators or conflict of interests, and the review received no industry funding. The small number of studies may limit the power of statistical testing to detect important differences.
Agreements and disagreements with other studies or reviews
A recent cross‐sectional study in patients with early‐stage CKD reported that improving self‐efficacy is an important mediator between knowledge and self‐management (Chuang 2021). It is plausible that the improvement in self‐efficacy and knowledge observed in the education intervention group in our review may have led to meaningful self‐management behaviour change and contributed to the improved glycaemic control for people with DM and CKD. A systematic review of DM self‐management education interventions for people with T2DM in the Asian Western Pacific region also found that in eight out of the 21 included studies, there was an improvement in glycaemic control in DM participants, and they reported improvement in HbA1c levels (Mohamed 2019).
Duke 2009 compared individual education programmes to group education sessions or usual care (9 studies; 1359 participants) in people with DM. Similarly to our findings, the review found no long‐term studies, and the overall certainty of the evidence was low. Compared to usual care, individual face‐to‐face education had little or no effect over a 12 to 18‐month period. However, there was a benefit in people with a higher mean baseline HbA1c > 8%. However, the effect on self‐management and self‐efficacy was unclear due to a lack of available data.
While Duke 2009 showed no difference between individual education and group education, another systematic review of patients with CKD that included observational studies highlighted the effectiveness of multifaceted education interventions and that characteristics of effective interventions included teaching sessions that involved not only groups of patients but also their families (Lopez‐Vargas 2016). A limitation of our review is that we were unable to undertake a subgroup analysis comparing group‐based and individual‐based education programmes. However, we made another separate comparison between education programmes plus multidisciplinary, co‐ordinated care versus usual care. We did not find any differences in any outcomes for this comparison pair, largely due to having one study included and low certainty of the evidence. A multidisciplinary team was listed by Lopez‐Vargas 2016 as an important characteristic of an effective education programme. A meta‐analysis (3 studies; 327 participants) found that multidisciplinary management of CKD and DM was associated with an improvement of HbA1c, compared with standard usual care at a mean 13‐month follow‐up (Helou 2016).
Authors' conclusions
Implications for practice.
Education programmes may have positive effects on the improvement of patients' knowledge of DM, resulting in self‐management behavioural changes for people with T1DM or T2DM on dialysis or people with T2DM with moderately increased albuminuria (A2). However, people with both CKD and DM, and clinicians should be aware that the effects on clinical endpoints are uncertain due to the limited availability of high‐quality data. Recent guidelines for the management of CKD and DM suggest structured education is critical to engaging people with CKD and DM to self‐manage their disease and participate in the necessary shared decision‐making regarding their management plan (KDIGO 2022). While the data on the benefits and harms in our review are uncertain, it supports these recommendations due to the potential benefits and little expected harms of an education programme.
Implications for research.
The promising results from these eight studies warrant further research. To confirm the available evidence, larger numbers of participants and high‐quality RCTs are needed. Future studies should address the following features.
Methodology
Reports of RCTs should conform to the recommendations of the CONSORT statement. The 25‐item CONSORT checklist provides information on how the trial was designed, analysed and interpreted. Using this tool encourages standardised reporting of interventions, and a thorough description of the interventions would allow a better comparison of the included studies and be easier to reproduce. Using this tool would aid in assessing the methodological quality of the included studies, and future studies should have detailed reporting of the methods of randomisation and allocation concealment, with clear descriptions of blinding. Particularly for outcome assessors and data assessors, who could be blinded for educational programme research.
Finally, there should be more adequately powered studies. All the eligible studies had small sample sizes. While one of the benefits of meta‐analysis is that a synthesis of inadequately powered studies can yield interesting findings, such meta‐analyses require large numbers of small studies in order to obtain conclusive findings.
Participants
Increasing the diversity of participants in the included studies is required. Recruitment of people with CKD and DM from different subgroups (e.g. ethnicity, culture, socioeconomic status, stage of CKD) is needed to improve the generalisability of the findings on the efficacy and safety of educational programmes. In addition, specific cultural adaptations are needed to address the requirements of local individuals to support self‐management (Mohamed 2019).
Outcomes
CKD outcomes should be based on the SONG‐CKD outcome set, in addition to important clinical outcomes (SONG‐CKD 2018). Including patient‐reported outcomes ensures research reports outcomes that are meaningful and relevant to people with kidney disease, their family, and their clinicians (Gutman 2019; Tong 2012). In addition, future studies should include:
Reporting clinically important outcome measures over a long period of time, such as CV events, kidney failure or validated surrogate outcomes (e.g. doubling SCr or ≥ 57% GFR loss), are important endpoints for clinical decision‐making.
Reporting important educational outcomes such as changes in knowledge, understanding, attitude, self‐care, and lifestyle behaviours, adherence to treatment regimens, self‐determination and participation in care decision‐making, and psychological adjustment.
Adverse events should be critically assessed by standardised monitoring or an effective self‐report system, considering observational data on adverse events while recognising the limitations of RCT data.
Standardised reporting of outcomes and more exact data on QoL outcomes, using means rather than median and interquartile ranges. This would allow for meta‐analysis and better comparison of results across studies.
Increasing the duration of studies and also the follow‐up time to determine whether the effects are long‐lasting following the intervention.
What's new
| Date | Event | Description |
|---|---|---|
| 22 August 2024 | New citation required and conclusions have changed | New comparisons and outcomes added |
| 22 August 2024 | New search has been performed | New studies included |
History
Protocol first published: Issue 4, 2008 Review first published: Issue 6, 2011
| Date | Event | Description |
|---|---|---|
| 7 May 2014 | Amended | Minor copy edit made |
Acknowledgements
The authors would like to thank the following.
We would like to thank the referees for their editorial advice and comments during the preparation of this review update: Fumika Taki MD, PhD, FASN (St.Lukes' International Hospital, Japan); Arlene C Crisostomo, MD (St Luke's Medical Center‐QC Philippines); Tim Cundy (University of Auckland, Aotearoa‐New Zealand);
The authors of the 2011 version of the review: Ting Li, Hong Mei Wu, Feng Wang, Chang Quan Huang, Ming Yang, Bi Rong Dong, Guan J Liu
Appendices
Appendix 1. Electronic search strategies
| Database | Search terms |
| CENTRAL |
|
| MEDLINE |
|
| EMBASE | 1. patient education/ 2. exp health education/ 3. adjustment/ 4. health program/ 5. teaching/ 6. LEARNING/ 7. behavior control/ 8. Behavior Therapy/ 9. exp Education/ 10. or/1‐9 11. Diabetic Nephropathy/ 12. diabetic kidney disease.tw or daibetic nephropath$.tw 13. or/11‐12 14. and/10,13 |
Appendix 2. Risk of bias assessment tool
| Potential source of bias | Assessment criteria |
|
Random sequence generation Selection bias (biased allocation to interventions) due to inadequate generation of a randomised sequence |
Low risk of bias: Random number table; computer random number generator; coin tossing; shuffling cards or envelopes; throwing dice; drawing of lots; minimisation (minimisation may be implemented without a random element, and this is considered to be equivalent to being random). |
| High risk of bias: Sequence generated by odd or even date of birth; date (or day) of admission; sequence generated by hospital or clinic record number; allocation by judgement of the clinician; by preference of the participant; based on the results of a laboratory test or a series of tests; by availability of the intervention. | |
| Unclear: Insufficient information about the sequence generation process to permit judgement. | |
|
Allocation concealment Selection bias (biased allocation to interventions) due to inadequate concealment of allocations prior to assignment |
Low risk of bias: Randomisation method described that would not allow investigator/participant to know or influence intervention group before eligible participant entered in the study (e.g. central allocation, including telephone, web‐based, and pharmacy‐controlled, randomisation; sequentially numbered drug containers of identical appearance; sequentially numbered, opaque, sealed envelopes). |
| High risk of bias: Using an open random allocation schedule (e.g. a list of random numbers); assignment envelopes were used without appropriate safeguards (e.g. if envelopes were unsealed or non‐opaque or not sequentially numbered); alternation or rotation; date of birth; case record number; any other explicitly unconcealed procedure. | |
| Unclear: Randomisation stated but no information on method used is available. | |
|
Blinding of participants and personnel Performance bias due to knowledge of the allocated interventions by participants and personnel during the study |
Low risk of bias: No blinding or incomplete blinding, but the review authors judge that the outcome is not likely to be influenced by lack of blinding; blinding of participants and key study personnel ensured, and unlikely that the blinding could have been broken. |
| High risk of bias: No blinding or incomplete blinding, and the outcome is likely to be influenced by lack of blinding; blinding of key study participants and personnel attempted, but likely that the blinding could have been broken, and the outcome is likely to be influenced by lack of blinding. | |
| Unclear: Insufficient information to permit judgement | |
|
Blinding of outcome assessment Detection bias due to knowledge of the allocated interventions by outcome assessors. |
Low risk of bias: No blinding of outcome assessment, but the review authors judge that the outcome measurement is not likely to be influenced by lack of blinding; blinding of outcome assessment ensured, and unlikely that the blinding could have been broken. |
| High risk of bias: No blinding of outcome assessment, and the outcome measurement is likely to be influenced by lack of blinding; blinding of outcome assessment, but likely that the blinding could have been broken, and the outcome measurement is likely to be influenced by lack of blinding. | |
| Unclear: Insufficient information to permit judgement | |
|
Incomplete outcome data Attrition bias due to amount, nature or handling of incomplete outcome data. |
Low risk of bias: No missing outcome data; reasons for missing outcome data unlikely to be related to true outcome (for survival data, censoring unlikely to be introducing bias); missing outcome data balanced in numbers across intervention groups, with similar reasons for missing data across groups; for dichotomous outcome data, the proportion of missing outcomes compared with observed event risk not enough to have a clinically relevant impact on the intervention effect estimate; for continuous outcome data, plausible effect size (difference in means or standardised difference in means) among missing outcomes not enough to have a clinically relevant impact on observed effect size; missing data have been imputed using appropriate methods. |
| High risk of bias: Reason for missing outcome data likely to be related to true outcome, with either imbalance in numbers or reasons for missing data across intervention groups; for dichotomous outcome data, the proportion of missing outcomes compared with observed event risk enough to induce clinically relevant bias in intervention effect estimate; for continuous outcome data, plausible effect size (difference in means or standardized difference in means) among missing outcomes enough to induce clinically relevant bias in observed effect size; ‘as‐treated’ analysis done with substantial departure of the intervention received from that assigned at randomisation; potentially inappropriate application of simple imputation. | |
| Unclear: Insufficient information to permit judgement | |
|
Selective reporting Reporting bias due to selective outcome reporting |
Low risk of bias: The study protocol is available and all of the study’s pre‐specified (primary and secondary) outcomes that are of interest in the review have been reported in the pre‐specified way; the study protocol is not available but it is clear that the published reports include all expected outcomes, including those that were pre‐specified (convincing text of this nature may be uncommon). |
| High risk of bias: Not all of the study’s pre‐specified primary outcomes have been reported; one or more primary outcomes is reported using measurements, analysis methods or subsets of the data (e.g. sub‐scales) that were not pre‐specified; one or more reported primary outcomes were not pre‐specified (unless clear justification for their reporting is provided, such as an unexpected adverse effect); one or more outcomes of interest in the review are reported incompletely so that they cannot be entered in a meta‐analysis; the study report fails to include results for a key outcome that would be expected to have been reported for such a study. | |
| Unclear: Insufficient information to permit judgement | |
|
Other bias Bias due to problems not covered elsewhere in the table |
Low risk of bias: The study appears to be free of other sources of bias. |
| High risk of bias: Had a potential source of bias related to the specific study design used; stopped early due to some data‐dependent process (including a formal‐stopping rule); had extreme baseline imbalance; has been claimed to have been fraudulent; had some other problem. | |
| Unclear: Insufficient information to assess whether an important risk of bias exists; insufficient rationale or evidence that an identified problem will introduce bias. |
Appendix 3. Assessment tools
| Assessment tool | Items, scale and direction of effect |
| PAID: Problem Areas in Diabetes Scale C‐DIRECT 2019 |
20 items (0 to 4) 0 = not a problem 4 = Serious problem Translated to 0 to 100 scale, higher score indicate greater levels of distress |
| HADS: Hospital Anxiety and Depression Scale C‐DIRECT 2019 |
2 subscales of 7 items (0 to 3) 0 = no impairment 3 = severe impairment More than 8; presence of anxiety and depression More than 16 identifies caseness for the total scale |
| KDQoL‐SF: Kidney Disease Quality of Life‐Short Form C‐DIRECT 2019 |
43 items (1 to 5) 1 = not at all bothered 5 = extremely bothered Scores range from 0 to 100, higher score indicates better QoL |
| DDFQ: Dialysis Diet and Fluid Non‐Adherence Questionnaire C‐DIRECT 2019 |
Days not adherent in past 14 days Provides score for frequency Rating of their degree in which they deviated from guidelines (0 to 4) 0 = none 4 = very severe Lower scores suggest lower non‐adherence |
| SDSCA: Summary of Diabetes Self‐Care Activities C‐DIRECT 2019 |
6 subscales (0 to 7) Higher total and subscale score indicates better diabetes and self‐management over a week |
| DSES: Diabetes Self Efficacy Scale C‐DIRECT 2019 |
8 items (0 to 10) 0 = not at all confident 10 = totally confident Higher scores indicate higher self‐efficacy |
| HEIQ: Health Education Impact Questionnaire C‐DIRECT 2019 |
8 items (1 to 4) 1 = strongly disagree 4 = strongly disagree Higher scores indicate better outcomes |
| ADDQoL: Audit of Diabetes Dependent Quality of Life Steed 2005 |
13 domains, impact (‐3 to +3) and importance (0 to 3) Impact ‐3 = a great deal better 3 = great deal worse Importance 3 = very important 0 = Not at all important |
| Diabetes Self‐Management Knowledge McMurray 2002 |
12 domains, 53 items (multiple choice and true/false) Higher scores indicate better outcomes |
| Diabetes Self‐Care Behaviours Inventory McMurray 2002 |
6 domains Higher scores indicate better outcomes |
| PHQ: Patient Health Questionnaire Kopf 2012 |
8 domains (0 to 12) 0‐2 = normal 3‐5 = mild 6‐8 = moderate 9‐12 = severe Total score ≥ 3 for first 2 questions suggests anxiety Total score ≥ 3 for last 2 questions suggests depression Lower score better |
Appendix 4. GRADE approach
The GRADE approach assesses the certainty of a body of evidence, rating it in one of four grades (GRADE 2008).
High: we are very confident that the true effect lies close to that of the estimate of the effect
Moderate: we are moderately confident in the effect estimate; the true effect is likely to be close to the estimate of effect, but there is a possibility that it is substantially different
Low: our confidence in the effect estimate is limited; the true effect may be substantially different from the estimate of the effect
Very low: we have very little confidence in the effect estimate; the true effect is likely to be substantially different from the estimate of the effect.
We decreased the certainty of evidence if there was (GRADE 2011).
Serious (‐1) or very serious (‐2) limitations in the study design or execution (risk of bias)
Important inconsistency of results (‐1)
Some (‐1) or major (‐2) uncertainty about the directness of evidence;
Imprecise or sparse data (‐1) or serious imprecision (‐2)
High probability of publication bias (‐1).
We increased the certainty of evidence if there was (GRADE 2011)
A large magnitude of effect (direct evidence, relative risk (RR) = 2 – 5 or RR = 0.5 – 0.2 with no plausible confounders) (+1); very large with RR > 5 or RR < 0.2 and no serious problems with risk of bias or precision; more likely to rate up if the effect is rapid and out of keeping with prior trajectory; usually supported by indirect evidence (+2)
Evidence of a dose‐response gradient (+1)
All plausible residual confounders or biases would reduce a demonstrated effect or suggest a spurious effect when results show no effect (+1).
Data and analyses
Comparison 1. Educational programmes plus routine care versus routine care alone.
| Outcome or subgroup title | No. of studies | No. of participants | Statistical method | Effect size |
|---|---|---|---|---|
| 1.1 Death | 4 | Risk Ratio (M‐H, Random, 95% CI) | Subtotals only | |
| 1.1.1 Death (any cause) | 4 | 424 | Risk Ratio (M‐H, Random, 95% CI) | 0.83 [0.31, 2.19] |
| 1.1.2 DKD‐related death | 1 | 110 | Risk Ratio (M‐H, Random, 95% CI) | Not estimable |
| 1.1.3 Cardiovascular disease‐related death | 2 | 289 | Risk Ratio (M‐H, Random, 95% CI) | 0.85 [0.26, 2.73] |
| 1.2 HbA1c [%] | 4 | Mean Difference (IV, Random, 95% CI) | ‐0.42 [‐0.53, ‐0.31] | |
| 1.3 Attaining HbA1c < 6.5% | 1 | 179 | Risk Ratio (M‐H, Random, 95% CI) | 2.43 [1.37, 4.32] |
| 1.4 Kidney failure | 1 | 110 | Risk Ratio (M‐H, Random, 95% CI) | 3.22 [0.13, 77.41] |
| 1.5 Patient‐oriented measures: beliefs at the end of treatment (attitude scales) | 1 | Mean Difference (IV, Random, 95% CI) | Subtotals only | |
| 1.5.1 Seriousness | 1 | 99 | Mean Difference (IV, Random, 95% CI) | 0.09 [‐0.24, 0.42] |
| 1.5.2 Treatment effectiveness | 1 | 99 | Mean Difference (IV, Random, 95% CI) | 0.25 [0.07, 0.43] |
| 1.5.3 Personal control | 1 | 99 | Mean Difference (IV, Random, 95% CI) | 0.31 [‐0.03, 0.65] |
| 1.6 Patient‐oriented measures: beliefs at the end of follow‐up (attitude scales) | 1 | Mean Difference (IV, Random, 95% CI) | Subtotals only | |
| 1.6.1 Seriousness | 1 | 99 | Mean Difference (IV, Random, 95% CI) | 0.11 [‐0.24, 0.46] |
| 1.6.2 Treatment effectiveness | 1 | 99 | Mean Difference (IV, Random, 95% CI) | 0.24 [‐0.00, 0.48] |
| 1.6.3 Personal control | 1 | 99 | Mean Difference (IV, Random, 95% CI) | 0.31 [0.01, 0.61] |
| 1.7 Patient‐oriented measures: knowledge of diabetes at the end of treatment | 1 | Mean Difference (IV, Random, 95% CI) | Subtotals only | |
| 1.7.1 Diagnosis | 1 | 83 | Mean Difference (IV, Random, 95% CI) | 0.80 [0.54, 1.06] |
| 1.7.2 Monitoring | 1 | 83 | Mean Difference (IV, Random, 95% CI) | 1.30 [0.92, 1.68] |
| 1.7.3 Hypoglycaemia | 1 | 83 | Mean Difference (IV, Random, 95% CI) | 1.10 [0.81, 1.39] |
| 1.7.4 Hyperglycaemia | 1 | 83 | Mean Difference (IV, Random, 95% CI) | 0.50 [0.22, 0.78] |
| 1.7.5 Medication: insulin | 1 | 83 | Mean Difference (IV, Random, 95% CI) | 1.40 [0.90, 1.90] |
| 1.7.6 Medication: oral | 1 | 83 | Mean Difference (IV, Random, 95% CI) | 0.70 [0.38, 1.02] |
| 1.7.7 Personal health habits | 1 | 83 | Mean Difference (IV, Random, 95% CI) | 1.40 [1.06, 1.74] |
| 1.7.8 Diet | 1 | 83 | Mean Difference (IV, Random, 95% CI) | 0.40 [0.07, 0.73] |
| 1.7.9 Exercise | 1 | 83 | Mean Difference (IV, Random, 95% CI) | 0.80 [0.49, 1.11] |
| 1.7.10 Chronic complications | 1 | 83 | Mean Difference (IV, Random, 95% CI) | 0.90 [0.59, 1.21] |
| 1.7.11 Living with diabetes and coping with stress | 1 | 83 | Mean Difference (IV, Random, 95% CI) | 0.60 [0.21, 0.99] |
| 1.8 Patient‐oriented measures: general knowledge of diabetes | 1 | Mean Difference (IV, Random, 95% CI) | Subtotals only | |
| 1.8.1 At the end of treatment | 1 | 97 | Mean Difference (IV, Random, 95% CI) | 15.82 [8.39, 23.25] |
| 1.8.2 At the end of follow‐up | 1 | 97 | Mean Difference (IV, Random, 95% CI) | 14.39 [7.45, 21.33] |
| 1.9 Patient‐oriented measures: self‐efficacy at the end of treatment | 1 | Mean Difference (IV, Random, 95% CI) | Subtotals only | |
| 1.9.1 Total | 1 | 96 | Mean Difference (IV, Random, 95% CI) | 19.00 [12.58, 25.42] |
| 1.9.2 Home blood glucose monitoring | 1 | 79 | Mean Difference (IV, Random, 95% CI) | 6.96 [‐2.87, 16.79] |
| 1.9.3 Diet | 1 | 97 | Mean Difference (IV, Random, 95% CI) | 0.74 [‐7.51, 8.99] |
| 1.9.4 Exercise | 1 | 96 | Mean Difference (IV, Random, 95% CI) | 3.64 [‐7.04, 14.32] |
| 1.10 Patient‐oriented measures: self‐efficacy at the end of follow‐up | 2 | Mean Difference (IV, Random, 95% CI) | Subtotals only | |
| 1.10.1 Total | 1 | 96 | Mean Difference (IV, Random, 95% CI) | 2.97 [‐3.43, 9.37] |
| 1.10.2 Home blood glucose monitoring | 1 | 79 | Mean Difference (IV, Random, 95% CI) | 11.28 [1.92, 20.64] |
| 1.10.3 Diet | 1 | 97 | Mean Difference (IV, Random, 95% CI) | 3.46 [‐4.32, 11.24] |
| 1.10.4 Exercise | 1 | 96 | Mean Difference (IV, Random, 95% CI) | 8.28 [‐2.04, 18.60] |
| 1.10.5 Diabetes self‐efficacy scale total | 1 | 44 | Mean Difference (IV, Random, 95% CI) | ‐0.57 [‐1.65, 0.51] |
| 1.11 Patient‐oriented measures: self‐management behaviour changes at the end of treatment | 2 | Risk Ratio (M‐H, Random, 95% CI) | Subtotals only | |
| 1.11.1 Checking feet | 1 | 83 | Risk Ratio (M‐H, Random, 95% CI) | 1.63 [1.01, 2.63] |
| 1.11.2 Using lotion | 1 | 83 | Risk Ratio (M‐H, Random, 95% CI) | 9.71 [2.45, 38.56] |
| 1.11.3 Wearing appropriate shoes and socks | 1 | 83 | Risk Ratio (M‐H, Random, 95% CI) | 4.39 [1.87, 10.32] |
| 1.11.4 Blood glucose self‐monitoring | 1 | 83 | Risk Ratio (M‐H, Random, 95% CI) | 1.20 [0.81, 1.79] |
| 1.11.5 Carries carbohydrate | 1 | 83 | Risk Ratio (M‐H, Random, 95% CI) | 1.90 [0.93, 3.87] |
| 1.11.6 Eye examination | 1 | 83 | Risk Ratio (M‐H, Random, 95% CI) | 1.48 [0.95, 2.29] |
| 1.11.7 Stopped smoking | 1 | 21 | Risk Ratio (M‐H, Random, 95% CI) | 0.81 [0.09, 7.58] |
| 1.12 Patient‐oriented measures: behavioural changes at the end of treatment | 1 | Mean Difference (IV, Random, 95% CI) | Subtotals only | |
| 1.12.1 Diet: general | 1 | 100 | Mean Difference (IV, Random, 95% CI) | 0.73 [0.10, 1.36] |
| 1.12.2 Diet: specific diet | 1 | 100 | Mean Difference (IV, Random, 95% CI) | 1.02 [0.42, 1.62] |
| 1.12.3 Exercise | 1 | 100 | Mean Difference (IV, Random, 95% CI) | 0.76 [‐0.11, 1.63] |
| 1.12.4 Home blood glucose monitoring | 1 | 100 | Mean Difference (IV, Random, 95% CI) | 2.13 [1.18, 3.08] |
| 1.12.5 Foot care | 1 | 100 | Mean Difference (IV, Random, 95% CI) | 0.19 [‐0.72, 1.10] |
| 1.13 Patient‐oriented measures: behavioural changes at the end of follow‐up | 2 | Mean Difference (IV, Random, 95% CI) | Subtotals only | |
| 1.13.1 Diet: general | 2 | 142 | Mean Difference (IV, Random, 95% CI) | 0.09 [‐0.46, 0.64] |
| 1.13.2 Diet: specific diet | 2 | 142 | Mean Difference (IV, Random, 95% CI) | 0.46 [‐0.02, 0.93] |
| 1.13.3 Exercise | 2 | 142 | Mean Difference (IV, Random, 95% CI) | 0.45 [‐0.28, 1.18] |
| 1.13.4 Home blood glucose monitoring | 2 | 142 | Mean Difference (IV, Random, 95% CI) | 0.62 [‐1.23, 2.48] |
| 1.13.5 Foot care | 2 | 142 | Mean Difference (IV, Random, 95% CI) | 0.06 [‐0.70, 0.83] |
| 1.14 Estimated GFR [mL/min/1.73 m2] | 1 | 179 | Mean Difference (IV, Random, 95% CI) | 0.46 [‐3.71, 4.63] |
| 1.15 Urinary albumin‐creatinine ratio [mg/g] | 1 | 179 | Mean Difference (IV, Random, 95% CI) | 0.35 [‐1.01, 1.71] |
| 1.16 Blood pressure [mm Hg] | 1 | Mean Difference (IV, Random, 95% CI) | Subtotals only | |
| 1.16.3 Systolic blood pressure | 1 | 179 | Mean Difference (IV, Random, 95% CI) | ‐11.12 [‐16.38, ‐5.86] |
| 1.16.4 Diastolic blood pressure | 1 | 179 | Mean Difference (IV, Random, 95% CI) | ‐5.43 [‐9.12, ‐1.74] |
| 1.17 Glycaemic events | 1 | Risk Ratio (M‐H, Random, 95% CI) | Subtotals only | |
| 1.17.1 Hypoglycaemia | 1 | 179 | Risk Ratio (M‐H, Random, 95% CI) | 0.85 [0.67, 1.08] |
| 1.17.2 Serious hypoglycaemia | 1 | 179 | Risk Ratio (M‐H, Random, 95% CI) | 0.08 [0.00, 1.33] |
| 1.18 Non‐fatal cardiovascular events | 2 | Risk Ratio (M‐H, Random, 95% CI) | Subtotals only | |
| 1.18.1 Total cardivascualar events | 1 | 110 | Risk Ratio (M‐H, Random, 95% CI) | 1.25 [0.45, 3.49] |
| 1.18.2 Stroke | 2 | 289 | Risk Ratio (M‐H, Random, 95% CI) | 4.06 [0.45, 36.26] |
| 1.18.3 Myocardial infarction | 2 | 289 | Risk Ratio (M‐H, Random, 95% CI) | 1.02 [0.35, 2.96] |
| 1.18.4 Heart failure | 1 | 179 | Risk Ratio (M‐H, Random, 95% CI) | 1.98 [0.18, 21.42] |
| 1.19 Quality of life | 2 | Std. Mean Difference (IV, Random, 95% CI) | Subtotals only | |
| 1.19.1 Patient Health Questionnaire (PHQ) stress score | 1 | 103 | Std. Mean Difference (IV, Random, 95% CI) | ‐0.47 [‐0.86, ‐0.08] |
| 1.19.2 KDQoL: physical composite summary | 1 | 42 | Std. Mean Difference (IV, Random, 95% CI) | 0.17 [‐0.44, 0.77] |
| 1.19.3 KDQoL: mental composite summary | 1 | 42 | Std. Mean Difference (IV, Random, 95% CI) | ‐0.33 [‐0.94, 0.28] |
| 1.19.4 KDQoL: kidney disease composite summary | 1 | 42 | Std. Mean Difference (IV, Random, 95% CI) | ‐0.37 [‐0.99, 0.24] |
| 1.19.5 KDQoL: general health composite summary | 1 | 42 | Std. Mean Difference (IV, Random, 95% CI) | ‐0.08 [‐0.69, 0.53] |
| 1.20 Lipids [mmol/L] | 1 | Mean Difference (IV, Random, 95% CI) | Subtotals only | |
| 1.20.1 Total cholesterol | 1 | 179 | Mean Difference (IV, Random, 95% CI) | ‐0.35 [‐0.63, ‐0.07] |
| 1.20.2 HDL cholesterol | 1 | 179 | Mean Difference (IV, Random, 95% CI) | ‐0.03 [‐0.09, 0.03] |
| 1.20.3 LDL cholesterol | 1 | 179 | Mean Difference (IV, Random, 95% CI) | ‐0.40 [‐0.65, ‐0.14] |
| 1.20.4 Triglycerides | 1 | 179 | Mean Difference (IV, Random, 95% CI) | 0.07 [‐0.38, 0.52] |
| 1.21 Adverse events: non‐fatal (including hypoglycaemic and CVD events) | 1 | 179 | Risk Ratio (M‐H, Random, 95% CI) | 1.03 [0.89, 1.18] |
| 1.22 Serious adverse events: emergency hospitalisation or death (including serious hypoglycaemic and CVD events) | 2 | 289 | Risk Ratio (M‐H, Random, 95% CI) | 0.76 [0.36, 1.62] |
Comparison 2. Multidisciplinary, multifactorial education programmes versus routine care.
| Outcome or subgroup title | No. of studies | No. of participants | Statistical method | Effect size |
|---|---|---|---|---|
| 2.1 HbA1c [%] | 1 | 120 | Mean Difference (IV, Random, 95% CI) | ‐0.40 [‐1.00, 0.20] |
| 2.2 Kidney failure | 1 | 120 | Risk Ratio (M‐H, Random, 95% CI) | 0.47 [0.22, 1.01] |
| 2.3 Estimated GFR [mL/min/1.73 m2] | 1 | 120 | Mean Difference (IV, Random, 95% CI) | 2.03 [‐3.44, 7.50] |
| 2.4 Blood pressure [mm Hg] | 1 | Mean Difference (IV, Random, 95% CI) | Subtotals only | |
| 2.4.1 Systolic blood pressure | 1 | 120 | Mean Difference (IV, Random, 95% CI) | ‐0.19 [‐6.41, 6.03] |
| 2.4.2 Diastolic blood pressure | 1 | 120 | Mean Difference (IV, Random, 95% CI) | ‐3.40 [‐8.02, 1.22] |
| 2.5 Glycaemic events | 2 | Risk Ratio (M‐H, Random, 95% CI) | Subtotals only | |
| 2.5.1 Hypoglycaemia | 2 | 210 | Risk Ratio (M‐H, Random, 95% CI) | 0.57 [0.10, 3.36] |
| 2.5.2 Hyperglycaemia | 1 | 90 | Risk Ratio (M‐H, Random, 95% CI) | 0.14 [0.02, 1.11] |
| 2.6 Lipids [mg/dL] | 1 | Mean Difference (IV, Random, 95% CI) | Subtotals only | |
| 2.6.1 HDL cholesterol | 1 | 120 | Mean Difference (IV, Random, 95% CI) | 0.03 [‐4.39, 4.45] |
| 2.6.2 LDL cholesterol | 1 | 120 | Mean Difference (IV, Random, 95% CI) | ‐5.87 [‐20.11, 8.37] |
Characteristics of studies
Characteristics of included studies [ordered by study ID]
C‐DIRECT 2019.
| Study characteristics | ||
| Methods | Study design
|
|
| Participants | Study characteristics
Baseline characteristics
|
|
| Interventions | Intervention group (Education + self‐management)
Control group (usual care)
Co‐intervention
|
|
| Outcomes | Reported outcomes
|
|
| Notes | Additional information
|
|
| Risk of bias | ||
| Bias | Authors' judgement | Support for judgement |
| Random sequence generation (selection bias) | Unclear risk | Quote: "Patients were randomised according to dialysis shifts." Quote: "Randomizing by shifts rather than dialysis centres can also potentially control for differences across centres (number of beds; layout of space, etc) that may introduce unforeseen bias across study arms. Block Randomisation was undertaken following baseline assessment, using a random number sequence produced by a computer‐generated program (randomizer.org)." |
| Allocation concealment (selection bias) | Unclear risk | Method of allocation concealment was not reported in sufficient detail to permit judgement |
| Blinding of participants and personnel (performance bias) All objective outcomes | Unclear risk | Quote: "Assessors that collected and analysed the data were independent to study care team and remained blind to study arm allocation by use of study codes. It was not possible to blind facilitators and patients as the intervention required input by these parties." Comment: an open‐label study is considered as high risk of bias. However, objective outcomes may not be influenced |
| Blinding of participants and personnel (performance bias) All subjective outcomes | High risk | Quote: "Assessors that collected and analysed the data were independent to study care team and remained blind to study arm allocation but use of study codes. It was not possible to blind facilitators and patients as the intervention required input by these parties." Comment: an open‐label study is considered high risk of bias |
| Blinding of outcome assessment (detection bias) All objective outcomes | Low risk | Quote: "Assessors that collected and analysed the data were independent to study care team and remained blind to study arm allocation but use of study code.". Comment: the objective outcomes wouldn't be influenced by blinding |
| Blinding of outcome assessment (detection bias) All subjective outcomes | Low risk | Quote: "Assessors that collected and analysed the data were independent to study care team and remained blind to study arm allocation but use of study code." |
| Incomplete outcome data (attrition bias) All outcomes | Low risk | Quote: "Of the 44 recruited at baseline, 42 patients were evaluated at follow‐up." "All patients completed the three sessions of the program. At the conclusion of the study, the follow‐up questionnaire was completed by N= 42 (retention rate = 95.5%) of patients. One patient in the intervention discontinued the study due to health deterioration and prolonged hospitalisation and one patient in usual care died." Comment: 19/20 participants in the intervention group and 23/24 participants in the control group completed the study and were included in the analysis; < 5% loss to follow‐up. Reasons were provided and probably were not related to discontinuation. No imbalance between treatment groups was reported |
| Selective reporting (reporting bias) | High risk | Prespecified outcomes were reported. Some outcomes reported in the protocol were not reported. Clinically relevant outcomes that would be expected for this type of intervention were not reported |
| Other bias | Low risk | Quote: "The funding body was not involved in designing the study, collection, analysis, and interpretation of data, and in writing of the manuscript." Comment: similar baseline characteristics were reported between treatment groups. Funding did not influence data analysis and interpretation |
Fogelfeld 2017.
| Study characteristics | ||
| Methods | Study design
|
|
| Participants | Study characteristics
Baseline characteristics
Co‐morbidities
|
|
| Interventions | Intervention group (Multifactorial‐multidisciplinary intervention)
Control group (usual care)
Co‐interventions or additional treatments
Duration of treatments and follow‐up details
|
|
| Outcomes | Reported outcomes
|
|
| Notes | Additional information
|
|
| Risk of bias | ||
| Bias | Authors' judgement | Support for judgement |
| Random sequence generation (selection bias) | Unclear risk | Quote: "The ... study was a stratified randomized controlled trial" Quote: "Patients were randomized into eGFR striatae based on baseline estimated eGFRs, calculated using MDRD equation (Levey et al., 2006)" Comment: limited information is provided on the details of how the randomisation method was undertaken |
| Allocation concealment (selection bias) | Unclear risk | Comment: No information provided regarding concealment of allocation of groups |
| Blinding of participants and personnel (performance bias) All objective outcomes | Low risk | Quote: "The study did not allow for blinding" Comment: no mention of blinding or blinding details for the participants' or personnel. This study would have been hard to blind participants and personal and adequately conceal what group they are in. The objective outcomes reported probably would not change due to blinding |
| Blinding of participants and personnel (performance bias) All subjective outcomes | High risk | Quote: "The study did not allow for blinding" Comment: no mention of blinding or blinding details for the participants or personnel. The study did not plan to blind anyone. This may introduce potential bias for any of the self‐reported outcomes |
| Blinding of outcome assessment (detection bias) All objective outcomes | Low risk | Quote: "The study did not allow for blinding" Comment: no mention of blinding or blinding details for the outcome assessors. Due to the design of the study, it was open‐label. The objective outcomes reported in this study would probably not be influenced by lack of blinding, and knowledge of the assigned intervention would not impact the outcome measures |
| Blinding of outcome assessment (detection bias) All subjective outcomes | High risk | Quote: "The study did not allow for blinding" Comment: no mention of blinding details for the outcome assessors. The subjective outcomes reported could be influenced by lack of blinding, and knowledge of the assigned intervention could impact the outcome measures |
| Incomplete outcome data (attrition bias) All outcomes | Unclear risk | Comment: all participants were accounted for from start to end of the trial. Attrition rates were low to moderate in each group: multifactorial education intervention group (23%); usual care control group (12%) |
| Selective reporting (reporting bias) | Unclear risk | Comment: all planned outcomes in the methods were reported in the results; no access to a priori published protocol |
| Other bias | High risk | Conflicts of interest/disclosures: "The authors have nothing to disclose". "No other potential conflicts of interest relevant to this article were reported" Funding: "The study was supported in part as an investigator initiated trial by Sanofi" Comment: pharmaceutical industry funding |
Guo 2022.
| Study characteristics | ||
| Methods | Study design
|
|
| Participants | Study characteristics
Baseline characteristics
Co‐morbidities
|
|
| Interventions | Intervention group (multifactorial‐multidisciplinary intervention)
Control group(usual care)
Co‐interventions or additional treatments
Duration of treatments and follow‐up details
|
|
| Outcomes | Reported outcomes
|
|
| Notes | Additional information
|
|
| Risk of bias | ||
| Bias | Authors' judgement | Support for judgement |
| Random sequence generation (selection bias) | Unclear risk | Quote: "The subjects were divided into combined group and routine group by random number table method." Comment: details not reported |
| Allocation concealment (selection bias) | Unclear risk | Insufficient information to permit judgement |
| Blinding of participants and personnel (performance bias) All objective outcomes | Unclear risk | Blinding of outcomes assessors not reported |
| Blinding of participants and personnel (performance bias) All subjective outcomes | High risk | Open‐label study; blinding of outcomes assessors not reported |
| Blinding of outcome assessment (detection bias) All objective outcomes | Unclear risk | Blinding of outcomes assessors not reported |
| Blinding of outcome assessment (detection bias) All subjective outcomes | High risk | Open‐label study; blinding of outcomes assessors not reported |
| Incomplete outcome data (attrition bias) All outcomes | Low risk | Comment: all participants were accounted for from start to end of the trial |
| Selective reporting (reporting bias) | Unclear risk | Insufficient information to permit judgement |
| Other bias | Unclear risk | Insufficient information to permit judgement |
Kopf 2012.
| Study characteristics | ||
| Methods | Study design
|
|
| Participants | Study characteristics
Baseline Characteristics
Co‐morbidities (intervention group/control group)
|
|
| Interventions | Intervention (Mindfulness‐based stress reduction intervention)
Control (Standard care)
Co‐interventions or additional treatments
|
|
| Outcomes | Reported outcomes
|
|
| Notes | Additional information
|
|
| Risk of bias | ||
| Bias | Authors' judgement | Support for judgement |
| Random sequence generation (selection bias) | Low risk | Quote: "Participants were randomly assigned to one of the 2 groups in a 1:1 ratio" |
| Allocation concealment (selection bias) | Unclear risk | Comment: no information provided |
| Blinding of participants and personnel (performance bias) All objective outcomes | Low risk | Comment: open‐label study. The objective outcomes reported are not likely to be influenced by lack of blinding. It is unlikely that knowledge of the assigned intervention from participants and personnel would impact the outcome measures |
| Blinding of participants and personnel (performance bias) All subjective outcomes | High risk | Comment: open‐label study. The subjective outcomes reported could be influenced by lack of blinding, and knowledge of the assigned intervention could impact the outcome measures. For example, QoL, which is self‐reported |
| Blinding of outcome assessment (detection bias) All objective outcomes | Low risk | Comment: open‐label study. Even though this was open‐label, it is unlikely that knowledge of the assigned intervention from outcomes assessors would impact the outcome measures |
| Blinding of outcome assessment (detection bias) All subjective outcomes | High risk | Comment: open‐label study. The subjective outcomes reported could be influenced by lack of blinding, and knowledge of the assigned intervention could impact the outcome measures, for example, QoL, which is self‐reported. It is unclear what the role of the outcome assessors was for this |
| Incomplete outcome data (attrition bias) All outcomes | High risk | Comment: loss‐to‐follow‐up at 12 months was 1 intervention and 6 in control groups (reasons not provided) Comment: higher proportion of patients with a history of MI in the intervention group compared to the control group at baseline (22.0% vs. 4.26%) Comment: 9 patients in the intervention group did not attend the training sessions as required (less than 5 sessions). Therefore, a per‐protocol analysis was performed at 12 months. For the intervention group, 52 were included in the ITT analysis, and 43 were included in the per‐protocol analysis at 12 months. At 3 years, 7 dropped out (lost interest) in the control group vs. 3 lost interest in the intervention group |
| Selective reporting (reporting bias) | Unclear risk | Comment: results missing for outcomes recorded at baseline (the anxiety and eating disorder components of the PHQ) A priori‐published protocol: No protocol. Supplementary material provides further details (doi:10.1007/s00592‐013‐0542‐2) |
| Other bias | Unclear risk | Comment: possible selection bias for outcome, myocardial Infarction had a significant imbalance at baseline (intervention= 11 (22%); control= 2 (4.26%). Conflicts of interest/disclosures: "None". Funding: "This study was supported by the Manfred Lautenschläger Foundation and Dietmar Hopp Foundation (both to P. Nawroth) and the Deutsches Zentrum für Diabetesforschund (DZD) in cooperation with the Institute for Diabetes Research and Metabolic Diseases (to H‐U. Häring, University of Tübingen, Germany). The Manfred Lautenschläger Foundation is a privately sourced foundation to this project. The funding was used to support physicians and study nurses as well as laboratory materials. The Dietmar Hopp Foundation is a privately sourced foundation supporting part of this study with laboratory materials. The Deutsches Zentrum für Diabetesforschung is funded by the Federal Ministry of Education and Research (BMBF). The funders had no role in study design, data collection and analysis, decision to publish, or preparation of the manuscript." |
McMurray 2002.
| Study characteristics | ||
| Methods | Study design
|
|
| Participants | Study characteristics
Baseline characteristics
Co‐morbidities
|
|
| Interventions | Intervention group (education + routine treatment)
Control group (routine treatment)
Co‐interventions or additional treatments
Duration of interventions
|
|
| Outcomes | Reported outcomes
|
|
| Notes | Additional information
|
|
| Risk of bias | ||
| Bias | Authors' judgement | Support for judgement |
| Random sequence generation (selection bias) | High risk | Quote: "Patients meeting inclusion criteria were randomly assigned to control or study groups. At the Jefferson unit, randomization occurred by assigning patients who underwent HD Monday, Wednesday, and Friday to the study group and Tuesday, Thursday, and Saturday to the control group. At the Marion unit, the reverse schedule was used for randomization. Patients undergoing PD were numerically randomized" Comment: the study states that it was randomised, but no details of the randomisation sequence are provided. Furthermore, patients were randomised according to the day of the week that they underwent surgery (the justification being allocation concealment). For PD patients, insufficient detail was provided, but they were said to be "numerically randomized." Quote: "Because the HD treatment environment is a close‐knit one, separation of the control and study groups by treatment days was chosen in hopes of reducing knowledge diffusion and discussion among patients between the two groups. It also was important to remove any physician biases" Quote: "Because the HD treatment environment is a close‐knit one, separation of the control and study groups by treatment days was chosen in hopes of reducing knowledge diffusion and discussion among patients between the two groups. It also was important to remove any physician biases" Quote: "Patients undergoing PD were numerically randomized" |
| Allocation concealment (selection bias) | Unclear risk | Quote: "Because the HD treatment environment is a close‐knit one, separation of the control and study groups by treatment days was chosen in hopes of reducing knowledge diffusion and discussion among patients between the two groups. It also was important to remove any physician biases" Comment: no information about allocation concealment methods was described. Separation of the control and study groups by treatment days may have helped conceal which treatment groups they were in, but this is unclear |
| Blinding of participants and personnel (performance bias) All objective outcomes | Low risk | Quote: "Because the HD treatment environment is a close‐knit one, separation of the control and study groups by treatment days was chosen in hopes of reducing knowledge diffusion and discussion among patients between the two groups. It also was important to remove any physician biases. Physicians in the dialysis facility cared for patients in either the study group or control group. There was no crossover of physician care" Comment: it appears that participants were blinded to treatment groups |
| Blinding of participants and personnel (performance bias) All subjective outcomes | Low risk | Comment: appears that participants were blinded to treatment groups |
| Blinding of outcome assessment (detection bias) All objective outcomes | Low risk | Quote: "Physicians in the dialysis facility cared for patients in either the study group or control group. There was no crossover of physician care." Comment: somewhat unclear description of whether the physicians were blinded. Very unclear if other outcomes assessors were blinded |
| Blinding of outcome assessment (detection bias) All subjective outcomes | High risk | Quote: "Physicians in the dialysis facility cared for patients in either the study group or control group. There was no crossover of physician care." Comment: unclear description of whether the physicians were blinded and other outcomes assessors. The subjective outcomes reported could be influenced by lack of blinding, and knowledge of the assigned intervention could impact the outcome measures |
| Incomplete outcome data (attrition bias) All outcomes | Low risk | Comment: no loss to follow‐up |
| Selective reporting (reporting bias) | Unclear risk | Comment: all outcomes planned in the methods were reported in the results; clinically important outcomes were unstated, such as CV disease incidence. There was no a priori protocol or trial registration. Trial registration: not reported, unable to locate online |
| Other bias | Unclear risk | Comment: conflicts of interest or disclosures are not reported |
MEMO 2011.
| Study characteristics | ||
| Methods | Study design
|
|
| Participants | Study information
Baseline characteristics
Co‐morbidities (mean ± SD)
|
|
| Interventions | Intervention group (self‐management & patient education)
Control group (usual care)
Co‐interventions or additional treatments
Duration of treatments
|
|
| Outcomes | Reported outcomes
|
|
| Notes | Additional information
|
|
| Risk of bias | ||
| Bias | Authors' judgement | Support for judgement |
| Random sequence generation (selection bias) | Unclear risk | Comment: no information provided regarding random sequence generation methods |
| Allocation concealment (selection bias) | Unclear risk | Comment: method of concealment not adequately described |
| Blinding of participants and personnel (performance bias) All objective outcomes | Low risk | Comment: the study was not blinded. The objective outcomes reported probably would not be influenced by blinding. This study would also be hard to adequately blind participants without knowing what group they are in |
| Blinding of participants and personnel (performance bias) All subjective outcomes | High risk | Quote: "Data on adverse events, serious adverse events or relevant clinical outcomes were obtained by self‐report and from letters of primary care physicians, specialist clinic letters or hospital discharge summaries" Comment: the study was not blinded. Some outcomes were subjective, for example, hypoglycaemia, which was self‐reported, and could be influenced by lack of blinding |
| Blinding of outcome assessment (detection bias) All objective outcomes | Low risk | Quote: "Data was recorded separately and assessed independently by a research physician who was not aware of the study participant’s treatment allocation and was not involved with any aspect of the study" Quote: "Biomedical measures in both groups were obtained at baseline, 6, 12 and 18 months under standard operating procedures, by a trained research assistant who was blinded to the participant’s treatment assignment and independent of the study team." |
| Blinding of outcome assessment (detection bias) All subjective outcomes | Low risk | Quote: "Data was recorded separately and assessed independently by a research physician who was not aware of the study participant’s treatment allocation and was not involved with any aspect of the study" |
| Incomplete outcome data (attrition bias) All outcomes | Low risk | Comment: all participants were accounted for from the start to the end of the trial. Flow chart provides reasons for dropouts or withdrawals. Attrition rate was low (< 10% in each arm) |
| Selective reporting (reporting bias) | Unclear risk | Comment: all outcomes planned in the methods are reported in the results. No protocol has been published. Trial registration provided |
| Other bias | Unclear risk | Comment: potential selection bias due to some participants being recruited from specialist clinic settings (i.e. receiving more intensive treatment). Sub‐analysis of these participants was not provided Conflicts of interest/disclosures: "The authors declare that they have no conflict of interest" Funding: "The MEMO study was funded by a fellowship grant provided by Kidney Research, UK. The study is supported by the NIHR Collaborations for Leadership in Applied Health Research and Care (CLAHRC) for Leicestershire, Northamptonshire & Rutland, University Hospitals of Leicester" |
MESMI 2010.
| Study characteristics | ||
| Methods | Study design
|
|
| Participants | Study characteristics
Baseline characteristics
|
|
| Interventions | Intervention group (multifactorial, including education)
Control group (usual care)
Co‐interventions or additional treatments
Duration of treatments
|
|
| Outcomes | Reported outcomes
|
|
| Notes | Additional information
|
|
| Risk of bias | ||
| Bias | Authors' judgement | Support for judgement |
| Random sequence generation (selection bias) | Low risk | Quote: "Following recruitment, participants were allocated code numbers prior to enrolment and being randomised to the intervention or control group (1:1 ratio) by an off‐site statistician. A stratified block randomisation was conducted according to gender, age and systolic blood pressure (£140 vs >140 mmHg) recorded at recruitment" |
| Allocation concealment (selection bias) | Low risk | Quote: "People collecting data and assessing outcomes were blinded to group assignment." Quote: "The research assistant was trained to collect data and was blinded to group assignment" Quote: "The identity of all participants who were enrolled and randomised to receive the intervention was kept in a locked cabinet in the chief researcher’s office" Quote: "Following recruitment, participants were allocated code numbers prior to enrolment and being randomised to the intervention or control group (1:1 ratio) by an off‐site statistician" |
| Blinding of participants and personnel (performance bias) All objective outcomes | Low risk | Quote: "Participants in the intervention group could not be blinded and were asked to not disclose their group allocation to the research assistant during data collection" Comment: not possible to blind participants and personnel to behavioural treatment care. It is unlikely that blinding would effect the objective outcomes reported |
| Blinding of participants and personnel (performance bias) All subjective outcomes | High risk | Quote: "Participants in the intervention group could not be blinded and were asked to not disclose their group allocation to the research assistant during data collection" Comment: not possible to blind participants and personnel to behavioural treatment care. The subjective outcomes reported, such as blood pressure, which was reported daily by patients, could be influenced by blinding |
| Blinding of outcome assessment (detection bias) All objective outcomes | Low risk | Quote: "People collecting data and assessing outcomes were blinded to group assignment."Quote: "The research assistant was trained to collect data and was blinded to group assignment" Comment: study personnel and outcome assessors were blinded |
| Blinding of outcome assessment (detection bias) All subjective outcomes | Low risk | Quote: "People collecting data and assessing outcomes were blinded to group assignment."Quote: "The research assistant was trained to collect data and was blinded to group assignment" Comment: study personnel and outcome assessors were blinded |
| Incomplete outcome data (attrition bias) All outcomes | Low risk | Comment: all participants were accounted for from start to end of the trial. Attrition rates were low: education (7.7%), usual care (4.8%) Quote: "The results show a constant improvement in eGFR and serum creatinine (measures of kidney function) in both groups. It is important to mention that not all participants had their blood test results included in this study because tests conducted in primary care were not always recorded in the participant’s hospital medical history" Comment: unclear how this impacts final results; potentially doesn't matter as we recalculated ITT according to Cochrane Handbook using Case Available Analysis (dichotomous data) or Last Observation Carried Forward (continuous data) |
| Selective reporting (reporting bias) | Low risk | Comment: all outcomes planned in the methods were reported in the results. Trial registration and a priori‐published protocol were reported (matching). Some data represented in graphical form, unable to extract A priori published protocol: published |
| Other bias | Unclear risk | Comment: no pharmaceutical industry funding, and authors are clear of conflicts of interest Conflicts of Interests/Disclosures: "No conflict of interest has been declared by the authors" Funding declared: "This research was supported by an Australian Research Council (Linkage) Grant (LP0774989), Sigma Theta Tau International Small Grant, Nurses Memorial Centre Australian Legion of Ex‐ Servicemen and Women Scholarship, and the Mona Menzies Nurses Board of Victoria Grant" Comment: possible selection bias? Patients who lived more than 50km from Melbourne city centre were excluded Quote: "Over the duration of the study, participants in both groups were made more aware of their high blood pressure taken during data collection in the home, and changes to antihypertensive medications were common in both groups as a result of regular medical consultations. Additionally, the research assistant administered all survey questions that may have incurred a positive response bias" Comment: potential positive response bias Quote: "We had to modify our original inclusion criteria to improve the rate of recruitment because of difficulties obtaining standard information across diabetes and nephrology patients’ medical records. For example, some patients did not have microalbumin/creatinine ratios taken as part of routine care, and we reduced the presence of systolic hypertension for the previous clinic visit rather than the previous two clinic visits" Comment: orginal inclusion criteria was modified after the study had started. Possibly an issue with study design rather than bias? |
Steed 2005.
| Study characteristics | ||
| Methods | Study design
|
|
| Participants | Study characteristics
Baseline characteristics
Co‐morbidities
|
|
| Interventions | Intervention group (education + routine treatment)
Control group (routine treatment)
Co‐interventions or additional treatments
Treatment period
|
|
| Outcomes | Reported outcomes
|
|
| Notes | Additional information
|
|
| Risk of bias | ||
| Bias | Authors' judgement | Support for judgement |
| Random sequence generation (selection bias) | Unclear risk | Quote: " Randomization method was by allocating participants alternately to control or intervention group" Comment: insufficient information provided about randomisation methods |
| Allocation concealment (selection bias) | Unclear risk | Quote: "Although alternate allocation does not ensure allocation concealment, this method was used in order to ensure a smooth flow of participants into the intervention group for organisational reasons. The analysis of baseline data demonstrated that there were no significant differences between the two groups." Comment: insufficient information provided to be sure whether the allocation of treatment groups was adequately concealed |
| Blinding of participants and personnel (performance bias) All objective outcomes | Low risk | Quote: "The questionnaires for both intervention and control group were completed within the diabetes clinics and administered by a research fellow. Although this individual was not involved in the delivery of the intervention, it was not possible for them to be blinded to group allocation" Comment: while this was an unblinded trial, the objective outcomes reported, such as a change in HbA1c%, were likely not influenced by whether the participants' and personnel were blinded or not |
| Blinding of participants and personnel (performance bias) All subjective outcomes | High risk | Quote: "The questionnaires for both intervention and control group were completed within the diabetes clinics and administered by a research fellow. Although this individual was not involved in the delivery of the intervention it was not possible for them to be blinded to group allocation" Comment: unblinded trial. The subjective self‐reported outcomes in this study could have been influenced by lack of blinding of participants and personnel |
| Blinding of outcome assessment (detection bias) All objective outcomes | Low risk | Quote: "The questionnaires for both intervention and control group were completed within the diabetes clinics and administered by a research fellow. Although this individual was not involved in the delivery of the intervention, it was not possible for them to be blinded to group allocation" Comment: unblinded trial. Baseline measures were by self‐report and the research fellow involved was unblinded to group allocation. Unclear if other outcomes assessors were blinded, but it's unlikely that objective outcomes would be influenced by this |
| Blinding of outcome assessment (detection bias) All subjective outcomes | High risk | Quote: "The questionnaires for both intervention and control group were completed within the diabetes clinics and administered by a research fellow. Although this individual was not involved in the delivery of the intervention it was not possible for them to be blinded to group allocation" Comment: unblinded trial. Baseline measures were by self‐report, and the research fellow who administered this was unblinded to group allocation. Unclear if other outcomes assessors were blinded |
| Incomplete outcome data (attrition bias) All outcomes | High risk | Quote: "Attrition at follow‐up assessments was 9 per cent at immediate post‐intervention (4 participants control group, 9 participants intervention group) and 17 per cent at 3‐month follow‐up (8 participants control group, 12 participants intervention group). Individuals who did and did not complete follow‐up assessments did not differ significantly at baseline" Comment: all participants were accounted for from start to end of the trial Comment: total attrition from baseline to end of the trial was high (28%) Comment: attrition at follow‐up existed. They mention that individuals who did and did not complete follow‐up assessments did not differ significantly at baseline. For one outcome (efficacy of self‐management programme), the study reports that drop‐outs had significantly higher baseline HbA1c than programme completers. There is potential for selection bias |
| Selective reporting (reporting bias) | Unclear risk | Comment: all methods‐planned outcomes were reported in the results. However, no trial registration or a priori‐published protocol was provided. Some patient‐related outcomes, such as information on adverse events, the incidence of kidney death, or changes in functional measures, were not stated A priori‐published protocol: none reported |
| Other bias | Unclear risk | Comment: there was insufficient information to make any judgement Conflicts of Interest/Disclosures: the authors declared no competing interests Funding declared: "This research was supported by a health services research fellowship from the North Thames Region of the National Health Service, UK to the first author" |
ACEi: angiotensin‐converting‐enzyme inhibitors; ACR: albumin/creatinine ratio; BP: blood pressure; CKD: chronic kidney disease; CVD: cardiovascular disease; DBP: diastolic BP; DDFQ: Dialysis Diet and Fluid Non‐Adherence Questionnaire; DESMOND: Diabetes Education and Self‐Management for Ongoing and Newly Diagnosed; DKD: diabetic kidney disease; DM: diabetes mellitus; eGFR: estimated glomerular filtration rate; ESKD: end‐stage kidney disease; HADS: Hospital Anxiety and Depression Scale; Hb: haemoglobin; HbA1c: glycolated haemoglobin; HD: haemodialysis; HDL: high‐density lipoprotein; HEIQ: Health Education Impact Questionnaire; ITT: intention‐to‐treat; KDQoL‐SF: Kidney Disease Quality of Life‐Short Form; KRT: kidney replacement therapy; LDL: low‐density lipoprotein; LVEF: left ventricular ejection fraction; MCS: mental component summary; NICE: Natioanl Institute of Clinical Excellence; NYHA: New York Heart Association; PAID: Problem Areas in Diabetes Scale; PCS: physical component summary; PD: peritoneal dialysis; QoL: quality of life; SBP: systolic BP; SCr: serum creatinine; SAS: Self‐Rating Anxiety Scale; SDSCA: Summary of Diabetes Self‐Care Activities; T1DM: type 1 DM; T2DM: type 2 DM; UACR: urinary albumin‐creatinine ratio; UAER: urinary albumin excretion ratio
Characteristics of excluded studies [ordered by study ID]
| Study | Reason for exclusion |
|---|---|
| Ali 2024 | Wrong population: T2DM participants with hypertension, no CKD |
| Bao 2021 | Study retracted 2022 |
| Binik 1993 | Wrong population: non‐diabetic participants included; primary causes of ESKD were not specified |
| Briggs 2004 | Wrong population: included participants with chronic illnesses, not just those with both DM and CKD |
| Calikoglu 2023 | Wrong population: T2DM participants, no CKD |
| CAPTION 2010 | Wrong population: hypertensive participants with CKD or DM, not necessarily both |
| Cortes‐Sanabria 2008 | Wrong population: non‐co‐existing DM and CKD participants included, no separate data for those with DKD available |
| DePatis 2019 | Wrong population: not all participants met CKD requirements |
| Devins 2003 | Wrong population: non‐diabetic participants included; primary causes of CKD were not specified |
| Didjurgeit 2002 | Wrong population: included non‐CKD participants and those with other diabetic complications (e.g. diabetic retinopathy) instead of DKD; no separate data for those with DKD available |
| DNETT‐Japan 2010 | Wrong intervention: usual care versus multifactorial intervention (which includes treatment and pharmacological treatments); outcome measures do not report according to the effect of the educational intervention |
| Dong 2019 | Wrong intervention: both groups undertook educational programmes as part of their therapy |
| Du 2022a | Wrong population: included overweight participants with and without CKD and diabetes |
| Ford 2004 | Wrong population: non‐diabetic participants included; primary causes of ESKD were not specified |
| FROM‐J 2010 | Wrong population: not all participants had DM |
| GP‐Prompt 2018 | Wrong population: health care professional training |
| Hall 2004 | Wrong population: non‐diabetic participants included; primary causes of ESKD were not specified |
| Helou 2016 | Wrong intervention: usual care versus multidisciplinary interventions in a cross‐over design |
| HHK 2018 | Wrong intervention: four groups all receiving usual care + a different additional type of multidisciplinary treatment |
| Hoto 2010 | Wrong intervention: more than just education (e.g. transport arrangement to local pharmacy if required) |
| Kawabata 2022 | Wrong population: non‐co‐existing DM and CKD participants included; no separate data for those with DKD available |
| Kawai 2021 | Wrong intervention: electronic prompting via a smart‐phone |
| Korniewicz 1994 | Wrong population: non‐diabetic participants included; primary causes of ESKD were not specified |
| Kuningas 2020 | Wrong population: non‐diabetic kidney transplant recipients |
| Leon 2006 | Wrong intervention: confounding with drug therapy (e.g. educational programme+other drugs+routine treatment versus routine treatment); primary causes of ESKD were not specified |
| Leung 2005 | Wrong intervention: compared a healthcare protocol for healthcare professionals |
| Lim 2021a | Wrong population: non‐CKD participants included |
| Litvin 2020 | Wrong population: healthcare professional training |
| Manns 2005 | Wrong population: non‐diabetic participants included; primary causes of ESKD were not specified |
| MDRD Study 1 1989 | Wrong population: non‐co‐existing DM and CKD participants included; no separate data for those with DKD available; primary causes of CKD were not specified |
| Naimark 2001 | Wrong population: healthcare professional screening |
| NCT05319600 | Wrong intervention: technology‐delivered activity programme |
| NCT05357742 | Wrong intervention: both groups received a manualised study intervention for DKD |
| NCT06325917 | Wrong population: T2DM participants; CKD participants excluded |
| NCT06444074 | Wrong population: T2DM participants; CKD participants excluded |
| Nelson 2018 | Wrong population: non‐co‐existing DM and CKD participants included |
| Nozaki 2005 | Wrong population: non‐co‐existing DM and CKD participants included; primary causes of ESKD were not specified |
| Osaki 2017 | Wrong intervention: both groups undertook educational programmes as part of their therapy |
| Othman 2022 | Wrong population: post‐transplant diabetes |
| Othman 2024 | Wrong population: post‐transplant diabetes |
| PANDIA‐IRIS 2021 | Wrong intervention: electronic monitoring of medication adherence |
| QICKD 2009 | Wrong intervention: compared a healthcare protocol for healthcare professionals |
| Rachmani 2005 | Wrong population: DM participants, no CKD |
| REDEEM 2013 | Wrong population: DM participants, no CKD |
| Roddy 2022 | Wrong population: non‐CKD participants included |
| Shi 2020 | Wrong population: non‐CKD participants included |
| STENO‐2 1999 | Wrong intervention: usual care versus multifactorial intervention (which includes treatment and pharmacological treatments); outcome measures do not report according to the effect of the educational intervention |
| STOP‐DKD 2018 | Wrong intervention: usual care versus multifactorial intervention (which includes treatment and pharmacological treatments); outcome measures do not report according to the effect of the educational intervention |
| SURE 2009 | Wrong intervention: usual care versus multifactorial intervention (which includes treatment and pharmacological treatments); outcome measures do not report according to the effect of the educational intervention |
| Tan 2019 | Wrong population: non‐CKD participants included |
| Tsay 2003 | Wrong population: non‐co‐existing DM and CKD participants included; primary causes of ESKD were not specified |
| Tsay 2004c | Wrong population: non‐co‐existing DM and CKD participants included; primary causes of ESKD were not specified |
| Tsay 2005 | Wrong population: non‐co‐existing DM and CKD participants included; primary causes of ESKD were not specified |
| Tsuji‐Hayashi 2000 | Wrong population: non‐co‐existing DM and CKD participants included; primary causes of ESKD were not specified |
| Tuot 2018 | Wrong population: healthcare professional training |
| Ueki 2021 | Wrong population: non‐CKD participants included |
| Woolf 2017 | Wrong population: non‐co‐existing DM and CKD participants included |
| Yalcin 2008 | Wrong population: T2DM participants, no CKD |
| Zhu 2021 | Wrong population: T2DM participants, no CKD |
CKD: chronic kidney disease; DKD: diabetic kidney disease; DM: diabetes mellitus; ESKD: end‐stage kidney disease; HD: haemodialysis; PD: peritoneal dialysis; T2DM: type 2 DM
Characteristics of studies awaiting classification [ordered by study ID]
NCT00782847.
| Methods | Study design
|
| Participants | Study characteristics
|
| Interventions | Intervention group (behavioural)
Control group
|
| Outcomes | Planned outcomes
|
| Notes | Study completed January 2007; no data posted Sponsor: DiaNe HCM GmbH |
Suvamat 2023.
| Methods | Study design
|
| Participants | Study characteristics
Baseline characteristics
|
| Interventions | Intervention group
Control group
|
| Outcomes | Reported outcomes
|
| Notes | Additional information
|
BMI: body mass index; BP: blood pressure; CKD: chronic kidney disease; DKD: diabetic kidney disease; DM: diabetes mellitus; eGFR: estimated glomerular filtration rate; ESKD: end‐stage kidney disease; HbA1c: glycolated haemoglobin; RCT: randomised controlled trial
Characteristics of ongoing studies [ordered by study ID]
NCT03413215.
| Study name | Effects of multidisciplinary intensive targeted care in improving diabetes outcomes: a pilot study in Singapore (IDEALS) |
| Methods | Study design
|
| Participants | Study characteristics
|
| Interventions | Intervention group
Control group
|
| Outcomes | Planned outcomes
|
| Starting date | Actual: 1 March 2019 Estimated completion date: 31 December 2022 |
| Contact information | Contact: Ann Cheung +6568502691; ann.cheung.n.s@singhealth.com.sg Contact: Nur Shameerah Abdul Halim +6568501902; nur_shameerah@cgh.com.sg |
| Notes | Current status: unknown |
BP: blood pressure; CKD: chronic kidney disease; DM: diabetes mellitus; eGFR: estimated glomerular filtration rate; ESKD: end‐stage kidney disease; HbA1c: glycolated haemoglobin; LDL: low‐density lipoprotein; RCT: randomised controlled trial; SBP: systolic BP; T1DM: type 1 DM; T2DM: type 2 DM
Differences between protocol and review
The risk of bias assessment tool has been used in place of the quality assessment checklist in accordance with the new Cochrane Handbook for Systematic Reviews of Interventions (Higgins 2022).
Contributions of authors
Brydee Johnston: selection of studies, assessment of studies, data extraction, data analysis, writing and revising of protocol and full text review
Tess Cooper: selection of studies, assessment of studies, resolution of disagreements, data extraction, revising of protocol
David Tunnicliffe: revising of full text review, resolution of disagreements, expertise, suggestions and corrections
Nicole M Evangelidis: selection of studies, assessment of studies
Suetonia C Palmer: expertise, suggestions and corrections
Pamela Lopez‐Vargas: suggestions and corrections
Sources of support
Internal sources
-
Cochrane Kidney and Transplant, Australia
This review was updated for Cochrane Kidney and Transplant Evidence Review Team for the KDIGO 2020 Clinical Practice Guidelines for Diabetes Management in Chronic Kidney Disease.
External sources
No sources of support provided
Declarations of interest
Brydee Cashmore: No relevant interests were disclosed
Tess E Cooper: No relevant interests were disclosed
Nicole M Evangelidis: No relevant interests were disclosed
Suetonia C Palmer: No relevant interests were disclosed
Pamela Lopez‐Vargas: No relevant interests were disclosed
David J Tunnicliffe: No relevant interests were disclosed
New search for studies and content updated (conclusions changed)
References
References to studies included in this review
C‐DIRECT 2019 {published data only}10546597
- Griva K, Rajeswari M, Nandakumar M, Khoo EY, Lee VY, Chua CG, et al. The combined diabetes and renal control trial (C-DIRECT) - a feasibility randomised controlled trial to evaluate outcomes in multi-morbid patients with diabetes and on dialysis using a mixed methods approach. BMC Nephrology 2019;20(1):2. [PMID: ] [DOI] [PMC free article] [PubMed] [Google Scholar]
Fogelfeld 2017 {published data only}
- Fogelfeld L, Hart P, Miernik J, Ko J, Calvin D, Tahsin B, et al. Combined diabetes-renal multifactorial intervention in patients with advanced diabetic nephropathy: Proof-of-concept. Journal of Diabetes & its Complications 2017;31(3):624-30. [MEDLINE: ] [DOI] [PubMed] [Google Scholar]
Guo 2022 {published data only}2200057011
- Guo N, Li N, Zhao Y, Sun H, Liu K. Effects of systematic diet education combined with multidisciplinary nursing on nutritional status and calcium and phosphorus metabolism in patients with diabetic kidney disease in uremic phase after treatment with alogliptin. Journal of Healthcare Engineering 2022;2022:1120242. [DOI: 10.1155/2022/1120242] [MEDLINE: ] [DOI] [PMC free article] [PubMed] [Google Scholar]
Kopf 2012 {published data only}
- Hartmann M, Kopf S, Kircher C, Faude-Lang V, Djuric Z, Augstein F, et al. Sustained effects of a mindfulness-based stress-reduction intervention in type 2 diabetic patients: design and first results of a randomized controlled trial (the Heidelberger Diabetes and Stress-study). Diabetes Care 2012;35(5):945-7. [MEDLINE: ] [DOI] [PMC free article] [PubMed] [Google Scholar]
- Kopf S, Oikonomou D, Hartmann M, Feier F, Faude-Lang V, Morcos M, et al. Effects of stress reduction on cardiovascular risk factors in type 2 diabetes patients with early kidney disease - results of a randomized controlled trial (HEIDIS). Experimental & Clinical Endocrinology & Diabetes 2014;122(6):341-9. [MEDLINE: ] [DOI] [PubMed] [Google Scholar]
- Kopf S, Oikonomou D, Eynatten M, Kieser M, Zdunek D, Hess G, et al. Urinary excretion of high molecular weight adiponectin is an independent predictor of decline of renal function in type 2 diabetes. Acta Diabetologica 2014;51(3):479-89. [MEDLINE: ] [DOI] [PubMed] [Google Scholar]
- Sulaj A, Kopf S, Grone E, Grone HJ, Hoffmann S, Schleicher E, et al. ALCAM a novel biomarker in patients with type 2 diabetes mellitus complicated with diabetic nephropathy. Journal of Diabetes & its Complications 2017;31(6):1058-65. [MEDLINE: ] [DOI] [PubMed] [Google Scholar]
McMurray 2002 {published data only}
- Johnson GR, McMurray SD, Davis D, McDougall K. Diabetes education and care management significantly improves patient outcomes in the dialysis unit [abstract no: A0778]. Journal of the American Society of Nephrology 2001;12(Program & Abstracts):148-9A. [CENTRAL: CN-00445946] [DOI] [PubMed] [Google Scholar]
- McMurray SD, Johnson G, Davis S, McDougall K. Diabetes education and care management significantly improve patient outcomes in the dialysis unit. American Journal of Kidney Diseases 2002;40(3):566-75. [MEDLINE: ] [DOI] [PubMed] [Google Scholar]
MEMO 2011 {published data only}83140074
- Crasto W, Jarvis J, Khunti K, Skinner TC, Gray LJ, Brela J, et al. Multifactorial intervention in individuals with type 2 diabetes and microalbuminuria: the Microalbuminuria Education and Medication Optimisation (MEMO) study. Diabetes Research & Clinical Practice 2011;93(3):328-36. [MEDLINE: ] [DOI] [PubMed] [Google Scholar]
- Crasto W, Khunti K, Jarvis Kay J, Skinner TC, Gray LJ, Brela J, et al. Impact of intensive multi-factorial intervention on novel markers of inflammation and vascular stiffness [abstract no: P446]. Diabetic Medicine 2011;28(Suppl 1):166. [EMBASE: 70631246] [Google Scholar]
- Crasto W, Morrison AE, Gray LJ, John E, Jarvis J, Brela J, et al. The Microalbuminuria Education Medication and Optimisation (MEMO) study: 4 years follow-up of multifactorial intervention in high-risk individuals with type 2 diabetes. Diabetic Medicine 2020;37(2):286-97. [MEDLINE: ] [DOI] [PubMed] [Google Scholar]
- Crasto WA, Jarvis J, Brela J, Daly H, Gray LJ, Troughton J, et al. Interim analysis of the effects of a multifactorial intervention in people with type 2 diabetes and microalbuminuria after twelve months [abstract no: P410]. Diabetic Medicine 2009;26(Suppl 1):160. [EMBASE: 70342536] [Google Scholar]
MESMI 2010 {published data only}12607000044426
- Williams A, Manias E, Walker R, Gorelik A. A multifactorial intervention to improve blood pressure control in co-existing diabetes and kidney disease: a feasibility randomized controlled trial. Journal of Advanced Nursing 2012;68(11):2515-25. [MEDLINE: ] [DOI] [PubMed] [Google Scholar]
- Williams AF, Manias E, Walker RG. The devil is in the detail - a multifactorial intervention to reduce blood pressure in co-existing diabetes and chronic kidney disease: a single blind, randomized controlled trial. BMC Family Practice 2010;11:3. [MEDLINE: ] [DOI] [PMC free article] [PubMed] [Google Scholar]
Steed 2005 {published data only}74927844
- Steed L, Lankester J, Barnard M, Earle K, Hurel S, Newman S. Evaluation of the UCL diabetes self-management programme (UCL-DSMP): a randomized controlled trial. Journal of Health Psychology 2005;10(2):261-76. [MEDLINE: ] [DOI] [PubMed] [Google Scholar]
References to studies excluded from this review
Ali 2024 {published data only}
- Ali MK, Singh K, Kondal D, Devarajan R, Patel SA, Menon VU, et al. Effect of a multicomponent quality improvement strategy on sustained achievement of diabetes care goals and macrovascular and microvascular complications in South Asia at 6.5 years follow-up: post hoc analyses of the CARRS randomized clinical trial. PLoS Medicine 2024;21(6):e1004335. [DOI: 10.1371/journal.pmed.1004335] [PMID: ] [DOI] [PMC free article] [PubMed] [Google Scholar]
Bao 2021 {published data only}
- Bao L. Intervention value of path-type health education on cognition and renal function of patients with diabetic nephropathy. Computational & Mathematical Methods in Medicine 2021;2021:3665460. [MEDLINE: ] [DOI] [PMC free article] [PubMed] [Google Scholar] [Retracted]
- Methods In Medicine CAM. Retracted: Intervention value of path-type health education on cognition and renal function of patients with diabetic nephropathy. Computational & Mathematical Methods in Medicine 2022;2022:9864762. [DOI: 10.1155/2022/9864762] [PMID: ] [DOI] [PMC free article] [PubMed] [Google Scholar]
Binik 1993 {published data only}
- Binik YM, Devins GM, Barre PE, Guttmann RD, Hollomby DJ, Mandin H, et al. Live and learn: patient education delays the need to initiate renal replacement therapy in end-stage renal disease. Journal of Nervous & Mental Disease 1993;181(6):371-6. [MEDLINE: ] [DOI] [PubMed] [Google Scholar]
- Devins GM, Mendelssohn DC, Barre PE, Taub K, Binik YM. Predialysis psychoeducational intervention extends survival in CKD: a 20-year follow-up. American Journal of Kidney Diseases 2005;46(6):1088-98. [MEDLINE: ] [DOI] [PubMed] [Google Scholar]
Briggs 2004 {published data only}
- Briggs LA, Kirchhoff KT, Hammes BJ, Song MK, Colvin ER. Patient-centered advance care planning in special patient populations: a pilot study. Journal of Professional Nursing 2004;20(1):47-58. [MEDLINE: ] [DOI] [PubMed] [Google Scholar]
Calikoglu 2023 {published data only}
- Calikoglu F, Bagdemir E, Celik S, Idiz C, Ozsari H, Issever H, et al. Telemedicine as a motivational tool to optimize metabolic control in patients with diabetes in Turkey: a prospective, randomized, controlled TeleDiab trial. Telemedicine Journal & E-health 2023;29(4):518‐30. [DOI: 10.1089/tmj.2022.0028] [PMID: ] [DOI] [PubMed] [Google Scholar]
CAPTION 2010 {published data only}
- Anderegg MD, Gums TH, Uribe L, MacLaughlin EJ, Hoehns J, Bazaldua OV, et al. Pharmacist intervention for blood pressure control in patients with diabetes and/or chronic kidney disease. Pharmacotherapy 2018;38(3):309-18. [PMID: ] [DOI] [PMC free article] [PubMed] [Google Scholar]
- Carter BL, Clarke W, Ardery G, Weber CA, James PA, Vander Weg M, et al. A cluster-randomized effectiveness trial of a physician-pharmacist collaborative model to improve blood pressure control. Circulation. Cardiovascular Quality & Outcomes 2010;3(4):418-23. [PMID: ] [DOI] [PMC free article] [PubMed] [Google Scholar]
- Carter BL, Coffey CS, Ardery G, Uribe L, Ecklund D, James P, et al. Cluster-randomized trial of a physician/pharmacist collaborative model to improve blood pressure control. Circulation. Cardiovascular Quality & Outcomes 2015;8(3):235-43. [PMID: ] [DOI] [PMC free article] [PubMed] [Google Scholar]
- Chang EH, Doucette WR, Carter BL, Ardery G, Egan BM, James PA. Variable BP control following a physician\pharmacist model for BP: Effect of diabetes, chronic kidney disease and racial minorities [abstract no: FP-11]. Journal of the American Society of Hypertension 2014;8(4 Suppl 1):e20. [EMBASE: 71500469] [Google Scholar]
Cortes‐Sanabria 2008 {published data only}
- Cortes-Sanabria L, Cabrera-Pivaral CE, Cueto-Manzano AM, Rojas-Campos E, Barragan G, Hernandez-Anaya M, et al. Improving care of patients with diabetes and CKD: a pilot study for a cluster-randomized trial. American Journal of Kidney Disease 2008;51(5):777-8. [MEDLINE: ] [DOI] [PubMed] [Google Scholar]
- Cortes-Sanabria LC, Martinez-Ramirez HR, Rojas-Campos E, Cabrera-Pivaral CE, Cueto-Manzano AM. Effect of an educational participative intervention on the clinical aptitude of family doctors treating patients with type 2 diabetes mellitus and nephropathy [abstract no: PUB437]. Journal of the American Society of Nephrology 2006;17(Abstracts):908A. [Google Scholar]
DePatis 2019 {published data only}
- DePatis K, Harrington C. The impact of pharmacist-delivered motivational interviewing on chronic kidney disease identification and management in patients with diabetes mellitus and low socioeconomic status. Innovations in Pharmacy 2019;10(4):8. [PMID: ] [DOI] [PMC free article] [PubMed] [Google Scholar]
Devins 2003 {published data only}
- Devins GM, Mendelssohn DC, Barre PE, Binik YM. Predialysis psychoeducational intervention and coping styles influence time to dialysis in chronic kidney disease. American Journal of Kidney Diseases 2003;42(4):693-703. [MEDLINE: ] [DOI] [PubMed] [Google Scholar]
Didjurgeit 2002 {published data only}
- Didjurgeit U, Kruse J, Schmitz N, Stuckenschneider P, Sawicki PT. A time-limited, problem-orientated psychotherapeutic intervention in Type 1 diabetic patients with complications: a randomized controlled trial. Diabetic Medicine 2002;19(10):814-21. [MEDLINE: ] [DOI] [PubMed] [Google Scholar]
DNETT‐Japan 2010 {published data only}
- Shikata K, Haneda M, Koya D, Suzuki Y, Tomino Y, Yamada K, et al. Diabetic Nephropathy Remission and Regression Team Trial in Japan (DNETT-Japan): Rationale and study design. Diabetes Research & Clinical Practice 2010;87(2):228-32. [MEDLINE: ] [DOI] [PubMed] [Google Scholar]
- Shikata K, Haneda M, Ninomiya T, Koya D, Suzuki Y, Suzuki D, et al. Randomized trial of an intensified, multifactorial intervention in patients with advanced-stage diabetic kidney disease: Diabetic Nephropathy Remission and Regression Team Trial in Japan (DNETT-Japan). Journal of Diabetes Investigation 2021;12(2):207-16. [EMBASE: 32597548] [DOI] [PMC free article] [PubMed] [Google Scholar]
Dong 2019 {published data only}
- Dong L, Li J, Lian Y, Tang Z, Zen Z, Yu P, et al. Long-term intensive lifestyle intervention promotes improvement of stage III diabetic nephropathy. Medical Science Monitor 2019;25:3061-8. [PMID: ] [DOI] [PMC free article] [PubMed] [Google Scholar]
Du 2022a {published data only}
- Du Y, Wang J, Li S, Dennis B, Meireles C, Siddiqui N, et al. A technology assisted precision ketogenic diet intervention for cardio-renal-metabolic health in overweight or obese adults: Protocol for a randomized controlled trial. Contemporary Clinical Trials 2022;119:106845. [MEDLINE: ] [DOI] [PubMed] [Google Scholar]
Ford 2004 {published data only}
- Ford JC, Pope JF, Hunt AE, Gerald B. The effect of diet education on the laboratory values and knowledge of hemodialysis patients with hyperphosphatemia. Journal of Renal Nutrition 2004;14(1):36-44. [MEDLINE: ] [DOI] [PubMed] [Google Scholar]
FROM‐J 2010 {published data only}
- Tsuchida-Nishiwaki M, Uchida H, Takeuchi H, Nishiwaki N, Maeshima Y, Saito C, et al. Association of blood pressure and renal outcome in patients with chronic kidney disease; a post hoc analysis of FROM-J study. Scientific Reports 2021;11(1):14990. [PMID: ] [DOI] [PMC free article] [PubMed] [Google Scholar]
- Yamagata K, Makino H, Akizawa T, Iseki K, Itoh S, Kimura K, et al. Design and methods of a strategic outcome study for chronic kidney disease: Frontier of Renal Outcome Modifications in Japan. Clinical & Experimental Nephrology 2010;14(2):144-51. [PMID: ] [DOI] [PubMed] [Google Scholar]
- Yamagata K, Makino H, Iseki K, Ito S, Kimura K, Kusano E, et al. Effect of behavior modification on outcome in early- to moderate-stage chronic kidney disease: a cluster-randomized trial. PLoS ONE [Electronic Resource] 2016;11(3):e0151422. [PMID: ] [DOI] [PMC free article] [PubMed] [Google Scholar]
- Yamagata K, Makino H, Iseki K, Ito S, Kimura K, Kusano E, et al. Effects of educational intervention on renal outcome of early -to moderate-stage chronic kidney disease: a cluster-randomized trial [abstract no: SA-PO895]. Journal of the American Society of Nephrology 2014;25:846A. [Google Scholar]
GP‐Prompt 2018 {published data only}
- Willis A, Crasto W, Gray L, Dallosso H, Waheed G, Gray G, et al. The General Practitioner Prompt Study to reduce cardiovascular and renal complications in patients with type 2 diabetes and renal complications: protocol and baseline characteristics for a cluster randomized controlled trial. JMIR Research Protocols 2018;7(6):e152. [PMID: ] [DOI] [PMC free article] [PubMed] [Google Scholar]
- Willis A, Crasto W, Gray LJ, Dallosso H, Waheed G, Davies M, et al. Effects of an electronic software "Prompt" with health care professional training on cardiovascular and renal complications in a multiethnic population with type 2 diabetes and microalbuminuria (the GP-Prompt study): results of a pragmatic cluster-randomized trial. Diabetes Care 2020;43(8):1893-901. [PMID: ] [DOI] [PubMed] [Google Scholar]
Hall 2004 {published data only}
- Hall G, Bogan A, Dreis S, Duffy A, Greene S, Kelley K, et al. New directions in peritoneal dialysis patient training. Nephrology Nursing Journal 2004;31(2):149-154,159-63. [MEDLINE: ] [PubMed] [Google Scholar]
Helou 2016 {published data only}
- Helou N, Talhouedec D, Shaha M, Zanchi A. The impact of a multidisciplinary self-care management program on quality of life, self-care, adherence to anti-hypertensive therapy, glycemic control, and renal function in diabetic kidney disease: a cross-over study protocol. BMC Nephrology 2016;17(1):88. [MEDLINE: ] [DOI] [PMC free article] [PubMed] [Google Scholar]
- Helou N, Talhouedec D, Zumstein-Shaha M, Zanchi A. A multidisciplinary approach for improving quality of life and self-management in diabetic kidney disease: a crossover study. Journal of Clinical Medicine 2020;9(7):2160. [MEDLINE: ] [DOI] [PMC free article] [PubMed] [Google Scholar]
HHK 2018 {published data only}
- Sevick MA, Woolf K, Mattoo A, Katz SD, Li H, St-Jules DE, et al. The Healthy Hearts and Kidneys (HHK) study: Design of a 2x2 RCT of technology-supported self-monitoring and social cognitive theory-based counseling to engage overweight people with diabetes and chronic kidney disease in multiple lifestyle changes. Contemporary Clinical Trials 2018 Jan;64:265-73. [MEDLINE: ] [DOI] [PMC free article] [PubMed] [Google Scholar]
Hoto 2010 {published data only}
- Hotu C, Bagg W, Collins J, Harwood L, Whalley G, Doughty R, et al. A community-based model of care improves blood pressure control and delays progression of proteinuria, left ventricular hypertrophy and diastolic dysfunction in Māori and Pacific patients with type 2 diabetes and chronic kidney disease: a randomized controlled trial. Nephrology Dialysis Transplantation 2010;25(10):3260-6. [PMID: ] [DOI] [PubMed] [Google Scholar]
Kawabata 2022 {published data only}
- Kawabata N, Okada K, Ando A, Kurashina T, Takahashi M, Wakabayashi T, et al. Comparison of the effects of frequent versus conventional nutritional interventions in patients with type 2 diabetes mellitus: a randomized, controlled trial. Journal of Diabetes Investigation 2022;13(2):271-9. [DOI: 10.1111/jdi.13657] [MEDLINE: ] [DOI] [PMC free article] [PubMed] [Google Scholar]
- Kawabata N, Okada K, Ando A, Kurashina T, Takahashi M, Wakabayashi T, et al. Dietitian-supported dietary intervention leads to favorable dietary changes in patients with type 2 diabetes: a randomized controlled trial. Journal of Diabetes Investigation 2022;13(12):1963-70. [MEDLINE: ] [DOI] [PMC free article] [PubMed] [Google Scholar]
Kawai 2021 {published data only}UMIN000033261
- Kawai Y, Sankoda A, Waki K, Miyake K, Hayashi A, Mieno M, et al. Efficacy of the self-management support system DialBetesPlus for diabetic kidney disease: protocol for a randomized controlled trial. JMIR Research Protocols 2021;10(8):e31061. [MEDLINE: ] [DOI] [PMC free article] [PubMed] [Google Scholar]
Korniewicz 1994 {published data only}
- Korniewicz DM, O'Brien ME. Evaluation of a hemodialysis patient education and support program. ANNA Journal 1994;21(1):33-8. [MEDLINE: ] [PubMed] [Google Scholar]
Kuningas 2020 {published data only}
- Kuningas K, Driscoll J, Mair R, Smith H, Dutton M, Day E, et al. Comparing glycaemic benefits of active versus passive lifestyle intervention in kidney allograft recipients: a randomized controlled trial. Transplantation 2020;104(7):1491-9. [MEDLINE: ] [DOI] [PubMed] [Google Scholar]
Leon 2006 {published data only}
- Leon JB, Albert JM, Gilchrist G, Kushner I, Lerner E, Mach S, et al. Improving albumin levels among hemodialysis patients: a community-based randomized controlled trial. American Journal of Kidney Diseases 2006;48(1):28-36. [MEDLINE: ] [DOI] [PubMed] [Google Scholar]
Leung 2005 {published data only}
- Leung WY, So WY, Tong PC, Chan NN, Chan JC. Effects of structured care by a pharmacist-diabetes specialist team in patients with type 2 diabetic nephropathy. American Journal of Medicine 2005;118(12):1414. [MEDLINE: ] [DOI] [PubMed] [Google Scholar]
Lim 2021a {published data only}
- Lim LL, Lau ES, Fu AW, Ray S, Hung YJ, Tan AT, et al. Effects of a technology-assisted integrated diabetes care program on cardiometabolic risk factors among patients with type 2 diabetes in the Asia-Pacific region: the JADE program randomized clinical trial. JAMA Network Open 2021;4(4):e217557. [DOI: 10.1001/jamanetworkopen.2021.7557] [MEDLINE: ] [DOI] [PMC free article] [PubMed] [Google Scholar]
Litvin 2020 {published data only}
- Litvin CB, Nietert PJ, Jenkins RG, Wessell AM, Nemeth LS, Ornstein SM. Translating CKD research into primary care practice: a group-randomized study. Journal of General Internal Medicine 2020;35(5):1435-43. [PMID: ] [DOI] [PMC free article] [PubMed] [Google Scholar]
Manns 2005 {published data only}
- Manns BJ, Taub K, Vanderstraeten C, Jones H, Mills C, Visser M, et al. The impact of education on chronic kidney disease patients' plans to initiate dialysis with self-care dialysis: a randomized trial. Kidney International 2005;68(4):1777-83. [MEDLINE: ] [DOI] [PubMed] [Google Scholar]
- Manns BJ, Taub K, Visser M, Vanderstraeten C, Jones H, McLaughlin K. A patient-centered educational intervention to improve the utilization of self-care dialysis among predialysis patients: a randomized controlled trial [abstract no: F-PO313]. Journal of the American Society of Nephrology 2004;15(Oct):135A. [CENTRAL: CN-00626011] [Google Scholar]
- McLaughlin K, Jones H, VanderStraeten C, Mills C, Visser M, Taub K, et al. Why do patients choose self-care dialysis? Nephrology Dialysis Transplantation 2008;23(12):3972-6. [MEDLINE: ] [DOI] [PubMed] [Google Scholar]
- McLaughlin K, Taub K, Manns B. Why do patients with chronic kidney disease choose self-care dialysis modalities? [abstract no: SA-FC148]. Journal of the American Society of Nephrology 2005;16:114A. [CENTRAL: CN-00716081] [Google Scholar]
MDRD Study 1 1989 {published data only}
- Anonymous. Effects of diet and antihypertensive therapy on creatinine clearance and serum creatinine concentration in the Modification of Diet in Renal Disease Study [Erratum in: J Am Soc Nephrol 1997 Aug;8(8):1354]. Journal of the American Society of Nephrology 1996;7(4):556-66. [MEDLINE: ] [DOI] [PubMed] [Google Scholar]
- Anonymous. Effects of dietary protein restriction on the progression of moderate renal disease in the Modification of Diet in Renal Disease Study [Erratum in: J Am Soc Nephrol 1997 Mar;8(3):493]. Journal of the American Society of Nephrology 1996;7(12):2616-26. [MEDLINE: ] [DOI] [PubMed] [Google Scholar]
- Anonymous. Short-term effects of protein intake, blood pressure, and antihypertensive therapy on glomerular filtration rate in the Modification of Diet in Renal Disease Study. Journal of the American Society of Nephrology 1996;7(10):2097-109. [MEDLINE: ] [DOI] [PubMed] [Google Scholar]
- Beck GJ, Berg RL, Coggins CH, Gassman JJ, Hunsicker LG, Schluchter MD, et al. Design and statistical issues of the Modification of Diet in Renal Disease Trial. The Modification of Diet in Renal Disease Study Group. Controlled Clinical Trials 1991;12(5):566-86. [MEDLINE: ] [DOI] [PubMed] [Google Scholar]
- Buckalew VM Jr, Berg RL, Wang SR, Porush JG, Rauch S, Schulman G. Prevalence of hypertension in 1,795 subjects with chronic renal disease: the modification of diet in renal disease study baseline cohort. Modification of Diet in Renal Disease Study Group. American Journal of Kidney Diseases 1996;28(6):811-21. [MEDLINE: ] [DOI] [PubMed] [Google Scholar]
- Chawla V, Wang X, Greene J, Kusek JW, Collins AJ, Levey AS, et al. Dyslipidemia and mortality in chronic kidney disease [abstract no: TH-PO895]. Journal of the American Society of Nephrology 2008;19(Abstracts Issue):311-2A. [CENTRAL: CN-00774430] [Google Scholar]
- Chen JL, Lerner D, Ruthazer R, Castaneda-Sceppa C, Levey AS. Association of physical activity with mortality in chronic kidney disease. Journal of Nephrology 2008;21(2):243-52. [MEDLINE: ] [PubMed] [Google Scholar]
- Chen JL, Sceppa C, Ruthazer R, Levey AS. Leisure time physical activity status and mortality in chronic kidney disease: preliminary findings from the MDRD study [abstract no: 21]. American Journal of Kidney Diseases 2006;47(4):A24. [CENTRAL: CN-00583387] [Google Scholar]
- Coggins CH, Lewis JB, Caggiula AW, Castaldo LS, Klahr S, Wang SR. Differences between women and men with chronic renal disease. Nephrology Dialysis Transplantation 1998;13(6):1430-7. [MEDLINE: ] [DOI] [PubMed] [Google Scholar]
- Coyne T, Olson M, Bradham K, Garcon M, Gregory P, Scherch L, et al. Dietary satisfaction correlated with adherence in the Modification of Diet in Renal Disease Study. Journal of the American Dietetic Association 1995;95(11):1301-6. [MEDLINE: ] [DOI] [PubMed] [Google Scholar]
- Dennis VW. Decoding the Modification of Diet in Renal Disease Study. Cleveland Clinic Journal of Medicine 1994;61(4):254-7. [MEDLINE: ] [DOI] [PubMed] [Google Scholar]
- Dolecek TA, Olson MB, Caggiula AW, Dwyer JT, Milas NC, Gillis BP, et al. Registered dietitian time requirements in the Modification of Diet in Renal Disease Study. Journal of the American Dietetic Association 1995;95(11):1307-12. [MEDLINE: ] [DOI] [PubMed] [Google Scholar]
- Gassman JJ, Drabik MJ, Leatherman JR, Fatica KJ, McPherson JA, MDRD Study Group. Development and use of distributed data entry and electronic communication in a multi-center study of progressive renal disease [abstract]. Kidney International 1989;35(1):226. [CENTRAL: CN-00583390] [Google Scholar]
- Gennari FJ, Hood VL, Greene T, Wang X, Levey AS. Effect of dietary protein intake on serum total CO2 concentration in chronic kidney disease: Modification of Diet in Renal Disease Study findings. Clinical Journal of the American Society of Nephrology: CJASN 2006;1(1):52-7. [MEDLINE: ] [DOI] [PubMed] [Google Scholar]
- Gillis BP, Averbach FM, Caggiula AW, Jones FL, Naujelis J, Maurer E, et al. Features of the nutrient database and analysis system for the Modification of Diet in Renal Disease Study [Erratum in: Control Clin Trials 1994 Aug;15(4):326]. Controlled Clinical Trials 1994;15(1):44-58. [MEDLINE: ] [DOI] [PubMed] [Google Scholar]
- Gillis BP, Caggiula AW, Chiavacci AT, Coyne T, Doroshenko L, Milas NC, et al. Nutrition intervention program of the Modification of Diet in Renal Disease Study: a self-management approach. Journal of the American Dietetic Association 1995;95(11):1288-94. [MEDLINE: ] [DOI] [PubMed] [Google Scholar]
- Grams ME, Coresh J, Segev DL, Kucirka LM, Tighiouart H, Sarnak MJ. Vascular disease, ESRD, and death: interpreting competing risk analyses. Clinical Journal of the American Society of Nephrology: CJASN 2012;7(10):1606-14. [MEDLINE: ] [DOI] [PMC free article] [PubMed] [Google Scholar]
- Grams ME, Tighiouart H, Coresh J, Sarnak MJ. Vascular disease-associated mortality during CKD progression: the MDRD study [abstract no: TH-PO332]. Journal of the American Society of Nephrology 2011;22(Abstract Suppl):189A. [Google Scholar]
- Grams ME, Tin A, Rebholz CM, Shafi T, Kottgen A, Perrone RD, et al. Metabolomic alterations associated with cause of CKD. Clinical Journal of The American Society of Nephrology: CJASN 2017;12(11):1787-94. [MEDLINE: ] [DOI] [PMC free article] [PubMed] [Google Scholar]
- Greene T, Beck G, Wang S, Kusek J, Levey A, MDRD Study Group. The effect of the low protein diet in the MDRD study A is dependent on the underlying rate of disease progression [abstract no: A0847]. Journal of the American Society of Nephrology 1999;10(Program & Abstracts):165A. [CENTRAL: CN-00550598] [Google Scholar]
- Greene T, Bourgoignie JJ, Habwe V, Kusek JW, Snetselaar LG, Soucie JM, et al. Baseline characteristics in the Modification of Diet in Renal Disease Study [republished from: J Am Soc Nephrol 1993 May;3(11):1819-34]. Journal of the American Society of Nephrology 1993;4(5):1221-36. [MEDLINE: ] [DOI] [PubMed] [Google Scholar]
- Hebert LA, Greene T, Hunsicker LG, Levey AS, Wang S, MDRD Study Group. Relationship of urine volume (UV) and urine osmolality (Uosm) to the progression of renal disease in the Modification of Diet in Renal Disease (MDRD) study [abstract no: A0848]. Journal of the American Society of Nephrology 1999;10(Program & Abstracts):165-6A. [CENTRAL: CN-00550582] [Google Scholar]
- Hebert LA, Kusek JW, Greene T, Agodoa LY, Jones CA, Levey AS, et al. Effects of blood pressure control on progressive renal disease in blacks and whites. Modification of Diet in Renal Disease Study Group. Hypertension 1997;30(3 Pt 1):428-35. [MEDLINE: ] [DOI] [PubMed] [Google Scholar]
- Hunsicker LG, Adler S, Caggiula A, England BK, Greene T, Kusek JW, et al. Predictors of the progression of renal disease in the Modification of Diet in Renal Disease Study. Kidney International 1997;51(6):1908-19. [MEDLINE: ] [DOI] [PubMed] [Google Scholar]
- Hunsicker LG, MDRD Study Group. Secondary analysis of the Modification of Diet in Renal Disease (MDRD) study [abstract]. In: 13th International Congress of Nephrology; 1995 Jul 2-6; Madrid, Spain. 1995:64. [CENTRAL: CN-00550575]
- Ix JH, Shlipak MG, Sarnak MJ, Beck GJ, Greene T, Wang X, et al. Fetuin-A is not associated with all-cause or cardiovascular mortality in chronic kidney disease: data from the Modification of Diet in Renal Disease (MDRD) study [abstract no: SU-PO711]. Journal of the American Society of Nephrology 2007;18(Abstracts Issue):741A. [CENTRAL: CN-00690357] [Google Scholar]
- Klahr S, Breyer JA, Beck GJ, Dennis VW, Hartman JA, Roth D, et al. Dietary protein restriction, blood pressure control, and the progression of polycystic kidney disease. Modification of Diet in Renal Disease Study Group [Erratum in: J Am Soc Nephrol 1995 Oct;6(4):1318]. Journal of the American Society of Nephrology 1995 Jun;5(12):2037-47. [MEDLINE: ] [DOI] [PubMed] [Google Scholar]
- Klahr S, Levey AS, Beck GJ, Caggiula AW, Hunsicker L, Kusek JW, et al. The effects of dietary protein restriction and blood-pressure control on the progression of chronic renal disease. Modification of Diet in Renal Disease Study Group. New England Journal of Medicine 1994;330(13):877-84. [MEDLINE: ] [DOI] [PubMed] [Google Scholar]
- Klahr S. Primary and secondary results of the modification of diet in renal disease study. Mineral & Electrolyte Metabolism 1996;22(1-3):138-42. [MEDLINE: ] [PubMed] [Google Scholar]
- Klahr S. The Modification of Diet in Renal Disease Study. New England Journal of Medicine 1989;320(13):864-6. [MEDLINE: ] [DOI] [PubMed] [Google Scholar]
- Kopple JD, Greene T, Chumlea WC, Hollinger D, Maroni BJ, Merrill D, et al. Relationship between nutritional status and the glomerular filtration rate: results from the MDRD study. Kidney International 2000;57(4):1688-703. [MEDLINE: ] [DOI] [PubMed] [Google Scholar]
- Kopple JD, Levey AS, Greene T, Chumlea WC, Gassman JJ, Hollinger DL, et al. Effect of dietary protein restriction on nutritional status in the Modification of Diet in Renal Disease Study. Kidney International 1997;52(3):778-91. [MEDLINE: ] [DOI] [PubMed] [Google Scholar]
- Ku E, Glidden DV, Johansen KL, Sarnak M, Tighiouart H, Grimes B, et al. Association between strict blood pressure control during chronic kidney disease and lower mortality after onset of end-stage renal disease. Kidney International 2015;87(5):1055-60. [MEDLINE: ] [DOI] [PMC free article] [PubMed] [Google Scholar]
- Kusek JW, Coyne T, Velasco A, Drabik MJ, Finlay RA, Gassman JJ, et al. Recruitment experience in the full-scale phase of the Modification of Diet in Renal Disease Study. Controlled Clinical Trials 1993;14(6):538-57. [MEDLINE: ] [DOI] [PubMed] [Google Scholar]
- Kusek JW, Coyne T, deVelasco A, Gassman J, Kiefer S, Powers S, et al. Recruitment experience in the full scale phase of the Modification of Diet in Renal Disease (MDRD) Study [abstract]. Controlled Clinical Trials 1991;12:678. [CENTRAL: CN-00300993] [DOI] [PubMed] [Google Scholar]
- Kwong YT, Stevens LA, Selvin E, Zhang YL, Greene T, Van Lente F, et al. Imprecision of urinary iothalamate clearance as a gold-standard measure of GFR decreases the diagnostic accuracy of kidney function estimating equations. American Journal of Kidney Diseases 2010;56(1):39-49. [MEDLINE: ] [DOI] [PMC free article] [PubMed] [Google Scholar]
- Lazarus JM, Bourgoignie JJ, Buckalew VM, Greene T, Levey AS, Milas NC, et al. Achievement and safety of a low blood pressure goal in chronic renal disease. The Modification of Diet in Renal Disease Study Group. Hypertension 1997;29(2):641-50. [MEDLINE: ] [DOI] [PubMed] [Google Scholar]
- Leonberg-Yoo AK, Tighiouart H, Levey AS, Beck GJ, Sarnak MJ. Urine potassium excretion, kidney failure, and mortality in CKD. American Journal of Kidney Diseases 2017;69(3):341-9. [MEDLINE: ] [DOI] [PMC free article] [PubMed] [Google Scholar]
- Levey AS, Bosch JP, Lewis JB, Greene T, Rogers N, Roth D. A more accurate method to estimate glomerular filtration rate from serum creatinine: a new prediction equation. Modification of Diet in Renal Disease Study Group. Annals of Internal Medicine 1999;130(6):461-70. [MEDLINE: ] [DOI] [PubMed] [Google Scholar]
- Levey AS, Coresh J, Greene T, Stevens LA, Zhang YL, Hendriksen S, et al. Using standardized serum creatinine values in the Modification of Diet in Renal Disease study equation for estimating glomerular filtration rate. Annals of Internal Medicine 2006;145(4):247-54. [MEDLINE: ] [DOI] [PubMed] [Google Scholar]
- Levey AS, Greene T, Beck GJ, Caggiula AW, Kusek JW, Hunsicker LG, et al. Dietary protein restriction and the progression of chronic renal disease: what have all of the results of the MDRD study shown? Modification of Diet in Renal Disease Study group. Journal of the American Society of Nephrology 1999;10(11):2426-39. [MEDLINE: ] [DOI] [PubMed] [Google Scholar]
- Levey AS, Greene T, Sarnak M, Wang X, Beck GJ, Kusek JW, et al. Effect of low protein diet on progression of kidney disease in the Modification of Diet in Renal Disease study A: long-term follow-up [abstract no: SU-PO247]. Journal of the American Society of Nephrology 2004;15(Oct):586-7A. [CENTRAL: CN-00550759] [Google Scholar]
- Levey AS, Greene T, Sarnak MJ, Wang X, Beck GJ, Kusek JW, et al. Effect of dietary protein restriction on the progression of kidney disease: long-term follow-up of the Modification of Diet in Renal Disease (MDRD) Study. American Journal of Kidney Diseases 2006;48(6):879-88. [MEDLINE: ] [DOI] [PubMed] [Google Scholar]
- Levey AS, Greene T, Sarnak MJ, Wang X, Beck GJ, Kusek JW, et al. The effect of very low protein diet on progression of kidney disease and mortality in Modification of Diet in Renal Disease Study B [abstract no: SU-PO246]. Journal of the American Society of Nephrology 2004;15(Oct):586A. [CENTRAL: CN-00550761] [Google Scholar]
- Levey AS, Greene T, Schluchter MD, Cleary PA, Teschan PE, Lorenz RA, et al. Glomerular filtration rate measurements in clinical trials. Modification of Diet in Renal Disease Study Group and the Diabetes Control and Complications Trial Research Group. Journal of the American Society of Nephrology 1993;4(5):1159-71. [MEDLINE: ] [DOI] [PMC free article] [PubMed] [Google Scholar]
- MDRD Study Group. The Modification of Diet in Renal Disease study: results from the full-scale trial [abstract]. In: 12th International Congress of Nephrology; 1993 Jun 13-18; Jerusalem, Israel. 1993:593. [CENTRAL: CN-00583161]
- MDRD Study Group, Chumlea WC, Gassman JJ, Hollinger DL, Merrill D, Scherch LK, et al. Nutritional response to diet prescription in the MDRD study [abstract]. Journal of the American Society of Nephrology 1994;5(3):335. [CENTRAL: CN-00550629] [Google Scholar]
- MDRD Study Group, Hunsicker LG, Adler S, Caggiula AW, England B, Greene T, et al. Relationship among baseline proteinuria (P), mean arterial blood pressure (MAP) during follow-up, and decline in glomerular filtration rate (aGFR) in the Modification of Diet in Renal Disease Study [abstract]. Journal of the American Society of Nephrology 1993;4(Program & Abstracts):254. [CENTRAL: CN-00485053] [Google Scholar]
- MDRD Study Group, Kopple JD, Chumlea WC, Gassman JJ, Hollinger DL, Maroni BJ, et al. Relationship between FGR and nutritional status - results from the MDRD study [abstract]. Journal of the American Society of Nephrology 1994;5(3):335. [CENTRAL: CN-00550630] [Google Scholar]
- MDRD Study Group, Kusek JW, Agodoa L, Greene T, Jones C. Comparison of decline of GFR in blacks versus non-blacks in the MDRD study [abstract]. Journal of the American Society of Nephrology 1993;4(Program & Abstracts):253. [CENTRAL: CN-00485054] [Google Scholar]
- MDRD Study Group, Levey AS, Beck GJ, Bosch JP, Caggiula AW, Greene T, et al. Short-term effects of protein intake, blood pressure, and antihypertensive therapy on GFR in the MDRD study [abstract]. Journal of the American Society of Nephrology 1995;6(3):395. [CENTRAL: CN-00487729] [Google Scholar]
- MDRD Study Group, Levey AS, Beck GJ, Caggiula AW, Greene T, Hunsicker LG, et al. A hypothesis for the results of the Modification of Diet in Renal Disease (MDRD) study [abstract]. Journal of the American Society of Nephrology 1993;4(Program & Abstracts):253. [CENTRAL: CN-00485055] [DOI] [PubMed] [Google Scholar]
- MDRD Study Group, Levey AS, Beck GJ, Caggiula AW, Greene T, Kusek JW, et al. Trends toward a beneficial effect of a low protein diet during additional follow-up in the Modification of Diet in Renal Disease study [abstract]. Journal of the American Society of Nephrology 1994;5(3):336. [CENTRAL: CN-00740575] [Google Scholar]
- MDRD Study Group, Levey AS, Beck GJ. Trends toward a beneficial effect of a low protein diet during additional follow-up in the modification of diet in renal disease study. MDRD Study Group [abstract]. Nephrology Dialysis Transplantation 1995;10(6):985. [CENTRAL: CN-00261105] [Google Scholar]
- MDRD Study Group, Levey AS, Bosch JP, Coggins CH, Greene T, Mitch WE, et al. Effects of diet and blood pressure on creatinine clearance (CCR) and serum creatinine (PCR) in the MDRD study [abstract]. Journal of the American Society of Nephrology 1993;4(Program & Abstracts):253. [CENTRAL: CN-00485056] [Google Scholar]
- MDRD Study Group, Peterson JC, Burkart J, Greene T, Hebert L, King A, et al. The effect of blood pressure control on progression of renal disease depends on level of proteinuria (P) at baseline evaluation [abstract]. Journal of the American Society of Nephrology 1993;4(Program & Abstracts):254. [CENTRAL: CN-00485057] [Google Scholar]
- MDRD Study Group, Peterson JC, Greene T, Klahr S, Burkart JM, Hebert L, et al. Effect of reducing proteinuria (PR) on subsequent glomerular filtration rate (GFR) decline in patients with chronic renal failure (CRF) [abstract]. Journal of the American Society of Nephrology 1994;5(3):339. [CENTRAL: CN-00550641] [Google Scholar]
- MDRD Study Group, Porush JG, Lazarus JM, Bourgoignie JJ, Buckalew VM, Greene T, et al. Efficacy of anti-hypertensive interventions in reducing blood pressure in the MDRD study [abstract]. Journal of the American Society of Nephrology 1995;6(3):400. [CENTRAL: CN-00485058] [Google Scholar]
- MDRD Study Group, Powers SN, Kurtzman DA, Petot GJ, Raizman DJ, Wetstein L. Promoting dietary compliance through computer-assisted education, assessment, and counseling [abstract]. Kidney International Supplement 1988;36(27):S306. [CENTRAL: CN-00626109] [Google Scholar]
- MDRD Study Group, Rocco MV, Coyne T, Eastin S, Faubert J, Gassman JJ, et al. Patient symptoms and quality of life in the MDRD study at enrollment-correlation with GFR [abstract]. Journal of the American Society of Nephrology 1993;4(Program & Abstracts):254. [CENTRAL: CN-00485060] [Google Scholar]
- Madero M, Sarnak M, Wang X, Greene T, Collins A, Beck G, et al. Uric acid and development of kidney failure in chronic kidney disease [abstract no: F-PO1932]. Journal of the American Society of Nephrology 2008;19(Abstracts Issue):547A. [CENTRAL: CN-00776871] [Google Scholar]
- Madero M, Sarnak MJ, Wang X, Greene T, Beck GJ, Kusek JW, et al. Uric acid and long-term outcomes in CKD. American Journal of Kidney Diseases 2009;53(5):796-803. [MEDLINE: ] [DOI] [PMC free article] [PubMed] [Google Scholar]
- Madero M, Sarnak MJ, Wang X, Sceppa CC, Greene T, Beck GJ, et al. Body mass index and mortality in CKD. American Journal of Kidney Diseases 2007;50(3):404-11. [MEDLINE: ] [DOI] [PubMed] [Google Scholar]
- Madero M, Wang X, Green T, Hunsicker LG, Beck GJ, Kusek JW, et al. Effect of trial participation on outcomes in the randomized and non-randomized cohorts of the Modification of Diet in Renal Disease study [abstract no: F-PO037]. Journal of the American Society of Nephrology 2006;17(Abstracts):344A. [CENTRAL: CN-00602074] [Google Scholar]
- Menon V, Green T, Pereira A, Xuelei W, Beck G, Kusek J, et al. C-reactive protein (CRP) as a predictor of all-cause and cardiovascular (CVD) mortality in patients with chronic kidney disease (CKD) [abstract no: F-P0275]. Journal of the American Society of Nephrology 2004;15(Oct):125-6A. [PMID: ] [Google Scholar]
- Menon V, Greene T, Pereira A, Wang X, Beck G, Kusek J, et al. Hemoglobin A1c and mortality in chronic kidney disease [abstract no: F-FC149]. Journal of the American Society of Nephrology 2005;16:71A. [CENTRAL: CN-00583591] [DOI] [PubMed] [Google Scholar]
- Menon V, Greene T, Pereira A, Wang X, Beck G, Kusek J, et al. Insulin resistance as a predictor of all-cause and cardiovascular mortality (CVD) in chronic kidney disease (CKD) [abstract no: F-P0284]. Journal of the American Society of Nephrology 2004;15(Oct):128A. [CENTRAL: CN-00583593] [Google Scholar]
- Menon V, Greene T, Pereira AA, Wang X, Beck GJ, Kusek JW, et al. Glycosylated hemoglobin and mortality in patients with nondiabetic chronic kidney disease. Journal of the American Society of Nephrology 2005;16(11):3411-7. [MEDLINE: ] [DOI] [PubMed] [Google Scholar]
- Menon V, Greene T, Pereira AA, Wang X, Beck GJ, Kusek JW, et al. Relationship of phosphorus and calcium-phosphorus product with mortality in CKD. American Journal of Kidney Diseases 2005;46(3):455-63. [MEDLINE: ] [DOI] [PubMed] [Google Scholar]
- Menon V, Greene T, Wang X, Pereira AA, Marcovina SM, Beck GJ, et al. C-reactive protein and albumin as predictors of all-cause and cardiovascular mortality in chronic kidney disease. Kidney International 2005;68(2):766-72. [MEDLINE: ] [DOI] [PubMed] [Google Scholar]
- Menon V, Kopple JD, Wang X, Beck GJ, Collins AJ, Kusek JW, et al. Effect of a very low-protein diet on outcomes: long-term follow-up of the Modification of Diet in Renal Disease (MDRD) Study. American Journal of Kidney Diseases 2009;53(2):208-17. [MEDLINE: ] [DOI] [PubMed] [Google Scholar]
- Menon V, Li L, Greene T, Wang X, Chandra P, Balakrishnan V, et al. Adiponectin and outcomes in chronic kidney disease [abstract no: TH-PO430]. Journal of the American Society of Nephrology 2006;17(Abstracts):199A. [PMID: ] [Google Scholar]
- Menon V, Li L, Wang X, Greene T, Balakrishnan V, Madero M, et al. Adiponectin and mortality in patients with chronic kidney disease. Journal of the American Society of Nephrology 2006;17(9):2599-606. [MEDLINE: ] [DOI] [PubMed] [Google Scholar]
- Menon V, Sarnak MJ, Greene T, Wang X, Pereira AA, Beck GJ, et al. Relationship between homocysteine and mortality in chronic kidney disease. Circulation 2006;113(12):1572-7. [MEDLINE: ] [DOI] [PubMed] [Google Scholar]
- Menon V, Shlipak MG, Wang X, Coresh J, Greene T, Stevens L, et al. Cystatin C as a risk factor for outcomes in chronic kidney disease. Annals of Internal Medicine 2007;147(1):19-27. [MEDLINE: ] [DOI] [PubMed] [Google Scholar]
- Menon V, Tighiouart H, Vaughn NS, Beck GJ, Kusek JW, Collins AJ, et al. Serum bicarbonate and long-term outcomes in CKD. American Journal of Kidney Diseases 2010;56(5):907-14. [MEDLINE: ] [DOI] [PubMed] [Google Scholar]
- Menon V, Wang X, Greene T, Beck GJ, Kusek JW, Marcovina SM, et al. Relationship between C-reactive protein, albumin, and cardiovascular disease in patients with chronic kidney disease. American Journal of Kidney Diseases 2003;42(1):44-52. [MEDLINE: ] [DOI] [PubMed] [Google Scholar]
- Menon V, Wang X, Greene T, Beck GJ, Kusek JW, Selhub J, et al. Homocysteine in chronic kidney disease: effect of low protein diet and repletion with B vitamins. Kidney International 2005;67(4):1539-46. [MEDLINE: ] [DOI] [PubMed] [Google Scholar]
- Menon V, Wang X, Sarnak MJ, Hunsicker LH, Madero M, Beck GJ, et al. Long-term outcomes in nondiabetic chronic kidney disease. Kidney International 2008;73(11):1310-5. [MEDLINE: ] [DOI] [PubMed] [Google Scholar]
- Milas NC, Nowalk MP, Akpele L, Castaldo L, Coyne T, Doroshenko L, et al. Factors associated with adherence to the dietary protein intervention in the Modification of Diet in Renal Disease Study. Journal of the American Dietetic Association 1995;95(11):1295-300. [MEDLINE: ] [DOI] [PubMed] [Google Scholar]
- Newsome B, Ix JH, Tighiouart H, Sarnak MJ, Levey AS, Beck GJ, et al. Effect of protein restriction on serum and urine phosphate in the modification of diet in renal disease (MDRD) study. American Journal of Kidney Diseases 2013;61(6):1045-6. [MEDLINE: ] [DOI] [PubMed] [Google Scholar]
- Olson M, Coyne T, Caggiula A, Gregory P. Patient satisfaction with a dietary intervention: the Modification of Diet in Renal Disease Study [abstract]. Controlled Clinical Trials 1995;16(3 Suppl):107S. [CENTRAL: CN-00301261] [Google Scholar]
- Olson M, Coyne T, Caggiula A. Social factors influence dietary satisfaction in the Modification of Diet in Renal Disease Study [abstract]. Controlled Clinical Trials 1996;17(2 Suppl):133S. [CENTRAL: CN-00301260] [Google Scholar]
- Olson M, Dolecek T, Caggiula A, Dwyer J. Time required for the protein intervention in the Modification of Diet in Renal Disease Study [abstract]. Controlled Clinical Trials 1995;16(3 Suppl):129-30S. [CENTRAL: CN-00301262] [Google Scholar]
- Peterson JC, Adler S, Burkart JM, Greene T, Hebert LA, Hunsicker LG, et al. Blood pressure control, proteinuria, and the progression of renal disease. The Modification of Diet in Renal Disease Study. Annals of Internal Medicine 1995;123(10):754-62. [MEDLINE: ] [DOI] [PubMed] [Google Scholar]
- Piccoli M, Codognotto M. Missing stratification by polycistic kidney disease (PKD) flaws risk estimates of GFR decline. Lesson from the MDRD Study [abstract no: F-PO175]. Journal of the American Society of Nephrology 2004;15(Oct):103A. [CENTRAL: CN-00550568] [Google Scholar]
- Rocco MV, Gassman JJ, Wang SR, Kaplan RM. Cross-sectional study of quality of life and symptoms in chronic renal disease patients: the Modification of Diet in Renal Disease Study. American Journal of Kidney Diseases 1997;29(6):888-96. [MEDLINE: ] [DOI] [PubMed] [Google Scholar]
- Sarnak MJ, Greene T, Wang X, Beck G, Kusek JW, Collins AJ, et al. The effect of a lower target blood pressure on the progression of kidney disease: long-term follow-up of the Modification of Diet in Renal Disease study. Annals of Internal Medicine 2005;142(5):342-51. [MEDLINE: ] [DOI] [PubMed] [Google Scholar]
- Sarnak MJ, Wang SR, Beck GJ, Kusek JW, Selhub J, Greene T, et al. Homocysteine, cysteine, and B vitamins as predictors of kidney disease progression. American Journal of Kidney Diseases 2002;40(5):932-9. [MEDLINE: ] [DOI] [PubMed] [Google Scholar]
- Sarnak MJ, Wang X, Greene T, Gerald J, Beck J, Kusek JW, et al. Effect of strict blood pressure control on long-term outcome in the Modification of Diet in Renal Disease (MDRD) study [abstract no: F-P0599]. Journal of the American Society of Nephrology 2003;14(Nov):192A. [CENTRAL: CN-00550403] [Google Scholar]
- Schluchter MD. Estimating correlation between alternative measures of disease progression in a longitudinal study. Modification of Diet in Renal Disease Study. Statistics in Medicine 1990;9(10):1175-88. [MEDLINE: ] [DOI] [PubMed] [Google Scholar]
- Stollar C, Scherch L, Adler S, Kusek J, Caggiula A. Patterns of patient dietary compliance in the modification of diet in renal disease (MDRD) study, phase III [abstract]. In: 12th International Congress of Nephrology; 1993 Jun 13-18; Jerusalem, Israel. 1993:609. [CENTRAL: CN-00583157]
- Tangri N, Stevens LA, Schmid CH, Zhang YL, Beck GJ, Greene T, et al. Changes in dietary protein intake has no effect on serum cystatin C levels independent of the glomerular filtration rate. Kidney International 2011;79(4):471-7. [MEDLINE: ] [DOI] [PMC free article] [PubMed] [Google Scholar]
- Yamamoto ME, Olson MB, Stollar C, MDRD Study Group. Effects of weight and na+ change on blood pressures of hypertensive MDRD study patients [abstract]. Journal of the American Society of Nephrology 1995;6(3):408. [CENTRAL: CN-00486522] [Google Scholar]
- Young JA, Terrin N, Greene T, Wang X, Beck G, Kusek J, et al. Asymmetric dimethylarginine and prevalent cardiovascular disease in patients with chronic kidney disease [abstract no: F-PO935]. Journal of the American Society of Nephrology 2007;18(Abstracts):308-9A. [CENTRAL: CN-00773718] [Google Scholar]
- Young JA, Terrin N, Wang X, Green T, Beck G, Kusek J, et al. ADMA and mortality in stage 3-4 chronic kidney disease [abstract no: TH-PO894]. Journal of the American Society of Nephrology 2008;19(Abstracts Issue):311A. [CENTRAL: CN-00773337] [Google Scholar]
Naimark 2001 {published data only}
- Naimark DM, Bott MT, Tobe SW. Facilitating the adoption of microalbuminuria (mau) screening among type II diabetic patients in primary care: preliminary results of a randomized educational intervention trial [abstract no: SU-P0826]. Journal of the American Society of Nephrology 2002;13(Program & Abstracts):638A. [CENTRAL: CN-00446889] [Google Scholar]
- Naimark DMJ, Bott MT, Tobe SW, Reznick RK, David D. Promotion of urine microalbuminuria screening among primary care physicians: a randomized, controlled, educational intervention trial [abstract no: A1191]. Journal of the American Society of Nephrology 2001;12(Program & Abstracts):231A. [CENTRAL: CN-00446890] [Google Scholar]
NCT05319600 {published data only}
- NCT05319600. Technology-delivered physical activity program for adolescents with type 1 diabetes (Activate) [Does a behavior change skills and physical activity program improve self-regulation and health outcomes in adolescents with type 1 diabetes?]. https://clinicaltrials.gov/ct2/show/NCT05319600 2022.
NCT05357742 {published data only}
- NCT05357742. Basic need navigation intervention to address unmet basic needs in African Americans with diabetic kidney disease [Basic needs navigation intervention to address multidimensional adversity in African Americans with diabetic kidney disease]. https://clinicaltrials.gov/show/NCT05357742 2022.
NCT06325917 {published data only}
- NCT06325917. Effect of diabetes self-management education and support on glycemic control among patients with type 2 diabetic (DSMES) [Effect of self-management education with ongoing support using social media on glycemic control among patients with diabetes type 2.]. https://clinicaltrials.gov/ct2/show/NCT06325917 2023.
NCT06444074 {published data only}
- NCT06444074. The PACT (Patient Activation Through Conversations) study [The PACT (Patient Activation Through Conversations) study - a cluster randomised trial of a health coach-led patient activation program in type 2 diabetes]. https://clinicaltrials.gov/ct2/show/NCT06444074 2024.
Nelson 2018 {published data only}
- Nelson RG, Pankratz VS, Ghahate DM, Bobelu J, Faber T, Shah VO. Home-based kidney care, patient activation, and risk factors for CKD progression in Zuni Indians: a randomized, controlled clinical trial. Clinical Journal of the American Society of Nephrology: CJASN 2018;13(12):1801-9. [CENTRAL: 30442864] [DOI] [PMC free article] [PubMed] [Google Scholar]
- Pankratz V, Choi E, Qeadan F, Ghahate D, Bobelu J, Nelson R, et al. Diabetes status modifies the efficacy of home-based kidney care for Zuni Indians in a randomized controlled trial. Journal of Diabetes & its Complications 2021;35(2):107753. [PMID: ] [DOI] [PMC free article] [PubMed] [Google Scholar]
- Shah V, Nelson R, Pankratz V, Ghahate D, Bobelu J. Reducing health disparity - PCORI supported home based kidney care approach in Zuni Indians [abstract no: SA-OR012]. Journal of the American Society of Nephrology 2017;28:74. [EMBASE: 633700647] [Google Scholar]
Nozaki 2005 {published data only}
- Nozaki C, Oka M, Chaboyer W. The effects of a cognitive behavioural therapy programme for self-care on haemodialysis patients. International Journal of Nursing Practice 2005;11(5):228-36. [MEDLINE: ] [DOI] [PubMed] [Google Scholar]
Osaki 2017 {published data only}
- Kazawa K, Osaki K, Rahman MM, Moriyama M. Evaluating the effectiveness and feasibility of nurse-led distant and face-to-face interviews programs for promoting behavioral change and disease management in patients with diabetic nephropathy: a triangulation approach. BMC Nursing 2020;19:16. [MEDLINE: ] [DOI] [PMC free article] [PubMed] [Google Scholar]
- Osaki K, Kazawa K, Moriyama M. Comparison of remote self management education with face-to-face education in patients with diabetic nephropathy: 12-month follow-up. Journal of Japan Academy of Diabetes Education & Nursing 2017;21(1):46-55. [Google Scholar]
Othman 2022 {published data only}
- Othman N, Gheith O, Al-Otaibi T, Said T, Halim MA, Elserwy N, et al. Effect of structured diabetes education on diabetic angiopathies among kidney transplant recipients with posttransplant diabetes: Kuwait experience. Experimental & Clinical Transplantation 2022;20(Suppl 1):46-54. [DOI: 10.6002/ect.MESOT2021.O19] [MEDLINE: ] [DOI] [PubMed] [Google Scholar]
Othman 2024 {published data only}
- Othman N, Al-Otaibi T, Halim MA, Said T, Elserwy N, Mahmoud F, et al. Effect of repeated structured diabetes education on lifestyle knowledge and self-care diabetes management in kidney transplant patients with posttransplant diabetes. Experimental & Clinical Transplantation 2024;22(Suppl 1):128‐40. [DOI: 10.6002/ect.MESOT2023.O31] [PMID: ] [DOI] [PubMed] [Google Scholar]
PANDIA‐IRIS 2021 {published data only}
- Bandiera C, Dotta-Celio J, Locatelli I, Nobre D, Wuerzner G, Pruijm M, et al. Interprofessional medication adherence program for patients with diabetic kidney disease: protocol for a randomized controlled and qualitative study (PANDIA-IRIS). JMIR Research Protocols 2021;10(3):e25966. [MEDLINE: ] [DOI] [PMC free article] [PubMed] [Google Scholar]
QICKD 2009 {published data only}
- McGovern AP, Rusholme B, Jones S, Vlymen JN, Liyanage H, Gallagher H, et al. Association of chronic kidney disease (CKD) and failure to monitor renal function with adverse outcomes in people with diabetes: a primary care cohort study. BMC Nephrology 2013;14:198. [PMID: ] [DOI] [PMC free article] [PubMed] [Google Scholar]
- Tahir MA, Dmitrieva O, Lusignan S, Vlymen J, Chan T, Golmohamad R, et al. Confidence and quality in managing CKD compared with other cardiovascular diseases and diabetes mellitus: a linked study of questionnaire and routine primary care data. BMC Family Practice 2011;12:83. [PMID: ] [DOI] [PMC free article] [PubMed] [Google Scholar]
Rachmani 2005 {published data only}
- Rachmani R, Levi Z, Slavachevski I, Avin M, Ravid M. Teaching patients to monitor their risk factors retards the progression of vascular complications in high-risk patients with Type 2 diabetes mellitus--a randomized prospective study. Diabetic Medicine 2002;19(5):385-92. [MEDLINE: ] [DOI] [PubMed] [Google Scholar]
- Rachmani R, Slavacheski I, Berla M, Frommer-Shapira R, Ravid M. Treatment of high-risk patients with diabetes: motivation and teaching intervention: a randomized, prospective 8-year follow-up study. Journal of the American Society of Nephrology 2005;16 Suppl 1:22-6. [MEDLINE: ] [DOI] [PubMed] [Google Scholar]
- Rachmani R, Slavachevski I, Berla M, Frommer-Shapira R, Ravid M. Teaching and motivating patients to control their risk factors retards progression of cardiovascular as well as microvascular sequelae of Type 2 diabetes mellitus- a randomized prospective 8 years follow-up study. Diabetic Medicine 2005;22(4):410-4. [MEDLINE: ] [DOI] [PubMed] [Google Scholar]
REDEEM 2013 {published data only}
- Fisher L, Hessler D, Glasgow RE, Arean PA, Masharani U, Naranjo D, et al. REDEEM: a pragmatic trial to reduce diabetes distress. Diabetes Care 2013;36(9):2551-8. [MEDLINE: ] [DOI] [PMC free article] [PubMed] [Google Scholar]
Roddy 2022 {published data only}
- Roddy MK, Mayberry LS, Nair D, Cavanaugh KL. Exploring mHealth potential to improve kidney function: secondary analysis of a randomized trial of diabetes self-care in diverse adults. BMC Nephrology 2022;23(1):280. [MEDLINE: ] [DOI] [PMC free article] [PubMed] [Google Scholar]
Shi 2020 {published data only}
- Shi C, Fang X, Yang Y, Bai R, Yu S, Sun G, et al. Intensive multifactorial intervention improved renal impairment in short-duration type 2 diabetes: a randomized, controlled, 7-year follow-up trial. Journal of Diabetes & its Complications 2020;34(1):107468. [MEDLINE: ] [DOI] [PubMed] [Google Scholar]
STENO‐2 1999 {published data only}
- Gaede P, Lund-Andersen H, Parving HH, Pedersen O. Effect of a multifactorial intervention on mortality in type 2 diabetes. New England Journal of Medicine 2008;358(6):580-91. [MEDLINE: ] [DOI] [PubMed] [Google Scholar]
- Gaede P, Oellgaard J, Kruuse C, Rossing P, Parving HH, Pedersen O. Beneficial impact of intensified multifactorial intervention on risk of stroke: outcome of 21 years of follow-up in the randomised STENO-2 Study. Diabetologia 2019;62(9):1575-80. [MEDLINE: ] [DOI] [PMC free article] [PubMed] [Google Scholar]
- Gaede P, Parving H, Pedersen O. Multifactorial intervention in patients with type 2 diabetes: long-term effects on mortality and vascular complications [abstract no: SA-FC042]. Journal of the American Society of Nephrology 2007;18(Abstracts):43A. [CENTRAL: CN-00740461] [Google Scholar]
- Gaede P, Valentine WJ, Palmer AJ, Tucker DM, Lammert M, Parving HH, et al. Cost-effectiveness of intensified versus conventional multifactorial intervention in type 2 diabetes: results and projections from the STENO-2 study. Diabetes Care 2008;31(8):1510-5. [MEDLINE: ] [DOI] [PMC free article] [PubMed] [Google Scholar]
- Gaede P, Vedel P, Larsen N, Jensen G, Parving HH, Pedersen O. The STENO-2 study: intensified multifactorial intervention reduces the risk of cardiovascular disease in patients with Type 2 diabetes and microalbuminuria [abstract no: 181]. In: 38th Annual Meeting of the European Association for the Study of Diabetes (EASD); 2002 Sep 1-5; Budapest, Hungary. 2002. [CENTRAL: CN-01912459]
- Gaede P, Vedel P, Larsen N, Jensen G, Parving HH, Pedersen O. The STENO-2 study: intensified multifactorial intervention reduces the risk of cardiovascular disease in patients with type 2 diabetes and microalbuminuria [abstract no: F-FC031]. Journal of the American Society of Nephrology 2002;13(September, Program & Abstracts):72A. [CENTRAL: CN-00445410] [Google Scholar]
- Gaede P, Vedel P, Larsen N, Jensen GV, Parving HH, Pedersen O. Multifactorial intervention and cardiovascular disease in patients with type 2 diabetes. New England Journal of Medicine 2003;348(5):383-93. [MEDLINE: ] [DOI] [PubMed] [Google Scholar]
- Gaede P, Vedel P, Obel J, Parving HH, Pedersen O. Intensive multifactorial intervention in NIDDM patients with persistent microalbuminuria [abstract no: A0561]. Journal of the American Society of Nephrology 1996;7(9):1357. [CENTRAL: CN-00445411] [Google Scholar]
- Gaede P, Vedel P, Parving HH, Pedersen O. Elevated levels of plasma von Willebrand factor and the risk of macro- and microvascular disease in type 2 diabetic patients with microalbuminuria. Nephrology Dialysis Transplantation 2001;16(10):2028-33. [MEDLINE: ] [DOI] [PubMed] [Google Scholar]
- Gaede P, Vedel P, Parving HH, Pedersen O. Intensified multifactorial intervention in patients with type 2 diabetes mellitus and microalbuminuria: the STENO type 2 randomised study. Lancet 1999;352(9153):617-22. [MEDLINE: ] [DOI] [PubMed] [Google Scholar]
- Gaede PH, Jepsen PV, Parving HH, Pedersen OB. Intensified multifactorial intervention in patients with type 2 diabetes mellitus and microalbuminuria: the STENO-2 study [Intensiveret multifaktoriel intervention hos patienter med type 2-diabetes mellitus og mikroalbuminuri: STENO-2-studiet]. Ugeskrift for Laeger 1999;161(30):4277-85. [MEDLINE: ] [PubMed] [Google Scholar]
- Oellgaard J, Gaede P, Rossing P, Persson F, Parving HH, Pedersen O. Intensified multifactorial intervention in type 2 diabetics with microalbuminuria leads to long-term renal benefits [Erratum in: Kidney Int. 2017 May;91(5):1257]. Kidney International 2017;91(4):982-8. [MEDLINE: ] [DOI] [PubMed] [Google Scholar]
- Oellgaard J, Gaede P, Rossing P, Rorth R, Kober L, Parving HH, et al. Reduced risk of heart failure with intensified multifactorial intervention in individuals with type 2 diabetes and microalbuminuria: 21 years of follow-up in the randomised STENO-2 study. Diabetologia 2018;61(8):1724-33. [MEDLINE: ] [DOI] [PMC free article] [PubMed] [Google Scholar]
STOP‐DKD 2018 {published data only}
- Diamantidis CJ, Bosworth HB, Oakes MM, Davenport CA, Pendergast JF, Patel S, et al. Simultaneous Risk Factor Control Using Telehealth to slOw Progression of Diabetic Kidney Disease (STOP-DKD) study: protocol and baseline characteristics of a randomized controlled trial. Contemporary Clinical Trials 2018;69:28-39. [MEDLINE: ] [DOI] [PMC free article] [PubMed] [Google Scholar]
- Kobe EA, Diamantidis CJ, Bosworth HB, Davenport CA, Oakes M, Alexopoulos AS, et al. Racial differences in the effectiveness of a multifactorial telehealth intervention to slow diabetic kidney disease. Medical Care 2020;58(11):968-73. [MEDLINE: ] [DOI] [PMC free article] [PubMed] [Google Scholar]
- Zullig LL, Diamantidis CJ, Bhapkar MV, Barnhart H, Oakes MM, Bosworth H, et al. Racial differences in nocturnal dipping status in diabetic kidney disease (DKD): results from the STOP-DKD study [abstract no: SA-PO688]. Journal of the American Society of Nephrology 2016;27(Abstract Suppl):788A. [EMBASE: 641133163] [Google Scholar]
- Zullig LL, Jazowski SA, Davenport CA, Diamantidis CJ, Oakes MM, Patel S, et al. Primary care providers' acceptance of pharmacists' recommendations to support optimal medication management for patients with diabetic kidney disease. Journal of General Internal Medicine 2020;35(1):63-9. [PMID: ] [DOI] [PMC free article] [PubMed] [Google Scholar]
SURE 2009 {published data only}
- Chan JC, So WY, Yeung CY, Ko GT, Lau IT, Tsang MW, et al. Effects of structured versus usual care on renal endpoint in type 2 diabetes: the SURE study: a randomized multicenter translational study. Diabetes Care 2009;32(6):977-82. [MEDLINE: ] [DOI] [PMC free article] [PubMed] [Google Scholar]
- Ko GT, Yeung CY, Leung WY, Chan KW, Chung CH, Fung LM, et al. Cost implication of team-based structured versus usual care for type 2 diabetic patients with chronic renal disease. Hong Kong Medical Journal 2011;17 Suppl 6:9-12. [MEDLINE: ] [PubMed] [Google Scholar]
Tan 2019 {published data only}
- Tan E, Khoo J, Gani LU, Malakar RD, Tay TL, Tirukonda PS, et al. Effect of multidisciplinary intensive targeted care in improving diabetes mellitus outcomes: a randomized controlled pilot study - the Integrated Diabetes Education, Awareness and Lifestyle modification in Singapore (IDEALS) Program. Trials 2019;20(1):549. [PMID: ] [DOI] [PMC free article] [PubMed] [Google Scholar]
Tsay 2003 {published data only}
- Tsay SL. Self-efficacy training for patients with end-stage renal disease. Journal of Advanced Nursing 2003;43(4):370-5. [MEDLINE: ] [DOI] [PubMed] [Google Scholar]
Tsay 2004c {published data only}
- Tsay SL, Hung LO. Empowerment of patients with end-stage renal disease--a randomized controlled trial. International Journal of Nursing Studies 2004;41(1):59-65. [MEDLINE: ] [DOI] [PubMed] [Google Scholar]
Tsay 2005 {published data only}
- Tsay SL, Lee YC, Lee YC. Effects of an adaptation training programme for patients with end-stage renal disease. Journal of Advanced Nursing 2005;50(1):39-46. [MEDLINE: ] [DOI] [PubMed] [Google Scholar]
Tsuji‐Hayashi 2000 {published data only}
- Tsuji-Hayashi Y, Fitts SS, Abeyta VA, Young BA, Blagg CR. The new dialysis version of the Dartmouth Coop Educational System: effectiveness in improving health status and quality of life [abstract no: A1294]. Journal of the American Society of Nephrology 2000;11(Sept):246A. [CENTRAL: CN-00583293] [Google Scholar]
Tuot 2018 {published data only}
- Tuot DS, McCulloch CE, Velasquez A, Schillinger D, Hsu CY, Handley M, et al. Impact of a primary care CKD registry in a US public safety-net health care delivery system: a pragmatic randomized trial. American Journal of Kidney Diseases 2018;72(2):168-77. [PMID: ] [DOI] [PMC free article] [PubMed] [Google Scholar]
Ueki 2021 {published data only}
- Ueki K, Sasako T, Okazaki Y, Miyake K, Nangaku M, Ohashi Y, et al. Multifactorial intervention has a significant effect on diabetic kidney disease in patients with type 2 diabetes. Kidney International 2021;99(1):256-66. [PMID: ] [DOI] [PubMed] [Google Scholar]
Woolf 2017 {published data only}
- Woolf K, Ganguzza L, Pompeii ML, Hu L, St-Jules DE, Jagannathan R, et al. Weight loss and self-efficacy in obese/overweight patients with type 2 diabetes and chronic kidney disease in a lifestyle intervention pilot study [abstract no: 970.8]. FASEB Journal 2017;31(1 Suppl 1):--. [EMBASE: 616960059] [Google Scholar]
Yalcin 2008 {published data only}
- Yalcin BM, Karahan TF, Ozcelik M, Igde FA. The effects of an emotional intelligence program on the quality of life and well-being of patients with type 2 diabetes mellitus. Diabetes Educator 2008;34(6):1013-24. [MEDLINE: ] [DOI] [PubMed] [Google Scholar]
Zhu 2021 {published data only}
- Zhu J, Chen M, Pang Y, Li S. Impact of lifestyle education for type 2 diabetes mellitus: protocol for a randomized controlled trial. Medicine 2021;100(1):e24208. [PMID: ] [DOI] [PMC free article] [PubMed] [Google Scholar]
References to studies awaiting assessment
NCT00782847 {unpublished data only}
- Merker LF. Evaluation study for the programme DiaNe for people with diabetic nephropathy (DiaNe) [A prospective controlled randomized multicenter trial to evaluate the effect of a structurized multifactorial behavior modifying consultation and support programme DiaNe for people with diabetic nephropathy]. https://clinicaltrials.gov/study/NCT00782847 (first received 31 October 2008).
Suvamat 2023 {published data only}20230830001
- Suvamat J, Powwattana A, Thaingtham W, Pichayapinyo P, Boonlue S. Effectiveness of program to slow progression of chronic kidney disease among T2DM with HT with CKD 3 in the community: a randomized controlled trial. Journal of Primary Care & Community Health 2023;14:21501319231210619. [DOI: 10.1177/21501319231210619] [PMID: ] [DOI] [PMC free article] [PubMed] [Google Scholar]
References to ongoing studies
NCT03413215 {unpublished data only}
- Khoo J. Effects of multidisciplinary intensive targeted care in improving diabetes outcomes: a pilot study in Singapore (IDEALS) [Effects of multidisciplinary intensive targeted care in improving diabetes outcomes: a randomized controlled pilot study - the integrated diabetes education, awareness and lifestyle modification in Singapore (IDEALS) program]. https://clinicaltrials.gov/study/NCT03413215 (first received: 29 January 2018). [DOI] [PMC free article] [PubMed]
Additional references
ADA 2001
- Mensing C, Boucher J, Cypress M, Weinger K, Mulcahy K, Barta P, et al. National standards for diabetes self-management education. Diabetes Care 2001;24(Suppl 1):S126-33. [EMBASE: 32049617] [Google Scholar]
Afkarian 2016
- Afkarian M, Zelnick LR, Hall YN, Heagerty PJ, Tuttle K, Weiss NS, et al. Clinical manifestations of kidney disease among US adults with diabetes, 1988-2014. JAMA 2016;316(6):602-10. [PMID: ] [DOI] [PMC free article] [PubMed] [Google Scholar]
AIHW 2024
- Australian Institute of Health and Welfare. Chronic kidney disease: Australian facts. www.aihw.gov.au/reports/chronic-kidney-disease/chronic-kidney-disease/contents/about (accessed 20 July 2024).
Anekwe 2018
- Anekwe TD, Rahkovsky I. Self-management: a comprehensive approach to management of chronic conditions. American Journal of Public Health 2018;108(Suppl 6):S430–6. [Google Scholar]
Aziz 2018
- Aziz Z, Riddell MA, Absetz P, Brand M, Oldenburg B. Peer support to improve diabetes care: an implementation evaluation of the Australasian Peers for Progress Diabetes Program. BMC Public Health 2018;18(1):262. [PMID: ] [DOI] [PMC free article] [PubMed] [Google Scholar]
Baig 2015
- Baig AA, Benitez A, Quinn MT, Burnet DL. Family interventions to improve diabetes outcomes for adults. Annals of the New York Academy of Sciences 2015;1353:89-112. [PMID: ] [DOI] [PMC free article] [PubMed] [Google Scholar]
Boulton 1998
- Boulton AJ, Gries FA, Jervell JA. Guidelines for the diagnosis and outpatient management of diabetic peripheral neuropathy. Diabetic Medicine 1998;15(6):508-14. [MEDLINE: ] [DOI] [PubMed] [Google Scholar]
Bradley 1999
- Bradley C, Todd C, Gorton T, Symonds E, Martin A, Plowright R. The development of an individualized questionnaire measure of perceived impact of diabetes on quality of life: the ADDQoL. Quality of Life Research 1999;8(1-2):79-91. [MEDLINE: ] [DOI] [PubMed] [Google Scholar]
Brown 1990
- Brown SA. Studies of educational interventions and outcomes in diabetic adults: a meta-analysis revisited. Patient Education & Counseling 1990;16(3):189-215. [MEDLINE: ] [DOI] [PubMed] [Google Scholar]
Calman 1994
- Calman K. On the state of the public health. Health Trends 1994;26(2):30-7. [MEDLINE: ] [PubMed] [Google Scholar]
Captieux 2018
- Captieux M, Pearce G, Parke HL, Epiphaniou E, Wild S, Taylor SJ, et al. Supported self-management for people with type 2 diabetes: a meta-review of quantitative systematic reviews. BMJ Open 2018;8(12):e024262. [PMID: ] [DOI] [PMC free article] [PubMed] [Google Scholar]
Chantrel 1999
- Chantrel F, Enache I, Bouiller M, Kolb I, Kunz K, Petitjean P, et al. Abysmal prognosis of patients with type 2 diabetes entering dialysis. Nephrology Dialysis Transplantation 1999;14(1):129-36. [MEDLINE: ] [DOI] [PubMed] [Google Scholar]
Chen 2016
- Chen J, Mullins CD, Novak P, Thomas SB. Personalized strategies to activate and empower patients in health care and reduce health disparities. Health Education & Behavior 2016;43(1):25-34. [PMID: ] [DOI] [PMC free article] [PubMed] [Google Scholar]
Chuang 2021
- Chuang LM, Wu SV, Lee MC, Lin LJ, Liang SY, Lai PC, K, et al. The effects of knowledge and self-management of patients with early-stage chronic kidney disease: self-efficacy is a mediator. Japan Journal of Nursing Science : JJNS 2021;18(2):e12388. [PMID: ] [DOI] [PubMed] [Google Scholar]
Collins 2005
- Collins AJ, Kasiske B, Herzog C, Chavers B, Foley R, Gilbertson D, et al. Excerpts from the United States Renal Data System 2004 annual data report: atlas of end-stage renal disease in the United States. American Journal of Kidney Diseases 2005;45(1 Suppl 1):A5-7. [MEDLINE: ] [DOI] [PubMed] [Google Scholar]
Cowie 1989
- Cowie CC, Port FK, Wolfe RA, Savage PJ, Moll PP, Hawthorne VM. Disparities in incidence of diabetic end stage renal disease according to race and type of diabetes. New England Journal of Medicine 1989;321(16):1074-9. [MEDLINE: ] [DOI] [PubMed] [Google Scholar]
De Boer 2011
- De Boer IH, Rue TC, Hall YN, Heagerty PJ, Weiss NS, Himmelfarb J. Temporal trends in the prevalence of diabetic kidney disease in the United States. JAMA 2011;305(24):2532-9. [PMID: ] [DOI] [PMC free article] [PubMed] [Google Scholar]
Dorresteijn 2014
- Dorresteijn JA, Kriegsman DM, Assendelft WJ, Valk GD. Patient education for preventing diabetic foot ulceration. Cochrane Database of Systematic Reviews 2014, Issue 12. Art. No: CD001488. [DOI: 10.1002/14651858.CD001488.pub5] [DOI] [PMC free article] [PubMed] [Google Scholar]
Duke 2009
- Duke SA, Colagiuri S, Colagiuri R. Individual patient education for people with type 2 diabetes mellitus. Cochrane Database of Systematic Reviews 2009, Issue 1. Art. No: CD005268. [DOI: 10.1002/14651858.CD005268.pub2] [DOI] [PMC free article] [PubMed] [Google Scholar]
Ellis 2004
- Ellis SE, Speroff T, Dittus RS, Brown A, Pichert JW, Elasy TA. Diabetes patient education: a meta-analysis and meta-regression. Patient Education & Counseling 2004;52(1):97-105. [MEDLINE: ] [DOI] [PubMed] [Google Scholar]
Foley 2009
- Foley R, Collins A. The growing economic burden of diabetic kidney disease. Current Diabetes Reports 2009;9(6):460-5. [PMID: ] [DOI] [PubMed] [Google Scholar]
Gary 2003
- Gary TL, Genkinger JM, Guallar E, Peyrot M, Brancati FL. Meta-analysis of randomized educational and behavioral interventions in type 2 diabetes. Diabetes Educator 2003;29(3):488-501. [MEDLINE: ] [DOI] [PubMed] [Google Scholar]
GBD 2015
- Anonymous. Global, regional, and national life expectancy, all-cause mortality, and cause-specific mortality for 249 causes of death, 1980-2015: a systematic analysis for the Global Burden of Disease Study 2015. Lancet 2016;388(10053):1459-544. [PMID: ] [DOI] [PMC free article] [PubMed] [Google Scholar]
Gheith 2016
- Gheith O, Farouk N, Nampoory N, Halim MA, Al-Otaibi T. Diabetic kidney disease: world wide difference of prevalence and risk factors. Journal of Nephropharmacology 2016;5(1):49-56. [PMID: ] [PMC free article] [PubMed] [Google Scholar]
GRADE 2008
- Guyatt GH, Oxman AD, Vist GE, Kunz R, Falck-Ytter Y, Alonso-Coello P, et al. GRADE: an emerging consensus on rating quality of evidence and strength of recommendations. BMJ 2008;336(7650):924-6. [MEDLINE: ] [DOI] [PMC free article] [PubMed] [Google Scholar]
GRADE 2011
- Guyatt G, Oxman AD, Akl EA, Kunz R, Vist G, Brozek J, et al. GRADE guidelines: 1. Introduction-GRADE evidence profiles and summary of findings tables. Journal of Clinical Epidemiology 2011;64(4):383-94. [MEDLINE: ] [DOI] [PubMed] [Google Scholar]
Griva 2011
- Griva K, Mooppil N, Seet P, Krishnan DSP, James H, Newman SP. The NKF-NUS hemodialysis trial protocol - a randomized controlled trial to determine the effectiveness of a self management intervention for hemodialysis patients. BMC Nephrology 2011;12:4. [PMID: ] [DOI] [PMC free article] [PubMed] [Google Scholar]
Griva 2015
- Griva K, Mooppil N, Khoo E, Lee VY, Kang AW, Newman SP. Improving outcomes in patients with coexisting multimorbid conditions-the development and evaluation of the combined diabetes and renal control trial (C-DIRECT): study protocol. BMJ Open 2015;5(2):e007253. [PMID: ] [DOI] [PMC free article] [PubMed] [Google Scholar]
Griva 2018
- Griva K, Nandakumar M, Ng JH, Lam KF, McBain H, Newman SP. Hemodialysis self-management intervention randomized trial (HED-SMART): a practical low-intensity intervention to improve adherence and clinical markers in patients receiving haemodialysis [Erratum in: Am J Kidney Dis. 2018 Jul;72(1):157-158]. American Journal of Kidney Diseases 2018;71(3):371-81. [PMID: ] [DOI] [PubMed] [Google Scholar]
Gutman 2019
- Gutman T, Lopez-Vargas P, Manera KE, Craig JC, Howell M, Tunnicliffe D, et al. Identifying and integrating patient and caregiver perspectives in clinical practice guidelines for percutaneous renal biopsy. Nephrology 2019;24(4):395-404. [PMID: ] [DOI] [PubMed] [Google Scholar]
Hawthorne 2008
- Hawthorne K, Robles Y, Cannings-John R, Edwards AG. Culturally appropriate health education for type 2 diabetes mellitus in ethnic minority groups. Cochrane Database of Systematic Reviews 2008, Issue 3. Art. No: CD006424. [DOI: 10.1002/14651858.CD006424.pub2] [DOI] [PubMed] [Google Scholar]
Helou 2016
- Helou N, Dwyer A, Shaha M, Zanchi A. Multidisciplinary management of diabetic kidney disease: a systematic review and meta-analysis. JBI Database of Systematic Reviews & Implementation Reports 2016;14(7):169-207. [PMID: ] [DOI] [PubMed] [Google Scholar]
Higgins 2003
- Higgins JP, Thompson SG, Deeks JJ, Altman DG. Measuring inconsistency in meta-analyses. BMJ 2003;327(7414):557-60. [MEDLINE: ] [DOI] [PMC free article] [PubMed] [Google Scholar]
Higgins 2022
- Higgins JP, Thomas J, Chandler J, Cumpston M, Li T, Page MJ, et al. Cochrane Handbook for Systematic Reviews of Interventions version 6.3 (updated February 2022). Cochrane, 2022. Available from www.training.cochrane.org/handbook.
Hoogwerf 1992
- Hoogwerf BJ. Patient Questionnaire Diabetes Form 2.1. Bloomington, MN: Health Outcomes Institute, 1992. [Google Scholar]
Jenkinson 1996
- Jenkinson C, Layte R, Wright L, Coulter A. The UK SF-36: An Analysis and Interpretation. Oxford: Department of Public Health and Primary Care, University of Oxford, 1996. [Google Scholar]
Jitraknatee 2020
- Jitraknatee J, Ruengorn C, Nochaiwong S. Prevalence and risk factors of chronic kidney disease among type 2 diabetes patients: a cross-sectional study in primary care practice. Scientific Reports 2020;10(1):6205. [PMID: ] [DOI] [PMC free article] [PubMed] [Google Scholar]
Kaplan‐Lewis 2013
- Kaplan-Lewis E, Percac-Lima S. No-show to primary care appointments: why patients do not come. Journal of Primary Care & Community Health 2013;4(4):251–5. [PMID: ] [DOI] [PubMed] [Google Scholar]
Kasper 2005
- Kasper DL, Harrison TR. Glomerular diseases. In: Harrison's Principles of Internal Medicine. 16th edition. New York: McGraw-Hill, 2005:1688-9. [Google Scholar]
KDIGO 2009
- Anonymous. KDIGO clinical practice guideline for the diagnosis, evaluation, prevention, and treatment of Chronic Kidney Disease-Mineral and Bone Disorder (CKD-MBD). Kidney International - Supplement 2009;76(113):1–130. [MEDLINE: ] [DOI] [PubMed] [Google Scholar]
KDIGO 2022
- Martin P, Awan AA, Berenguer MC, Bruchfeld A, Fabrizi F, Goldberg DS, et al. Executive summary of the KDIGO 2022 clinical practice guideline for the prevention, diagnosis, evaluation, and treatment of hepatitis c in chronic kidney disease. Kidney International 2022;102(6):1228-37. [PMID: ] [DOI] [PubMed] [Google Scholar]
KDIGO 2022a
- Anonymous. KDIGO 2022 clinical practice guideline for diabetes management in chronic kidney disease. Kidney International 2022;102(5S):S1-127. [PMID: ] [DOI] [PubMed] [Google Scholar]
KDOQI 2007
- Anonymous. KDOQI clinical practice guidelines and clinical practice recommendations for diabetes and chronic kidney disease. American Journal of Kidney Diseases 2007;49(2 Suppl 2):S12-154. [MEDLINE: ] [DOI] [PubMed] [Google Scholar]
KDOQI 2012
- Anonymous. KDOQI clinical practice guideline for diabetes and CKD: 2012 update. American Journal of Kidney Diseases 2012;60(5):850-86. [PMID: ] [DOI] [PubMed] [Google Scholar]
KHA 2010
- Kidney Health Australia. The economic impact of ESKD in Australia - Projections to 2020. The-economic-impact-of-end-stage-kidney-disease-in-Australia-Projections-to-2020.pdf 2010.
Kim 2019
- Kim U, Utz S. Effectiveness of a social media-based, health literacy-sensitive diabetes self-management intervention: a randomized controlled trial. Journal of Nursing Scholarship 2019;51(6):661–9. [PMID: ] [DOI] [PubMed] [Google Scholar]
Kjaergard 1999
- Kjaergard LL, Villumsen J, Gluud C. Quality of randomised clinical trials affects estimates of intervention efficacy [abstract]. In: 7th Annual Cochrane Colloquium; 1999 Oct 5-9; Rome, Italy. 1999:57.
Lopez‐Vargas 2016
- Lopez-Vargas PA, Tong A, Howell M, Craig JC. Educational interventions for patients with CKD: a systematic review. American Journal of Kidney Diseases 2016;68(3):353-70. [PMID: ] [DOI] [PubMed] [Google Scholar]
Middleton 2006
- Middleton RJ, Foley RN, Hegarty J, Cheung CM, McElduff P, Gibson JM, et al. The unrecognized prevalence of chronic kidney disease in diabetes. Nephrology Dialysis Transplantation 2006;21(1):88-92. [MEDLINE: ] [DOI] [PubMed] [Google Scholar]
Mohamed 2019
- Mohamed A, Staite E, Ismail K, Winkley K. A systematic review of diabetes self-management education interventions for people with type 2 diabetes mellitus in the Asian Western Pacific (AWP) region. Nursing Open 2019;6(4):1424-37. [PMID: ] [DOI] [PMC free article] [PubMed] [Google Scholar]
Moher 1998
- Moher D, Pham B, Jones A, Cook DJ, Jadad AR, Moher M, et al. Does quality of reports of randomised trials affect estimates of intervention efficacy reported in meta-analyses? Lancet 1998;352(9128):609-13. [MEDLINE: ] [DOI] [PubMed] [Google Scholar]
Moher 2009
- Moher D, Liberati A, Tetzlaff J, Altman DG. Preferred reporting items for systematic reviews and meta-analyses: the PRISMA statement. PLoS Medicine 2009;6(7):e1000097. [PMID: ] [DOI] [PMC free article] [PubMed] [Google Scholar]
Narres 2016
- Narres M, Claessen H, Droste S, Kvitkina T, Koch M, Kuss O, et al. The incidence of end-stage renal disease in the diabetic (compared to the non-diabetic) population: a systematic review. PloS ONE [Electronic Resource] 2016;11(1):e0147329. [PMID: ] [DOI] [PMC free article] [PubMed] [Google Scholar]
Norris 2001
- Norris SL, Engelgau MM, Narayan KM. Effectiveness of self-management training in type 2 diabetes: a systematic review of randomized controlled trials. Diabetes Care 2001;24(3):561-87. [MEDLINE: ] [DOI] [PubMed] [Google Scholar]
Norris 2002
- Norris SL, Lau J, Smith SJ, Schmid CH, Engelgau MM. Self-management education for adults with type 2 diabetes: a meta-analysis of the effect on glycemic control. Diabetes Care 2002;25(7):1159-71. [MEDLINE: ] [DOI] [PubMed] [Google Scholar]
Pecoraro 1990
- Pecoraro RE, Reiber GE, Burgess EM. Pathways to diabetic limb amputation, basis for prevention. Diabetes Care 1990;13(5):513-21. [MEDLINE: ] [DOI] [PubMed] [Google Scholar]
Persson 2018
- Persson F, Rossing R. Diagnosis of diabetic kidney disease: state of the art and future perspective. Kidney International Supplements 2018;8(1):2-7. [PMID: ] [DOI] [PMC free article] [PubMed] [Google Scholar]
Pugh 1988
- Pugh JA, Stern MP, Haffner SM, Eifler CW, Zapata M. Excess incidence of treatment of end-stage renal disease in Mexican Americans. American Journal of Epidemiology 1988;127(1):135-44. [MEDLINE: ] [DOI] [PubMed] [Google Scholar]
Ritz 1999
- Ritz E, Rychlik I, Locatelli F, Halimi S. End-stage renal failure in type 2 diabetes: a medical catastrophe of worldwide dimensions. American Journal of Kidney Diseases 1999;34(5):795-808. [MEDLINE: ] [DOI] [PubMed] [Google Scholar]
Schulz 1995
- Schulz KF, Chalmers I, Hayes RJ, Altman DG. Empirical evidence of bias. Dimensions of methodological quality associated with estimates of treatment effects in controlled trials. JAMA 1995;273(5):408-12. [MEDLINE: ] [DOI] [PubMed] [Google Scholar]
Schünemann 2022a
- Schünemann HJ, Higgins JP, Vist GE, Glasziou P, Akl EA, Skoetz N, et al. Chapter 14: Completing ‘Summary of findings’ tables and grading the certainty of the evidence. In: Higgins JP, Thomas J, Chandler J, Cumpston M, Li T, Page MJ, Welch VA (editors). Cochrane Handbook for Systematic Reviews of Interventions version 6.3 (updated February 2022). Cochrane, 2022. Available from www.training.cochrane.org/handbook.
Schünemann 2022b
- Schünemann HJ, Vist GE, Higgins JP, Santesso N, Deeks JJ, Glasziou P, et al. Chapter 15: Interpreting results and drawing conclusions. In: Higgins JP, Thomas J, Chandler J, Cumpston M, Li T, Page MJ, Welch VA (editors). Cochrane Handbook for Systematic Reviews of Interventions version 6.3 (updated February 2022). Cochrane, 2022. Available from www.training.cochrane.org/handbook.
Selvin 2007
- Selvin E, Manzi J, Stevens LA, Van Lente F, Lacher DA, Levey AS, et al. Calibration of serum creatinine in the National Health and Nutrition Examination Surveys (NHANES) 1988-1994, 1999-2004. American Journal of Kidney Diseases 2007;50(6):918-26. [PMID: ] [DOI] [PubMed] [Google Scholar]
Shen 2016
- Shen Y, Cai R, Sun J, Dong X, Huang R, Tian S, et al. Diabetes mellitus as a risk factor for incident chronic kidney disease and end-stage renal disease in women compared with men: a systematic review and meta-analysis. Endocrine 2017;55(1):66-76. [PMID: ] [DOI] [PubMed] [Google Scholar]
Shi 2016
- Shi M, Xu MY, Liu ZL, Duan XY, Zhu YB, Shi HM, et al. Effectiveness of family involvement in newly diagnosed type 2 diabetes patients: a follow-up study. Patient Education & Counseling 2016;99(5):776-82. [PMID: ] [DOI] [PubMed] [Google Scholar]
Slama‐Chaudhry 2019
- Slama-Chaudhry A, Golay A. Patient education and self-management support for chronic disease: methodology for implementing patient-tailored therapeutic programmes. Public Health Panorama 2019;5(2-3):357-61. [Google Scholar]
Smedley 2002
- Smedley BD, Stith AY, Nelson AR. Unequal Treatment Confronting Racial and Ethnic Disparities in Healthcare. Washington, DC: Institute of Medicine, National Academy Press, 2002. [PubMed] [Google Scholar]
SONG‐CKD 2018
- Tong A, Manns B, Wang AYM, Hemmelgarn B, Wheeler DC, Gill J, et al. Implementing core outcomes in kidney disease: report of the Standardized Outcomes in Nephrology (SONG) implementation workshop. Kidney International 2018;94(6):1053-68. [PMID: ] [DOI] [PMC free article] [PubMed] [Google Scholar]
Steed 2003
- Steed L, Cooke D, Newman S. A systematic review of psychosocial outcomes following education, self-management and psychological interventions in diabetes mellitus. Patient Education & Counseling 2003;51(1):5-15. [MEDLINE: ] [DOI] [PubMed] [Google Scholar]
Tong 2012
- Tong A, Lopez-Vargas P, Howell M, Phoon R, Johnson D, Campbell D, et al. Consumer involvement in topic and outcome selection in the development of clinical practice guidelines. Health Expectations 2012;15(4):410-23. [PMID: ] [DOI] [PMC free article] [PubMed] [Google Scholar]
Toto 2002
- Toto RD. Appropriate drug therapy for improving outcomes in diabetic nephropathy. Current Diabetes Reports 2002;2(6):545-52. [MEDLINE: ] [DOI] [PubMed] [Google Scholar]
USRDS 1998
- National Institutes of Health, National Institute of Diabetes and Digestive and Kidney Diseases. USRDS Annual Data Report (ADR) 1998. http://www.usrds.org/adr_1998.htm (Last accessed July 2008).
USRDS 2000
- National Institutes of Health, National Institute of Diabetes and Digestive and Kidney Diseases. USRDS Annual Data Report (ADR) 2000. http://www.usrds.org/adr_2000.htm (Last accessed April 2011).
USRDS 2001
- National Institutes of Health, National Institute of Diabetes and Digestive and Kidney Diseases. USRDS 2001 Annual Data Report: Atlas of End-Stage Renal Disease. http://www.usrds.org/adr_2001.htm (last accessed April 2011).
USRDS 2005
- National Institutes of Health, National Institute of Diabetes and Digestive and Kidney Diseases. USRDS 2005 Annual Data Report: Atlas of End-Stage Renal Disease. http://www.usrds.org/adr_2005.htm (Last accessed April 2011).
USRDS 2009
- National Institutes of Health, National Institute of Diabetes and Digestive and Kidney Diseases. USRDS 2009 Annual Data Report: Atlas of End-Stage Renal Disease. http://www.usrds.org/adr_2009.htm (Last accessed April 2011).
van Dieren 2010
- Dieren S, Beulens JW, Schouw YT, Grobbee DE, Neal B. The global burden of diabetes and its complications: an emerging pandemic. European Journal of Cardiovascular Prevention & Rehabilitation 2010;17 Suppl 1:S3-8. [PMID: ] [DOI] [PubMed] [Google Scholar]
White 2014
- White S, Chadban S. Diabetic kidney disease in Australia: current burden and future projections. Nephrology 2014;19(8):450-8. [PMID: ] [DOI] [PubMed] [Google Scholar]
WHO 1999
- World Health Organization. Definition, diagnosis and classification of diabetes mellitus and its complications: report of a WHO consultation. Part 1, Diagnosis and classification of diabetes mellitus. https://iris.who.int/handle/10665/66040 (accessed July 2024).
Windrum 2016
- Windrum P, Garcia-Goni M, Coad H. The impact of patient-centered versus didactic education programs in chronic patients by severity: the case of type 2 diabetes mellitus. Value in Health 2016;19(4):353-62. [PMID: ] [DOI] [PubMed] [Google Scholar]
References to other published versions of this review
Li 2011
- Li T, Wu HM, Wang F, Huang CQ, Yang M, Dong BR, et al. Education programmes for people with diabetic kidney disease. Cochrane Database of Systematic Reviews 2011, Issue 6. Art. No: CD007374. [DOI: 10.1002/14651858.CD007374.pub2] [DOI] [PubMed] [Google Scholar]
Wu 2008
- Wu HM, Wang F, Huang CQ, Yang M, Dong BR, Liu GJ. Education programmes for people with diabetic kidney disease. Cochrane Database of Systematic Reviews 2008, Issue 4. Art. No: CD007374. [DOI: 10.1002/14651858.CD007374] [DOI] [PubMed] [Google Scholar]