Abstract
De novo mutations occur at substantially different rates depending on genomic location, sequence context and DNA strand. The success of methods to estimate selection intensity, infer demographic history and map rare disease genes, depends strongly on assumptions about the local mutation rate. Here we present Roulette, a genome-wide mutation rate model at basepair resolution that incorporates known determinants of local mutation rate. Roulette is shown to be more accurate than existing models. We use Roulette to refine the estimates of population growth within Europe by incorporating the full range of human mutation rates. The analysis of significant deviations from the model predictions revealed a tenfold increase in mutation rate in nearly all genes transcribed by polymerase III (Pol III), suggesting a new mutagenic mechanism. We also detected an elevated mutation rate within transcription factor binding sites restricted to sites actively used in testis and residing in promoters.
The human single-nucleotide mutation rate varies along the genome at different scales1–5. Some of this variation is explained by the combination of mutation type (for example, A > T) and the two nucleotides immediately adjacent to the site. This combination of a mutation’s context and identity is conceptualized as the mutation spectra6,7. The CpG dinucleotide context induces by far the largest spectrum effect because of the strongly mutagenic impact of methylation at cytosines followed by guanine8. The extended sequence context, well beyond the two adjacent bases, also affects mutation rates9–11. Additionally, mutation spectra and their associated rates vary spatially along the genome and are influenced by large-scale genetic and epigenetic features, indicating that factors beyond local sequence context and DNA methylation are important to understanding mutation rate variation4,5,10,12.
While the biological model of human mutagenesis remains incomplete, features such as replication timing, methylation, chromatin modifications, recombination rate and gene expression have been functionally and statistically associated with local mutation rate4,5,10. Other discovered mutational processes lack known genetic and epigenetic correlates. The most striking example is a mutation process acting in the female germline characterized by clustered mutations with a high fraction of C > G substitutions13,14. The activity of this process is highly localized along the genome with no obvious pattern with respect to sequence or epigenetics. Another important property of mutagenesis is DNA strand specificity. Mutation rates and spectra differ between transcribed and nontranscribed strands due to the action of transcription-coupled nucleotide excision repair, while replication direction influences mutagenesis because error profiles of DNA replication and damage resolution pathways differ between leading and lagging strands15,16.
Site-specific mutation rate estimates are a necessary input to genetic methods with applications ranging from rare disease gene mapping17–19 to estimation of selective constraint7,20,21, while many others are sensitive to mutation rate variation. Ideally, statistical models of mutation rates should incorporate the full range of known mutagenic processes and correlates to produce site-specific estimates. This involves incorporating as covariates DNA features ranging from methylation and extended sequence context to the directions of replication and transcription while also accounting for regional mutation rate variation lacking known genetic or epigenetic proxies. Currently used germline mutation rate models have incorporated some but not all of these features simultaneously7,10,12. In particular, strand-specific sources of mutation rate heterogeneity have been omitted, even though they were included in some models of cancer mutagenesis22.
In this Article, we present a new basepair-level mutation rate model, ‘Roulette’, for human single-nucleotide substitutions. Roulette incorporates extended context, epigenomic features such as measurements of transcription levels and methylation in testis, strand specificity with respect to transcription and replication and the observed regional variation in rare single-nucleotide variant (SNV) rate. The latter allows us to incorporate both known and unknown factors influencing mutagenesis on spatial scales exceeding 50 KB. Roulette estimates capture between 80% and 90% of mutation rate heterogeneity along the human genome, according to two metrics developed to assess residual variance. We applied Roulette to recalculate the strength of negative selection for every gene, recalibrate a demographic model of historical population size changes and estimate neutral allele frequency distributions as dependent on mutation rate. Another obvious application of precise mutation rate estimates is the identification of unmodeled and previously uncharacterized mutagenic forces as model outliers at different scales. This analysis finds the following two such processes: transcription by polymerase III (Pol III) increases mutation rate by an order of magnitude and binding of transcription factor (TF) in testis increases T > G rate (~1.6-fold).
Results
Structure of mutation rate model
We estimated mutation rates at each nucleotide for one of the three potential mutations which we hereafter refer to as ‘sites’. The extended sequence context is included by estimating the effect of the six upstream and six downstream adjacent nucleotides (Fig. 1a). Due to sparsity, it is impossible to accurately estimate the effects of unique 12-nucleotide contexts. We instead estimated the effect of the central pentamer separately from the individual effects of the eight more distant nucleotides (Fig. 1a,b). For epigenomic features, Roulette incorporates methylation level (for both CpG transitions and CpG transversions), transcription direction, gene expression level (for sites within gene bodies) and quantitative estimates of replication direction (Fig. 1a,c). Methylation and expression levels from the testis were used because we are interested in estimating germline mutation rates23. Using transcription and replication directions leads to unequal rates for the same mutation type on the two DNA strands (Fig. 1c and Extended Data Fig. 1). Roulette accounts for local mutation rate variation by including the observed mutability of each trinucleotide context in 50 KB windows (Fig. 1d). Previous models use genomic properties as a predictor of large-scale mutation rate10. However, this approach has two shortcomings. First, epigenetic measurements could be noisy. Second, not all mutational processes are strongly correlated with existing tracks. SNV density is a more direct proxy for processes with KB to MB scale autocorrelation in the genome5. We show that this approach captures mutation rate variation associated with histone modification, recombination rate and replication timing13,14 (Extended Data Figs. 1–3). Because some DNA repair pathways act differently between intergenic regions, gene bodies and promoters15,24–26, we fit separate logistic regression models for each genomic compartment and each pentamer (a total of 91,176 models). We fit models with (115 parameters) and without (25 parameters) all pairwise interactions and selected the best-performing models using cross-validation on a 50/50 test/train split. Two simpler models were included to prevent overfitting in pentamer-compartment pairs with few mutations. We trained Roulette using noncoding SNVs with a frequency of below 0.001 from gnomAD v3 whole genomes7 (524 M rare SNVs after filtering low-quality sites; Supplementary Table 1; Methods), rescaled to account for recurrent mutation, and grouped the predicted rates into 100 bins to facilitate downstream analyses.
Fig. 1 |. Roulette accounts for extended nucleotide context, strand asymmetries and local variation in mutation rate.
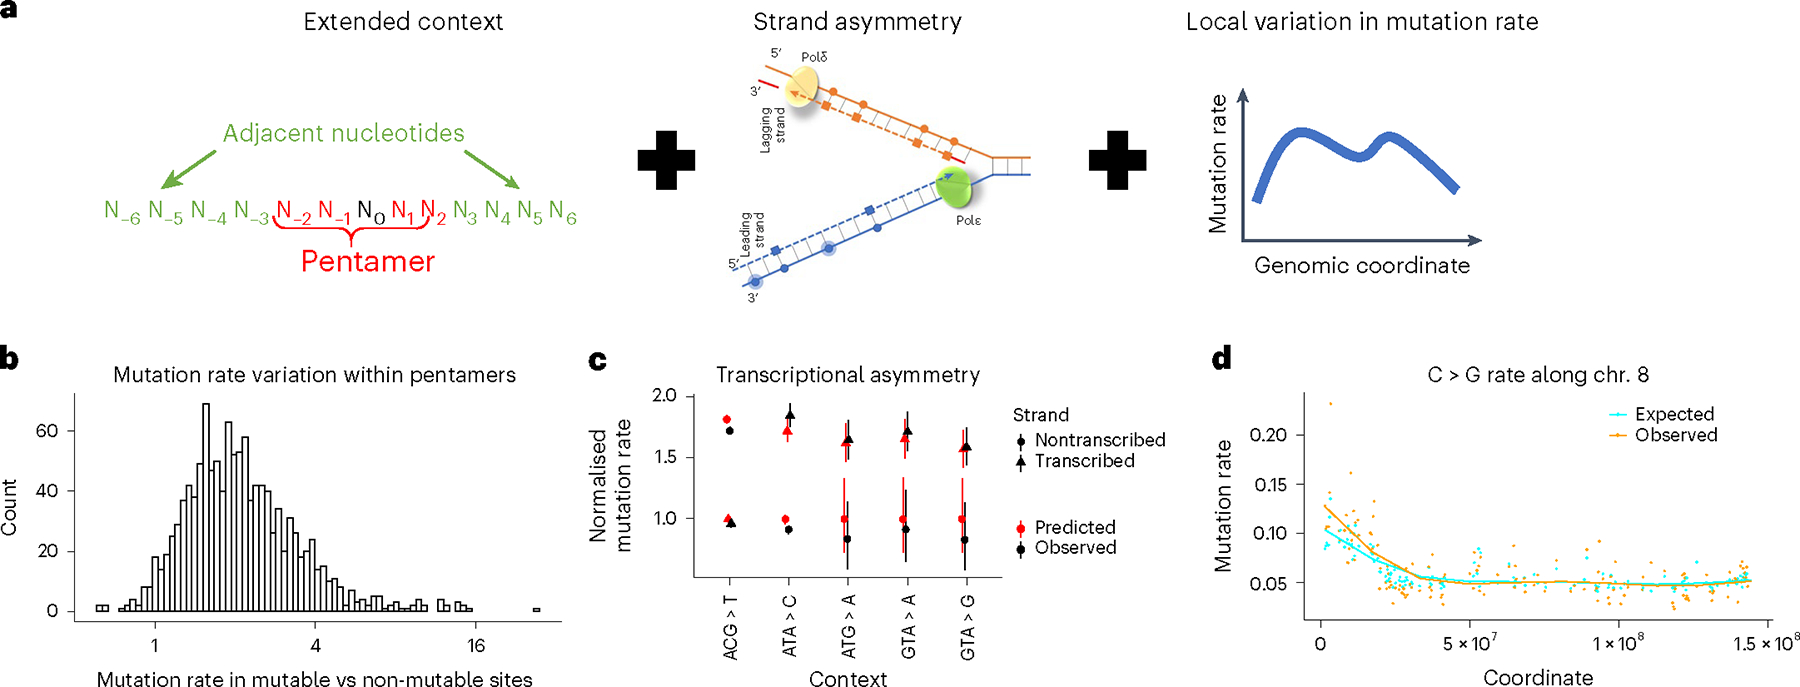
a, Roulette is implemented as logistic regression with pairwise interactions (Methods). For each pentamer, we model the effect of eight surrounding nucleotides (left), strand-specific information (middle) and context-specific variation along the genome (right). b, Ratio of observed de novo mutation rates between the Roulette predicted most and least mutable deciles for each pentamer shows a large variation unexplained by the pentamer context alone. c, Effect of transcriptional asymmetry on the rate of rare synonymous SNVs in the genes with high expression in testis (top quartile). Mutation rate is relative to the least mutable strand. Error bars correspond to 95% Poisson CI. d, Spike of the density of rare synonymous SNVs on the left arm of chromosome 8. This region is known to be affected by increased maternal mutagenesis4,17,23,24.
Due to the sample size of contemporary human sequencing data, many rare SNVs represent recurrent mutations that have occurred multiple times in the genealogical history of the sequenced cohort. Because Roulette only fits the density of monomorphic sites, we transformed SNV probabilities to the mutation rate scale by assuming that the probability a site remains monomorphic is given by the zero class of the Poisson distribution for the expected number of variants per site. The expected number of variants is proportional to the mutation rate and the overall coalescent depth. We assume that the coalescent depth is approximately constant for a very large sample from a growing population27 (Methods).
We found that Roulette captures several complex patterns of mutation rate variation using synonymous sites not included in training. For instance, nearly twofold differences between transcribed and nontranscribed strands are predicted accurately (Fig. 1c). The regional correction’s importance is also illustrated by DNA segments that are hypermutable in oocytes5,13,14. For example, this hypermutability increases C > G mutations on the left arm of chromosome 8 (Fig. 1d and Extended Data Fig. 3).
Roulette also resolves the riddle of ‘cryptic variation’. Early comparative genomics literature28–30 observed a higher frequency of triallelic SNVs than expected given biallelic SNV probabilities. Roulette accurately predicts triallelic probabilities (Extended Data Fig. 4), suggesting ‘cryptic variation’ reflected residual variance associated with extended nucleotide context and local genomic factors.
Comparisons between Roulette and previous models
We compared Roulette with two existing mutation rate models to further validate its performance.
Karczewski et al.7 used trinucleotide context and methylation levels to estimate rates for gnomAD v2, and Carlson et al.10 used heptamer context and several epigenetic features, including methylation levels, for the BRIDGES study (Supplementary Table 2). We refit the model of Karczewski et al.7 on gnomAD v3 and downloaded estimates for Carlson et al.10 We, hereafter, refer to these models as gnomAD and Carlson.
Previous studies have evaluated the goodness of fit for mutation rate models10 rather than attempting to estimate the residual variance. We developed two metrics to analyze each model’s ability to predict the rate and location of SNVs. First, an adjusted version of Nagelkerke’s pseudo-R2 for logistic models31 measures the residual variance, assuming errors result solely from misclassification among mutation rate bins, with no variance within bins. The second approach estimates the variance within bins using observations of multiple mutations occurring at the same site. We compare the rates of de novo mutations between sites where an SNV was observed and sites without SNVs. If mutation rates for each bin are estimated perfectly, the de novo mutation rate in both groups should be equal. This SNV-conditional method uses these de novo rate differences to estimate the within-bin variance.
We compared models using synonymous variants from gnomAD v2 (~125 K whole-exome sequences and ~1.9 M synonymous SNVs). Because Roulette was trained on noncoding variants, synonymous variants are an independent dataset. Roulette predicts the rate of synonymous SNVs with higher accuracy than the Carlson and gnomAD models (pseudo-R2: 0.86, 0.81 and 0.78, respectively; Fig. 2a). We found similar results for synonymous sites in UK Biobank whole-genome data (200 K individuals; 0.88, 0.83 and 0.80) and elevated values for noncoding sites (0.99, 0.94 and 0.83; Fig. 2a and Extended Data Fig. 5). Roulette also performed best in three trio-sequencing studies (41,816 trios and 2,759 de novo synonymous mutations; 0.93, 0.87 and 0.85). While validation sets differed in the magnitude of pseudo-R2, Roulette showed a similar improvement relative to the other mutation rate models (Fig. 2b).
Fig. 2 |. Roulette outperforms existing mutational models, under both per-gene and per-site metrics.
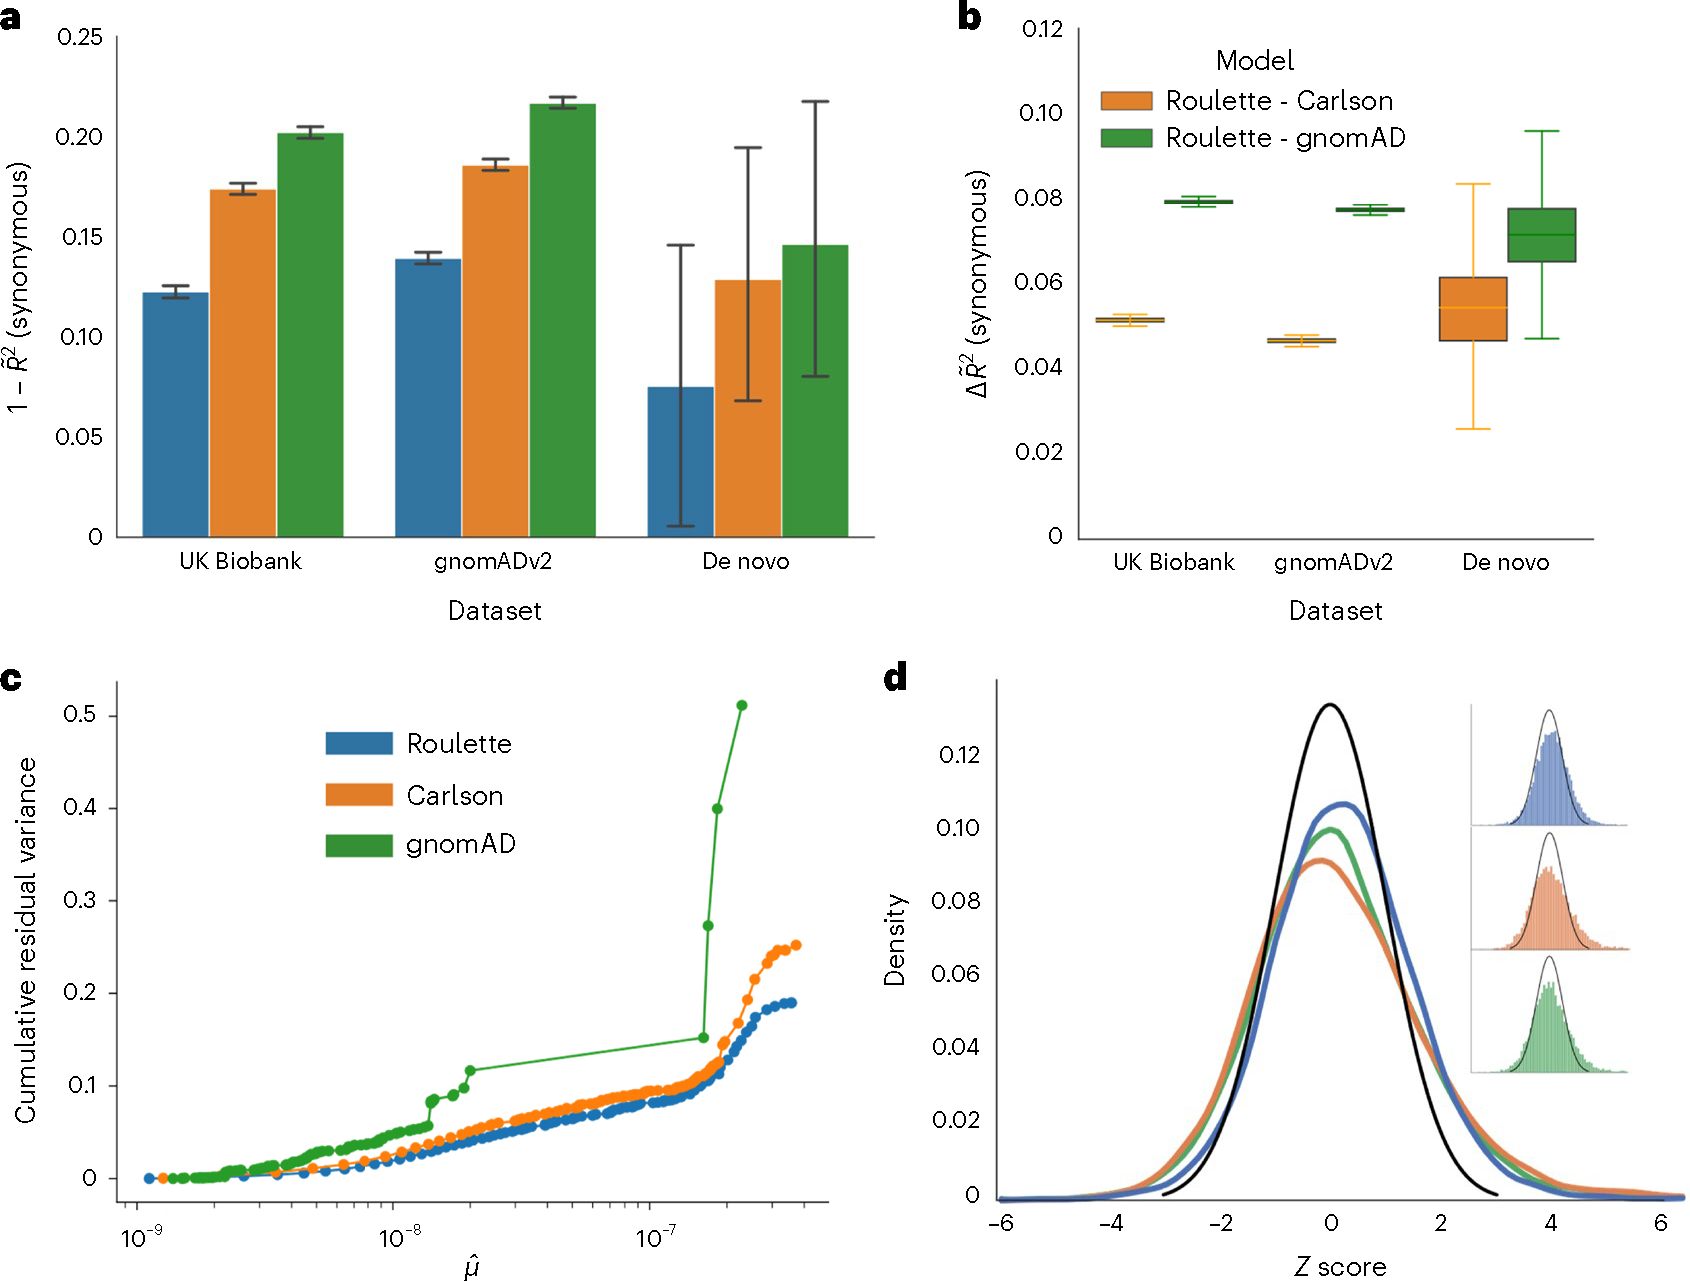
a, The 1 – pseudo-R2 values of the three mutational models on synonymous variants observed in population sequencing data (gnomAD v2.1.1 and UK Biobank) and de novo mutation datasets18,27,28. A pseudo-R2 of 0 is equivalent to using genome-wide mean mutation rate for every site. A pseudo-R2 of 1 is the best per-site mutation rate estimate we can achieve, under the constraint that the mutation rates of synonymous sites follow the predicted genome-wide distribution. Error bars represent 95% CIs estimated by bootstrap samples of synonymous sites. b, Difference in pseudo-R2 between Roulette and the two other models. The difference was calculated over each bootstrapped sample and whiskers represent estimated 95% CIs. Median is shown by a middle line, and box corresponds to 25–75% interval. c, The estimated cumulative residual variance for the Carlson, gnomAD and Roulette models after binning mutation rate estimates. Within-bin variance is scaled by the total variance estimated for Roulette. The x axis gives the estimated mean in each mutation rate bin scaled to the observed per-generation de novo rate observed in trio data. d, Error distributions on the z scale for predicted counts of synonymous mutations within genes in gnomAD v2. The standard normal density is shown in black to provide a reference for the expected error distribution if mutation rates were known without error.
As expected in the presence of residual mutation rate variation, sites harboring SNVs in gnomAD had an excess of de novo mutations even within the same bin predicted mutation rates. The mean excess was 34% within Roulette bins, 47% for Carlson and 94% for gnomAD (Extended Data Fig. 6). The corresponding estimated residual variances were 19%, 25% and 51% (Fig. 2c). While the SNV-conditional method estimates greater residual variances, Roulette still explains around 5% more variance than the Carlson model.
Many population genetic applications use aggregated mutation rate estimates by gene or genomic window. We evaluated the relevance of Roulette for these applications by aggregating synonymous sites (gnomAD v2) by gene and predicting SNV counts. Aggregate estimates generated using Roulette are more accurate than those for gnomAD or Carlson (Fig. 2d). There are 1,758 genes with a z score greater than 2 or less than −2 for Roulette, substantially fewer outliers than Carlson (2,468) or gnomAD (2,295). Selective constraint estimates for protein-truncating variants are widely applied in human disease genetics. All methods to infer strong selection require a local mutation rate. We recomputed two measures of strong heterozygous selection, shet and LOEUF7,32. New shet estimates slightly improved the detection of autosomal dominant disease genes annotated in DDG2P (P < 0.001), while LOEUF estimates showed no significant change (Supplementary Table 3).
Application of Roulette to demographic inference
We next investigated the utility of precise mutation rate estimates for inferring past population size changes from the site frequency spectrum (SFS; allele count at each frequency)33,34. Most studies use a model assuming one mutation per segregating site35 where the relative distribution of allele frequencies is independent of the mutation rate. Recurrent mutations break this key assumption and induce a dependency between the mutation rate and the shape of the SFS27,36,37 (Fig. 3a and Extended Data Fig. 7). Using a separate SFS for each mutation rate bin should increase power and reduce biases from recurrent mutations.
Fig. 3 |. Accurate per-site mutation rate estimates improve population genetic inference.
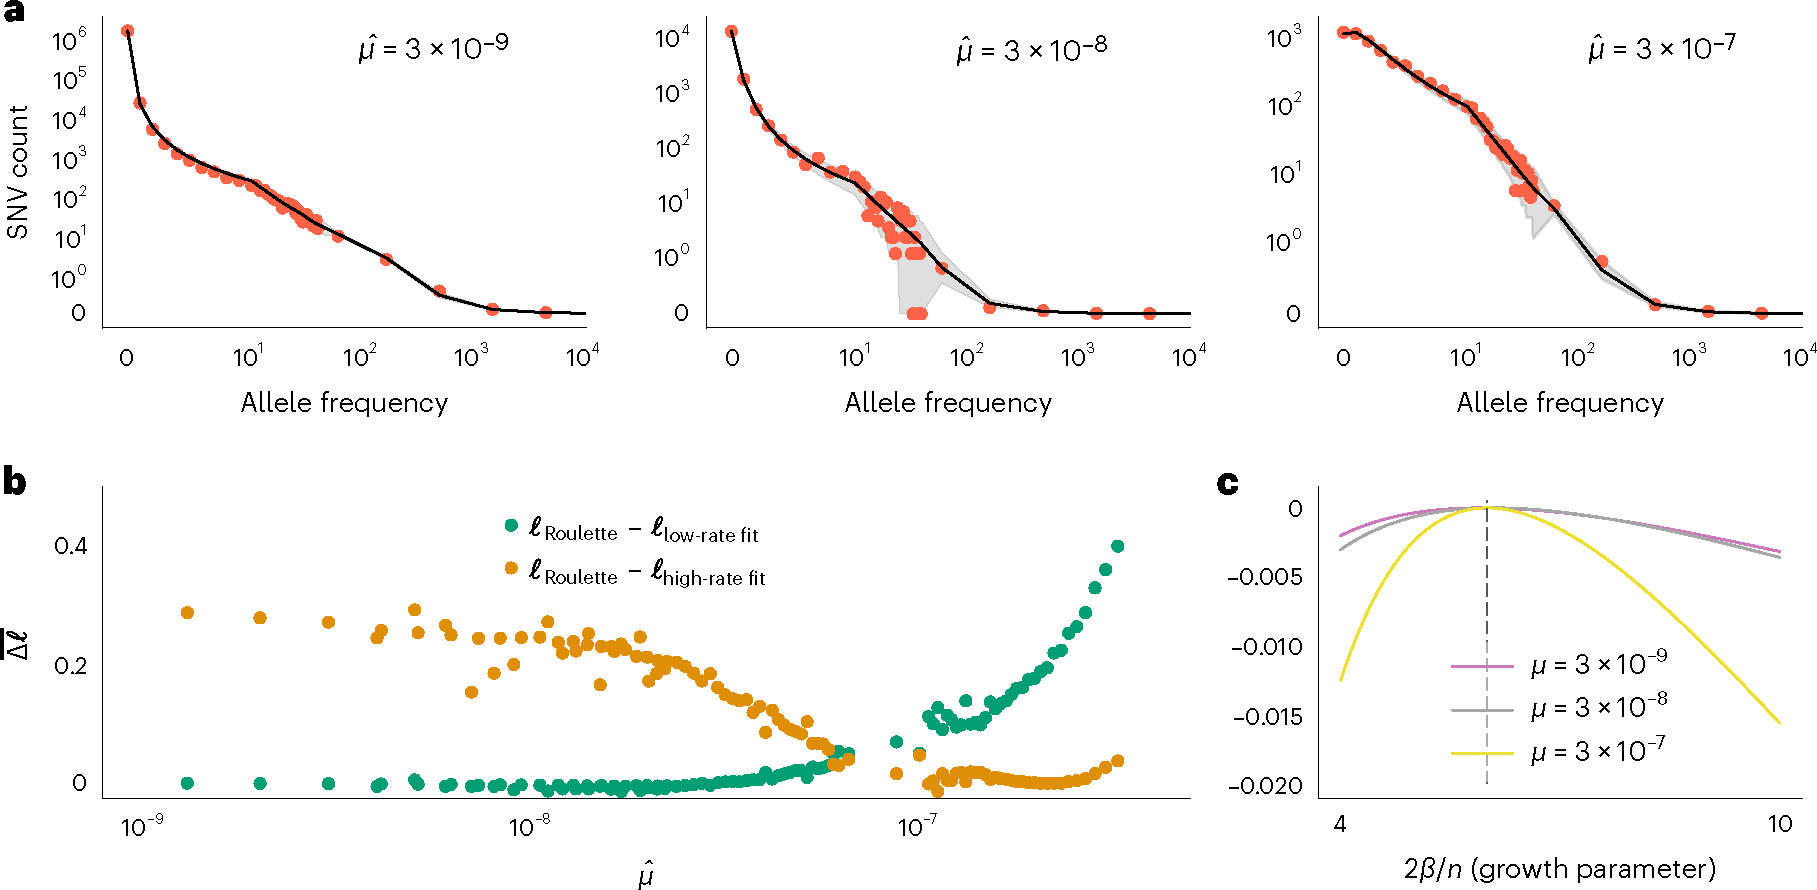
a, Estimated demographic history fits the SFS with mutation rate bins at different orders of magnitude. Red dots show the observed SFS at synonymous sites in gnomAD and black lines show the expected SFS under the inferred demographic model. Shaded areas correspond to 95% binomial CIs. The observed SFS (red dots) shows the observed numbers of SNVs at allele counts 0–40. For more common alleles with counts above 40, red dots show a number of SNVs for logarithmically (base 3) spaced bins. Allele counts are out of a total sample size of about 57K non-Finnish European individuals. b, Roulette bins improve fits to the shape of the SFS compared to demographic model predictions scaled to either low- (1 × 10⁻⁹ to 3.3 × 10⁻⁹) or high-rate (1 × 10⁻⁷ to 3 × 10⁻⁷) bins. Average log-likelihoods (per-SNV) are higher for Roulette after subtracting one to account for the additional parameter used to refit the mutation rate within each bin. Roulette improves over the model trained on sites with low mutation rate (mostly nonrecurrent sites) because recurrent mutations change the shape of the SFS. It also improves over the high-rate model as one moves away from the mean mutation rate within the high-rate bin. c, High mutation rate SNVs are more informative about population growth parameters. The expected per-SNV log-likelihood relative to the maximum is shown using rare SNVs (1–40 allele counts). The compound population growth rate/sample size parameter was chosen to approximate the observed synonymous SFS in gnomAD v2.
To evaluate the ability of Roulette to model the SFS across mutation rate bins, we fit a model of European demographic history33 using simulations with recurrent mutations20. The demographic model includes faster-than-exponential growth in the recent past. Our estimates indicate a faster rate of recent growth of approximately 14% and a larger contemporary effective population size (8.1 million instead of 2.5 million previously33). This model fits the shape of the SFS well even as recurrent mutation substantially skews the SFS toward less rare variants (Fig. 3a). Roulette estimates provide a better fit to the SFS shape than achieved by simply dividing mutations into low- and high-rate bins (Fig. 3b). Per-variant, high mutation rate sites are more informative about population growth than low-rate sites (Fig. 3c). This utility extends to selection inference where individual strongly constrained sites can be identified for mutation rates around 1 × 10⁻⁷ per generation38.
Genes transcribed by Pol III are mutational hotspots
While Roulette captures much of mutation rate variation (Figs. 1 and 2), including epigenetically active sites like enhancers and promoters (Extended Data Fig. 8), strong local deviations can identify new mutagenic mechanisms. Regional variation in mutation rates and spectra has been characterized and interpreted at scales exceeding 10 KB4,5. However, many mutagenic mechanisms arise due to factors acting at much smaller scales25,26. To balance resolution and statistical power, we analyzed extreme deviations from Roulette predictions at the 100 bp scale genome-wide (Fig. 4a).
Fig. 4 |. Pol III transcripts are mutational hotspots.
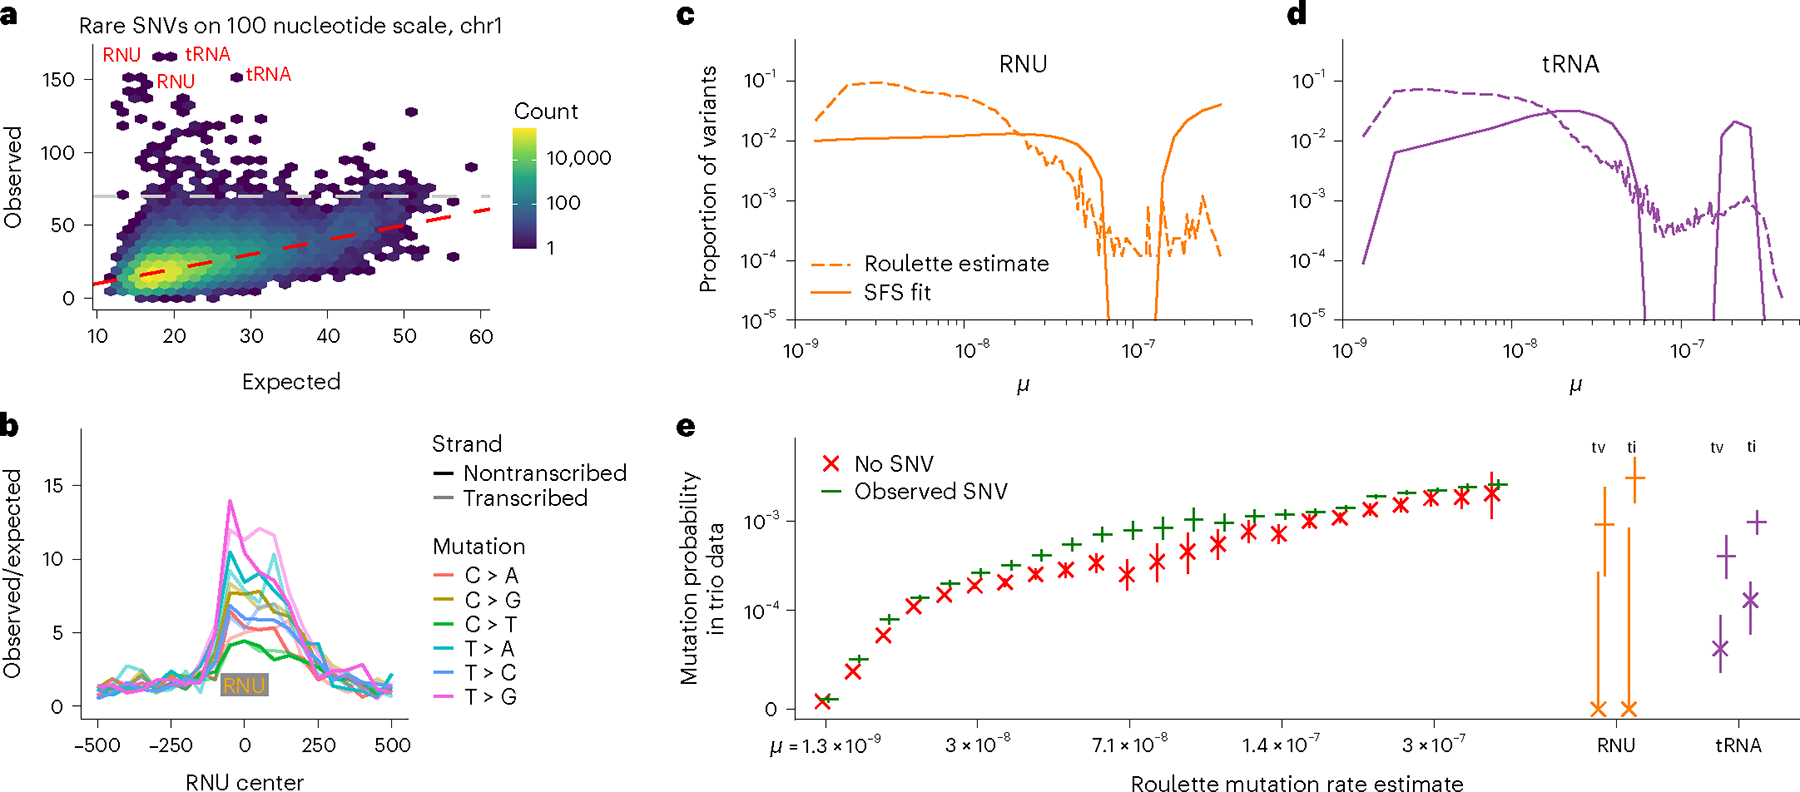
a, Number of rare SNVs in 100 nucleotide nonoverlapping windows. Expectation is calculated with Roulette. While mutation counts in most regions show minor deviations from the prediction, a few loci have much higher mutation rates (>70 SNVs, above the gray line). These loci are heavily enriched with Pol III transcripts. b, Mutation rate at and around small nuclear RNAs (RNU); the median RNU size is depicted as a gray rectangle. c,d, The proportion of variants with different mutation rates estimated by Roulette for observed SNVs in (c) RNU and (d) tRNA genes. These are compared to estimates of the distribution of SNV mutation rates obtained by fitting SFS in these genes obtained using a mixture model. The SFS in each of 21 mutation rate bins was estimated from all variants on chromosome 21 (gnomAD v3) and the mixtures of these bins that best fit the observed SFS in each gene class were fit using likelihood and a smoothing penalty. e, SFS-based mutation rate predictions suggest that RNU and tRNA genes contain a subset of high mutation rate sites not predicted by Roulette. Mutations in these genes were separated by ti/tv and whether that SNV was observed in gnomAD v3, and the probability of observing that mutation in the de novo mutation data is shown on the y axis. These probabilities are compared to similar estimates made genome-wide for a subset of mutation rate bins.
A quarter (25.6%) of 100 bp genomic windows with high SNV counts unexplained by Roulette lie within noncoding RNA genes transcribed by Pol III. These outliers each harbor over 70 SNVs per 100 bp, with some having more than 100 SNVs, because multiallelic sites are included. The two largest gene classes transcribed by Pol III are tRNA and small nuclear RNA (RNU) genes (Fig. 4a,b and Extended Data Figs. 9,10). Quality metrics suggested that these are true SNVs (Supplementary Fig. 1), and de novo mutation counts increase with paternal age as expected for germline mutations (Supplementary Fig. 2). A comparative genomics study recently noted elevated mutation rates in tRNA genes39, although the magnitude was likely underestimated by not accounting for recurrent mutations. Similarly, while we observe a sevenfold increased SNV rate in RNU genes (Fig. 4a,b), de novo mutations in parent–child trio-sequencing studies were detected at a 32-fold (19–50, 95% Poisson confidence interval (CI)) higher rate.
Comparing mutation rates between active RNU genes and pseudogenes, the increased mutation rate was almost exclusively limited to active genes, implicating transcription rather than genomic location or sequence context (Supplementary Fig. 3a–c). The few RNU pseudogenes with elevated mutation rates also have H3K27ac chromatin marks associated with active transcription (Supplementary Fig. 3a,b), suggesting that these RNU pseudogenes are actually misannotated active genes. Pol III transcription is associated with high SNV density in other classes of noncoding RNAs (Supplementary Fig. 3d) but not in SINE repeats (Supplementary Fig. 3f), which may also be transcribed by Pol III40.
We sought to further characterize elevated mutation rates in tRNA and RNU genes. To this end, we developed a statistical model to estimate the distribution of mutation rates among observed SNVs (Supplementary Note) by taking advantage of the fact that recurrent mutations cause the shape of the SFS to depend on mutation rate5,27,36,37. We calculated the (binned) SFS for gnomAD v3 in each of the previously defined mutation rate bins so that each had an associated probability distribution on SNV frequencies (SFS). The observed SFS in RNU and tRNA genes was then modeled as a mixture distribution on mutation rate bins, where the mixture probabilities correspond to the probability an SNV has a particular mutation rate. We estimated that mutation rate within Pol III transcripts is highly variable. Both RNU and tRNA genes have a large fraction of highly mutable sites, with mutability greatly exceeding the Roulette predictions (Fig. 4c,d and Supplementary Fig. 4). We also estimated de novo mutation rates by categorizing sites by monomorphic/polymorphic status and by transition/transversion (ti/tv) status, and we applied the same conditional SNV approach as used to estimate residual variance of the mutation rate genome-wide. De novo mutation rates in RNU and tRNA genes were much higher in polymorphic than monomorphic positions (Fig. 4e), consistent with high mutation rate heterogeneity. Both approaches suggest that a subset of RNU transitions are among the most mutable positions in the human genome (Fig. 4c,e). The high mutation rate in Pol III transcripts masks the effect of purifying selection and leads to an unrealistic selection inference21.
Multiple nonexclusive explanations exist for the mutagenic effect of Pol III transcription. First, unlike RNA Pol II, Pol III does not recruit transcription-coupled repair (TCR). However, TCR removes mutations on only one DNA strand and cannot remove more than half the mutation rate. Its absence is insufficient to explain the observed 32-fold effect. Second, transcription-associated mutagenesis41 involves ribonucleotide incorporation into DNA during transcription. Third, the biological machinery of Pol III transcription differs substantially from that of Pol II transcription42 and could involve uncharacterized transcription-associated mutational mechanisms. Finally, transcription initiation by the TF IIIB triggers the restructuring of the DNA-bound Pol III42, which could be mutagenic and create mutational hotspot upstream of RNU genes.
TFBS active in testis have elevated mutation rates
TF binding occurs at short scales and is mutagenic in yeast and human cancers due to either blocked ribonucleotide primer resection, interference with the access of nucleotide excision repair, or altered DNA conformation24–26,43. We attributed transcription factor binding sites (TFBS) activity to specific tissues by overlapping ChIP–seq signals with DNase I hypersensitivity regions. Roulette predicts mutation rates accurately in most TFBS, confirming that most observed elevations are due to sequence context and regional features44 (Fig. 5a). However, TFBS active in testis shows increase over Roulette predictions for most mutation types (Supplementary Fig. 5a,b), with the strongest effect for T > G mutations (1.59-fold median increase; Fig. 5a). This observation suggests a direct mutagenic effect of TF binding. These elevated rates are almost exclusively restricted to promoters (Fig. 5b), and TFBS overlapping multiple promoters show further increases (Supplementary Fig. 6). For convenience, we provide estimates corrected for elevated mutation rates at TFBS (Supplementary Fig. 7). Notably, UV-induced mutations at TFBS in melanoma24 also have different rates in and outside of promoters (Supplementary Fig. 8).
Fig. 5 |. TFBS are prone to high mutation rate.
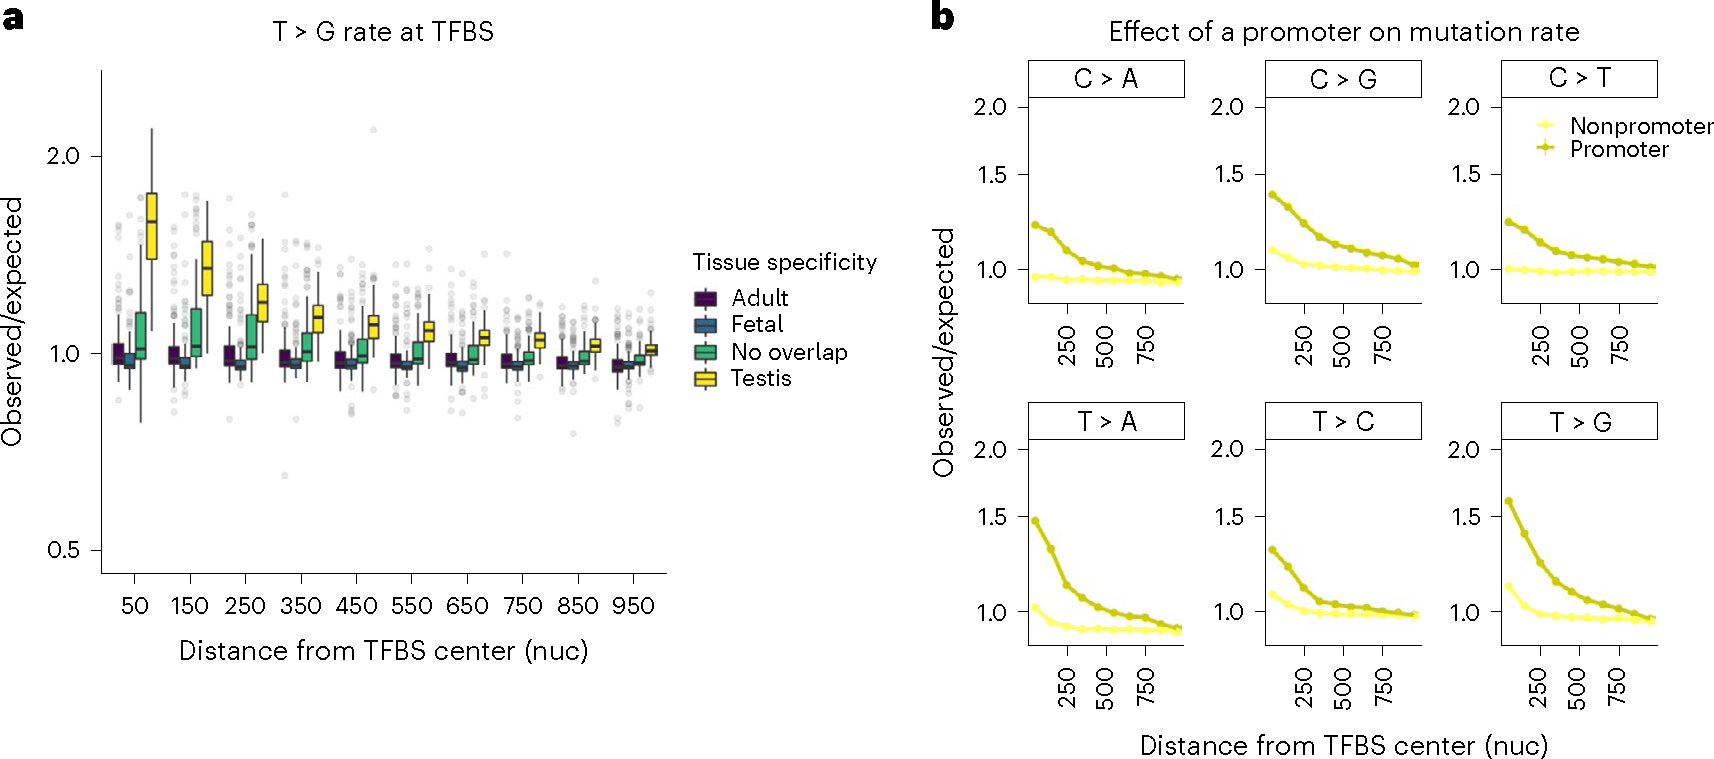
a, Box plot for the observed to expected rate of rare T > G mutations across different TFs. Positions occupied with TF were annotated with ChIP–seq data. Human tissues where TFBS are active were determined through overlap with tissue-specific DHS peaks. nuc. stands for nucleotides. Median is shown by a middle line, and box corresponds to 25–75% interval. b, Mutagenic effect of TFBS active in testis overlapping promoter (−2 KB upstream of transcription start site, dark yellow) or not (light yellow).
Discussion
Estimates obtained in this study can serve as a baseline to calibrate neutral expectations in analyses of polymorphism density and de novo mutations. While we have given examples of such applications for models of population history and strong selection against heterozygous LoF mutations, Roulette also provides the background for mapping disease genes using recurrent de novo mutations. This includes rare Mendelian diseases, congenital heart anomalies and neuropsychiatric diseases. Previous germline mutation models as well as parallel efforts for cancer somatic mutations in cancer genomics have been instrumental to inference of positive and negative selection on genes and regulatory elements. We expect Roulette to improve such efforts, and the increased mutability associated with Pol III transcription and TF binding in testis should, in particular, be taken into account in the context of disease gene mapping and selection inference.
Improvements to mutation rate models can also facilitate new research on mutagenic mechanisms, including studies of environmental and genetic modifiers of mutation rate. For instance, one genetic modifier has recently been characterized in a laboratory mouse strain45, implying that similar modifiers may exist in the human population, albeit at low frequencies. Haplotypes harboring mutator alleles would have a higher-than-expected number of mutations and different spectra, but precise mutation rate estimates would be necessary for the development of statistics capable of identifying them.
To apply Roulette, it is necessary to recalibrate the estimates to match the given population or de novo sequencing dataset. Variable sample sizes and variant-detection rates impact the base rate in de novo mutations and density of rare SNVs. Additionally, SNV probabilities among mutable sites will begin to saturate due to recurrent mutations in large population sequencing datasets. To account for these effects, one should define a background set of sites, bin them with Roulette rates and calculate de novo or SNV probabilities for each bin.
The residual variance unexplained by Roulette suggests that there is still room for substantial improvement in the human germline mutation rate model. In this study, we identified sets of non-CpG sites whose average rates are between those of methylated CpG transitions and most other mutations. While small in number, this class of sites is estimated to have a large residual variance, suggesting a high level of heterogeneity and potential hypermutability (Extended Data Fig. 6). We have also only accounted for mutation rate variability due to sequence context, a few epigenetic covariates, DNA strand and scales above 50 KB. Mutational mechanisms may act at scales shorter than 50 KB or not be predicted well by sequence context. Incorporating larger datasets to increase the density of rare SNVs and adding more epigenetic measurements might improve predictions. Finally, there is room for improvement in the statistical methodology. Machine learning methods able to capture higher-order interactions and nonlinear scaling among covariates could be one fruitful direction.
With ever-increasing population sequencing datasets, the probability of observing SNVs at high mutation rate sites will rapidly saturate38. The recurrence correction developed in this study is inadequate to estimate mutation rate differences within this regime. The development of additional methodology to model recurrent mutations will be necessary. This could involve either using the effect of recurrent mutations on allele frequencies27 or using haplotype data to infer the count of independent mutational events at each site.
Growing genomic datasets can facilitate new findings related to selection, disease and beyond, but subtle biases like those associated with mutation rate variation can easily dominate analyses. Roulette, along with improved analytical methods, can assist in limiting false discoveries. Strand specificity and regional variation are simple features capturing important aspects of mutagenesis and should be used in other contexts such as models of somatic mutations or germline mutations in other species. Future study will also require the development of more advanced statistical models of mutation rate informed by our increased understanding of mutagenesis biology.
Online content
Any methods, additional references, Nature Portfolio reporting summaries, source data, extended data, supplementary information, acknowledgements, peer review information; details of author contributions and competing interests; and statements of data and code availability are available at https://doi.org/10.1038/s41588-023-01562-0.
Methods
Genome sequencing data
Roulette was fitted using rare (<0.1% frequency), noncoding, SNVs called in whole-genome sequencing data from gnomAD v3 (71,702 unrelated individuals)7. For model validation, we used whole-exome sequencing data from 125,748 unrelated individuals in gnomAD v2.1.1 (GRCh38 liftover version downloaded from https://gnomad.broadinstitute.org/downloads), UK Biobank whole-genome sequencing of 200,000 individuals (https://www.ukbiobank.ac.uk/learn-more-about-uk-biobank/news/whole-genome-sequencing-data-on-200-000-uk-biobank-participants-available-now) and de novo mutations identified in sequencing of 41,816 parent-offspring trios compiled from three studies13,18,46. De novo mutations were lifted over from GRCh37 to GRCh38. gnomAD v2.1.1 was also used for all population genetic analyses. Canonical transcripts from Ensembl v.104 were used to annotate transcription start sites and intron boundaries, and categorize all potential single-nucleotide mutations as either synonymous, missense, stop gained, splice donor or splice acceptor variants. Observed variants were filtered to those annotated as PASS quality in their respective datasets and additional quality filters were applied (Supplementary Methods and Supplementary Fig. 10). For variants monomorphic in gnomAD, the number of successfully genotyped chromosomes (allele number) was not reported, and we interpolate allele numbers at monomorphic sites by using the average allele number among observed variants in the gene.
Mutational model
The Roulette mutational model was fitted using a set of known correlates of mutation rate in the human genome. For each noncoding autosomal position in the genome, we assessed the pentanucleotide context plus four additional adjacent nucleotides to the left and to the right of pentamer, the direction of replication and the methylation level at CpG sites in testis. To account for local mutation rate variation, we also included the rate of rare SNVs in the 50 KB window of the site, conditional on mutation type and trinucleotide context. This accounts for context-specific variation along the genome from sources not directly modeled. For sites within a gene body and in promoters, we fit separate models for reverse complementary mutations and different expression levels in testis.
We used the average effect of the surrounding nucleotides on mutation rate as an input variable to have a quantitative instead of a categorical variable. For example, to predict a mutation in the underscored position with the context A-6A-5C-4T-3 TG C > T GA T3C4C5A6, we included the observed genome-wide value of μ(TG C > T GA | A-6)/μ(TG C > T GA) as a covariate. This ratio was separately calculated for each pentamer × compartment model; estimates for the modulating effects of surrounding nucleotides are provided here (http://genetics.bwh.harvard.edu/downloads/Vova/Roulette/covariates/). All positions from −3 to −6 and 3 to 6 were treated similarly. Transcribed regions, intergenic regions and promoters were considered separate genomic compartments because the effect of surrounding nucleotides was found to differ among them (Supplementary Fig. 9).
The per-site direction of replication was obtained from ref. 47 and averaged on a 10-KB scale. We aggregated fork direction into five equally sized bins and assumed an absence of replication for bias where the direction was not available. CpG methylation level in testis measured with bisulfite sequencing was obtained from ENCODE (https://www.encodeproject.org/search/?type=Experiment&control_type!=*&status=released&perturbed=false&assay_title=WGBS&replicates.library.biosample.donor.organism.scientific_name=Homo+sapiens&biosample_ontology.term_name=testis). We stratified CpG sites into five bins by the fraction of methylated reads, with an incremental change of 0.2. We fit the model separately in each bin to allow context effects to vary by methylation level. Mean gene expression levels in testis were obtained from GTEx 8 (ref. 48) and used to group genes into five bins.
As an additional variable to account for local variation in mutation rate, the average mutation rate in each trinucleotide context and each mutation type was calculated for sliding 50 KB windows with 10 KB steps. First, we calculated the genome-wide fraction of rare segregating mutations within trinucleotides. Then, we normalized the fraction of segregating rare SNVs in each region by the genome-wide average. When an insufficient number of a specific trinucleotide was present in a region (< 10), the genome average mutation rate for this trinucleotide was assumed (covariate set to 1). The focal site was excluded from assessments of local mutation rate.
All variables were then used to predict the probability that each specific mutation was observed segregating as a rare SNV. Common variation was excluded because it is more sensitive to direct selection, background selection and biased gene conversion. Grouping by pentamer–mutation pairs and three genomic compartments (intergenic regions, intronic regions and promoters) splits sites into 3,072 categories. We further split CpG sites into five bins by methylation and also separated promoter regions and gene bodies into five bins by expression level in testis. We then fit three separate models on a randomly selected 50% of sites within each of the resulting groups of sites. These were a logistic regression model with pairwise interactions, a logistic model with no interactions and a model where the effects of sequence context and local mutability were estimated independently and then multiplied. We compared likelihoods for all three models using the remaining 50% of sites unused in training and selected the model with the highest likelihood.
Logistic regression with pairwise interactions was applied in R using the command
Logistic regression without interactions was applied with the command
is the probability of not observing a segregating SNV site, is the effect of the surrounding nucleotide in position relative to the focal site, Rep_dir is the direction of replication and local_mutation_rate is the normalized rate of the same mutation in the overall trinucleotide context in the 50 KB window harboring a site. The model fit by glm’s binomial family option is
where is a matrix of all observed covariates, including interactions, and is the estimated effect of each on SNV occurrence. A simpler log-link model was included for pentamer-compartment categories with few observed SNVs (Supplementary Methods and Supplementary Fig. 11).
Due to recurrent mutations at high mutation rate sites in a large sample like gnomAD, there is not a linear relationship between the SNV probabilities fit using logistic regression and the underlying mutation rates. We developed a simple Poisson transformation to recover estimates on the mutation rate scale. This approach applies the classic infinite sites model to individual sites in the genome27.
For a sample as large as gnomAD v3 (71,702 individuals), we can expect the distribution of the number of independent recurrent mutations to be Poisson distributed: , where is the mutation rate and is the total size of the genealogy, which does not vary much between sites. Under the assumption that is Poisson, we have , where is the probability of a site experiencing no mutation in the history of the sample. This is equivalent to a site being monomorphic as long as back mutations to the ancestral state are sufficiently rare. This condition is satisfied because the occurrence of nested rare mutations at realistic human mutation rates is negligible27. Therefore, , yielding a linear relationship between and . This provides a scaling between the monomorphic probabilities estimated by logistic regression models and the underlying mutation rates.
To apply other mutational models to the gnomAD dataset, which is prone to recurrent mutations, we transformed them to the scale. To do so, we estimated as a scaling parameter by first binning continuous mutation rate estimates and then solving the following equation:
where indexes the mutation rate bin, is the number of sites in mutation rate bin is the mean mutation rate predicted by the model within bin is the overall number of sites and is the overall number of polymorphic sites. After finding , we calculate the expected number of polymorphic sites by calculating .
Validation
We want to measure how well-estimated mutation rates fit either rare SNVs from validation sets or de novo mutation data. Ideally, this measure should allow us to make a fair comparison between different mutation rate models, should be insensitive to sample size and should give some sense of distance from a theoretical optimum. We followed Nagelkerke who defined for general regression models. One possible definition is , where is the log-likelihood of the model and is the likelihood under some null. For discrete outcomes, the maximum value of this is , and normalization by the maximum can give a better metric for the proportion of explained variation31 . However, the mutation process is inherently stochastic. above assumes that all observations could be predicted perfectly, whereas perfect knowledge of mutation rates would never allow this. The true mutation rate model would assign a probability to each potential mutation. If the log-likelihood of the data under this model is , then we can define the maximum as
where the sum is across sites and indicates whether a mutation is observed or not. It is possible that exceeds the theoretically optimal by chance when the sample size is small, so empirical values of greater than one are possible.
Without knowing the true , we can use knowledge about the overall distribution of mutation rates. If we know ,
for large . The appropriate null model is , the genome-wide average mutation rate. The maximum would then be approximately
Using this approach, we cannot say how far we are from the optimal mutation rate model without making some assumption about the overall distribution of mutation rates. As , we use the empirical distribution of rates estimated by the Roulette model.
We calculate pseudo- as where
and is as defined above.
We also apply pseudo- to polymorphism data by replacing with , which represents whether a site is polymorphic or not. We replace with , where is the probability of a site being polymorphic.
We calculate bootstrap CIs for pseudo- by sampling with replacement from all sites in the validation set.
In addition to pseudo-, we developed an alternative method to estimate the proportion of mutation rate variation not explained by a given model. This method separates sites into monomorphic and polymorphic groups based on whether that SNV was observed in gnomAD v3. Within each mutation rate bin defined for a given model, we compared the rates of observed de novo mutations between the monomorphic and polymorphic groups. If mutation rates are estimated perfectly, there will be little to no difference in the proportion of sites with de novo mutations, whereas large differences would indicate substantial residual variance in true mutation rates.
To use stratification by SNV status to estimate residual mutation rate variances, we assume that the distribution of mutation rates within bin is . The distribution of rates conditional on a site being monomorphic site is
. The probability of observing no SNV is approximately , and the mutation rate in de novo data will be equal to the average rate for this group of sites
The equivalent expression for polymorphic sites is
The ratio for the excess of de novo mutations expected at polymorphic sites is
Similar to the pseudo- analysis, it is necessary to make some assumptions about the distribution of mutation rates, this time the residual distribution within each bin. We assumed each bin contained a log-normal distribution of mutation rates and estimated the mean within each bin using the total de novo mutation count. thus depends on two parameters, the log-scale s.d. of mutation rates and . These two parameters are identifiable within each bin given the observed de novo ratio and proportion of polymorphic position. In theory, should be the same for each bin as all share a common population history. Rather than fit a joint model, we estimate separately for each bin and confirm that it does not vary too widely (Supplementary Fig. 13).
We fit and for each bin using a grid search to identify the values where
is minimized, where is the observed probability a site is polymorphic in that bin and is the observed de novo ratio. Expected proportions of polymorphic sites and de novo ratios were calculated by sampling large numbers of mutation rates from each possible log-normal distribution in the grid. Estimates of fell within the range [0, 1.5] and were transformed to a linear scale using
The residual variance contributed by each bin was then computed as
To calculate scores, we assumed that the number of polymorphic sites in a gene follows a binomial distribution within each mutation rate bin. The expected number of polymorphic sites is . The variance is the sum over set of sites , where .
Demographic inference
To determine whether Roulette mutation rate estimates are sufficient to capture distortions to the site frequency spectrum due to recurrent mutation, we refit a demographic model of population size changes in the ancestry of European individuals33 to synonymous SFS in non-Finnish European samples from gnomAD v2.1.1. We then assessed how well model predictions matched the observed SFS in each mutation rate bin. We used a Wright–Fisher simulator20 to generate the site frequency for different mutation rates, allowing for recurrent mutations, and to compute likelihoods. Maximum likelihood values of a recent growth rate and growth rate acceleration parameter were computed using a grid search (Supplementary Methods).
To compare how well the SFS fits within different possible mutation rate bins, we recalibrated μ using the maximum likelihood demographic parameters. We did this for all Roulette bins used, as well as for ranges representing low and high rate defined as (1.3 × 10⁻⁹, 3 × 10⁻⁹) and (1 × 10⁻⁷, 2.8 × 10⁻⁷). Wright–Fisher simulations allow for recurrent mutation, so the SFS changes shape as the mutation rate increases. We measure the fit to the shape of the SFS by calculating the likelihood conditional on sites being polymorphic by removing the zero bin and normalizing the remaining expected SFS. We evaluate the information added by Roulette’s fine-scale mutation rate estimates by comparing the conditional likelihoods of the low- and high-rate fits to the μ fit specifically to that bin.
Outlier gene classes
Comparison of observed SNV counts and Roulette expectations in 100 nucleotide windows identified X regions with potentially high mutability. We took a closer look at the following three large classes: IGK, RNU and tRNA genes. IGK variants were found to have poor quality metrics and were excluded from other analyses (Supplementary Methods and Supplementary Fig. 12). RNU and tRNA are transcribed by Pol III, suggesting a shared mutagenic mechanism. We used population allele frequencies, de novo mutations and quality scores to assess whether elevated SNV counts were due to true hypermutability (Supplementary Methods).
The shape of the SFS for low-count alleles is strongly dependent on the mutation rate due to recurrent mutation37. Roulette estimates are sufficiently accurate that it is reasonable for us to assume a single mutation rate within each defined bin when predicting the shape of the SFS for alleles as those sites (Fig. 3)27. Given this, we can estimate the distribution of mutation rates in a group of sites by modeling its SFS as a mixture of the SFS shapes observed in each Roulette bin. To avoid issues with variant ascertainment, we only fit the distribution of frequencies conditional on an SNV being observed in the sample.
Let be the observed SFS at some sites of interest, for example, those in RNU genes, and let be the SFS observed in a mutation rate bin with mean can be modeled as a mixture of mutation rates: , where is the proportion of observed variants with mutation rate and the quantity which we want to infer. In application to gene classes, we only used every fifth Roulette bin (21 total) to reduce overfitting. We estimated using maximum likelihood and the basin-hopping algorithm with L-BFGS-G as the minimizer, as implemented in scipy. We also included a smoothing penalty on the multinomial transformation of the mutation rate distribution: . We applied this model to the observed SFS in RNU and tRNA genes with both no and relatively strong smoothing. To bin the SFS, we used counts 1–5 without binning and chose bin boundaries logarithmically with base 3 above that. Both the smoothed and unsmoothed analyses indicated a mix of intermediate and high mutation rate SNVs in RNU and tRNA genes (Supplementary Fig. 4 and Fig. 4c,d).
Using the same approach as for the residual variance, we separated sites based on their Roulette bin and whether they contained an SNV. We also separated transition and transversion mutations for tRNA and RNU genes and then estimated de novo mutation rates for each group of sites. Exact Poisson CIs were calculated using the R package ‘exactci’ (https://journal.r-project.org/archive/2010/RJ-2010-008/index.html).
Statistics and reproducibility
No statistical method was used to predetermine the sample size. No data were excluded from the analyses. The experiments were not randomized. The investigators were not blinded to allocation during experiments and outcome assessment.
Extended Data
Extended Data Fig. 1 |. Effect of replication fork direction on the rate of rare synonymous SNVs.
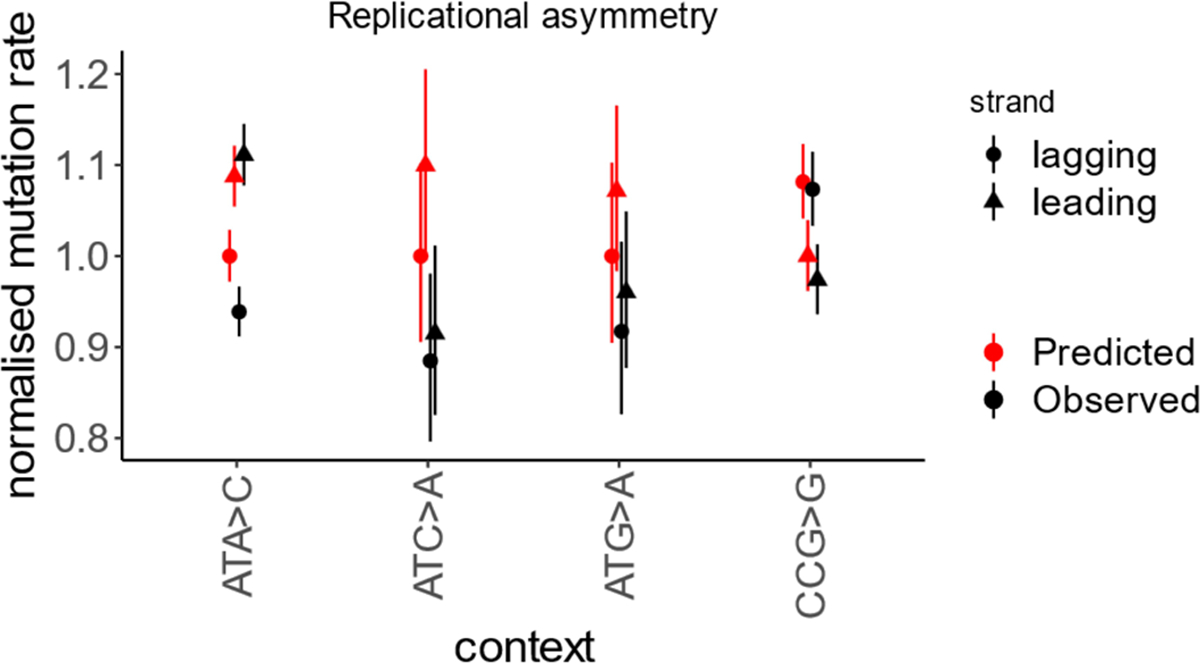
Four contexts with strongest replication asymmetry. Mutation rate calculated for the regions with the strongest replication fork polarity (top quartile). Mutation rate is relative to the least mutable strand. Error bars show 95% confidence intervals for the ratio of two Poisson variables.
Extended Data Fig. 2 |. Roulette captures mutation rate variation associated with epigenetic features.
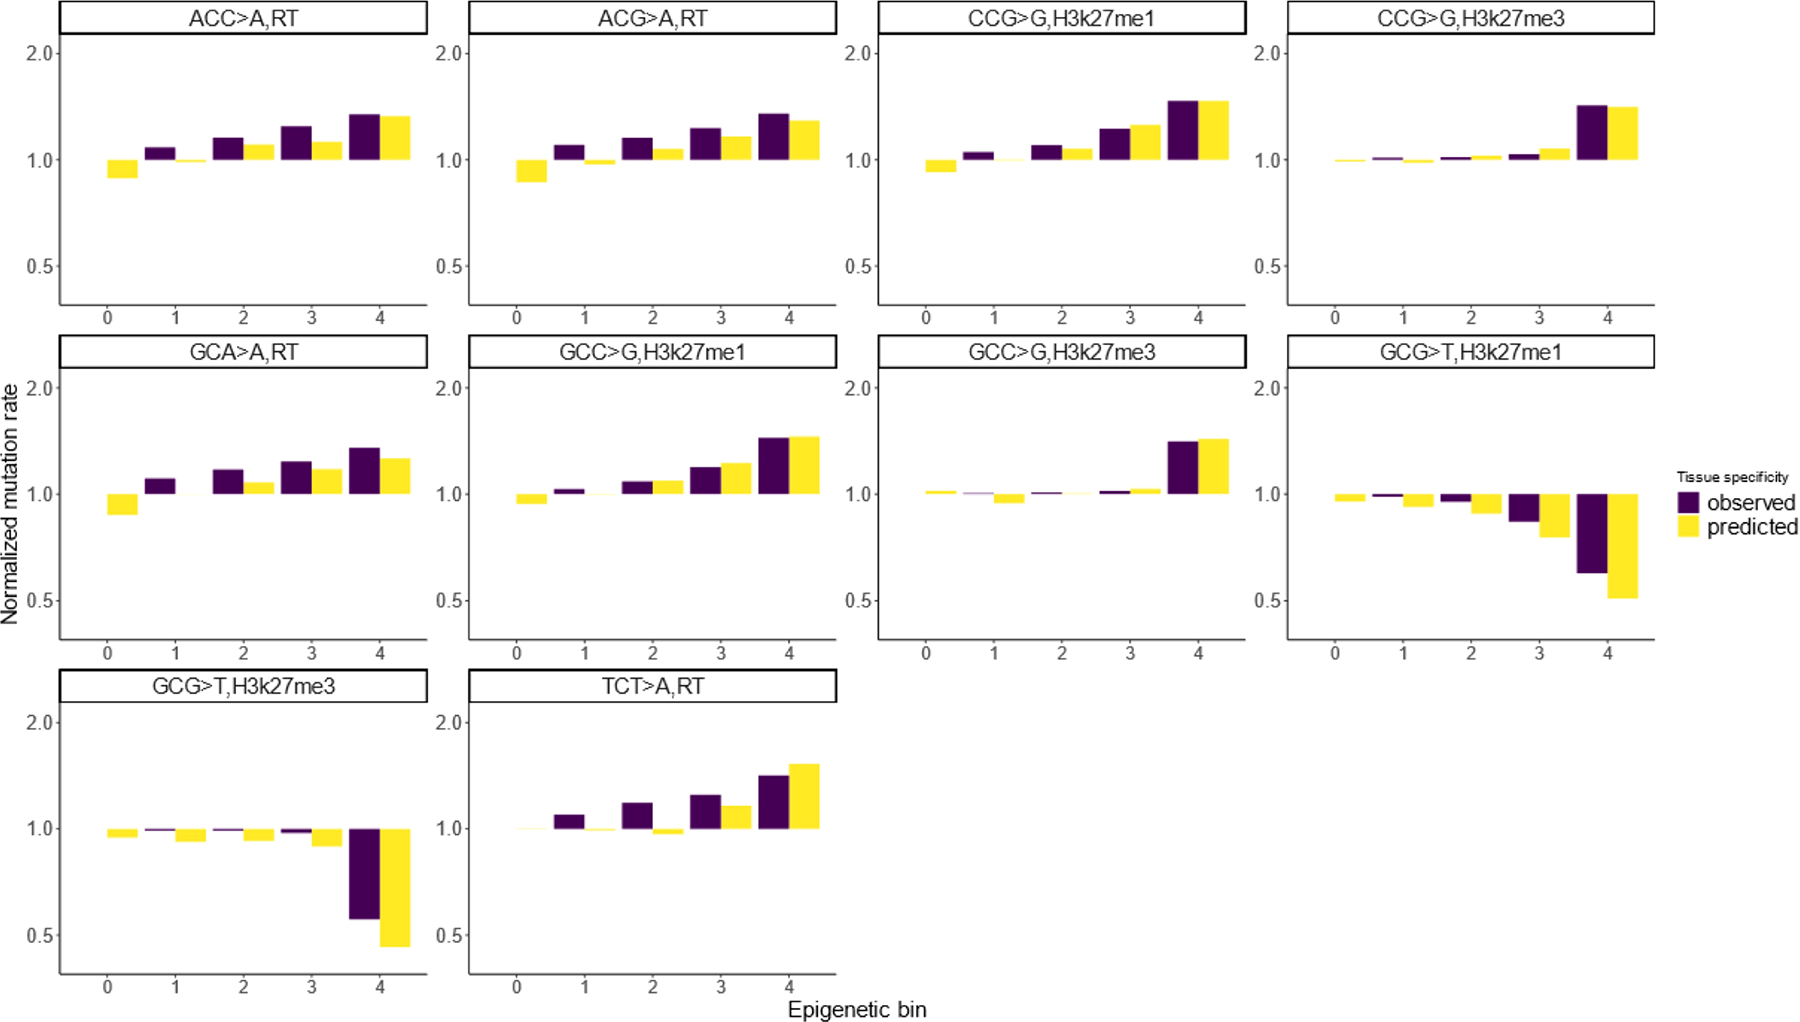
Ten pairs of mutation type and epigenetic features with the strongest effects on mutation rate. To generate bins, we subdivided the genome into five equal size bins by the value of genomic features and then calculated observed and expected mutation rates for each trinucleotide context among synonymous sites. This test was performed on synonymous SNVs and mutation rates were normalized to the rate observed in the first epigenetic bin. RT stands for replication timing. Overall, we analyzed the effect of replication timing, H3k27me3, H3k27me1 and recombination.
Extended Data Fig. 3 |. Roulette captures accelerated mutation rate in ‘maternal’ regions.
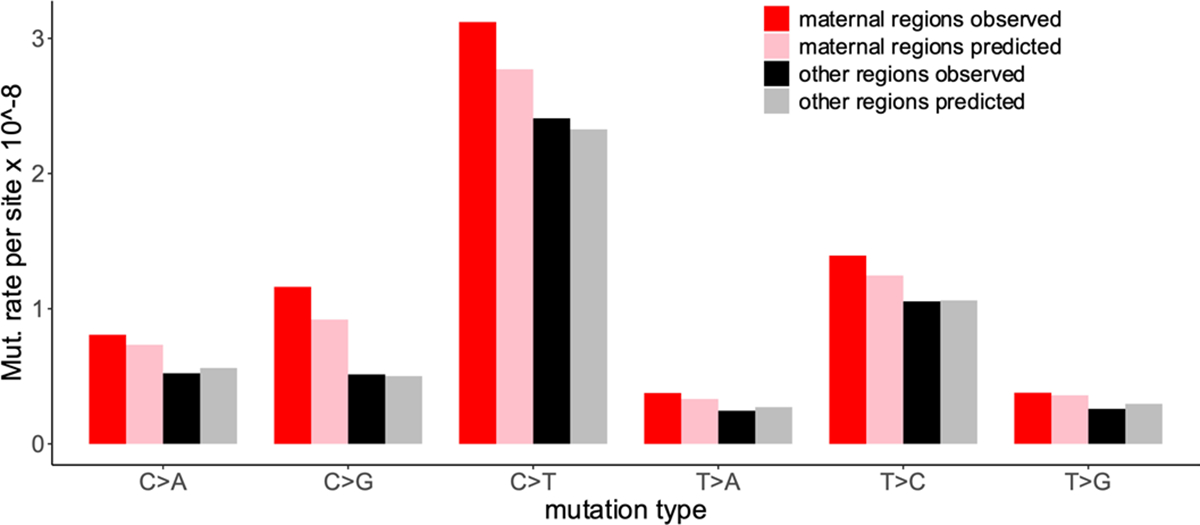
De novo mutation rate inside and outside of maternal regions. Maternal regions are defined as in ref. 5.
Extended Data Fig. 4 |. Roulette predicts the rate of triallelic SNVs.
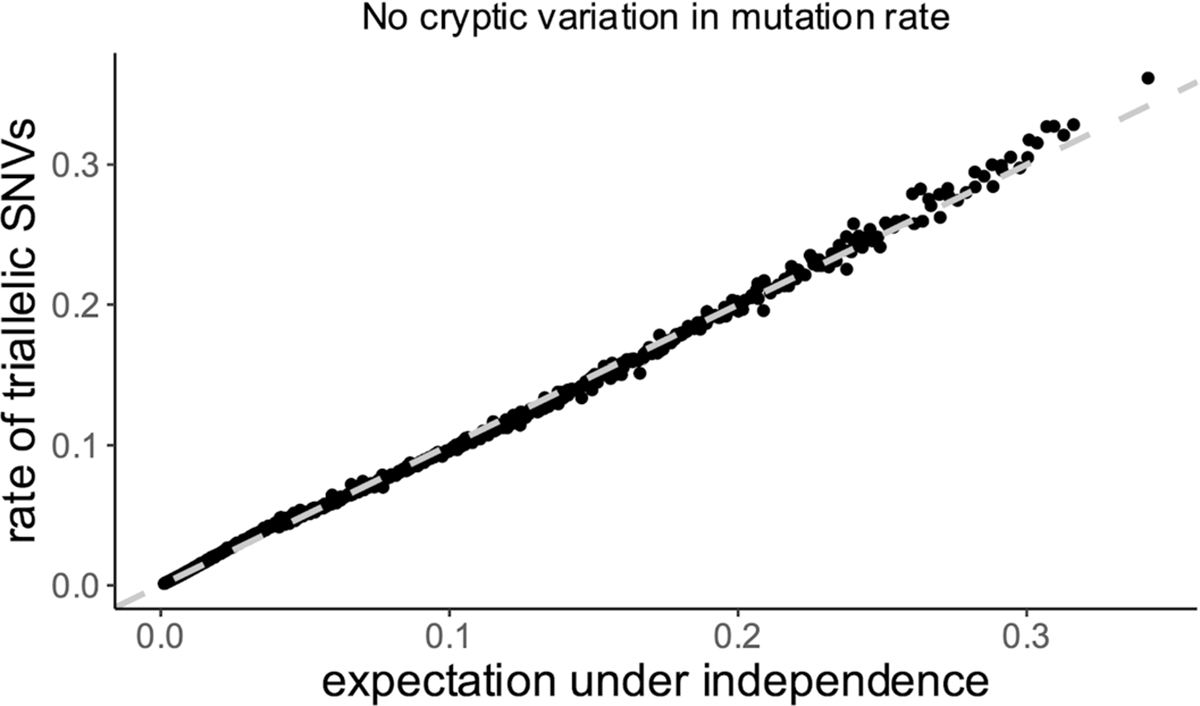
Multiple derived alleles could co-occur in the same genomic site. Using Roulette, we predicted the probability of a site containing two derived variants simultaneously (triallelic site) by multiplying the probabilities of each derived allele (this is the correct procedure if derived alleles accumulated independently). In contrast to early studies of multiallelic variants, we do not find deviation from independence.
Extended Data Fig. 5 |. Pseudo-R2 for noncoding regions.
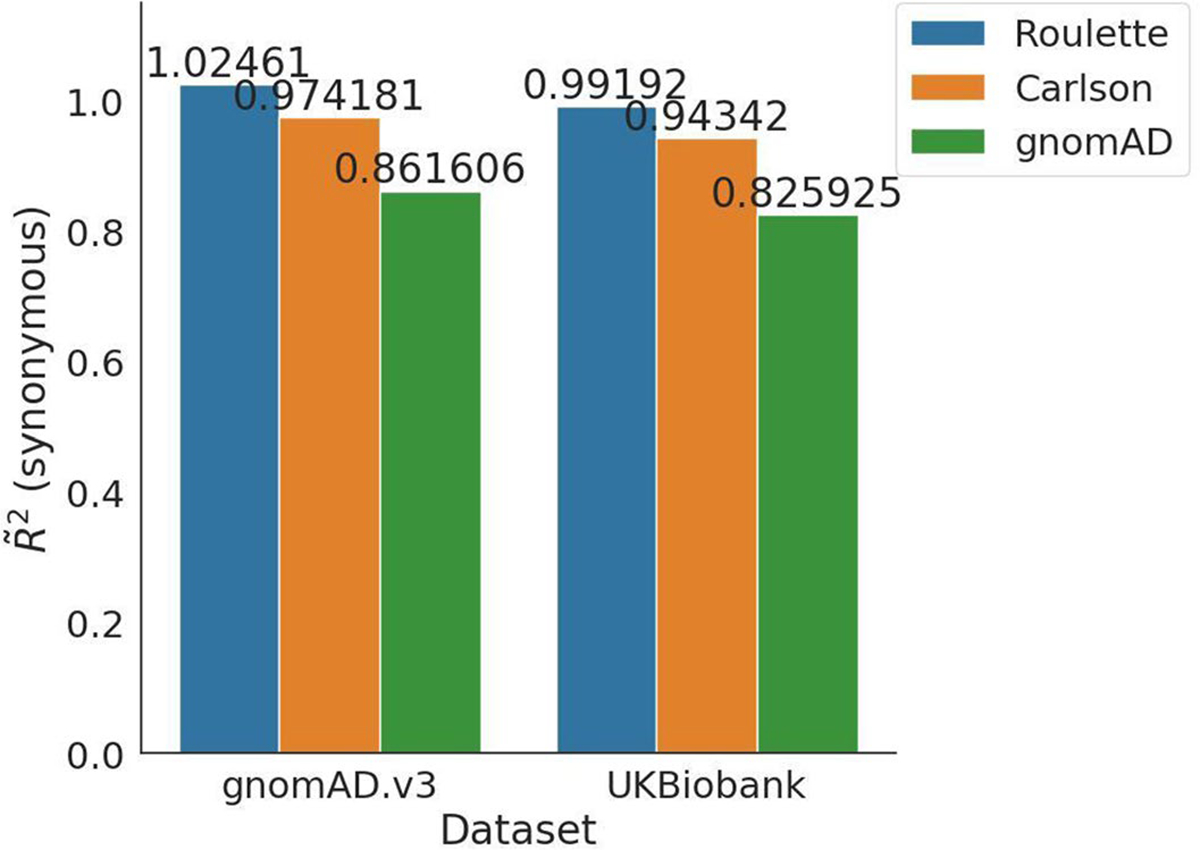
Pseudo-R2 is calculated for noncoding regions for two datasets: gnomAD v3 and UK Biobank. Since Roulette was trained on noncoding variants from the gnomAD v3, it is expected that Roulette performs better for noncoding variants than synonymous variants. De novo sequencing and UK Biobank population sequencing is an independent dataset from trained data.
Extended Data Fig. 6 |. An elevated number of de novo mutations at sites with observed SNVs.
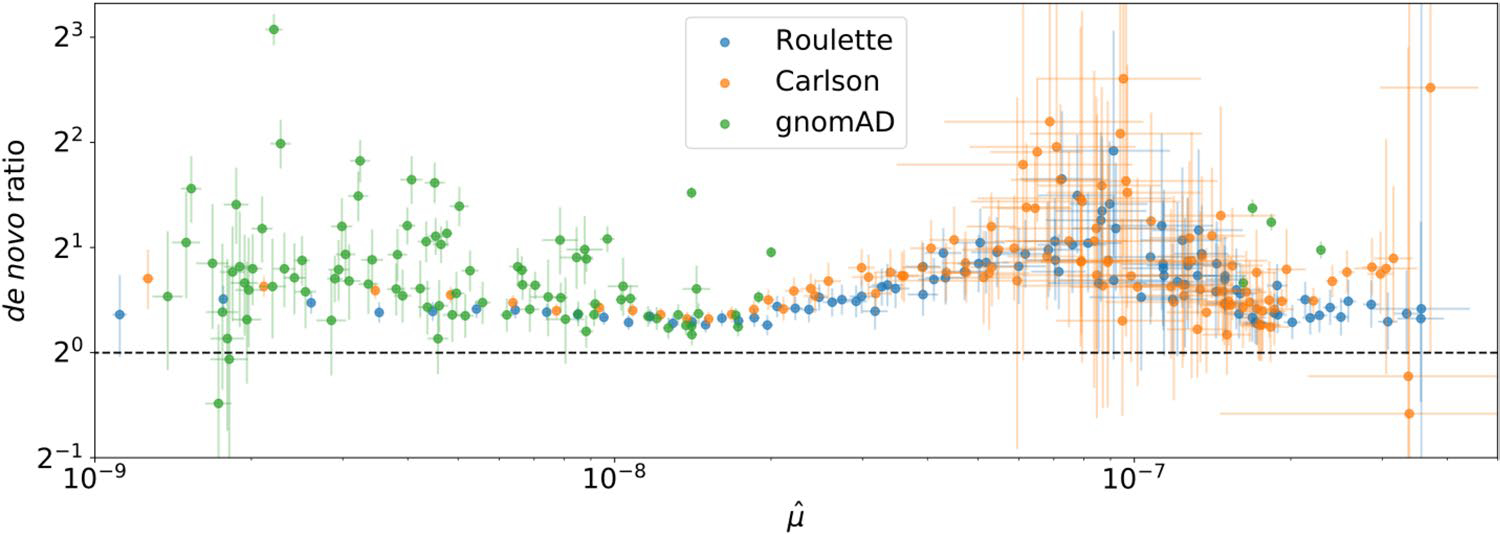
Sites were divided into mutation rate bins for the three different models. De novo mutation rates were calculated from whole-genome family sequencing data. Horizontal bars represent 95% Poisson confidence intervals for the de novo mutation rate within each bin. Vertical bars represent 95% confidence intervals for the ratio of Poisson rates between SNV and non-SNV sites within each bin.
Extended Data Fig. 7 |. Recurrence affects site frequency spectra (SFS).
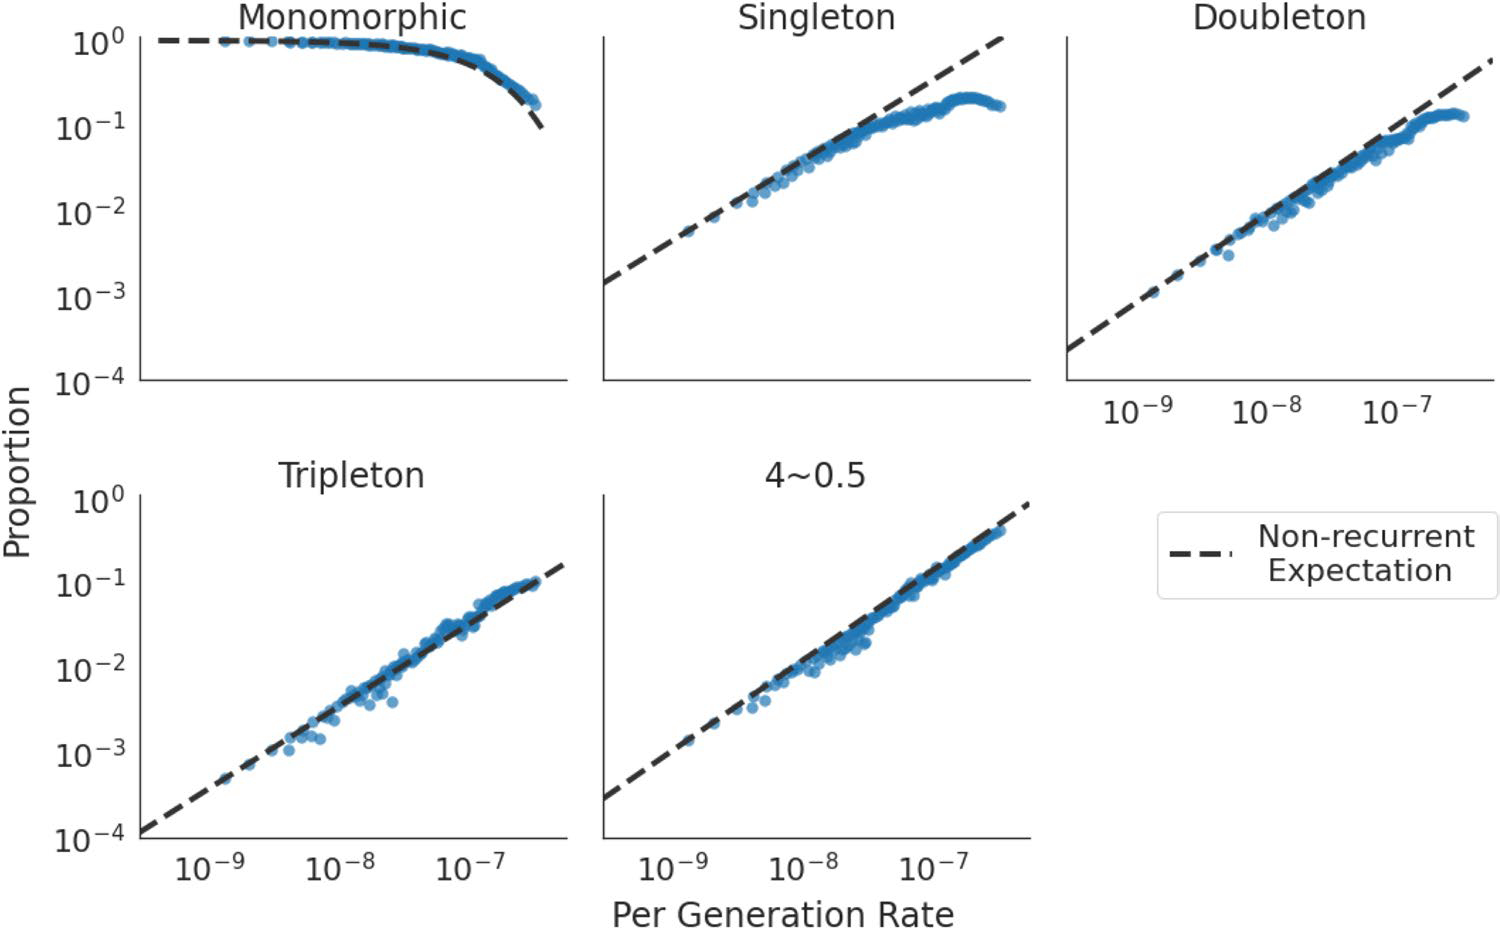
Proportion of sites in five different classes: monomorphic sites, singletons, doubletons, tripletons and other SNVs with higher allele counts. X-axis shows the per-generation mutation rate, as estimated by Roulette. The dotted line is the expected trend under the infinite sites model.
Extended Data Fig. 8 |. Roulette performance at different DNA regions, as annotated by ENCODE.
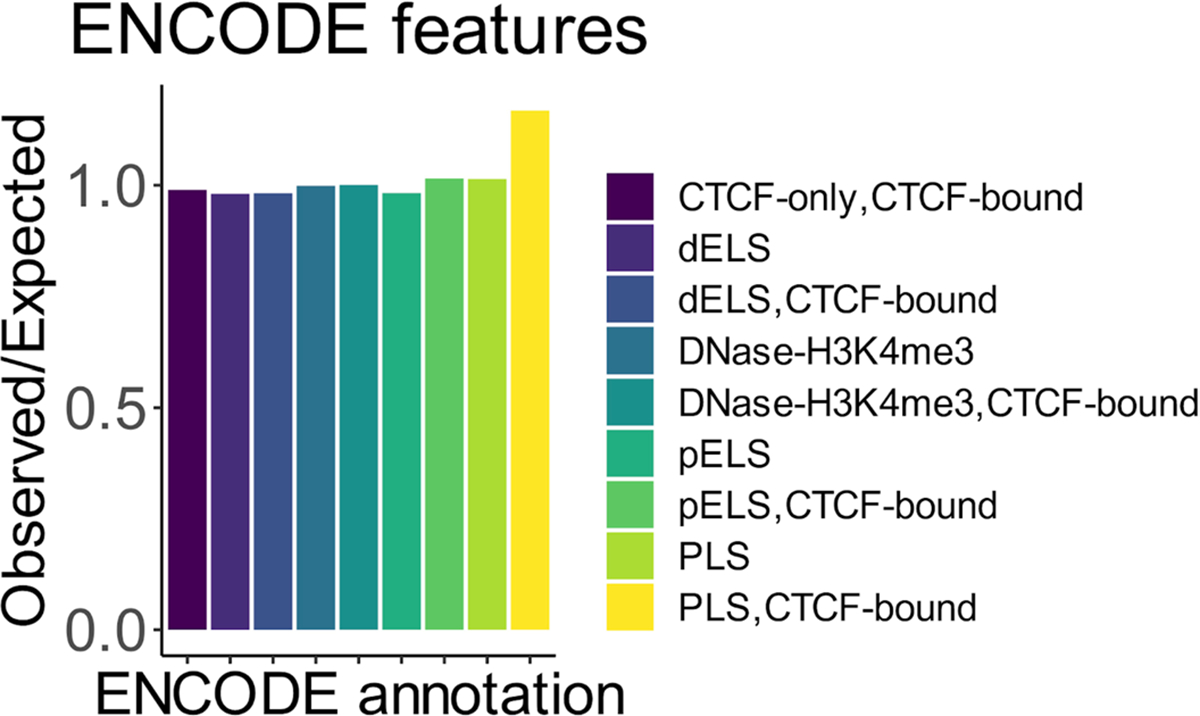
Observed to expected ratio of rare SNVs at different ENCODE annotations. PLS stands for promoters, ELS for enhancers, pPLS and pELS are proximal promoters/enhancers (less than 2 KB from transcription start site), dPLS and dELS (more than 2 KB from transcription start site), DNAse-H3K4me3 are sites that are both hypersensitive to DNase and have signal of H3K4me3, CTCF stands for binding sites of CTCF, multiple labels corresponding to overlapping annotations.
Extended Data Fig. 9 |. Mutation rate around RNU genes.
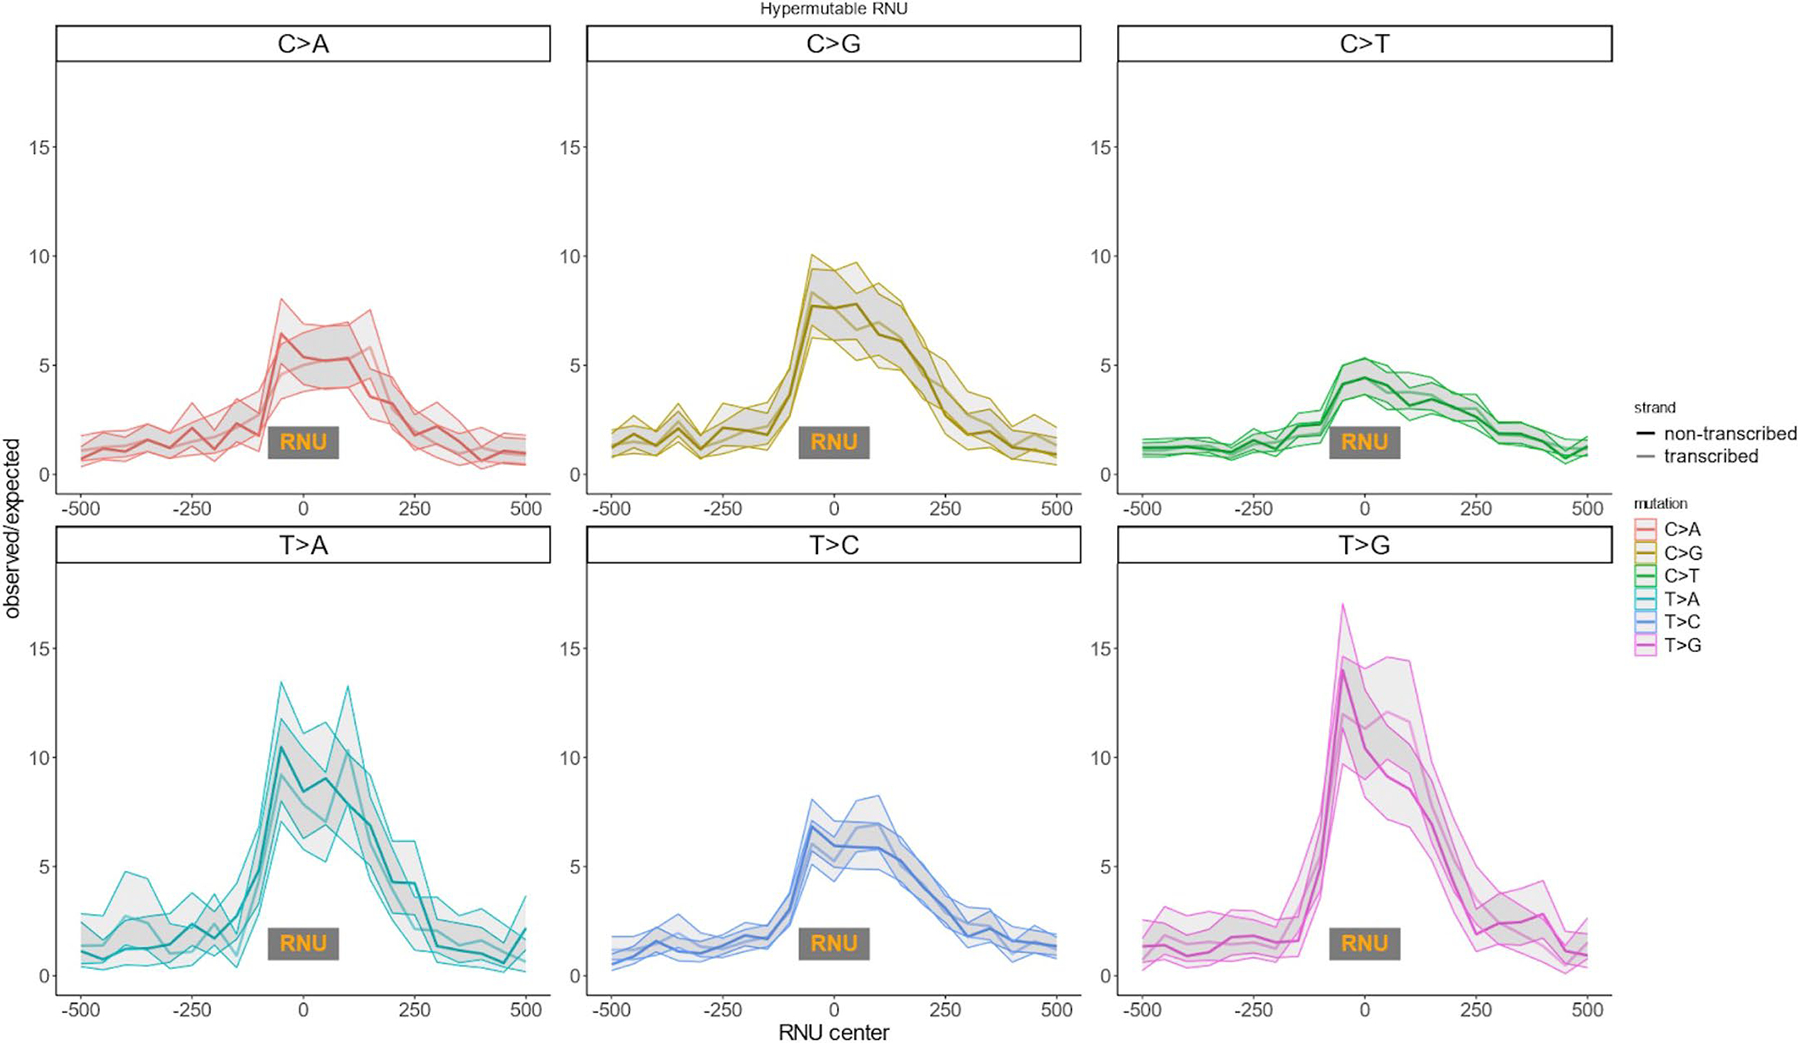
Shaded area is 95% Poisson confidence intervals.
Extended Data Fig. 10 |.
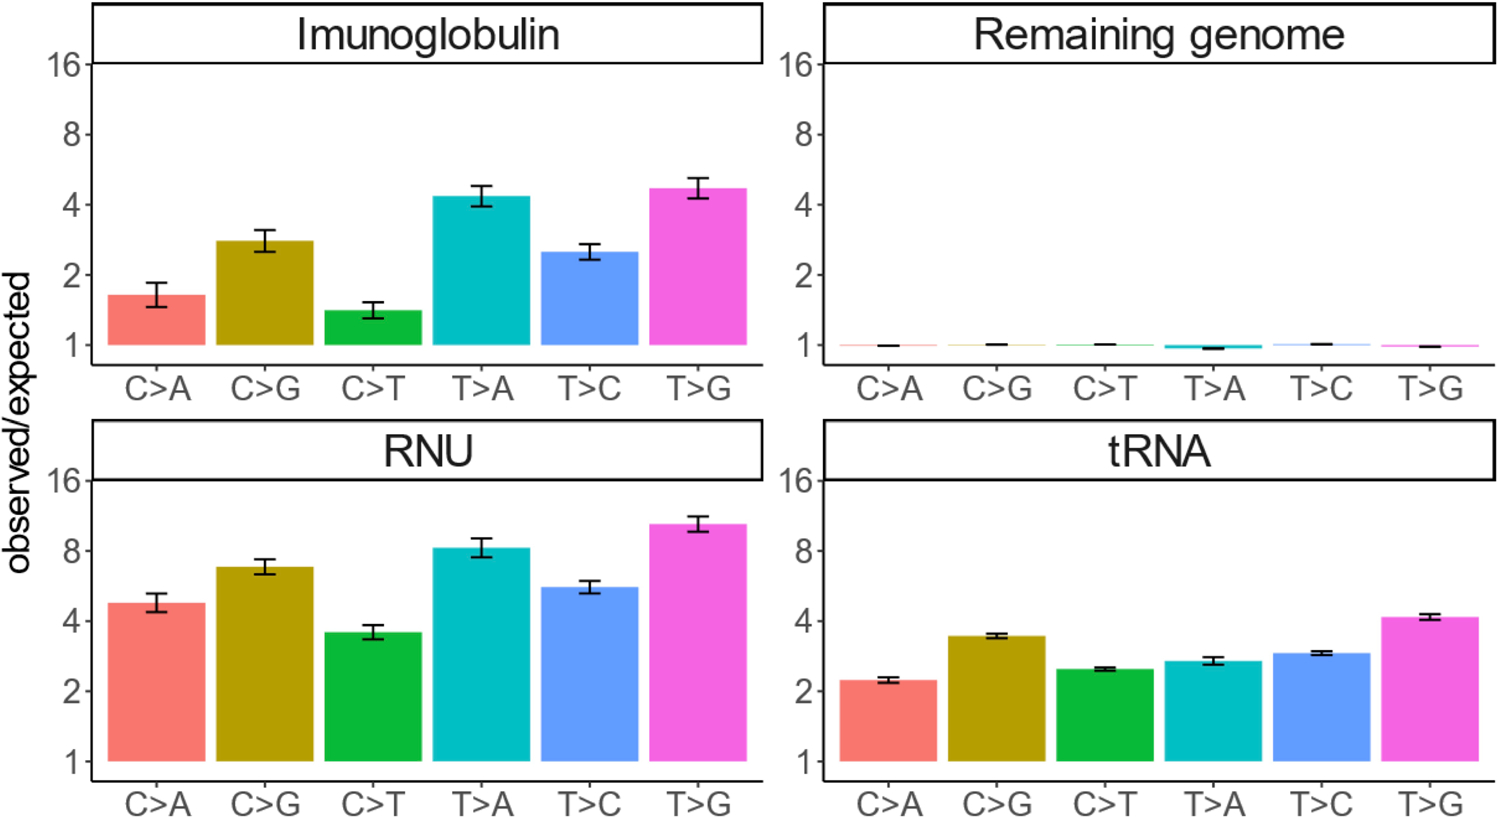
Deviation from Roulette’s predictions for three hypermutable classes of genes (RNU, tRNA and Imunoglobulins) and for other sites in the genome (Remaning genome).
Supplementary Material
Acknowledgements
We thank J. Wakeley and L. Fan for helpful suggestions on population genetics theory. We thank D. J. Balick for providing a forward Wright–Fisher simulator. This research was supported by National Institutes of Health under grants R35-GM127131, R01-MH101244, U01-HG012009 and R01-HG010372 along with funding from NGM Biopharmaceuticals. D.J.L. was supported by NLM T15LM007092.
Footnotes
Competing interests
J.S.L. and H.H.L. are employed by NGM Biopharmaceuticals Inc. V.S., E.M.K. and S.R.S. are partially funded by NGM Biopharmaceuticals Inc. D.J.L. declares no competing interests.
Reporting summary
Further information on research design is available in the Nature Portfolio Reporting Summary linked to this article.
Extended data is available for this paper at https://doi.org/10.1038/s41588-023-01562-0.
Supplementary information The online version contains supplementary material available at https://doi.org/10.1038/s41588-023-01562-0.
Peer review information Nature Genetics thanks Martin Taylor and the other, anonymous, reviewer(s) for their contribution to the peer review of this work.
Reprints and permissions information is available at www.nature.com/reprints.
Code availability
All the code used to perform the analysis is available at https://github.com/vseplyarskiy/Roulette.
Data availability
Polymorphism data used in the study is freely available at https://gnomad.broadinstitute.org/.
De novo mutations have been aggregated from supplementary materials to refs. 13,18.
Mutation rate estimates for autosomes http://genetics.bwh.harvard.edu/downloads/Vova/Roulette/.
Shet values, which measure gene constraints, recalculated with the help of Roulette could be found here http://genetics.bwh.harvard.edu/genescores/selection.html.
References
- 1.Hodgkinson A & Eyre-Walker A Variation in the mutation rate across mammalian genomes. Nat. Rev. Genet. 12, 756–766 (2011). [DOI] [PubMed] [Google Scholar]
- 2.Terekhanova NV, Seplyarskiy VB, Soldatov RA & Bazykin GA Evolution of local mutation rate and its determinants. Mol. Biol. Evol. 34, 1100–1109 (2017). [DOI] [PMC free article] [PubMed] [Google Scholar]
- 3.Seplyarskiy VB & Sunyaev S The origin of human mutation in light of genomic data. Nat. Rev. Genet. 22, 672–686 (2021). [DOI] [PubMed] [Google Scholar]
- 4.Agarwal I & Przeworski M Signatures of replication timing, recombination, and sex in the spectrum of rare variants on the human X chromosome and autosomes. Proc. Natl Acad. Sci. USA 116, 17916–17924 (2019). [DOI] [PMC free article] [PubMed] [Google Scholar]
- 5.Seplyarskiy VB et al. Population sequencing data reveal a compendium of mutational processes in the human germ line. Science 373, 1030–1035 (2021). [DOI] [PMC free article] [PubMed] [Google Scholar]
- 6.Alexandrov LB et al. Signatures of mutational processes in human cancer. Nature 500, 415–421 (2013). [DOI] [PMC free article] [PubMed] [Google Scholar]
- 7.Karczewski KJ et al. The mutational constraint spectrum quantified from variation in 141,456 humans. Nature 581, 434–443 (2020). [DOI] [PMC free article] [PubMed] [Google Scholar]
- 8.Ehrlich M et al. DNA cytosine methylation and heat-induced deamination. Biosci. Rep. 6, 387–393 (1986). [DOI] [PubMed] [Google Scholar]
- 9.Aggarwala V & Voight BF An expanded sequence context model broadly explains variability in polymorphism levels across the human genome. Nat. Genet. 48, 349–355 (2016). [DOI] [PMC free article] [PubMed] [Google Scholar]
- 10.Carlson J et al. Extremely rare variants reveal patterns of germline mutation rate heterogeneity in humans. Nat. Commun. 9, 3753 (2018). [DOI] [PMC free article] [PubMed] [Google Scholar]
- 11.Bethune J, Kleppe A & Besenbacher S A method to build extended sequence context models of point mutations and indels. Nat. Commun. 13, 7884 (2022). [DOI] [PMC free article] [PubMed] [Google Scholar]
- 12.Fang Y, Deng S & Li C A generalizable deep learning framework for inferring fine-scale germline mutation rate maps. Nat. Mach. Intell. 4, 1209–1223 (2022). [Google Scholar]
- 13.Halldorsson BV et al. Characterizing mutagenic effects of recombination through a sequence-level genetic map. Science 363, eaau1043 (2019). [DOI] [PubMed] [Google Scholar]
- 14.Goldmann JM et al. Germline de novo mutation clusters arise during oocyte aging in genomic regions with high double-strand-break incidence. Nat. Genet. 50, 487–492 (2018). [DOI] [PubMed] [Google Scholar]
- 15.Marteijn JA, Lans H, Vermeulen W & Hoeijmakers JHJ Understanding nucleotide excision repair and its roles in cancer and ageing. Nat. Rev. Mol. Cell Biol. 15, 465–481 (2014). [DOI] [PubMed] [Google Scholar]
- 16.Seplyarskiy VB et al. Error-prone bypass of DNA lesions during lagging-strand replication is a common source of germline and cancer mutations. Nat. Genet. 51, 36 (2019). [DOI] [PMC free article] [PubMed] [Google Scholar]
- 17.Kaplanis J et al. Evidence for 28 genetic disorders discovered by combining healthcare and research data. Nature 586, 757–762 (2020). [DOI] [PMC free article] [PubMed] [Google Scholar]
- 18.An J-Y et al. Genome-wide de novo risk score implicates promoter variation in autism spectrum disorder. Science 362, eaat6576 (2018). [DOI] [PMC free article] [PubMed] [Google Scholar]
- 19.Satterstrom FK et al. Large-scale exome sequencing study implicates both developmental and functional changes in the neurobiology of autism. Cell 180, 568–584 (2020). [DOI] [PMC free article] [PubMed] [Google Scholar]
- 20.Weghorn D et al. Applicability of the mutation-selection balance model to population genetics of heterozygous protein-truncating variants in humans. Mol. Biol. Evol. 36, 1701–1710 (2019). [DOI] [PMC free article] [PubMed] [Google Scholar]
- 21.Dukler N et al. Extreme purifying selection against point mutations in the human genome. Nat. Commun. 13, 4312 (2022). [DOI] [PMC free article] [PubMed] [Google Scholar]
- 22.Lee SY et al. The shaping of cancer genomes with the regional impact of mutation processes. Exp. Mol. Med. 54, 1049–1060 (2022). [DOI] [PMC free article] [PubMed] [Google Scholar]
- 23.Xia B et al. Widespread transcriptional scanning in the testis modulates gene evolution rates. Cell 180, 248–262 (2020). [DOI] [PMC free article] [PubMed] [Google Scholar]
- 24.Mao P et al. ETS transcription factors induce a unique UV damage signature that drives recurrent mutagenesis in melanoma. Nat. Commun. 9, 2626 (2018). [DOI] [PMC free article] [PubMed] [Google Scholar]
- 25.Perera D et al. Differential DNA repair underlies mutation hotspots at active promoters in cancer genomes. Nature 532, 259–263 (2016). [DOI] [PubMed] [Google Scholar]
- 26.Sabarinathan R et al. Nucleotide excision repair is impaired by binding of transcription factors to DNA. Nature 532, 264–267 (2016). [DOI] [PubMed] [Google Scholar]
- 27.Wakeley J, Fan WL, Koch E & Sunyaev S Recurrent mutation in the ancestry of a rare variant. Genetics 224, iyad049 (2023). [DOI] [PMC free article] [PubMed] [Google Scholar]
- 28.Hodgkinson A, Ladoukakis E & Eyre-Walker A Cryptic variation in the human mutation rate. PLoS Biol. 7, e1000027 (2009). [DOI] [PMC free article] [PubMed] [Google Scholar]
- 29.Seplyarskiy VB, Kharchenko P, Kondrashov AS & Bazykin GA Heterogeneity of the transition/transversion ratio in Drosophila and Hominidae genomes. Mol. Biol. Evol. 29, 1943–1955 (2012). [DOI] [PubMed] [Google Scholar]
- 30.Johnson PLF & Hellmann I Mutation rate distribution inferred from coincident SNPs and coincident substitutions. Genome Biol. Evol. 3, 842–850 (2011). [DOI] [PMC free article] [PubMed] [Google Scholar]
- 31.Nagelkerke NJD A note on a general definition of the coefficient of determination. Biometrika 78, 691–692 (1991). [Google Scholar]
- 32.Cassa CA et al. Estimating the selective effects of heterozygous protein-truncating variants from human exome data. Nat. Genet. 49, 806–810 (2017). [DOI] [PMC free article] [PubMed] [Google Scholar]
- 33.Gao F & Keinan A Explosive genetic evidence for explosive human population growth. Curr. Opin. Genet. Dev. 41, 130–139 (2016). [DOI] [PMC free article] [PubMed] [Google Scholar]
- 34.Gutenkunst RN, Hernandez RD, Williamson SH & Bustamante CD Inferring the joint demographic history of multiple populations from multidimensional SNP frequency data. PLoS Genet. 5, e1000695 (2009). [DOI] [PMC free article] [PubMed] [Google Scholar]
- 35.Crow JF & Kimura M An Introduction to Population Genetics Theory (The Blackburn Press, 2009). [Google Scholar]
- 36.Lek M et al. Analysis of protein-coding genetic variation in 60,706 humans. Nature 536, 285–291 (2016). [DOI] [PMC free article] [PubMed] [Google Scholar]
- 37.Harpak A, Bhaskar A & Pritchard JK Mutation rate variation is a primary determinant of the distribution of allele frequencies in humans. PLoS Genet. 12, e1006489 (2016). [DOI] [PMC free article] [PubMed] [Google Scholar]
- 38.Agarwal I & Przeworski M Mutation saturation for fitness effects at human CpG sites. eLife 10, e71513 (2021). [DOI] [PMC free article] [PubMed] [Google Scholar]
- 39.Thornlow BP et al. Transfer RNA genes experience exceptionally elevated mutation rates. Proc. Natl Acad. Sci. USA 115, 8996–9001 (2018). [DOI] [PMC free article] [PubMed] [Google Scholar]
- 40.Zhang X-O, Gingeras TR & Weng Z Genome-wide analysis of polymerase III–transcribed Alu elements suggests cell-type-specific enhancer function. Genome Res. 29, 1402–1414 (2019). [DOI] [PMC free article] [PubMed] [Google Scholar]
- 41.Jinks-Robertson S & Bhagwat AS Transcription-associated mutagenesis. Annu. Rev. Genet. 48, 341–359 (2014). [DOI] [PMC free article] [PubMed] [Google Scholar]
- 42.Abascal-Palacios G et al. Structural basis of RNA polymerase III transcription initiation. Nature 553, 301–306 (2018). [DOI] [PubMed] [Google Scholar]
- 43.Reijns MAM et al. Lagging strand replication shapes the mutational landscape of the genome. Nature 518, 502–506 (2015). [DOI] [PMC free article] [PubMed] [Google Scholar]
- 44.Vierstra J et al. Global reference mapping of human transcription factor footprints. Nature 583, 729–736 (2020). [DOI] [PMC free article] [PubMed] [Google Scholar]
- 45.Sasani TA et al. A natural mutator allele shapes mutation spectrum variation in mice. Nature 605, 497–502 (2022). [DOI] [PMC free article] [PubMed] [Google Scholar]
- 46.Jónsson H et al. Parental influence on human germline de novo mutations in 1,548 trios from Iceland. Nature 549, 519–522 (2017). [DOI] [PubMed] [Google Scholar]
- 47.Chen Y-H et al. Transcription shapes DNA replication initiation and termination in human cells. Nat. Struct. Mol. Biol. 26, 67–77 (2019). [DOI] [PMC free article] [PubMed] [Google Scholar]
- 48.Consortium GTEx. Genetic effects on gene expression across human tissues. Nature 550, 204–213 (2017). [DOI] [PMC free article] [PubMed] [Google Scholar]
Associated Data
This section collects any data citations, data availability statements, or supplementary materials included in this article.
Supplementary Materials
Data Availability Statement
Polymorphism data used in the study is freely available at https://gnomad.broadinstitute.org/.
De novo mutations have been aggregated from supplementary materials to refs. 13,18.
Mutation rate estimates for autosomes http://genetics.bwh.harvard.edu/downloads/Vova/Roulette/.
Shet values, which measure gene constraints, recalculated with the help of Roulette could be found here http://genetics.bwh.harvard.edu/genescores/selection.html.


