Abstract
Electrochemical hydrogen peroxide (H2O2) production via two-electron oxygen reduction reaction (2e− ORR) has received increasing attention as it enables clean, sustainable, and on-site H2O2 production. Mimicking the active site structure of H2O2 production enzymes, such as nickel superoxide dismutase, is the most intuitive way to design efficient 2e− ORR electrocatalysts. However, Ni-based catalysts have thus far shown relatively low 2e− ORR activity. In this work, we present the design of high-performing, atomically dispersed Ni-based catalysts (Ni ADCs) for H2O2 production through understanding the formation chemistry of the Ni-based active sites. The use of a precoordinated precursor and pyrolysis within a confined nanospace were found to be essential for generating active Ni–Nx sites in high density and increasing carbon yields, respectively. A series of model catalysts prepared from coordinating solvents having different vapor pressures gave rise to Ni ADCs with controlled ratios of Ni–Nx sites and Ni nanoparticles, which revealed that the Ni–Nx sites have greater 2e− ORR activity. Another set of Ni ADCs identified the important role of the degree of distortion from the square planar structure in H2O2 electrosynthesis activity. The optimized catalyst exhibited a record H2O2 electrosynthesis mass activity with excellent H2O2 selectivity.
This work presents the design of high-performing, atomically dispersed Ni-based catalysts (Ni ADCs) for H2O2 production through understanding the formation chemistry of Ni-based active sites.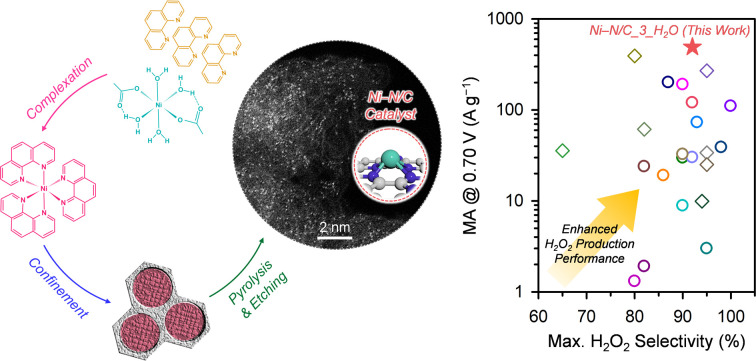
Introduction
Hydrogen peroxide (H2O2) is an important commodity chemical that has found wide utility in diverse fields such as pulp and paper bleaching, chemical synthesis, disinfection, wastewater treatment, and ballast water treatment.1–4 Currently, 95% of commercial H2O2 is produced via the autooxidation-based anthraquinone process developed back in the 1930s.1,2 However, this process requires expensive Pd-based hydrogenation catalysts, high purity H2 gas, and additional distillation and purification steps. Hence, alternative routes to H2O2 production have been extensively investigated. In particular, electrochemical H2O2 production via two-electron oxygen reduction reaction (2e− ORR) has recently attracted significant attention, as it allows clean, continuous, and on-site H2O2 production.5–13
Since ORR can produce either H2O2 or H2O via 2e− or 4e− ORR, respectively, it is crucial to develop electrocatalysts that can selectively synthesize H2O2. Among several strategies developed to steer 2e− ORR, mimicking or referring to the structure of enzymatic catalysts is the most intuitive method for designing high-efficiency catalysts.14–16 Nicotinamide adenine dinucleotide phosphate (NADPH) oxidase (NOX) and superoxide dismutase (SOD) are nature's catalysts used for transformation of O2 into H2O2.17 The NOX catalyzes the production of superoxide (O2˙−) by transferring one electron to O2 from NADPH. Then, SOD converts the produced O2˙− into H2O2 and O2. Because the SOD is directly involved in the production of H2O2, the development of an electrocatalyst that resembles the structure of SOD is the most straightforward way to achieve highly active and selective H2O2 electrosynthesis. Notably, unlike other SODs with complicated cofactor structures, Ni SOD has an off-centered square planar cofactor structure that can be mimicked and scaled in heterogeneous Ni catalysts with relative ease.18
Some attempts have been made to synthesize atomically dispersed Ni catalysts (Ni ADCs) with Ni SOD cofactor-like active site structures for 2e− ORR.19–25 The resulting Ni ADCs exhibit reasonably high H2O2 selectivity over a wide pH range. However, even under alkaline conditions where nonprecious metal catalysts show relatively higher activity, the activities of the reported Ni ADCs are inferior to those of other high-performing carbon-based catalysts or nonprecious-metal-based ADCs.26–30
In the synthesis of Ni ADCs in particular, and metal ADCs in general, balancing the generation of active coordination structures and the attainment of high conductivity and stability is critical. High-temperature heat treatment is considered an essential step for achieving high electrical conductivity and structural integrity in ADCs. However, in this process, the innate coordination structure is uncontrollably altered and undesirable metallic particles are often generated.25,31–34 Conversely, the coordination structure can be preserved by decreasing the pyrolysis temperature, which however sacrifices the conductivity and stability of the resulting ADCs.19–25 Hence, the understanding of preparation process and judicious control of synthetic parameters are crucial for designing high-performing metal ADCs.
This work was motivated to overcome the aforementioned tradeoff relationship in metal ADC syntheses. Through understanding the preparative chemistry, we designed highly efficient Ni ADCs for H2O2 electrosynthesis. We found that the use of a precoordinated precursor and pyrolysis within a confined nanospace are essential for generating dense Ni–Nx sites and increasing the carbon yield, respectively. On this ground, we prepared a series of model catalysts with a tunable extent of complexation between the Ni cation and 1,10-phenanthroline using an appropriate solvent. The resulting Ni ADCs, which had varying ratios of Ni–Nx sites and Ni particles, revealed that the atomically dispersed Ni–Nx species is the major active site for the 2e− ORR. Another set of model catalysts with a controlled ratio of Ni cation to 1,10-phenanthroline identified importance of the degree of distortion from the square planar structure in Ni ADCs. The optimized Ni ADC exhibited high 2e− ORR activity (0.77 V at −1 mA cm−2), maximum H2O2 selectivity (92%) and negligible H2O2 reduction reaction (HPR) activity in alkaline conditions. Importantly, the optimized catalyst achieved the highest H2O2 mass activity (MA) (490.9 A g−1 at 0.70 V) among the reported nonprecious metal ADCs and carbon-based catalysts. The turnover frequency (TOF) of the active site was 0.86 s−1 per Ni site at 0.77 V. The optimized catalyst stably produced 74 mM of H2O2 with a faradaic efficiency (FE) of 93.1% under alkaline condition.
Results and discussion
Comparison of physical mixture and coordination complex as a precursor
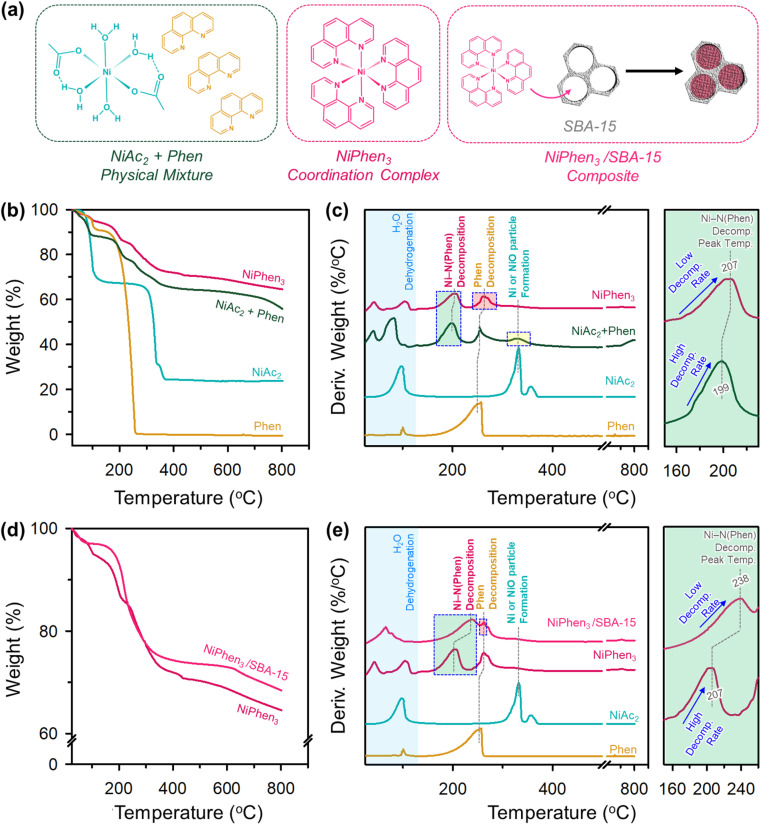
Physical mixtures of metal salts and N-containing organic molecules have been most widely used as precursors for metal ADCs. A metal–nitrogen precoordinated complex has also served as a precursor, albeit to a lesser extent. For Ni ADCs, a physical mixture or precoordinated complex between a Ni cation such as nickel acetate [Ni(CH3COO)2·4H2O; NiAc2] and an N-containing molecule like 1,10-phenanthroline has been used.32,35–38 However, the transformation chemistry from the respective precursors into the final catalysts has rarely been explored. We investigated the thermal conversion of the two Ni/N precursors using thermogravimetric and differential thermal analyses (TGA and DTA, respectively) under N2 flow (Fig. 1).39–42
Fig. 1. (a) Structures of NiAc2, Phen, and NiPhen3. (b) TGA and (c) DTA profiles of NiAc2, Phen, NiAc2 + Phen, and NiPhen3. (d) TGA profiles of NiPhen3 and NiPhen3/SBA-15. (e) DTA profiles of Phen, NiAc2, NiPhen3 and NiPhen3/SBA-15. Enlarged DTA profiles for the Ni–N(Phen) decomposition region are shown in (c) and (e) with greenish background.
The TGA profile of NiAc2 and its DTA curve (Fig. 1b and c) showed gravimetric losses at 98 and 330 °C, which correspond to the evaporation of crystalline water molecules from NiAc2 and the decomposition of NiAc2 generating Ni or NiO particles, respectively. 1,10-phenanthroline underwent a loss of adsorbed water molecules at approximately 100 °C and subsequently decomposed from 178 to 278 °C. A physical mixture of NiAc2 and 1,10-phenanthroline (NiAc2 + Phen) with a 1 : 3 molar ratio showed a more complex decomposition behavior compared to its component molecules. NiAc2 + Phen exhibited similar DTA peaks as NiAc2 and 1,10-phenanthroline and additional peaks at 45 and 200 °C. We suppose that NiAc2 and 1,10-phenanthroline can coordinate even under mechanical mixing at room temperature (RT) and that the resulting Ni–N(Phen) species decomposes at these temperatures. Indeed, a 1 : 3 coordination complex between NiAc2 and 1,10-phenanthroline (NiPhen3), which had been complexed in water and dried, showed DTA peaks at temperatures similar to those of NiAc2 + Phen, corroborating our hypothesis. However, the TGA and DTA curves of the NiPhen3 complex exhibited distinguishable features, compared to those of NiAc2 + Phen. First, upon completion of thermal analysis, a larger amount of the product remained in NiPhen3 than in NiAc2 + Phen. Second, NiPhen3 was free of a DTA peak around 330 °C, suggesting that its transformation into Ni or NiO was suppressed in the coordination complex. Third, NiPhen3 exhibited a higher decomposition onset temperature and a slower decomposition rate for the Ni–N(Phen) species, compared to NiAc2 + Phen, indicating that NiPhen3 is advantageous for forming active Ni–Nx species more stably during the heat treatment.
We note that, even in the NiPhen3 complex, the decomposition of 1,10-phenanthroline was unavoidable. Given that 1,10-phenanthroline can serve as a carbon precursor, preventing its decomposition can increase the carbon yield and enhance the conductivity of the resulting catalyst. We posited that the pyrolysis of NiPhen3 within a confined nanospace may impede undesirable decomposition of 1,10-phenanthroline.43 Using ordered mesoporous silica, SBA-15 (Fig. S1†), as a nanoconfinement medium, the decomposition of the NiPhen3 complex within its mesopores (NiPhen3/SBA-15) was examined (Fig. 1d and e). NiPhen3/SBA-15 exhibited a substantially decreased DTA peak intensity for 1,10-phenanthroline decomposition compared to NiPhen3. In addition, Ni–N(Phen) decomposition began at higher temperatures, and its decomposition rate was much lower than that of NiPhen3 without SBA-15. These results collectively suggest that the mobility of the NiPhen3 complex is suppressed during pyrolysis inside the mesopores of SBA-15 silica.
Overall, the use of the coordinated complex as a precursor and pyrolysis in a confined nanospace were demonstrated to be beneficial for promoting the generation of active Ni–Nx sites in high density while suppressing the formation of Ni or NiO particles and for increasing the carbon yield and conductivity of the resulting catalysts.
Impact of solvent during NiPhen3 complex formation on the structure of catalysts
Next, we explored the influence of solvent during the complexation process on the structure of the resulting catalysts. Three solvents having different vapor pressures, namely acetone (24.60 kPa), anhydrous ethanol (EtOH) (5.85 kPa), and deionized water (H2O) (2.34 kPa) were examined in the complexation process.
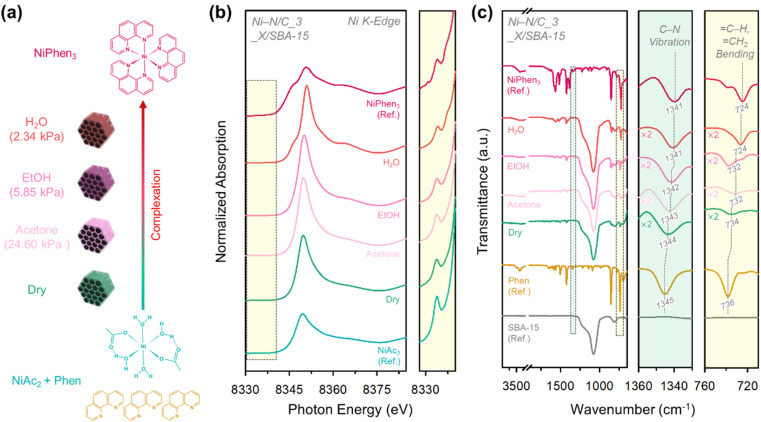
A series of model catalysts were synthesized by injecting a small volume of solvent (corresponding to the pore volume of SBA-15) into a 1 : 3 molar mixture of NiAc2 and 1,10-phenanthroline and SBA-15 in an agate mortar. The mixture was ground and dried overnight (Fig. 2a; see Experimental for details). The resulting composite samples were designated as Ni–N/C_3_X/SBA-15 (X = acetone, EtOH, and H2O). The sample prepared in the absence of a solvent was denoted as Ni–N/C_3_Dry/SBA-15.
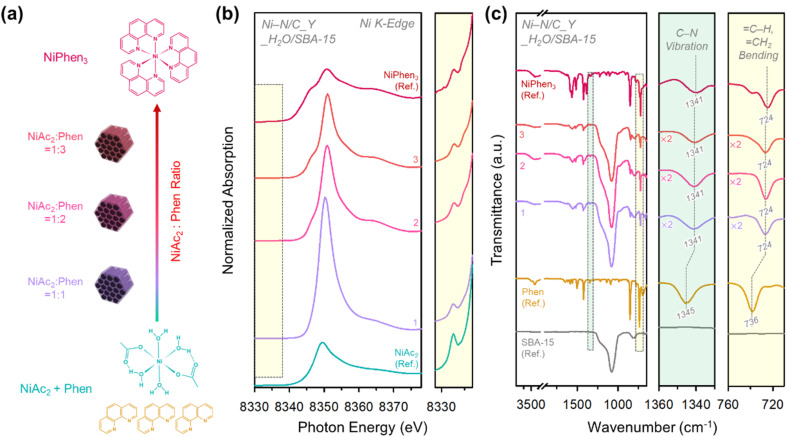
Fig. 2. (a) Schematic illustration for the preparation of Ni–N/C_3_X/SBA-15 composites in the presence of different solvents. (b) Ni K-edge XANES spectra of Ni–N/C_3_X/SBA-15 composites, NiAc2, and NiPhen3 and their enlarged spectra in the pre-edge region. (c) FT-IR spectra of Ni–N/C_3_X/SBA-15 composites, SBA-15, Phen, and NiPhen3 and their enlarged spectra in the regions of C–N vibration and C–H, CH2 bending.
The electronic and geometric structures of Ni–N/C_3_X/SBA-15 composites were assessed by X-ray absorption near-edge spectroscopy (XANES, Fig. 2b). The spectra of NiAc2 and NiPhen3 were also measured for benchmark purpose. The XANES spectrum of Ni–N/C_3_Dry/SBA-15 resembled that of NiAc2, indicating that the physically mixed NiAc2 and 1,10-phenanthroline rarely underwent complexation. Comparing the Ni–N/C_3_X/SBA-15 composites, their XANES spectra gradually became similar to that of NiPhen3 in the order of X = acetone, EtOH, and H2O, suggesting that the choice of solvent can significantly influence the extent of complexation. These results were corroborated by the FT-IR analysis of the Ni–N/C_3_X/SBA-15 composites (Fig. 2c). In FT-IR spectra, the C–N vibration (1345 cm−1) and C–H, CH2 bending (736 cm−1) peaks of 1,10-phenanthroline red-shifted upon complexation to form NiPhen3 (1341 cm−1 and 724 cm−1). The degree of shift in the Ni–N/C_3_X/SBA-15 composites increased in the order of X = H2O > EtOH > acetone > dry.44,45
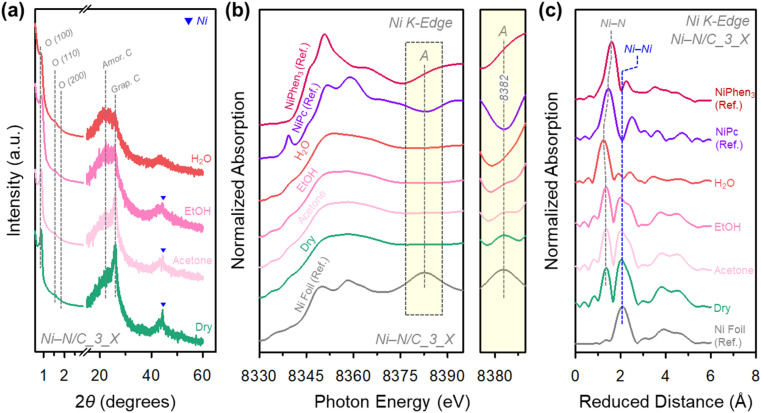
The final Ni–N/C_3_X catalysts were obtained after the pyrolysis of Ni–N/C_3_X/SBA-15 composites to carbonize the precursor, followed by washing with HF and HCl to remove the silica template and large Ni particles. The small-angle X-ray diffraction (XRD) patterns of Ni–N/C_3_X revealed (Fig. 3a) the formation of a 2D hexagonal mesostructure with P6mm symmetry. Bright-field scanning transmission electron microscopy (BF-STEM) images of Ni–N/C_3_X (Fig. S2†) showed a hexagonal array of carbon nanorods with uniform mesopores, suggesting successful replication of the SBA-15 template. The BF-STEM images also indicated different extents of Ni nanoparticle formation among the Ni–N/C_3_X catalysts. Ni–N/C_3_Dry contained the highest density of Ni nanoparticles, followed by X = acetone, EtOH, and H2O. We note that this trend is inversely related to the degree of complexation. The N2 adsorption–desorption isotherms of the Ni–N/C_3_X catalysts (Fig. S3a†) commonly showed type IV isotherms with capillary condensation steps at a relative pressure range of 0.4–0.6, indicating the formation of mesopores. The Barrett–Joyner–Halenda (BJH) pore size distribution curves of the catalysts (Fig. S3b†) exhibited a maximum at 5 nm. The N2 isotherms and pore size distribution curves of the catalysts also exhibited an increase in adsorption at a relative pressure range above 0.9 and the corresponding mesopores above 30 nm, which could originate from the removal of large Ni particles and interparticle spaces. All catalysts had similar Brunauer–Emmett–Teller (BET) surface areas of 710–739 m2 g−1 and total pore volumes of 1.10–1.21 cm3 g−1 (Table S1†). In addition, the inductively coupled plasma optical emission spectroscopy (ICP-OES) and elemental analysis (EA) results revealed that the four catalysts contained similar amounts of Ni and heteroatoms (C, H, N, and O) (Table S2†). The high-angle XRD patterns of Ni–N/C_3_X (Fig. 3a) showed a broad XRD peak at 22°, indicating that all catalysts were mainly composed of amorphous carbon frameworks. Notably, Ni–N/C_3_Dry showed a distinct XRD peak around 26° for graphitic carbon, whose intensity decreased in the order of X = acetone, EtOH, and H2O.46
Fig. 3. (a) XRD patterns of Ni–N/C_3_X catalysts. (b) Ni K-edge XANES spectra and their enlarged spectra in the peak A region and (c) EXAFS spectra of Ni–N/C_3_X catalysts, Ni foil, NiPc, and NiPhen3.
This tendency can also be confirmed in XANES and extended X-ray absorption fine structure (EXAFS) analyses (Fig. 3b,c). In the XANES spectra of Ni–N/C_3_X catalysts and references [Ni foil, nickel phthalocyanine (NiPc), and NiPhen3], peak A (8382 eV) found in Ni foil gradually decreased in intensity in the order of X = dry, acetone, EtOH, and H2O, and peak A eventually disappeared in Ni–N/C_3_H2O. The radial distribution functions (RDFs) from the k3-weighted Fourier-transformed EXAFS spectra of all the Ni–N/C_3_X catalysts presented a peak for the Ni–N bond. The catalysts, except Ni–N/C_3_H2O, also showed a Ni–Ni bond peak, whose intensity decreased in the order of X = dry, acetone, and EtOH. Overall, the FT-IR results of Ni–N/C_3_X/SBA-15 composites and the BR-STEM, high-angle XRD, XANES, and EXAFS analyses of Ni–N/C_3_X catalysts self-consistently indicated that as the vapor pressure of a solvent decreases, the degree of complexation and the generation of Ni–Nx sites are promoted, while the formation of Ni particles is suppressed. Importantly, Ni–N/C_3_H2O is exclusively composed of Ni–Nx sites, whose detailed electronic and geometric structure analyses will be discussed later.
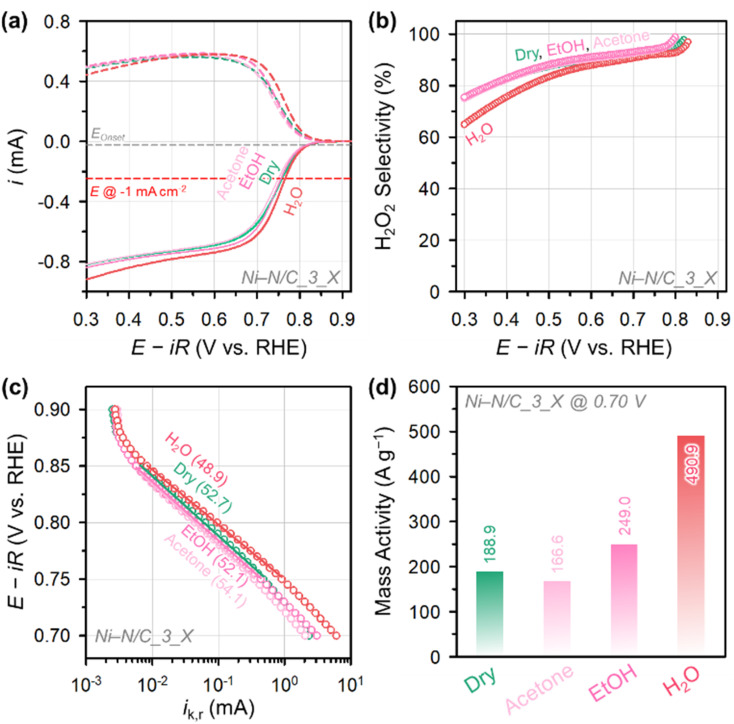
The electrocatalytic 2e− ORR activity and selectivity of Ni–N/C_3_X were investigated in an alkaline electrolyte (0.1 M KOH) using the rotating ring-disk electrode (RRDE) technique (Fig. 4). All potential values described in this paper were converted to the reversible hydrogen electrode (RHE) scale (V vs. RHE; see Experimental for details). The linear sweep voltammetry (LSV) curves (Fig. 4a) revealed that Ni–N/C_3_H2O had the highest 2e− ORR activity among the Ni–N/C_3_X catalysts. Ni–N/C_3_H2O recorded a current density of −1 mA cm−2 at a potential of 0.77 V, which is higher than those of Ni–N/C_3_Dry (0.75 V), Ni–N/C_3_EtOH (0.74 V), and Ni–N/C_3_Acetone (0.73 V). The H2O2 selectivities of Ni–N/C_3_X catalysts (Fig. 4b) were in the range of 86–92% at a low overpotential region (0.60–0.80 V) but decreased with increasing overpotential. Ni–N/C_3_H2O, which contained only atomically dispersed Ni–Nx sites, had the fastest rate of decline in H2O2 selectivity in the high overpotential region. In contrast, Ni–N/C_3_Dry, Ni–N/C_3_Acetone, and Ni–N/C_3_EtOH catalysts showed similar rates of decrease in H2O2 selectivity. In the high overpotential region, Ni–N/C_3_H2O also showed higher hydrogen peroxide reduction (HPR) activity than the other Ni–N/C_3_X catalysts (Fig. S4†). This phenomenon could be attributed to by the catalytic function of Ni–Nx sites catalyzing the reduction of the produced H2O2,47 whereas Ni particles have almost no HPR activity.48 The Tafel analyses of the catalysts (Fig. 4c) revealed that Ni–N/C_3_H2O exhibited the best 2e− ORR kinetics with the lowest Tafel slope (48.9 mV dec−1), followed by Ni–N/C_3_EtOH (52.1 mV dec−1), Ni–N/C_3_Dry (52.7 mV dec−1), and Ni–N/C_3_Acetone (54.1 mV dec−1). Therefore, the 2e− ORR kinetics of the Ni–Nx sites are faster than those of Ni particles. The MA at 0.70 V of Ni–N/C_3_H2O (490.9 A g−1) is much greater than those of Ni–N/C_3_EtOH (249.0 A g−1), Ni–N/C_3_Dry (188.9 A g−1), and Ni–N/C_3_Acetone (166.6 A g−1) (Fig. 4d).
Fig. 4. (a) ORR polarization curves of Ni–N/C_3_X catalysts measured in O2-saturated 0.1 M KOH and (b) the corresponding H2O2 selectivity. (c) Tafel plots for Ni–N/C_3_X catalysts. The numbers in the parentheses represent the Tafel slopes (in mV dec−1). (d) Mass activity of Ni–N/C_3_X catalysts at 0.70 V.
Notably, a discrepancy was observed between the trends in the number of Ni–Nx sites and the MA of Ni–N/C_3_X catalysts. Specifically, Ni–N/C_3_Dry showed a higher MA than Ni–N/C_3_Acetone, despite the former containing fewer Ni–Nx sites. This contrast indicates that the Ni–Nx site density is not the only factor influencing the H2O2 electrosynthesis activity. As indicated in the wide-angle XRD results of Ni–N/C_X catalysts (Fig. 3a), the formation of graphitic carbon was enhanced with a decreasing degree of Ni–Nx complexation. The high-magnification TEM images of Ni–N/C_3_Dry (Fig. S5†) indicated the formation of a graphitic shell on the Ni nanoparticles, suggesting that uncoordinated 1,10-phenanthroline molecules were consumed to generate graphitic shells.49,50 We suppose that the presence of graphitic carbon and the associated change in the charge-transfer rate could also affect the catalytic activity.51 Indeed, the electrochemical impedance spectroscopy (EIS) analysis revealed that Ni–N/C_3_Dry showed the smallest semi-circle radius in the Nyquist plots of Ni–N/C_3_X catalysts (Fig. S6†), with the lowest charge-transfer resistance. The graphitic carbon-driven enhanced charge transfer in Ni–N/C_3_Dry could contribute to its higher activity than Ni–N/C_3_Acetone.
Impact of N to Ni precursor ratio in the coordination complex
To exclude the influence of graphitic carbon in evaluating the catalytic activity of Ni–N/C catalysts, we prepared a new series of model catalysts, which were prepared with controlled molar ratios of 1,10-phenanthroline to NiAc2 while fixing water as the coordinating solvent (Fig. 5a). After generating the coordination complex within the mesopores of SBA-15, the samples were denoted as Ni–N/C_Y_H2O/SBA-15 (Y = 1, 2, and 3), and the final catalysts after pyrolysis and etching were termed Ni–N/C_Y_H2O. The XANES spectra of Ni–N/C_Y_H2O/SBA-15 (Fig. 5b) composites gradually became similar to those of NiPhen3 in the order of Y = 1, 2, and 3. Their FT-IR spectra (Fig. 5c) commonly presented the C–N vibration and C–H, CH2 bending peaks at 1341 cm−1 and 724 cm−1, respectively,44,45 suggesting that most of 1,10-phenanthroline molecules were consumed in the NiPhen3 complexation reaction.
Fig. 5. (a) Schematic illustration for the preparation of Ni–N/C_Y_H2O/SBA-15 composites with different Phen to NiAc2 precursor ratios. (b) Ni K-edge XANES spectra of Ni–N/C_Y_H2O/SBA-15 composites, NiAc2, and NiPhen3 and their enlarged spectra in the pre-edge region. (c) FT-IR spectra of Ni–N/C_Y_H2O/SBA-15 composites and SBA-15, Phen, and NiPhen3 and their enlarged spectra in the regions of C–N vibration and C–H, CH2 bending.
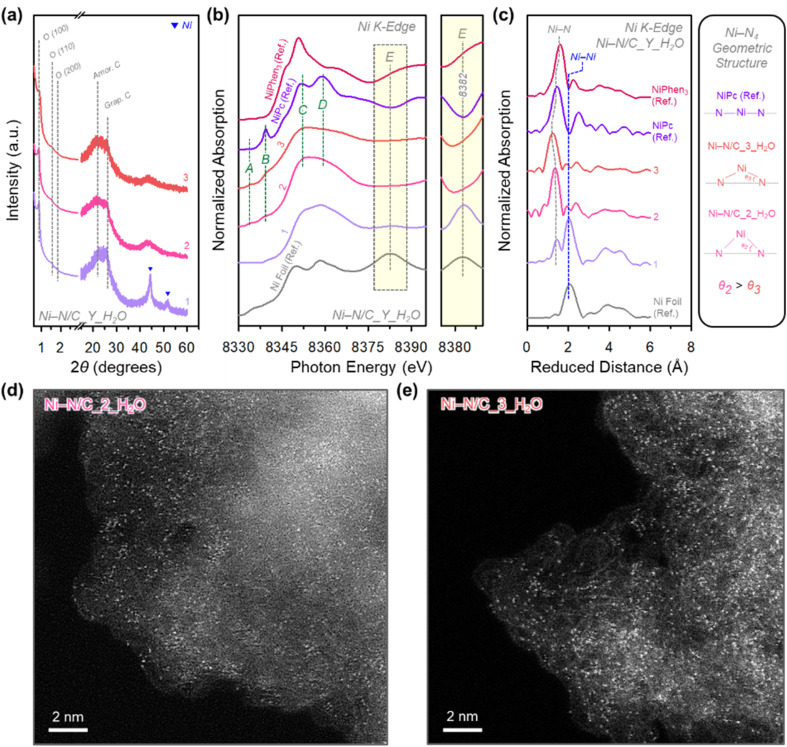
The small-angle XRD patterns of Ni–N/C_Y_H2O catalysts (Fig. 6a) indicated the formation of 2D hexagonal mesostructure. The BF-STEM images (Fig. S7†) revealed that Ni particles were generated in Ni–N/C_1_H2O whereas the other two catalysts were free of particles. This result was further confirmed by the wide-angle XRD patterns (Fig. 6a), where only Ni–N/C_1_H2O presented peaks corresponding to the Ni metallic phase. Interestingly, the Ni–N/C_Y_H2O catalysts showed nearly identical wide-angle XRD patterns in the range of 20–30°, indicating similar graphiticity among the catalysts.46 This result was substantiated by the Nyquist plots of Ni–N/C_Y_H2O catalysts obtained by EIS analysis (Fig. S8†), which showed that all catalysts have similar charge transfer resistances. The XANES and EXAFS analyses of Ni–N/C_Y_H2O catalysts (Fig. 6b and c) further confirmed this trend. The XANES spectrum of Ni–N/C_1_H2O showed peak E (8382 eV) found in the Ni foil; however, this peak was not observed for Ni–N/C_2_H2O and Ni–N/C_3_H2O. The RDFs from the Fourier-transformed EXAFS spectra of Ni–N/C_Y_H2O catalysts commonly showed the Ni–N peak. The Ni–N/C_1_H2O catalyst additionally exhibited the Ni–Ni peak, whereas the other catalysts were free of this peak. The N2 adsorption–desorption isotherms and the corresponding pore size distribution curves (Fig. S9 and Table S3†) and elemental analysis data (Table S4†) indicated that the Ni–N/C_Y_H2O catalysts have similar textural properties and contents of the respective elements. These results collectively suggest that the physical properties of Ni–N/C_Y_H2O catalysts are similar. A notable difference is that while Ni–N/C_2_H2O and Ni–N/C_3_H2O contained only Ni–Nx sites, Ni–N/C_1_H2O had both Ni–Nx sites and Ni particles.
Fig. 6. (a) XRD patterns of Ni–N/C_Y_H2O catalysts. (b) Ni K-edge XANES spectra and their enlarged spectra in the peak E region and (c) EXAFS spectra of Ni–N/C_Y_H2O catalysts, Ni foil, NiPc, and NiPhen3. HAADF-STEM images of (d) Ni–N/C_2_H2O and (e) Ni–N/C_3_H2O catalysts.
We then analyzed the structural and electronic properties of Ni–Nx sites in Ni–N/C_2_H2O and Ni–N/C_3_H2O. The high-angle annular dark-field STEM (HAADF-STEM) images of Ni–N/C_2_H2O and Ni–N/C_3_H2O (Fig. 6d and e) show very small white dots corresponding to Ni single sites. Their Ni 2p X-ray photoelectron spectroscopy (XPS) spectra (Fig. S10†) showed doublet peaks and satellites of 2p3/2 and 2p1/2, which correspond to the oxidation state of +2. The N 1s XPS spectra of the two catalysts (Fig. S11†) were deconvoluted into five peaks with pyridinic N (398.3 eV), N coordinated with a Ni atom (Ni–Nx; 399.2 eV), pyrrolic N (400.3 eV), graphitic N (401.5 eV), and nitrogen oxide species (N+–O−; 403.0 eV). The Ni–N/C_2_H2O and Ni–N/C_3_H2O contained similar ratios of Ni–Nx species, whereas the proportions of the other N species differed slightly.
We next delve into the structures of Ni–N/C_2_H2O and Ni–N/C_3_H2O catalysts by scrutinizing their XANES and EXAFS spectra (Fig. 6b,c). Ni–N/C_2_H2O and Ni–N/C_3_H2O exhibited XANES spectra similar to that of NiPc, indicating their oxidation state around +2, in accordance with the XPS results. The geometric structures of Ni–N/C_2_H2O and Ni–N/C_3_H2O can be informed by the pre-edge A and B peaks and the post-edge C and D peaks in the XANES spectra (Fig. 6b).52,53 The XANES spectrum of NiPc presented a highly intense peak B, along with a very weak peak A, suggesting the dominance of square-planar symmetry. The Ni–N/C_Y_H2O catalysts exhibited a much lower intensity for peak B, suggesting that they lost the square planar symmetry. The intensity ratios of post-edge C and D peaks also corroborate this trend. The NiPc reference showed a higher peak D intensity than peak C, which is characteristic of a square planar Ni–Nx structure. Conversely, Ni–N/C_2_H2O and Ni–N/C_3_H2O exhibited lower relative intensities of peak D than those of peak C, suggesting the formation of an off-centered square planar Ni–Nx structure. As Ni–N/C_2_H2O showed a lower intensity ratio of peak D to peak C than Ni–N/C_3_H2O, the Ni–N/C_2_H2O is comparatively more off-centered, which is consistent with the relative intensity ratios in the pre-edge region. The XANES data were reinforced by EXAFS spectra curve fitting of Ni–N/C_2_H2O and Ni–N/C_3_H2O (Fig. 6c, S12 and Table S5†) with the proposed model structure (Fig. S13†). The Ni–N coordination numbers of Ni–N/C_2_H2O and Ni–N/C_3_H2O are 4.1 and 3.9, respectively, which means that their first coordination structures are close to the Ni–N4 structure. The Ni–N bond length of Ni–N/C_2_H2O (1.88 Å) is longer than that of Ni–N/C_3_H2O (1.82 Å), indicating more pronounced distortion of Ni2+–N4 structure in Ni–N/C_2_H2O than in Ni–N/C_3_H2O.
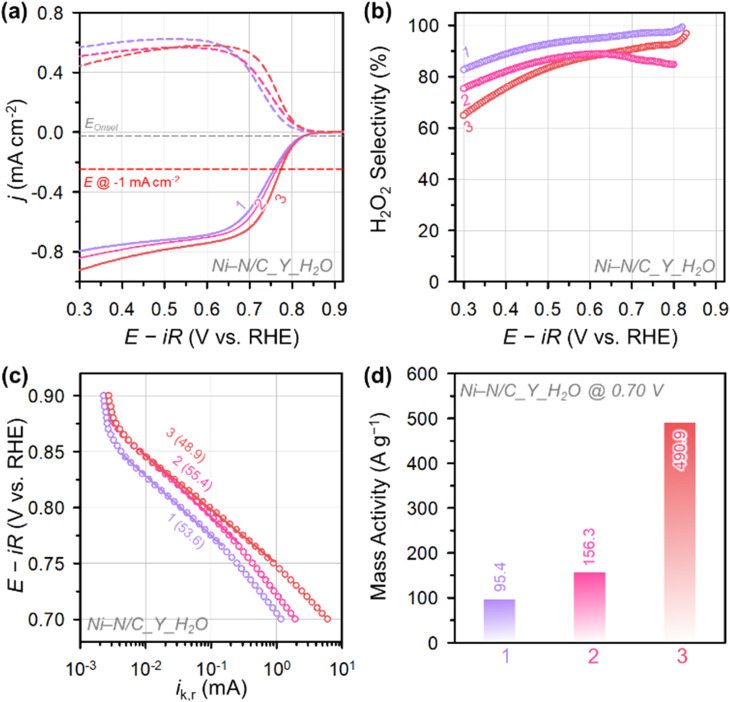
We next explored the electrocatalytic 2e− ORR activity and selectivity of Ni–N/C_Y_H2O catalysts in 0.1 M KOH. Their LSV curves (Fig. 7a) indicated that Ni–N/C_3_H2O had the highest 2e− ORR activity among the compared catalysts. The potential of Ni–N/C_3_H2O driving a current density of −1 mA cm−2 was 0.77 V, which is higher than Ni–N/C_2_H2O (0.75 V) and Ni–N/C_1_H2O (0.74 V). The comparison of 2e− ORR activity of Ni–N/C_1_H2O and Ni–N/C_2_H2O confirmed the superior activity of off-centered Ni2+–N4 sites to Ni particles (see the previous section). In addition, the activity comparison between Ni–N/C_2_H2O and Ni–N/C_3_H2O catalysts revealed that the degree of distortion from the square planar structure can tune the activity of 2e− ORR. The impact of the presence of Ni particles and the extent of distortion from the square planar structure were also reflected in the H2O2 selectivity and HPR activity. Ni–N/C_1_H2O exhibited the highest H2O2 selectivity (82–97%) in all potential regions, followed by Ni–N/C_2_H2O (76–88%) and Ni–N/C_3_H2O (62–92%) (Fig. 7b). Ni–N/C_3_H2O showed the highest HPR activity, followed by Ni–N/C_2_H2O and Ni–N/C_1_H2O (Fig. S14†).
Fig. 7. (a) ORR polarization curves of Ni–N/C_Y_H2O catalysts measured in O2-saturated 0.1 M KOH and (b) the corresponding H2O2 selectivity. (c) Tafel plots for the Ni–N/C_Y_H2O catalysts. The numbers in the parentheses represent the Tafel slopes (in mV dec−1). (d) Mass activity of Ni–N/C_Y_H2O catalysts at 0.70 V.
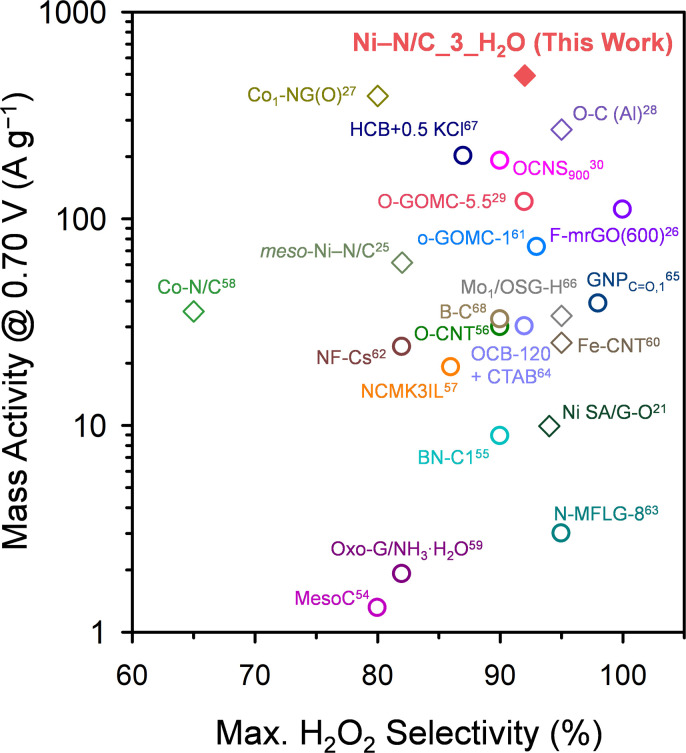
Tafel analyses of the Ni–N/C_Y_H2O catalysts (Fig. 7c) revealed the best 2e− ORR kinetics of Ni–N/C_3_H2O with the lowest Tafel slope (48.9 mV dec−1), which is followed by Ni–N/C_1_H2O (53.6 mV dec−1) and Ni–N/C_2_H2O (55.4 mV dec−1). The Tafel analysis results indicate that the 2e− ORR kinetics of off-centered square planar Ni2+–N4 sites are faster than those of Ni particles, and excessive off-centered square planar Ni2+–N4 sites can impede the 2e− ORR kinetics. The MA at 0.70 V of Ni–N/C_3_H2O (490.9 A g−1) is much greater than that of Ni–N/C_2_H2O (156.3 A g−1), and Ni–N/C_1_H2O (95.4 A g−1) (Fig. 7d). The MA and selectivity of the best-performing H2O2 electrosynthesis catalyst, Ni–N/C_3_H2O, were benchmarked with those of previously reported nonprecious metal ADCs and carbon-based catalysts (Fig. 8 and Table S6†).25–30,54–68 Ni–N/C_3_H2O shows the highest MA at 0.70 V (490.9 A g−1) with excellent maximum H2O2 selectivity (92%) for electrochemical H2O2 production, suggesting that Ni–N/C_3_H2O is one of the best-performing H2O2 electrosynthesis catalysts.
Fig. 8. Benchmarking the H2O2 production mass activity (at 0.70 V) and maximum H2O2 selectivity (%) of Ni–N/C_3_H2O catalyst with those of previously reported nonprecious metal ADCs and carbon-based catalysts. The diamonds and circles represent nonprecious metal ADCs and carbon-based catalysts, respectively. The numbers denote the corresponding reference. The corresponding numerical data are presented in Table S6 in the ESI.†.
Turnover frequency calculations
We next calculated the activity of Ni–N/C_3_H2O in terms of TOF. For the calculation of TOFs, precise identification of active sites is crucial. While we considered the off-centered Ni2+–N4 species as the major active sites, other chemical species can also contribute to H2O2 production. Indeed, the FT-IR analysis of Ni–N/C_3_H2O (Fig. S15†) revealed the presence of carbonyl (C O) group, which is known to have high 2e− ORR activity under alkaline conditions.29,30 We then tried to identify the major active site in Ni–N/C_3_H2O by in situ potential-dependent attenuated total reflectance surface-enhanced infrared absorption spectroscopy (ATR-SEIRAS) (Fig. S16†). In situ ATR-SEIRAS spectra taken under ORR conditions (Fig. S16a†) showed a peak of superoxide (O2−) intermediate at 1030 cm−1 (ref. 69 and 70) from 0.7 to 0.2 V. The O2− species can be adsorbed on the off-centered Ni2+–N4 site or the vicinity of C O group. We attempted to separate the potential at which O2− intermediate begins to adsorb to each site by measuring ATR-SEIRAS (Fig. S16b†) and cyclic voltammogram (CV) (Fig. S17†) in Ar conditions. We found that the redox reaction of the C O group appears at 0.45–0.5 V.71–73 Considering that the H2O2 production and C O redox reaction take place simultaneously under the same potential region in the presence of O2, O2− begins to adsorb on the C O group from 0.5 V (Fig. S16a†). These results indicate that the off-centered Ni2+–N4 site starts to adsorb O2− from 0.7 V under ORR conditions (Fig. S16a†), which proves that off-centered Ni2+–N4 site is the major active site.
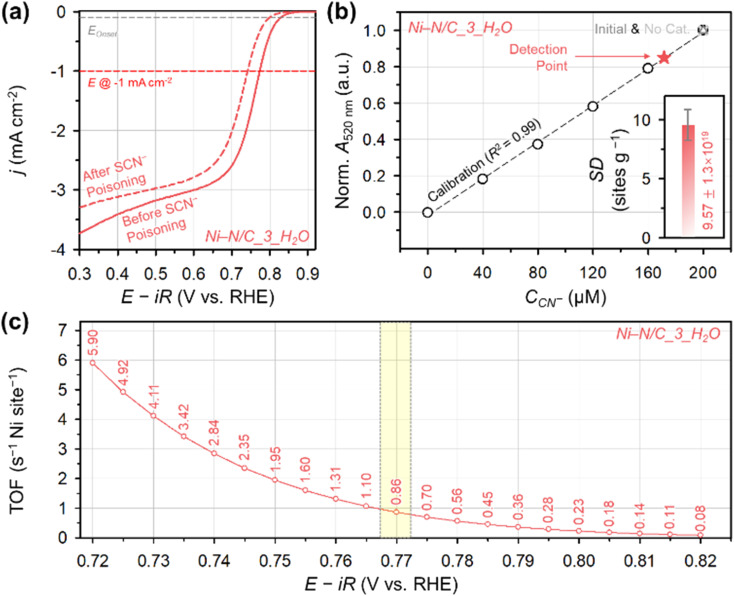
We confirmed the catalytic role of off-centered Ni2+–N4 site for 2e− ORR by poisoning experiments (Fig. 9a). After soaking the Ni–N/C_3_H2O catalyst in 0.1 M KOH containing 10 mM of KSCN,74,75 the potential driving −1 mA cm−2 shifted negatively from 0.77 to 0.74 V confirming the catalytic role of off-centered Ni2+–N4 site. To quantify the total number of Ni2+–N4 sites on the surface of Ni–N/C_3_H2O, in situ method for site density (SD) quantification was performed by using cyanide (CN−) as a probe molecule.76 The SD value was calculated from the change in CN− concentration in the electrolyte (ΔCCN−) (Fig. 9b) and a relative decrease in ORR activity (Δj/jpristine) (Fig. S18†). The SD of Ni–N/C_3_H2O was calculated to be (9.57 ± 1.3) × 1019 sites per g. Under the assumption that the decreased activity solely results from blocking the off-centered Ni2+–N4 site by poisoning, the TOF of the off-centered Ni2+–N4 site on the Ni–N/C_3_H2O surface at 0.77 was 0.86 s−1 per Ni site (Fig. 9c).
Fig. 9. (a) ORR polarization curves of Ni–N/C_3_H2O catalyst before and after SCN− poisoning. (b) Determination of CCN− using a UV-vis spectrophotometer before and after CN− poisoning on Ni–N/C_3_H2O catalyst surface. (Inset) the SD value of Ni–N/C_3_H2O catalyst. (c) TOF for H2O2 production of Ni–N/C_3_H2O catalyst per Ni single site.
Stability
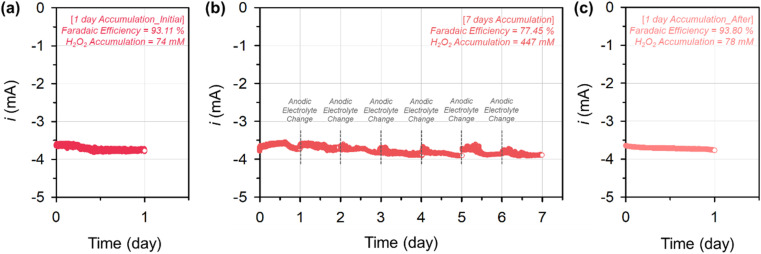
Finally, we examined the bulk H2O2 electrosynthesis stability of Ni–N/C_3_H2O catalyst in an H-type electrochemical cell (Fig. 10). A carbon paper coated with the catalyst and Pt gauze were used as the working and counter electrodes, respectively, and they were separated using a Nafion 117 membrane to prevent the decomposition of the produced H2O2 at the counter electrode. The stability of Ni–N/C_3_H2O was investigated at a constant potential of 0.6 V for 9 d. The used electrolyte was subjected to iodometric titration to quantify the produced H2O2 for calculating the H2O2 FE and H2O2 accumulation. First, the bulk electrosynthesis of H2O2 using Ni–N/C_3_H2O was performed for 1 d (Fig. 10a). The Ni–N/C_3_H2O exhibited a high H2O2 FE of 93.1%, accumulating 74 mM H2O2. After exchanging the electrolytes in both electrodes with fresh ones, the same experiment was performed for 7 d without exchanging the cathodic electrolyte while the anodic electrolyte was replenished every day (Fig. 10b). After one week of H2O2 electrosynthesis, the FE of Ni–N/C_3_H2O decreased to 77.5%, with an accumulated H2O2 concentration of 447 mM. We assumed that the 15.6% H2O2 FE decrement originated from the combination of support oxidation, HPR, and H2O2 disproportionation.10 To decouple the contribution of each factor, the total current of Ni–N/C_3_H2O was measured in an O2-saturated electrolyte with the 7 day electrochemically accumulated H2O2 (0.1 M KOH + 447 mM H2O2), and a value of approximately −3.9 mA was obtained. The contribution of support oxidation was calculated by measuring the non-faradaic current of Ni–N/C_3_H2O in an N2-saturated fresh electrolyte before and after the 7 day bulk H2O2 electrosynthesis. The non-faradaic current increased from −1.6 × 10⁻⁴ mA to −3.6 × 10⁻² mA after the electrosynthesis. The HPR of Ni–N/C_3_H2O, measured in an N2-saturated electrolyte with the 7 day electrochemically accumulated H2O2 (0.1 M KOH + 447 mM H2O2), was approximately −0.2 mA (Fig. S19†). Based on these results, in 0.1 M KOH electrolyte with 447 mM H2O2, about 0.9, 5.1, and 9.6% H2O2 FE decrements were affected by support oxidation, HPR, and H2O2 disproportionation, respectively. To evaluate the stability of Ni–N/C_3_H2O, bulk H2O2 electrosynthesis of the above-tested electrode was performed in a fresh electrolyte for 1 d (Fig. 10c). Ni–N/C_3_H2O exhibited similar H2O2 FE and H2O2 accumulation (93.8% H2O2 FE and 78 mM H2O2), revealing the high stability of Ni–N/C_3_H2O during H2O2 electrosynthesis.
Fig. 10. Bulk H2O2 electrosynthesis stability of Ni–N/C_3_H2O catalyst tested in an H-type electrochemical cell at a constant potential of 0.6 V for 9 d: (a) Fresh Ni–N/C_3_H2O-coated electrode for 1 d, (b) after replenishing both electrolytes, the one-day-tested Ni–N/C_3_H2O-coated electrode for 7 d without exchanging the cathodic electrolyte while replenishing the anodic electrolyte every day, and (c) after replenishing both electrolytes, the eight-day-tested Ni–N/C_3_H2O-coated electrode for 1 d.
Conclusions
We have explored the preparation chemistry of Ni ADCs for designing high-performance H2O2 electrosynthesis catalysts. We found that the use of a precoordinated precursor can generate dense active Ni–Nx sites and that the pyrolysis within a confined nanospace can produce carbon in high yield. A series of model catalysts containing different ratios of Ni–Nx and Ni nanoparticle sites indicated that the Ni–Nx sites have higher 2e− ORR activity. Another set of model catalysts revealed that a subtle difference in distortion degree plays a role in changing 2e− ORR activity. Importantly, the optimized Ni–N/C_3_H2O catalyst exhibited the highest H2O2 MA among the reported nonprecious metal ADCs and carbon-based catalysts. The KSCN poisoning in combination with ATR-SEIRAS experiments revealed that the Ni–Nx is the most plausible active site in the Ni–N/C_3_H2O catalyst and the TOF of the active site was 0.86 s−1 per Ni site at 0.77 V. In addition, the Ni–N/C_3_H2O catalyst stably produced H2O2 over 9 d in alkaline condition. We believe that the insights gained from this work can be utilized for the design of Ni-based ADCs and can be extensively applied to other ADCs and cluster-type catalysts.
Experimental
Chemicals
Pluronic P123 (Mn ∼ 5800), tetraethyl orthosilicate (98%), 1,10-phenanthroline (99%), K3[Fe(CN)6] (99%), potassium cyanide (KCN, 99%), potassium thiocyanate (KSCN, 99%), H2SO4 (99.999%), KI (>99.5%), (NH4)6Mo7O24·4H2O (>99%), NH4NO3 (>99%), KOH (99.99%), NaOH (99.99%), methanol (>99.8%), HClO4 (70%), NaAuCl4·2H2O (99%), Na2SO3(>98%), Na2S2O3·5H2O (>99.5%), NH4Cl (>99.99%), HF (48%), and tetrazolium blue chloride solution were purchased from Sigma-Aldrich. HCl (35–37%), HNO3 (60%), ethanol (94.5%, EtOH), anhydrous ethanol, and HF (49%) were purchased from Samchun Chemicals. KNO3 (99%), standard 0.01 N Na2S2O3 solution, starch, and Ni(CH3COO)2·4H2O (NiAc2, 99%) were purchased from Alfa Aesar. A Nafion ionomer (D521, 5 wt% in isopropanol/H2O) was purchased from DuPont. H2O2 (35%) was purchased from Junsei Chemicals. p-Nitrobenzaldehyde solution was purchased from TCI. All chemicals were used as received without further purification. Deionized (DI) water was obtained using a Millipore Milli-Q system (18.2 MΩ). Argon (Ar, 99.999%), nitrogen (N2, 99.999%), hydrogen (H2, 99.999%), and oxygen (O2, 99.999%) gases were purchased from KOSEM and used as received without further purification.
Syntheses of Ni–N/C_3_X catalysts
SBA-15 mesoporous silica template was synthesized according to previously reported procedures, with some modifications.77,78 A series of Ni–N/C_3_X (X = type of solvent) catalysts were prepared in different coordinating solvents with a fixed 1,10-phenanthroline to NiAc2 molar ratio of 3.25 SBA-15 (1.0 g) and 1.0 g of a physical mixture of NiAc2 and 1,10-phenanthroline with 1 : 3 molar ratio were added to an agate mortar and mixed using a pestle for 5 min. A solvent with different vapor pressures (1.2 mL; acetone, EtOH, or H2O) was added to the above composite, mixed for 15 min, and dried at 60 °C for 6 h. The dried powder was heated to 800 °C at a ramping rate of 2 °C min−1 and maintained at this temperature for 3 h under a N2 flow (1 L min−1). The resulting composite was mixed with a solution containing EtOH and an aqueous solution of 4 M HF and 2 M HCl in a polypropylene (PP) bottle and stirred for 30 min to remove the SBA-15 template and large Ni particles. The slurry was filtered and washed with DI water and ethanol until the pH of the filtrate reached 7. The etching process was repeated in the same manner, and the filtered solid was dried at 60 °C. The final catalysts were denoted as Ni–N/C_3_Acetone, Ni–N/C_3_EtOH, and Ni–N/C_3_H2O. The sample prepared with the same procedure, except for the absence of a solvent during the coordination step, was designated as Ni–N/C_3_Dry.
Syntheses of Ni–N/C_Y_H2O catalysts
A series of Ni–N/C_Y_H2O (Y = 1,10-phenanthroline to NiAc2 molar ratio) catalysts was prepared in the same manner as Ni–N/C_3_H2O, except for the use of different 1,10-phenanthroline to NiAc2 molar ratio (Y = 1, 2, and 3).
Characterization methods
BF-STEM images were obtained using a JEM-2100F microscope (JEOL) operated at 200 kV. HAADF-STEM images were acquired using an FEI Titan3 G2 60-300 microscope equipped with a double-sided spherical aberration (Cs) corrector operating at an accelerated voltage of 200 kV. TGA and DTA spectra were obtained using a TGA 5500 analyzer (TA Instruments) in the temperature range of 25–800 °C at a ramping rate of 2 °C min−1 under N2 flow. XRD patterns were obtained using a high-power X-ray diffractometer (D/Max 2500V/PC, Rigaku) with a Cu Kα radiation source operated at 40 kV and 200 mA. The textural properties of the samples were analyzed using a BELSORP-Max N2 physisorption analyzer (MicrotracBEL). The samples were pre-evacuated at 150 °C and 10−2 Pa for 12 h before the measurements. The specific surface areas of the samples were calculated using the BET equation, and their pore size distributions were derived from the adsorption branches of the isotherms using the BJH method. FT-IR spectra were obtained using an FT-IR spectrometer (Thermo Fisher Scientific) in attenuated total reflection and transmittance modes. XPS spectra were collected using an ESCALAB 250XI spectrometer (Thermo Fisher Scientific) with a monochromated Al Kα (1486.6 eV) radiation source. For XPS measurements, each sample powder was pelletized into a self-supported wafer. XPS spectra were deconvoluted using XPSPeak41 software. Shirley-type background removal and mixed Gaussian–Lorentzian (70 : 30) functions were used for deconvolution. The C, H, N, and O contents of the samples were determined using an elemental analyzer (Flash 2000, Thermo Fisher Scientific) based on the dynamic flash combustion method. The metal contents of the catalysts were quantified using an ICP-OES analyzer (700-ES, Varian). For the ICP-OES analysis, a microwave digestion system (Mars 6, CEM) was used to completely dissolve the metal in aqua regia at 220 °C for 30 min (600 W, ramping rate = 6.5 °C min−1). The Ni K-edge XANES and EXAFS spectra were recorded at RT at the 6D, 8C, and 10C beamlines of the Pohang Accelerator Laboratory (PAL). The storage ring was operated at 3.0 GeV with a beam current of 300 mA in decay mode. The beamline was equipped with a focusing Si (111) double-crystal monochromator to filter the incident photons. To remove high-order harmonics, the incident X-rays were detuned by 70%. All XAS data were calibrated using Ni foils. X-ray intensities were monitored using standard N2-filled ion chambers and an Ar-filled detector. The catalyst powder was pelletized in a sample holder (1 cm width) to an appropriate thickness to obtain a reasonable transmission signal. Athena software was used for background removal and normalization of the XAS data with an Rbkg of 1.1 and a Hanning-type window. Artemis software was used for fitting the EXAFS data. The passive electron reduction factor (S02) was obtained by fitting the Ni foil EXAFS data (Fig. S20†). The CN− concentration values were obtained using an UV-vis spectrophotometer (Genesis 400, Thermo Fisher Scientific).
Electrochemical measurements
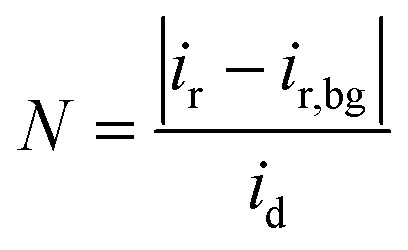
Electrochemical measurements were performed at RT using a bipotentiostat (CHI760E, CH Instruments). A three-electrode cell was constructed using a catalyst-coated RRDE (AFE7R9GCPT, Pine Research Instrumentation) as the working electrode, a graphite rod as the counter electrode, and an Hg/HgO (CHI152, CH Instruments) as the reference electrode. Before each measurement, the RRDE was polished on a microcloth using an aqueous 1.0 μm alumina suspension followed by a 0.3 μm suspension to obtain a mirror finish, and then ultrasonicated in DI water. The catalyst ink was prepared by mixing an appropriate amount of the catalyst, DI water, Nafion, and anhydrous EtOH (with a fixed ratio of catalyst to Nafion) followed by ultrasonication for 30 min. An aliquot (8 μL) of the catalyst ink was pipetted and dropped onto the glassy carbon (GC) disk (0.247 cm2) of the RRDE and dried at 60 °C to obtain a target catalyst loading of 50 μg cm−2. Before measurements, the catalyst on the GC disk was electrochemically cleaned by potential cycling between 0.05 and 1.20 V for 20 cycles at a scan rate of 100 mV s−1 in an N2-saturated electrolyte. CV was then performed in the same potential range for three cycles at a scan rate of 20 mV s−1. Next, the Pt ring was electrochemically cleaned in the same potential range for 50 cycles at a scan rate of 500 mV s−1. To remove the uncompensated ohmic potential from the solution resistance and measure the charge transfer resistance, EIS measurements were conducted at 0.6 V from 100 000 to 0.1 Hz. ORR polarization curves were measured by LSV from 1.1 to 0.3 V at a scan rate of 5 mV s−1 in an O2-saturated electrolyte at an electrode rotation speed of 1600 rpm, while the potential of the Pt ring was fixed at 1.3 V. To correct the non-faradaic current (inF) in the LSV curve, the same LSV measurement was conducted in an N2-saturated condition. After the above measurements, the RRDE with the loaded catalyst was rinsed with a copious amount of DI water and 0.5 M KNO3 and immersed in N2-saturated 0.5 M KNO3 + 2 mM K3[Fe(CN)6] to measure the collection efficiency (N) of the RRDE coated with each catalyst. Chronoamperometry was performed at −0.2 V (vs. Ag/AgCl), with the ring potential fixed at 0.5 V (vs. Ag/AgCl) for 100 s. The background ring current was measured in the same chronoamperometry protocol, but the applied disk potential was set at 0.5 V (vs. Ag/AgCl). The N value was calculated using eqn (1).
 |
1 |
where ir, id, and ir,bg denote the ring, disk, and background ring currents, respectively. The N value provided by the provider was 0.37. Using the measured N value (Fig. S21†), the H2O2 selectivity was calculated using the ORR LSV data from eqn (2).
 |
2 |
where inF denotes the non-faradaic background disk current.
The potential was converted to the RHE scale using the following steps: a two-electrode cell was constructed using a Pt coil and the desired reference electrode in an electrolyte with continuous H2 bubbling. H+/H2 equilibrium was established at the Pt coil, which thus acted as the RHE. A stable open-circuit voltage, the potential difference between the RHE and the reference electrode, was obtained within 30 min and used as the conversion value.
Tafel plots were generated according to eqn (3).
| E = C + b × log(ik,r) | 3 |
where E, C, b, and ik,r are an applied potential, constant, Tafel slope, and kinetic current for H2O2 production, respectively. The ik,r value was obtained by correcting for the mass-transport effect according to eqn (4).
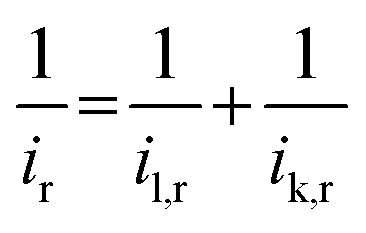 |
4 |
where il,r is the diffusion-limited current for H2O2 production. The ir value was obtained by dividing the ring current by the N. The il,r value was taken from the highest value in the ir/N plot measured over the entire potential range investigated (0.3–1.1 V).
HPR experiments were conducted using LSV measurements from 1.0 to 0.3 V. The inF was obtained at a scan rate of 5 mV s−1 at an electrode rotation speed of 1600 rpm in an N2-saturated 0.1 M KOH electrolyte, and the H2O2 reduction current was measured at the same condition after adding 10 mM of H2O2 to the 0.1 M KOH electrolyte.
All electrochemical measurements were performed at least three times, and the average values were used.
In situ ATR-SEIRAS measurement
For the generation of SEIRAS effect, a thin Au film (ca. 60 nm) was deposited on the p-type Si(100) wafer (iTASCO) with slight modification.72 Briefly, Si wafer was polished 1.0 μm diamond suspension and sonicated in 1 : 1 : 1 volume ratio mixture of acetone, ethanol, and DI water for 1 minute. Subsequently, it was immersed in 40% NH4F for 2 min to remove the native oxide layer of the wafer. Bare Si wafer was covered in a 1 : 2 volume ratio mixture of an Au plating solution (0.015 M NaAuCl4·2H2O + 0.15 M Na2SO3 + 0.05 M Na2S2O3·5H2O + 0.05 M NH4Cl) and a 2 wt% HF solution at 70 °C for 3 min. After the reaction, the plane was cleaned thoroughly with the DI water.
Ni–N/C_3_H2O was sprayed on the Au/Si wafer (working electrode), and it was loaded on the ZnSe crystal (20 mm in diameter, VeeMAX). A Pt wire and an Ag/AgCl electrode (saturated 3 M NaCl) were employed as the counter and reference electrode, respectively. After assembling the home-made one pot cell, it was transferred to the FT-IR (VERTEX 80v, Bruker) equipped a mercury cadmium telluride (MCT) detector and ATR accessory (VeeMAX III, PIKE Technologies). All spectra were obtained with a 4 cm−1 spectral resolution and 16 scans. The reference spectrum was obtained at OCP in fully O2 (Ar) saturated 0.1 M KOH solution, and spectra were presented in absorbance.
TOF calculation
To calculate the intrinsic activity of the Ni active species, the TOF, which represents the reaction rate per active site per unit time, was calculated using eqn (5).
 |
5 |
where jk,Ni, S, qe, m, and SD denote the disk kinetic current density of Ni sites, RRDE disk area (0.247 cm2), electron charge (1.602 × 10⁻¹⁹ A s), catalyst loading (1.235 × 10⁻⁵ g), and active site density, respectively.
To obtain the jk,Ni value, SCN− poisoning experiment were performed in a 0.1 M KOH electrolyte containing 10 mM KSCN. The same ORR measurement protocol was performed without Pt ring current measurement (the SCN− ions poisoned the Pt ring, making the ring current value unreliable). The jk,Ni value was calculated from eqn (6).
| jk,Ni (A cm−2) = jk,d (A cm−2) − jk,d_SCN (A cm−2) | 6 |
where jk,d, and jk,d_SCN denote the kinetic current densities of the disk before and after poisoning, respectively.
To obtain the SD value, CN− poisoning experiment were performed based on previous reports.76 The SD value was calculated from the change in CN− concentration in electrolyte (ΔCCN−) and relative decrease in ORR activity (Δj/jpristine), whose relationship can be represented by eqn (7).
 |
7 |
where V, NA, and mcat denote the electrolyte volume (40 mL), Avogadro's number, and catalyst amount (3 × 10⁻² g) respectively.
Bulk electrolysis measurements
Bulk electrolysis was performed with Ni–N/C_3_H2O using an H-type electrochemical cell to evaluate the long-term stability and FE. The catalyst ink (32 μL) was deposited on each side of the carbon paper electrode (TGP-H-60, Toray, 1 cm × 1 cm). An H-type electrochemical cell was constructed in which each compartment of the H-cell was separated by a Nafion 117 membrane (DuPont), which was pretreated with 5% H2O2 at 80 °C for 1 h. Chronoamperometry was performed at 0.6 V in an O2-saturated condition. The tested electrolyte (1 mL) was subjected to iodometric titration to calculate the bulk H2O2 FE and H2O2 accumulation in the 0.1 M KOH electrolyte.
Iodometric titration
Iodometric titration was conducted to measure the amount of generated H2O2 in the electrolyte after bulk electrolysis. After the chronoamperometry test, the working compartment electrolyte was purged with copious amounts of N2 gas. The analyte (1.0 mL) and 1 M H2SO4 (2.0 mL) were added to a 20 mL glass vial. Subsequently, 2.0 mL of 2% KI and 500 μL of molybdate solution (9.0 g of (NH4)6Mo7O24·4H2O, 24 g of NH4NO3, and 3 mL of ammonia solution dissolved in 100 mL DI water) were added and the color of the solution rapidly turned yellow-orange, which indicated the generation of I2 according to reaction (8).
| H2O2 + 2KI + 2H+ → I2 + 2K+ + 2H2O | 8 |
I2 was titrated with a standardized 0.01 N Na2S2O3 solution immediately according to reaction (9).
| 2S2O32− + I2 → S4O62− + 2I− | 9 |
When the yellow color turned pale yellow, 50 μL of 1% starch indicator solution was added to the solution. The color of the solution changed to marine blue. The titration was completed using an additional Na2S2O3 solution. Finally, the amount of H2O2 (in moles) was calculated using the volume of Na2S2O3 solution (V(Na2S2O3)) used in the iodometric titration. The measurements were repeated three times and the average value calculated. The amount of generated H2O2 and the H2O2 FE can be calculated using eqn (10) and (11).
 |
10 |
 |
11 |
The theoretical amount of H2O2 (in moles) was calculated by chronoamperometry using eqn (12).
 |
12 |
where n and F denote the number of electrons transferred during H2O2 production (2) and Faraday constant, respectively.
Data availability
The data (catalyst characterization, elemental analysis, electrochemical characterization) supporting this Edge article are available within the article and ESI.†
Author contributions
J. S. Lim: conceptualization, data curation, formal analysis, investigation, methodology, visualization, validation, and writing – original draft. J. Woo: conceptualization and validation. G. Bae: conceptualization, formal analysis, data curation, and investigation. S. Yoo: data curation and investigation. J. Kim: data curation, and investigation. J. Kim: data curation and investigation. J. Lee: data curation and investigation. Y. J. Sa: data curation and writing – review & editing. J.-W. Jang: writing – review & editing. Y. J. Hwang: data curation and writing – review & editing. C. H. Choi: conceptualization, project administration, funding acquisition, and writing – review & editing. S. H. Joo: conceptualization, supervision, project administration, funding acquisition, and writing – review & editing.
Conflicts of interest
There are no conflicts to declare.
Supplementary Material
Acknowledgments
This work was supported by the National Research Foundation (NRF) of Korea funded by the Ministry of Science and ICT (NRF-2019M3D1A1079306, NRF-2021R1A2C2007495, RS-2024-00338176, and RS-2024-00415940 to S. H. Joo and NRF-2021R1A5A1030054 to C. H. Choi) and the New Faculty Startup Fund from Seoul National University. The XAS experiments performed at the 6D, 8C, and 10C beamlines of the Pohang Accelerator Laboratory (PAL) were supported in part by the Ministry of Education, POSTECH, and UCRF at UNIST.
Electronic supplementary information (ESI) available. See DOI: https://doi.org/10.1039/d4sc03105a
References
- Goor G. Ullmann's Encycl. Ind. Chem. 1992;9:13–43. [Google Scholar]
- Campos-Martin J. M. Blanco-Brieva G. Fierro J. L. G. Angew. Chem., Int. Ed. 2006;45:6962–6984. doi: 10.1002/anie.200503779. [DOI] [PubMed] [Google Scholar]
- Ciriminna R. Albanese L. Menequzzo F. Pagliaro M. ChemSusChem. 2016;9:3374–3381. doi: 10.1002/cssc.201600895. [DOI] [PubMed] [Google Scholar]
- Goor G. Glenneberg J. Jacobi S. Dadabhoy J. Candidio E. Ullmann's Encycl. Ind. Chem. 2019;355:1–40. [Google Scholar]
- Yang S. Verdaguer-Casadevall A. Arnarson L. Silvioli L. Čolić V. Frydendal R. Rossmeisl J. Chorkendorff I. Stephens I. E. L. ACS Catal. 2018;8:4064–4081. doi: 10.1021/acscatal.8b00217. [DOI] [Google Scholar]
- Perry S. C. Pangotra D. Vieira L. Csepei L.-I. Siever V. Wang L. León C. P. Walsh F. C. Nat. Rev. Chem. 2019;3:442–458. doi: 10.1038/s41570-019-0110-6. [DOI] [Google Scholar]
- Jung E. Shin H. Hooch Antink W. Sung Y.-E. Hyeon T. ACS Energy Lett. 2020;5:1881–1892. doi: 10.1021/acsenergylett.0c00812. [DOI] [Google Scholar]
- Kim J. H. Kim Y.-T. Joo S. H. Curr. Opin. Electrochem. 2020;21:109–116. doi: 10.1016/j.coelec.2020.01.007. [DOI] [Google Scholar]
- Jiang K. Zhao J. Wang H. Adv. Funct. Mater. 2020;30:2003321. doi: 10.1002/adfm.202003321. [DOI] [Google Scholar]
- Lim J. S. Sa Y. J. Joo S. H. Cell Rep. Phys. Sci. 2022;3:100987. doi: 10.1016/j.xcrp.2022.100987. [DOI] [Google Scholar]
- Baek D. S. Joo S. H. Bull. Korean Chem. Soc. 2022;43:1156–1168. doi: 10.1002/bkcs.12607. [DOI] [Google Scholar]
- Kim J. H. Sa Y. J. Lim T. Woo J. Joo S. H. Acc. Chem. Res. 2022;55:2672–2684. doi: 10.1021/acs.accounts.2c00409. [DOI] [PubMed] [Google Scholar]
- Kim J. H. Joo S. H. Bull. Korean Chem. Soc. 2024;45:350–358. doi: 10.1002/bkcs.12830. [DOI] [Google Scholar]
- Yamanaka I. Onizawa T. Suzuki H. Hanaizumi N. Nishimura N. Takenaka S. J. Phys. Chem. C. 2012;116:4572–4583. doi: 10.1021/jp207679e. [DOI] [Google Scholar]
- Hooe S. L. Rheingold A. L. Machan C. W. J. Am. Chem. Soc. 2018;140:3232–3241. doi: 10.1021/jacs.7b09027. [DOI] [PubMed] [Google Scholar]
- Dijk B. Kinders R. Ferber T. H. Hofmann J. P. Hetterscheid D. G. H. ChemElectroChem. 2022;9:e202101692. doi: 10.1002/celc.202101692. [DOI] [PMC free article] [PubMed] [Google Scholar]
- Lambeth J. D. Nat. Rev. Immunol. 2004;4:181–189. doi: 10.1038/nri1312. [DOI] [PubMed] [Google Scholar]
- Barondeau D. P. Kassmann C. J. Bruns C. K. Tainer J. A. Getzoff E. D. Biochemistry. 2004;43:8038–8047. doi: 10.1021/bi0496081. [DOI] [PubMed] [Google Scholar]
- Liu C. Li H. Liu F. Chen J. Yu Z. Yuan Z. Wang C. Zheng H. Henkelman G. Wei L. Chen Y. J. Am. Chem. Soc. 2020;142:21861–21871. doi: 10.1021/jacs.0c10636. [DOI] [PubMed] [Google Scholar]
- Wang Y. Shi R. Shang L. Waterhouse G. I. N. Zhao J. Zhang Q. Gu L. Zhang T. Angew. Chem., Int. Ed. 2020;59:13057–13062. doi: 10.1002/anie.202004841. [DOI] [PubMed] [Google Scholar]
- Song X. Li N. Zhang H. Wang L. Yan Y. Wang H. Wang L. Bian Z. ACS Appl. Mater. Interfaces. 2020;12:17519–17527. doi: 10.1021/acsami.0c01278. [DOI] [PubMed] [Google Scholar]
- Wang M. Dong X. Meng Z. Hu Z. Lin Y.-G. Peng C.-K. Wang H. Pao C.-W. Ding S. Li Y. Shao Q. Huang X. Angew. Chem., Int. Ed. 2021;60:11190–11195. doi: 10.1002/anie.202100897. [DOI] [PubMed] [Google Scholar]
- Huang S. Zhang B. Sun H. Hu H. Wang J. Duan F. Zhu H. Du M. Lu S. Chem. Commun. 2023;59:10424–10427. doi: 10.1039/D3CC02948D. [DOI] [PubMed] [Google Scholar]
- Yue B. Lei Y. Xie H. Si Y. Yang Q. Liu X. ACS Appl. Mater. Interfaces. 2023;15:33665–33674. doi: 10.1021/acsami.3c06259. [DOI] [PubMed] [Google Scholar]
- Lim J. S. Kim J. Lee K.-S. Sa Y. J. Joo S. H. Electrochim. Acta. 2023;444:142031. doi: 10.1016/j.electacta.2023.142031. [DOI] [Google Scholar]
- Kim H. W. Ross M. B. Kornienko N. Zhang L. Guo J. Yang P. McCloskey B. D. Nat. Catal. 2018;1:282–290. doi: 10.1038/s41929-018-0044-2. [DOI] [Google Scholar]
- Jung E. Shin H. Lee B.-H. Efremov V. Lee S. Lee H. S. Kim J. Antink W. H. Park S. Lee K.-S. Cho S.-P. Yoo J. S. Sung Y.-E. Hyeon T. Nat. Mater. 2020;19:436–442. doi: 10.1038/s41563-019-0571-5. [DOI] [PubMed] [Google Scholar]
- Yang Q. Xu W. Gong S. Zheng G. Tian Z. Wen Y. Peng L. Zhang L. Lu Z. Chen L. Nat. Commun. 2020;11:5478. doi: 10.1038/s41467-020-19309-4. [DOI] [PMC free article] [PubMed] [Google Scholar]
- Lim J. S. Kim J. H. Baek D. S. Ihm K. Shin T. J. Sa Y. J. Joo S. H. Chem. 2021;19:436–442. [Google Scholar]
- Chen S. Luo T. Chen K. Lin Y. Fu J. Liu K. Cai C. Wang Q. Li H. Li X. Hu J. Li H. Zhu M. Li M. Angew. Chem., Int. Ed. 2021;60:16607–16614. doi: 10.1002/anie.202104480. [DOI] [PubMed] [Google Scholar]
- Morozan A. Goellner V. Nedellec Y. Hannauer J. Jaouen F. J. Electrochem. Soc. 2015;162:H719–H726. doi: 10.1149/2.0051511jes. [DOI] [Google Scholar]
- Xia C. Qiu Y. Xia Y. Zhu P. King G. Zheng X. Wu Z. Kim J. Y. Cullen D. A. Zheng D. Li P. Shakouri M. Heredia E. Cui P. Alshareef H. N. Hu Y. Nat. Chem. 2021;13:887–894. doi: 10.1038/s41557-021-00734-x. [DOI] [PubMed] [Google Scholar]
- Shahcheraghi L. Zhang C. Lee H.-J. Cusack-Striepe M. Ismail F. Abdellah A. Higgins D. C. J. Phys. Chem. C. 2021;125:15830–15840. doi: 10.1021/acs.jpcc.1c03775. [DOI] [Google Scholar]
- Wu Y. Ma H. Feng Y. Shi Z. Yi Y. Ding Y. Feng J. Zhao W. Sun J. Dong S. Sun J. ACS Appl. Mater. Interfaces. 2022;14:26803–26813. doi: 10.1021/acsami.2c05622. [DOI] [Google Scholar]
- Zheng T. Jiang K. Ta N. Hu Y. Zeng J. Liu J. Wang H. Joule. 2019;3:265–278. doi: 10.1016/j.joule.2018.10.015. [DOI] [Google Scholar]
- Abbas S. A. Song J. T. Tan Y. C. Nam K. M. Oh J. Jung K.-D. ACS Appl. Energy Mater. 2020;3:8739–8745. doi: 10.1021/acsaem.0c01283. [DOI] [Google Scholar]
- Guo Y. Yao S. Xue Y. Hu X. Cui H. Zhou Z. Appl. Catal., B. 2022;304:120997. doi: 10.1016/j.apcatb.2021.120997. [DOI] [Google Scholar]
- Ma D. Lian Q. Zhang Y. Huang Y. Guan X. Liang Q. He C. Xia D. Liu S. Yu J. Nat. Commun. 2023;14:7011. doi: 10.1038/s41467-023-42853-8. [DOI] [PMC free article] [PubMed] [Google Scholar]
- Jesus J. C. González I. Quevedo A. Puerta T. J. Mol. Catal. A: Chem. 2005;228:283–291. doi: 10.1016/j.molcata.2004.09.065. [DOI] [Google Scholar]
- Pisiewicz S. Formenti D. Surkus A.-E. Pohl M.-M. Radnik J. Junge K. Topf C. Bachmann S. Scalone M. Beller M. ChemCatChem. 2016;8:129–134. doi: 10.1002/cctc.201500848. [DOI] [Google Scholar]
- Elshafie H. S. Sadeek S. A. Camele I. Awad H. M. Mohamed A. A. Molecules. 2020;25:1027. doi: 10.3390/molecules25051027. [DOI] [PMC free article] [PubMed] [Google Scholar]
- Alramadhan S. A. Hammud H. H. Ali B. F. Ghabbour H. A. Sarfaraz S. Ayub K. Crystals. 2023;13:738. doi: 10.3390/cryst13050738. [DOI] [Google Scholar]
- Grommet A. B. Feller M. Klajn R. Nat. Nanotechnol. 2020;15:256–271. doi: 10.1038/s41565-020-0652-2. [DOI] [PubMed] [Google Scholar]
- Woo J. Lim J. S. Lim T. Baek D. S. Kim J. H. Lee J. H. Jeong H. Y. Choi C. H. Joo S. H. EES Catal. 2023;1:62–73. doi: 10.1039/D2EY00055E. [DOI] [Google Scholar]
- Debalke A. Kassa A. Asmellach T. Beyene Y. Amare M. Tigineh G. T. Abebe A. Heliyon. 2022;8:e11199. doi: 10.1016/j.heliyon.2022.e11199. [DOI] [PMC free article] [PubMed] [Google Scholar]
- Walker Jr P. L. Rakszawski J. F. Armington A. F. ASTM Bull. 1955;208:52–54. [Google Scholar]
- Suk M. Chung M. W. Han M. H. Oh H.-S. Choi C. H. Catal. Today. 2021;359:99–105. doi: 10.1016/j.cattod.2019.05.034. [DOI] [Google Scholar]
- Shen H. Pan L. Thomas T. Wang J. Guo X. Zhu Y. Luo K. Guo H. Hutchings G. J. Attfield J. P. Yang M. Cell Rep. Phys. Sci. 2020;1:100255. doi: 10.1016/j.xcrp.2020.100255. [DOI] [Google Scholar]
- Ding L. P. McLean B. Xu Z. Kong X. Hedman D. Qiu L. Page A. J. Ding F. J. Am. Chem. Soc. 2022;144:5606–5613. doi: 10.1021/jacs.2c00879. [DOI] [PubMed] [Google Scholar]
- Zhang Z. Ding M. Cheng T. Qiao R. Zhao M. Luo M. Wang E. Sun Y. Zhang S. Li X. Zhang Z. Mao H. Liu F. Fu Y. Liu K. Zou D. Liu C. Wu M. Fan C. Zhu Q. Wang X. Gao P. Li Q. Liu K. Zhang Y. Bai X. Yu D. Ding F. Wang E. Liu K. Nat. Nanotechnol. 2022;17:1258–1264. doi: 10.1038/s41565-022-01230-0. [DOI] [PubMed] [Google Scholar]
- Baek D. S. Lee K. A. Park J. Kim J. H. Lee J. Lim J. S. Lee S. Y. Shin T. J. Jeong H. Y. Son J. S. Kang S. J. Kim J. Y. Joo S. H. Angew. Chem., Int. Ed. 2021;60:1441–1449. doi: 10.1002/anie.202012936. [DOI] [PubMed] [Google Scholar]
- Jia Q. Ramaswamy N. Hafiz H. Tylus U. Stickland K. W u G. Barbiellini B. Bansil A. Holby E. F. Zelenay P. Mukerjee S. ACS Nano. 2015;9:12496–12505. doi: 10.1021/acsnano.5b05984. [DOI] [PubMed] [Google Scholar]
- Sa Y. J. Jung H. Shin D. Jeong H. Y. Ringe S. Kim H. Hwang Y. J. Joo S. H. ACS Catal. 2020;10:10920–10931. doi: 10.1021/acscatal.0c02325. [DOI] [Google Scholar]
- Chen S. Chen Z. Siahrostami S. Kim T. R. Nordlund D. Sokaras D. Nowak S. To J. W. F. Sinclair R. Nørskov J. K. Jaramillo T. F. Bao Z. ACS Sustainable Chem. Eng. 2018;6:311–317. doi: 10.1021/acssuschemeng.7b02517. [DOI] [Google Scholar]
- Chen S. Chen Z. Siahrostami S. Higgins D. Nordlund D. Sokaras D. Kim T. R. Liu Y. Yan X. Nilsson E. Sinclair R. Nørskov J. K. Jaramillo T. F. Bao Z. J. Am. Chem. Soc. 2018;140:7851–7859. doi: 10.1021/jacs.8b02798. [DOI] [PubMed] [Google Scholar]
- Lu Z. Chen G. Siahrostami S. Chen Z. Liu K. Liao L. Wu T. Lin D. Liu Y. Jaramillo T. F. Nørskov J. K. Cui Y. Nat. Catal. 2018;1:156–162. doi: 10.1038/s41929-017-0017-x. [DOI] [Google Scholar]
- Sun Y. Sinev I. Ju W. Bergmann A. Dresp S. Kuhl S. Spöri C. Schmies H. Wang H. Bernsmeier D. Paul B. Schmack R. Kaehnert R. Roldan Cuenya B. Strasser P. ACS Catal. 2018;8:2844–2856. doi: 10.1021/acscatal.7b03464. [DOI] [Google Scholar]
- Sun Y. Silvioli I. L. Sahraie N. R. Ju W. Li J. Zitolo A. Li S. Bagger A. Arnarson L. Wang X. Moeller T. Bernsmeier D. Rossmeisl J. Jaouen F. Strasser P. J. Am. Chem. Soc. 2019;141:12372–12381. doi: 10.1021/jacs.9b05576. [DOI] [PubMed] [Google Scholar]
- Han L. Sun Y. Li S. Cheng C. Halbig C. E. Feicht P. Hübner J. L. Strasser P. Eigler S. ACS Catal. 2019;9:1283–1288. doi: 10.1021/acscatal.8b03734. [DOI] [Google Scholar]
- Jiang K. Baek S. Akey A. J. Xia C. Hu Y. Liang W. Schaak D. Stabitski E. Nørskov J. K. Siahrostami S. Wang H. Nat. Commun. 2019;10:3997. doi: 10.1038/s41467-019-11992-2. [DOI] [PMC free article] [PubMed] [Google Scholar]
- Sa Y. J. Kim J. H. Joo S. H. Angew. Chem., Int. Ed. 2019;58:1100–1105. doi: 10.1002/anie.201812435. [DOI] [PubMed] [Google Scholar]
- Wang W. Lu X. Su P. Li Y. Cai J. Zhang Q. Zhou M. Arotiba O. Chemosphere. 2020;259:127423. doi: 10.1016/j.chemosphere.2020.127423. [DOI] [PubMed] [Google Scholar]
- Li L. Tang C. Zheng Y. Xia B. Zhou X. Xu H. Qiao S.-Z. Adv. Energy Mater. 2020;10:2000789. doi: 10.1002/aenm.202000789. [DOI] [Google Scholar]
- Wu K.-H. Wang D. Lu X. Zhang X. Xie Z. Liu Y. Su B.-J. Chen J.-M. Su D.-S. Qi W. Guo S. Chem. 2020;6:1443–1458. [Google Scholar]
- Han G.-F. Li F. Zou W. Karamad M. Jeon J.-P. Kim S.-W. Kim S.-J. Bu Y. Fu Z. Liu Y. Siahrostami S. Baek J.-B. Nat. Commun. 2020;11:2209. doi: 10.1038/s41467-020-15782-z. [DOI] [PMC free article] [PubMed] [Google Scholar]
- Tang C. Jiao Y. Shi B. Liu J.-N. Xie Z. Chen X. Zhang Q. Qiao S.-Z. Angew. Chem., Int. Ed. 2020;59:9171–9176. doi: 10.1002/anie.202003842. [DOI] [PubMed] [Google Scholar]
- Lee J. Lim J. S. Yim G. Jang H. Joo S. H. Sa Y. J. ACS Appl. Mater. Interfaces. 2021;13:59904–59914. doi: 10.1021/acsami.1c17727. [DOI] [PubMed] [Google Scholar]
- Xia Y. Zhao X. Xia C. Wu Z.-Y. Zhu P. Kim J. Y. Bai X. Gao G. Hu Y. Zhong J. Liu Y. Wang H. Nat. Commun. 2021;12:4225. doi: 10.1038/s41467-021-24329-9. [DOI] [PMC free article] [PubMed] [Google Scholar]
- Shao M.-H. Liu P. Adzic R. R. J. Am. Chem. Soc. 2006;128:7408–7409. doi: 10.1021/ja061246s. [DOI] [PubMed] [Google Scholar]
- Briega-Martos V. Cheuquepán W. Feliu J. M. J. Phys. Chem. Lett. 2021;12:1588–1592. doi: 10.1021/acs.jpclett.0c03510. [DOI] [PMC free article] [PubMed] [Google Scholar]
- Tanaka H. Sugawara S. Shinohara K. Ueno T. Suzuki S. Hoshi N. Nakamura M. Electrocatalysis. 2015;6:295–299. doi: 10.1007/s12678-014-0245-7. [DOI] [Google Scholar]
- Yoo S. Yoo S. Deng G. Sun F. Lee K. Jang H. Lee C. W. Liu X. Jang J. Tang Q. Hwang Y. J. Hyeon T. Bootharaju M. S. Adv. Mater. 2024;36:2313032. doi: 10.1002/adma.202313032. [DOI] [PubMed] [Google Scholar]
- Comte A. L. Brousse T. Bélanger D. Electrochim. Acta. 2014;137:447–453. doi: 10.1016/j.electacta.2014.05.155. [DOI] [Google Scholar]
- Zheng W. Wang Y. Shuai L. Wang X. He F. Lei C. Li Z. Yang B. Lei L. Yuan C. Qiu M. Hou Y. Feng X. Adv. Funct. Mater. 2021;31:2008146. doi: 10.1002/adfm.202008146. [DOI] [Google Scholar]
- Wang Z. Duan X. Sendeku M. G. Xu W. Chen S. Tian B. Gao W. Wang F. Kuang Y. Sun X. Chem Catal. 2023;3:100672. doi: 10.1016/j.checat.2023.100672. [DOI] [Google Scholar]
- Bae G. Kim H. Choi H. Jeong P. Kim D. H. Kwon H. C. Lee K.-S. Choi M. Oh H.-S. Jaouen F. Choi C. H. JACS Au. 2021;5:586–597. doi: 10.1021/jacsau.1c00074. [DOI] [PMC free article] [PubMed] [Google Scholar]
- Zhao D. Feng J. Huo Q. Melosh N. Fredrickson G. H. Stucky G. D. Science. 1998;279:548–552. doi: 10.1126/science.279.5350.548. [DOI] [PubMed] [Google Scholar]
- Kruk M. Jaroniec M. Ko C. H. Ryoo R. Chem. Mater. 2000;12:1961–1968. doi: 10.1021/cm000164e. [DOI] [Google Scholar]
Associated Data
This section collects any data citations, data availability statements, or supplementary materials included in this article.
Supplementary Materials
Data Availability Statement
The data (catalyst characterization, elemental analysis, electrochemical characterization) supporting this Edge article are available within the article and ESI.†


