

Abstract
Objective:
To explore how dietary macronutrient composition influences postprandial appetite hormone responses and subsequent energy intake.
Methods:
Twenty adults (mean±SEM; age 30±1 y, BMI 27.8±1.3 kg·m−2, n=8 ‘Normal weight’, n=6 ‘Overweight’, n=6 ‘with Obesity’) consumed a low-fat diet (LF; 10% fat, 75% carbohydrate) and a low-carbohydrate diet (LC; 10% carbohydrate, 75% fat) for 2 weeks each, in an inpatient randomized crossover design. At the end of each diet, participants consumed isocaloric macronutrient-representative breakfast meal tests and 6-hour postprandial responses were measured. Ad libitum energy intake was measured for the rest of the day.
Results:
The LC test meal increased mean postprandial plasma active GLP-1 (LC: 6.44±0.78 pg·mL−1, LF: 2.46±0.26 pg·mL−1; p<0.0001), total GIP (LC: 578±60 pg·mL−1, LF: 319±37 pg·mL−1; p=0.0004), and PYY (LC: 65.6±5.6 pg·mL−1, LF: 50.7±3.8 pg·mL−1; p=0.02), whereas total ghrelin (LC: 184±25 pg·mL−1, LF: 261±47 pg·mL−1; p=0.0009), active ghrelin (LC: 91±9 pg·mL−1, LF: 232±28 pg·mL−1; p<0.0001), and leptin (LC: 26.9±6.5 ng·mL−1, LF: 35.2±7.5 ng·mL−1; p=0.01) were lower, compared to LF. Participants ate more during LC at lunch (244±85 kcal; p=0.01) and dinner (193±86 kcal; p=0.04), increasing total subsequent energy intake for the day compared to LF (551±103 kcal; p<0.0001).
Conclusions:
In the short-term, diet-related factors other than gut-derived appetite hormones can dominate ad libitum energy intake.
Keywords: Appetite, Energy Intake, Gut Hormones, Postprandial, Diet
Graphical Abstract

Introduction
Gut-derived hormones affect appetite. Ghrelin increases hunger and decreases after food intake, whereas satiation and satiety are induced by peptide YY (PYY) and glucagon-like peptide-1 (GLP-1), which are increased after food intake.1–3 These gut-derived appetite hormones have been theorized to play a role in the weight-loss that results from bariatric surgery4,5 and agonists of GLP-1 and glucose-dependent insulinotropic polypeptide (GIP) receptors have become successful pharmacological treatments for obesity.6–8 Circulating concentrations of gut-derived appetite hormones can be influenced by dietary macronutrient composition,9–13 which provides a theoretical basis for why some diets may help facilitate weight loss better than others. We recently studied 20 inpatient adults who were exposed to two diets varying widely in the proportion of fat to carbohydrate for periods of 2 weeks each.14 In a randomized crossover design, after 2 weeks of eating a low carbohydrate (LC) diet (75% fat, 10% carbohydrate), the postprandial gut hormone responses to a representative LC liquid test meal were compared with an isocaloric low fat (LF) liquid test meal consumed after 2 weeks of eating a LF diet (10% fat, 75% carbohydrate). Subsequent ad libitum energy intake at lunch, dinner, and snacks for the rest of the day were measured to investigate whether postprandial responses were commensurate with subsequent intake during these dietary patterns.
Methods
These data are exploratory endpoints from a registered clinical trial conducted at the Metabolic Clinical Research Unit at the NIH Clinical Center and approved by the institutional board of the National Institute of Diabetes & Digestive & Kidney Diseases (NCT03878108). Detailed methods have been published previously.14 Participants completed a single four week stay and completed 2 diets in a randomized order, with randomization conducted by the NIH Clinical Center Nutrition Department using an online program.14 Participant flow through the study is displayed in Figure S1. One diet was an animal-based, ketogenic, low carbohydrate (LC) diet with ~10% of energy from carbohydrates, ~75% from fat and the other diet was a plant-based, low fat (LF) diet with ~10% of energy from fat, ~75% from carbohydrate. Inclusion criteria were male and female adults age 18–50 years; weight stable (within 5% in past 6 months); body mass index ≥20 kg·m−2; body weight ≥53 kg; able to complete daily bouts of stationary cycling at a moderate rate and intensity with a heart rate (HR) equal to or greater than 0.3 × (220 - age - HRrest) + HRrest but not exceeding 0.4 × (220 - age - HRrest) + HRrest and no signs of arrhythmia. Exclusion criteria were evidence of metabolic or cardiovascular disease or disease that may influence metabolism (for example cancer, diabetes, thyroid disease); taking any prescription medication or other drug that may influence metabolism (for example diet/weight-loss medication, asthma medication, blood pressure medication, psychiatric medications, corticosteroids or other medications at the discretion of the study team); positive pregnancy test or lactation as determined by volunteer report (women only); participating in a regular exercise program (>2 h·week−1 of vigorous activity); hematocrit <37% for women and <40% for men; habitual caffeine consumption >300 mg·d−1; regular use of alcohol (>2 drinks per day), tobacco (smoking or chewing), amphetamines, cocaine, heroin or marijuana over past 6 months; psychological conditions such as (but not limited to) eating disorders, claustrophobia, clinical depression, bipolar disorders, as determined by investigators after reviewing the results of the DSM-5 Self-Rated Level 1 Cross-Cutting Symptom Measure; past or present history of claustrophobia; implants, devices or foreign objects implanted in the body that interfere with the magnetic resonance procedures; strict dietary concerns (for example vegetarian or kosher diet, food allergies) as determined by investigators after reviewing the results of the Food Frequency Questionnaire; volunteers unwilling or unable to give informed consent; and non-English speakers owing to unavailability of required questionnaires in other languages. Participants were 20 adults (male n=11, female n=9; mean±SD (range), age 30±6 (18 to 39) years; body mass 80.8±18.2 (57.9 to 126.2) kg; body mass index (BMI) 27.8±5.9 (20.6 to 40.8) kg·m−2; fat mass 26.9±11.2 (7.2 to 57.5) kg; body fat percentage 32.8±9.8 (12.0 to 49.7)%; resting energy expenditure 1550±287 (998 to 2124) kcal·d−1). According to BMI categories, 8 participants would be categorized as Normal weight, 6 participants with Overweight, and 6 participants with Obesity. The primary endpoint of the original trial (differences in mean daily ad libitum energy intake) was used to determine sample size as previously reported,14 with 20 participants enabling detection of a 125–150 kcal·d−1 difference across 14 days, or 175–210 kcal·d−1 difference across the final 7 days, of each diet with 80% power and type 1 error probability of 0.05.
At the end of the second inpatient week of consuming either the ad libitum low carbohydrate (LC) or low fat (LF) diets and after an overnight fast, participants consumed liquid meals matching the macronutrient content of the prevailing diet and amounting to 30% of the estimated daily calorie requirements as determined by 1.6 multiplied by the resting energy expenditure measured at screening. Mean (range) of energy in the test meals was 777 (532 to 1043) kcal. The energy density of the LC drink was 1.9 kcal·g−1 and the energy density of the LF drink was 1.2 kcal·g−1. The LC test meal was designed to achieve a macronutrient composition of 10% carbohydrate, 75% fat, and 15% protein whereas the LF test meal was designed as 75% carbohydrate, 10% fat, and 15% protein (Table S1). Venous blood samples were obtained at 0, 10, 20, 30, 60, 90, 120, 180, 240, 300, and 360 minutes after the meals in EDTA tubes (BectonDickinson Co, NJ), containing DPPIV inhibitor, AEBSF, and aprotinin at a final concentration of 50 μM, 20 μM, and 2 nM respectively. Blood draw tubes were immediately placed on ice, centrifuged for 15 minutes at 4°C, processed and stored at −80°C within 1 hour of blood draw. GLP-1, GIP, PYY, total ghrelin, active ghrelin, and leptin concentrations were analyzed in duplicate using multiplex immunoassays (K15281K, Meso Scale Diagnostics, MD). Intra- and inter-assay coefficient of variations for each metabolite are presented in Table S2. Samples stored for the measurement of active ghrelin were not acidified with HCl prior to storage. According to the manufacturer, the Active GLP-1 assay is specific to the 7–36 amide peptide with non-specific binding lower than 2%. The Active and total GLP-1 assays cross-react, hence only active was measured. The PYY assay is specific to the 1–36 amide and the PYY detection antibody cross-reacts a small amount with pancreatic polypeptide (1.1%).
After the breakfast mixed meal tests, ad libitum food intake was measured over the rest of the day including lunch, dinner, and snacks by weighing the remaining food and beverages to calculate the amount of each food consumed and energy intake was calculated using ProNutra software (v.3.4, Viocare) with nutrient values derived from the USDA National Nutrient Database for Standard Reference, Release 26 and the USDA Food and Nutrient Database for Dietary Studies, 4.0. Images of the meals and snacks presented, with macronutrient content of each meal, is provided in Figure S2. Relative energy intake was measured as a proportion of energy expenditure from the 24-hour metabolic chamber stay closest in time to each meal test day (mean±SD 2±2 days). Relative total energy intake was expressed as proportion of 24-hour energy expenditure, sedentary energy expenditure, and sleeping energy expenditure using stoichiometric equations and definitions previously described.14
Statistical analyses were performed using SAS (v.9.4; SAS Institute) and Prism (v.10.2.2; GraphPad). Mean plasma concentrations were calculated by dividing total area under the curve (tAUC) by 360 minutes and net incremental area under the curve (iAUC) was calculated by accounting for baseline concentrations. Active GLP-1 Cavg (average concentration) was estimated by multiplying the 6-hour postprandial tAUC by 3 (18 h) and multiplying the postabsorptive (fasting) concentration by 360 minutes (6 h), to get 24-hour exposure, and dividing by 24. The conversion factor used for GLP-1 was 1 pmol·L−1 = 3.297 pg·mL−1. HOMA1-IR was calculated using the formula: (fasting glucose [mg·dL−1] x fasting insulin [mU·L−1]) / 405,15 using data published in the original analyses.14 Data were checked for normality using Shapiro-Wilk test, differences between conditions were assessed using paired t-tests for normally distributed and Wilcoxon tests for non-normally distributed data. Simple linear correlation was used to explore associations between gut hormone responses and ad libitum energy intake. Diet by BMI interactions were checked using ANCOVA to compare the regression slopes between BMI and energy intake/hormone concentrations. For active ghrelin, a 2-way ANOVA, with post-hoc Bonferroni test was used to identify differences between individuals with a BMI <25 kg·m−2 and individuals ≥25 kg·m−2. Significance was accepted as p≤0.05.
Results
Gut-derived hormone concentrations
At the end of each ad libitum feeding period, the LC diet resulted in greater fasting concentrations of GLP-1 and GIP, but similar concentrations of PYY and leptin, and lower concentrations of total ghrelin and active ghrelin, when compared to the LF diet (Table 1). Figure 1 demonstrates that the LC breakfast test meal delivered at the end of the ad libitum LC period resulted in greater mean postprandial plasma concentrations of active GLP-1 (LC meal: 6.44±0.78 pg·mL−1, LF meal: 2.46±0.26 pg·mL−1; p<0.0001), total GIP (LC meal: 578±60 pg·mL−1, LF meal: 319±37 pg·mL−1; p=0.0004), and PYY (LC meal: 65.6±5.6 pg·mL−1, LF meal: 50.7±3.8 pg·mL−1; p=0.02) whereas total ghrelin (LC meal: 184±25 pg·mL−1, LF meal: 261±47 pg·mL−1; p=0.0009), active ghrelin (LC meal: 91±9 pg·mL−1, LF meal: 232±28 pg·mL−1; p<0.0001), and leptin (LC meal: 26.9±6.5 ng·mL−1, LF meal: 35.2±7.5 ng·mL−1; p=0.01) were lower as compared to an isocaloric LF breakfast test meal delivered at the end of the ad libitum LF period. To account for fasting concentrations, the same outcomes for iAUC are displayed in Table 2.
Table 1.
Body composition, HOMA1-IR, and fasting concentrations of gut-derived appetite hormones and leptin in the second week of low carbohydrate (LC) or low fat (LF) diet.
| LC | LF |
p value LC vs LF |
|
|---|---|---|---|
| Body mass (kg) | 78.4 ± 4.0 | 78.0 ± 3.8 | 0.39 |
| Body fat (%) | 33.2 ± 2.2 | 32.5 ± 2.2 | <0.0001 |
| HOMA1-IR | 1.32 ± 0.21 | 1.80 ± 0.23 | 0.03 |
| Active GLP-1 (pg·mL−1) |
0.96 ± 0.14 | 0.61 ± 0.06 | 0.006 |
| Total GIP (pg·mL−1) |
80 ± 13 | 56 ± 8 | 0.33 |
| PYY (pg·mL−1) |
38.2 ± 3.2 | 38.0 ± 3.7 | 0.99 |
| Total ghrelin (pg·mL−1) |
263 ± 48 | 329 ± 55 | 0.31 |
| Active ghrelin (pg·mL−1) |
117 ± 21 | 242 ± 32 | 0.0003* |
| Leptin (ng·mL−1) |
28.2 ± 6.7 | 33.5 ± 7.8 | 0.55 |
Data are mean ± SEM, n=20.
n=19 for this outcome.
Figure 1.

Postprandial responses to isocaloric low carbohydrate (LC) or low fat (LF) meals following habituation to each diet in a randomized crossover design. Mean (range) of energy in the test meals was 777 (532 to 1043) kcal. Data are mean ± SEM. n=20. p-values from paired t-test of mean postprandial plasma concentrations. (A) active glucagon-like peptide-1 (GLP-1), (B) total glucose-dependent insulinotropic polypeptide (GIP), (C) peptide YY (PYY), (D) leptin, (E) total ghrelin, (F) active ghrelin.
Table 2.
Time-averaged incremental area under the curve (iAUC) concentrations of gut-derived appetite hormones and leptin in the second week of low carbohydrate (LC) or low fat (LF) diet.
| LC | LF |
p value LC vs LF |
|
|---|---|---|---|
| Active GLP-1 (pg·mL−1) |
5.49 ± 0.78 | 1.85 ± 0.26 | 0.0001 |
| Total GIP (pg·mL−1) |
498 ± 57 | 263 ± 33 | 0.0008 |
| PYY (pg·mL−1) |
27.3 ± 6.4 | 12.7 ± 4.0 | 0.02 |
| Total ghrelin (pg·mL−1) |
−78 ± 27 | −68 ± 15 | 0.90 |
| Active ghrelin (pg·mL−1) |
−25 ± 16 | −5 ± 34 | 0.50* |
| Leptin (ng·mL−1) |
−1.3 ± 0.5 | 1.7 ± 1.1 | 0.001 |
Data are mean ± SEM, n=20.
n=19 for this outcome.
Ad libitum energy intake
After the breakfast test meal, ad libitum energy intake was greater during the LC diet at lunch (244±85 kcal; p=0.001) and dinner (193±86 kcal; p=0.04), but not snacks (114±63 kcal; p=0.12), such that the total ad libitum energy intake over the rest of the day was significantly greater (551±103 kcal; p<0.0001) as compared to when the same participants consumed the LF diet (Figure 2A). Relative energy intake was greater in the LC condition when accounting for energy expenditure around the time of each meal test (Figure 2B). Within each diet pattern, there were no significant correlations between subsequent ad libitum energy intake across the day and the mean postprandial active GLP-1 (LC diet: r=−0.1; p=0.68, LF diet: r=−0.12; p=0.60), total GIP (LC diet: r=−0.08; p=0.73, LF diet: r=0.23; p=0.34), PYY (LC diet: r=−0.23; p=0.32, LF diet: r=−0.007; p=0.98), total ghrelin (LC diet: r=0.31; p=0.19, LF diet: r=0.32; p=0.16), active ghrelin (LC diet: r=0.20; p=0.41, LF diet: r=0.07; p=0.76), or leptin (LC diet: r=−0.07; p=0.77, LF diet: r=−0.26; p=0.27). Similarly, there were no significant correlations between incremental area under the curve and subsequent ad libitum energy intake either at lunch or across the day (Table S3). There was a moderate negative correlation between mean postprandial leptin concentrations and ad libitum lunch intake in the LF condition (r=−0.48, p=0.03, Table S3), but not in the LC condition (r=−0.21, p=0.38, Table S3).
Figure 2.

Total energy intake (EI), and intake from lunch, dinner, and snacks throughout the day after isocaloric low carbohydrate (LC) or low fat (LF) meals following habituation to each diet in a randomized crossover design. Mean (range) of energy in the test meals was 777 (532 to 1043) kcal. Data are mean ± SEM and individual responses. n=20. p-values from paired t-test or Wilcoxon test. (A) Energy intake (kcal), (B) Relative Total EI as a proportion of 24h energy expenditure (24hEE), sedentary energy expenditure (SedEE), and sleeping energy expenditure (SEE), (C) Mass intake (g).
Using the 6-hour postprandial concentrations (pre-lunch; closest time-point to lunch meal), in the LF, but not LC, condition there was a moderate negative correlation between leptin and ad libitum lunch intake and a moderate positive correlation between total ghrelin and ad libitum lunch intake (Table S3). Conversely, active ghrelin was moderately positive correlated with ad libitum lunch intake in the LC condition but not LF (Table S3).
Mass of food eaten
Mass of food eaten was greater at lunch and dinner in LF compared to LC (Figure 2C). Similar to lunch energy intake, there was a moderate negative correlation between mean postprandial leptin concentrations and ad libitum lunch mass in the LF, but not LC, condition (Table S4). There were also moderate negative correlations between pre-lunch leptin concentrations and food mass intake at lunch and across the rest of the day (Table S4). There were moderate positive correlations between pre-lunch total ghrelin concentrations and food mass intake at lunch and across the rest of the day (Table S4).
Timing of meal delivery
The breakfast time was recorded for all participants, but reliable lunch and dinner time was available for 16/20 participants. From this, the mean±SD time between the start of the breakfast meal and the lunch meal was 6:18±0:41 h:mm for LC and 6:14±0:18 h:mm for LF (p=0.70). Similarly, the mean±SD time between lunch and dinner was 3:38±0:46 h:mm for LC and 3:26±0:31 h:mm for LF (p=0.32). There was no correlation between time between breakfast and lunch and ad libitum lunch intake in LC (r=0.14, p=0.61) or LF (r=0.23, p=0.40). Similarly, there was no correlation between the difference in time between breakfast and lunch and difference in ad libitum lunch intake between conditions (r=−0.006, p=0.98).
Body mass index and gut-derived hormone concentrations
The present cohort had a wide range of body mass indices, therefore diet by BMI interactions were explored to investigate if any of the differences in gut hormone responses were driven by BMI (Figure S3). The slopes for correlations between BMI and energy intake/hormone concentrations were not altered by condition, but visually active ghrelin concentrations tended to be greater at a lower BMI in the LF condition compared to LC (Figure S2G). Dichotomizing the sample into individuals with a BMI <25 kg·m−2 and individuals ≥25 kg·m−2 changed the magnitude of the reduction in active ghrelin in the LC condition compared to LF (Figure S2H; BMI <25 kg·m−2 mean [95% CI] −242 [−334 to −149] pg·mL−1 p<0.0001; BMI ≥25 kg·m−2 −75 [−150 to 1] pg·mL−1, p=0.054).
Discussion
Gut hormone responses and subsequent energy intake
The observed differences in gut-derived appetite hormones during the LC test meal would be expected to result in reduced appetite and lower ad libitum energy intake as compared to the LF diet. However, the opposite result was observed, with the LC diet resulting in an additional ~500 kcal consumed over the remainder of the day following the test meal, as compared to the LF diet. This difference was similar to the overall ~700 kcal·d−1 difference between the diets averaged over two weeks.14
Concentrations of the adipokine leptin were commensurate with the direction of ad libitum energy intake differences for the LC and LF diets. The lower leptin following the LC diet (vs LF) is in agreement with previous evidence comparing a ketogenic low carbohydrate diet with an isocaloric diet moderate in both carbohydrate and fat.16 The decrease in leptin following LC is likely explained by decreased insulin and glucose concentrations, which were lower in LC compared to LF.14 Previous studies have shown that small increases in insulin induced by glucose infusion of 2.5 mg·kg−1·min were sufficient to offset the decrease in leptin observed with 16 hours of fasting17 and 24 hours of ketogenic carbohydrate restriction reduced leptin concentrations independent from changes in ad libitum energy intake and preceding changes in adiposity.18 Therefore, the evidence suggests that changes in carbohydrate availability, rather than energy intake or energy balance, are key for altering leptin concentrations. Decreased leptin would theoretically increase appetite, as has been associated following weight loss.19 Whilst it is possible that leptin, as a longer-term appetite signal, overrides the transient signals from gut-derived hormones, leptin concentrations did not correlate with ad libitum energy intake in the present study, so it is likely that other diet-related factors are more important in this context.
Influence of macronutrient composition on gut hormone response
Although the LC and LF diets differed by more than just their macronutrient composition, it is likely that the differences in gut hormone responses were mainly due to macronutrient differences as previously reviewed.20,21 Early evidence in humans suggested that small increases in GLP-1 were observed after isocaloric carbohydrate (glucose), fat (double cream), or protein (lean turkey) ingestion, whereas GIP only responded to carbohydrate and fat.22 However, regardless of nutrient, the food matrix also plays a large role in determining postprandial responses as demonstrated by isocaloric ingestion of glucose eliciting greater GLP-1 and GIP responses than whole food sources of carbohydrate, including brown rice or pearl barley.22 With regards to carbohydrate manipulation, the increase in PYY observed following LC in the present study resembles the results of a similar randomized crossover study in participants with obesity who consumed isocaloric low-carbohydrate or low-fat diets for one week before ingesting a representative breakfast meal.23 Similarly, high-fat drinks (38% carbohydrate, 50% fat) increase postprandial GLP-1 and PYY responses, without differences in postprandial ghrelin responses, compared to isocaloric (590 kcal) low-fat, high-carbohydrate drinks (84% carbohydrate, 3% fat), but these differences did not translate into differences in ad libitum energy intake in a subsequent lunch meal.10 Instead, ad libitum intake was associated with ghrelin responses, which contrasts with our results because total and active ghrelin were reduced with the LC diet in comparison to the LF diet and did not correlate with energy intake.
Macronutrient manipulation, with food volume and energy density controlled, has been shown to alter postprandial GLP-1, GIP, PYY, active ghrelin, and total ghrelin responses, but did not alter subjective hunger or subsequent energy intake.9,12,13 Over the course of our study, the LF diet resulted in ~700 kcal·d−1 less ad libitum energy intake as compared to the LC diet without significant differences in self-reported appetite.14 Because postprandial responses of gut-derived appetite hormones depend on the amount of food consumed,24,25 the expected diet differences in postprandial ghrelin, GLP-1, GIP, and PYY during the ad libitum period would likely be even greater than we observed following the isocaloric meal tests and further emphasizes that the expected effects of these appetite hormone differences were dominated by other diet differences.
Diet-related factors affecting energy intake beyond gut hormones
Recent analysis of the meal characteristics that affect energy intake from our inpatient feeding studies suggests that energy density, eating rate, and proportion of hyper-palatable foods are positively associated with meal energy intake.26 Greater dietary energy density has consistently been shown to increase energy intake in short-term interventions.27 The LC diet of the present study had about double the energy density of the LF diet and mediated around 25% of the diet effect on meal energy intake.26 A quicker eating rate increases energy intake of presented meals without altering subsequent hunger.28 Eating rate could be related to sensory and physical properties of foods, like food texture;29 for example, softer, less solid, less viscous foods are associated with increased eating rate.30 Eating rate in grams per minute was quicker in the LF meals at lunch (29±9 g·min−1, p<0.0001) and dinner (14±9 g·min−1, p=0.009) on the test meal day, compared to LC, so this factor is unlikely to explain our observations of increased energy intake on the LC test meal day. The volume and mass of food ingested is closely related to energy density, which may alter gastric distension and contribute to changes in gut hormone responses to meals.31 The mass of food eaten ad libitum was significantly greater following the LF diet at lunch and dinner, but not snacks (Figure 2C), compared to LC. This total difference across the day was consistent with the overall ~667 g·d−1 difference between the diets averaged over two weeks.14 Within each diet pattern, there were no significant correlations between postprandial gut hormone responses following the liquid test meals and subsequent mass of food eaten at lunch (first subsequent meal) or throughout the day of the test meal (Table S4), apart from a moderate negative correlation between food mass intake at lunch in the LF diet and leptin. Hyper-palatable foods have recently been defined using quantitative thresholds of nutrient combinations that may drive excess intake; 1) fat and sugar (>20% energy, >20% energy), 2) fat and sodium (>20% of energy, >0.3% by weight), and 3) carbohydrates and sodium (>40% energy, >0.3% by weight).32 Across the entire 2 weeks, meals in the LC diet had a greater proportion of hyper-palatable foods than the LF diet, which may have mediated around 14% of the diet effect on meal energy intake.26 The availability of hyperpalatable foods in the US food system, by this definition, has increased from around 49% to around 69% in 30 years.33 Emerging cross-sectional evidence suggests that hyper-palatable foods may be more rewarding.34 More work is required to determine the utility of quantitative definitions of hyper-palatability and their influence on food intake. Whilst the alternative diet-related factors discussed may often be inter-related in real world settings, it is important for future work to isolate these diet-related factors and test their contribution to ad libitum energy intake in different dietary contexts (e.g. macronutrient manipulation or processing).
Comparisons between diet and pharmacological or surgical interventions
Discordance between gut hormone responses and energy intake in the present study may appear to contradict the recent success of pharmacological gut hormone mimetics, including GLP-1 receptor agonists, but quantitative considerations of dose and exposure reconcile our findings. Specifically, the estimated active GLP-1 steady state average exposure concentration, Cavg, for the present study had mean (95% CI) values of 0.034 (0.029, 0.043) nmol·L−1 for LF and 0.086 (0.071, 0.113) nmol·L−1 for LC, which are orders of magnitude lower than the Cavg of both oral and subcutaneous semaglutide ranging from ~3 nmol·L−1 up to ~30 nmol·L−1, respectively (Figure 3A).35 Such high Cavg with pharmacological treatment is due to the long half-life of semaglutide which has a similar binding affinity to the GLP-1 receptor as native GLP-1,36 whereas the half-life of endogenous GLP-1 and GIP is minutes in humans.37 Unlike pharmacological intervention, diet-induced changes in gut hormone concentrations reflect conjoint changes of multiple hormones in a complex signalling system, so the quantitative exposure of GLP-1 from diet and pharmacological interventions cannot be compared directly, but this comparison highlights that the magnitude of change in GLP-1 from diet is not comparable to that of pharmacological interventions even with the concurrent changes of other hormones.
Figure 3.
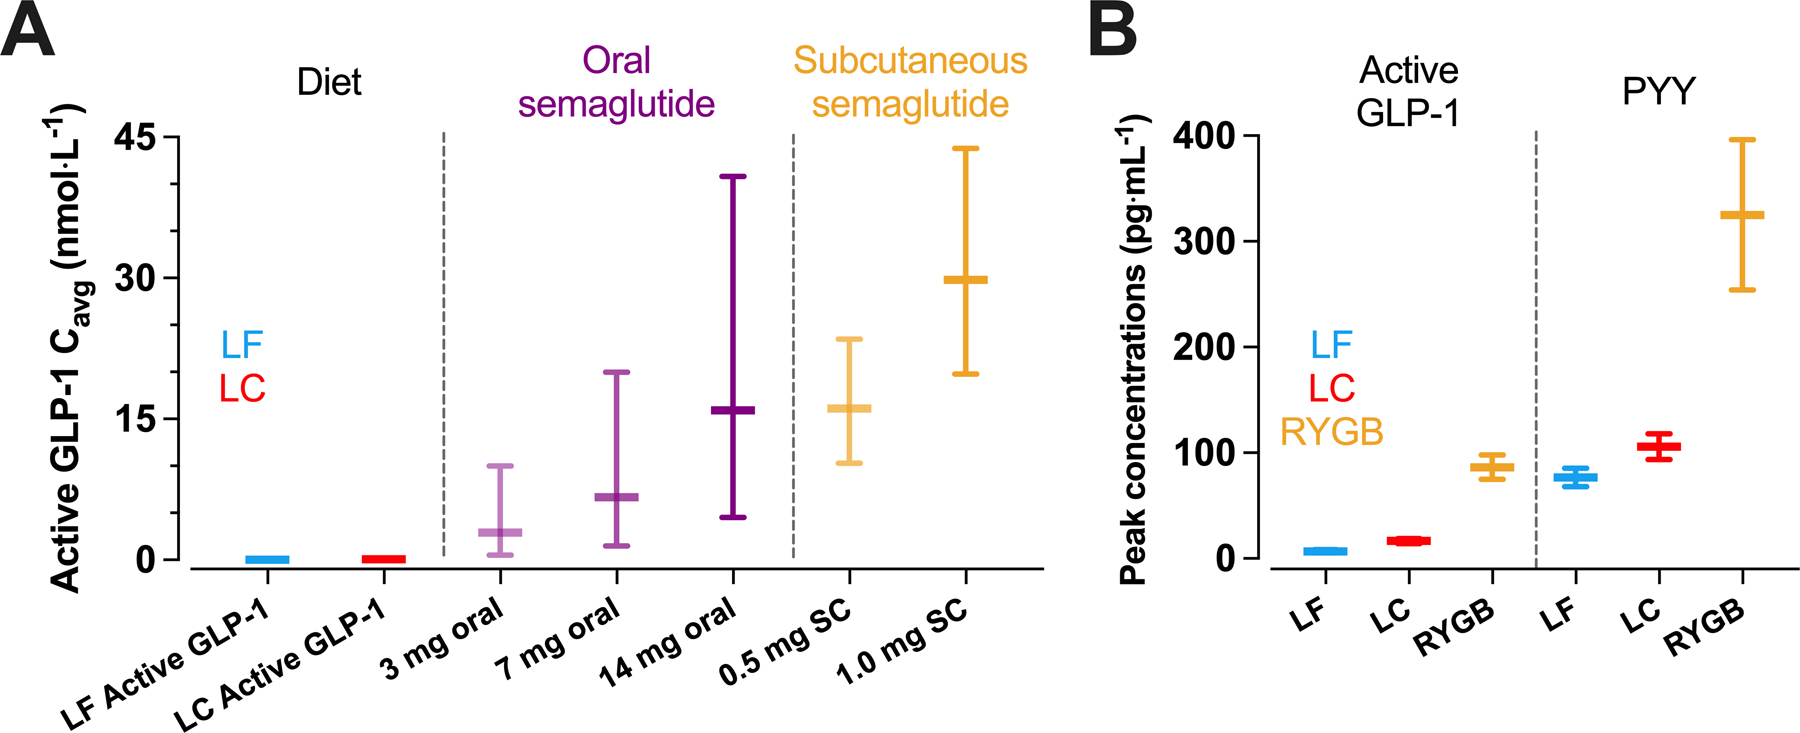
Comparisons between dietary macronutrient induced changes in gut hormone responses and pharmacological or bariatric surgery induced changes. (A) estimated mean active GLP-1 steady state average exposure concentrations, Cavg, achieved by low carbohydrate (LC) or low fat (LF) diet were orders of magnitude lower than the both oral and subcutaneous semaglutide using values from Overgaard et al.35 (B) peak active GLP-1 and PYY concentrations following a LC or LF test meal were orders of magnitude lower than peak concentrations observed during a mixed-meal test following Roux-en-Y Gastric Bypass surgery (RYGB) using data from Tan et al.3 For 3A, data are median ± 90% exposure ranges, for 3B, data are mean ± SEM.
Pharmacological engagement of the GLP-1 receptor (e.g. exogenous GLP-1) may act differently from nutrient-stimulated gut hormones (e.g. endogenous GLP-1). For example, endogenous GLP-1 may affect the hypothalamus through neuronal signaling from the gut to brain via solitary tract neurons, whereas exogenous GLP-1 receptor agonists may directly engage hypothalamic and brainstem GLP-1 receptors.6 Further complicating this, GLP-1 can be produced centrally in brain regions which may directly alter appetite independent from diet-induced gut hormone secretion.38 Whilst data from rats suggests peripheral endogenous GLP-1 can alter food intake even when central GLP-1 receptor signalling is blocked,39 mouse models that knockout the GLP-1 receptor,40 or delete intestinal GLP-1 production throught GNG gene knockout,41 do not result in a body weight or food intake phenotype, suggesting that endogenous GLP-1 may have a limited effect on appetite in the normal physiological range.
Some forms of bariatric surgery result in substantial increases in postprandial GLP-1 and PYY,42–44 likely due to altered gastric emptying and intestinal nutrient delivery. The magnitude of post-surgical changes in postprandial gut hormone responses might be mechanistically linked to reduced appetite and energy intake. Infusion of GLP-1, PYY, and oxyntomodulin in healthy participants that mimics the concentrations observed following Roux-en-Y gastric bypass reduced energy intake at lunch and dinner by ~400 kcal.3 The active GLP-1 and PYY concentrations achieved were around 26 pmol·L−1 (85 pg·mL−1) and 80 pmol·L−1 (320 pg·mL−1) respectively. For active GLP-1, these concentrations are around 13-fold and 35-fold greater than mean postprandial concentrations following the LC and LF meals in the present study, and for PYY they are around 5-fold and 6-fold greater (Figure 3B). Infusing GLP-1 to achieve concentrations comparable with the LC condition of the present study (~15 pg·mL−1) delays gastric emptying without suppressing subjective appetite and ad libitum intake.45 Supraphysiological concentrations of GLP-1 achieved by infusion (~25 to 30 pg·mL−1) suppress subjective appetite, but effects on subsequent ad libitum energy intake are modest compared with higher concentrations (~100 to 240 kcal).46,47 Together, infusion studies indicate a dose-response relationship between active GLP-1 and suppression of appetite,48 and suggest that substantially greater increases in gut hormone concentrations are required to have dominant effects on appetite and energy intake, likely greater than is achievable by dietary macronutrient manipulation alone.
Limitations and considerations
A limitation of the current study is that participants had no choice regarding the foods available for consumption; they could only choose the quantity of the foods eaten. While the gut-derived appetite hormones were not a dominant factor determining energy intake in this setting, it is possible that such differences in appetite hormones in a real-world setting might alter food choices or timing of meal initiation at subsequent meals and thereby alter energy intake. In addition, we did not measure the gut-derived hormone concentrations throughout subsequent lunch and dinner meals. Another limitation is that we used isocaloric liquid test meals that matched the macronutrient composition of the overall LC and LF diets. These test meals may have not been adequately representative of the effects of meals with solid foods. Furthermore, the results reported in this study were from analyses that were not pre-specified as primary or secondary outcomes of the main study and are hence exploratory in nature, and the sample size was not specifically powered to test these effects.Furthermore, the numerous correlations were not corrected for multiple comparisons.
The inclusion of individuals across a wide range of body mass indices is a strength and a limitation; the lack of interaction with BMI for all outcomes other than active ghrelin suggests that these findings would not be different if the study was performed solely in individuals within one BMI category. The strength is that our findings are likely to be relevant to a broad population, but the limitation is, if small effects are present between BMI categories, our sample size was probably underpowered to detect them.
Conclusion
Our study suggests that differences in dietary factors like energy density or proportion of hyper-palatable foods may play a greater role in appetite regulation than endogenous gut-derived appetite hormones, at least in the short term. Future research should aim to identify such diet differences that influence energy intake and evaluate whether their effects and their potential discordance with gut-dervied appetite hormones persist over time.
Supplementary Material
What is already known about this subject?
Gut-derived hormones can affect appetite.
Dietary macronutrient composition can influence gut-derived appetite hormone concentrations.
What are the new findings in your manuscript?
During a low-carbohydrate diet, a fixed low-carbohydrate meal elicited greater postprandial GLP-1, GIP, and PYY, but lower ghrelin, responses compared to an isocaloric low-fat meal during a low-fat diet’
Whilst the direction of the responses to the low-carbohydrate meal might be thought to reduce appetite, people ate more throughout the rest of the day compared with the low-fat meal
How might your results change the direction of research or the focus of clinical practice?
The effect of gut-derived appetite hormones on ad libitum energy intake following low-carbohydrate or low-fat diets is dominated by other diet-related factors
Diet-induced changes in gut-derived appetite hormones are much smaller than seen with pharmacological intervention or bariatric surgery, suggesting dietary macronutrient manipulation is not an effective way of altering energy intake through these mechanisms
Acknowledgements
We thank the nursing and nutrition staff at the NIH Metabolic Clinical Research Unit for their invaluable assistance with this study. We thank the study participants for their invaluable contribution. Data described in the manuscript will be made available upon request by email to the corresponding author.
Funding:
This work was supported by the Intramural Research Program of the NIH, National Institute of Diabetes & Digestive & Kidney Diseases under award number 1ZIADK013037.
Footnotes
Clinical trial registration: NCT03878108
Disclosure: The authors declared no conflict of interest.
References
- 1.Samms RJ, Goghlan MP, and Sloop KW (2020). How May GIP Enhance the Therapeutic Efficacy of GLP-1? Trends in Endocrinology and Metabolism 31, 410–421. 10.1016/j.tem.2020.02.006. [DOI] [PubMed] [Google Scholar]
- 2.Sato T, Nakamura Y, Shiimura Y, Ohgusu H, Kangawa K, and Kojima M (2012). Structure, regulation and function of ghrelin. J Biochem 151, 119–128. 10.1093/jb/mvr134. [DOI] [PubMed] [Google Scholar]
- 3.Tan T, Behary P, Tharakan G, Minnion J, Al-Najim W, Albrechtsen NJW, Holst JJ, and Bloom SR (2017). The Effect of a Subcutaneous Infusion of GLP-1, OXM, and PYY on Energy Intake and Expenditure in Obese Volunteers. The Journal of clinical endocrinology and metabolism 102, 2364–2372. 10.1210/jc.2017-00469. [DOI] [PMC free article] [PubMed] [Google Scholar]
- 4.Holst JJ, Madsbad S, Bojsen-Moller KN, Svane MS, Jorgensen NB, Dirksen C, and Martinussen C (2018). Mechanisms in bariatric surgery: Gut hormones, diabetes resolution, and weight loss. Surg Obes Relat Dis 14, 708–714. 10.1016/j.soard.2018.03.003. [DOI] [PMC free article] [PubMed] [Google Scholar]
- 5.Troke RC, Tan TM, and Bloom SR (2014). The future role of gut hormones in the treatment of obesity. Ther Adv Chronic Dis 5, 4–14. 10.1177/2040622313506730. [DOI] [PMC free article] [PubMed] [Google Scholar]
- 6.Drucker DJ, and Holst JJ (2023). The expanding incretin universe: from basic biology to clinical translation. Diabetologia. 10.1007/s00125-023-05906-7. [DOI] [PubMed] [Google Scholar]
- 7.Jastreboff AM, Aronne LJ, Ahmad NN, Wharton S, Connery L, Alves B, Kiyosue A, Zhang S, Liu B, Bunck MC, et al. (2022). Tirzepatide Once Weekly for the Treatment of Obesity. N Engl J Med 387, 205–216. 10.1056/NEJMoa2206038. [DOI] [PubMed] [Google Scholar]
- 8.Wilding JPH, Batterham RL, Calanna S, Davies M, Van Gaal LF, Lingvay I, McGowan BM, Rosenstock J, Tran MTD, Wadden TA, et al. (2021). Once-Weekly Semaglutide in Adults with Overweight or Obesity. N Engl J Med 384, 989–1002. 10.1056/NEJMoa2032183. [DOI] [PubMed] [Google Scholar]
- 9.Foster-Schubert KE, Overduin J, Prudom CE, Liu J, Callahan HS, Gaylinn BD, Thorner MO, and Cummings DE (2008). Acyl and total ghrelin are suppressed strongly by ingested proteins, weakly by lipids, and biphasically by carbohydrates. The Journal of clinical endocrinology and metabolism 93, 1971–1979. 10.1210/jc.2007-2289. [DOI] [PMC free article] [PubMed] [Google Scholar]
- 10.Gibbons C, Caudwell P, Finlayson G, Webb DL, Hellstrom PM, Naslund E, and Blundell JE (2013). Comparison of postprandial profiles of ghrelin, active GLP-1, and total PYY to meals varying in fat and carbohydrate and their association with hunger and the phases of satiety. The Journal of clinical endocrinology and metabolism 98, E847–855. 10.1210/jc.2012-3835. [DOI] [PubMed] [Google Scholar]
- 11.Helou N, Obeid O, Azar ST, and Hwalla N (2008). Variation of postprandial PYY 3–36 response following ingestion of differing macronutrient meals in obese females. Ann Nutr Metab 52, 188–195. 10.1159/000138122. [DOI] [PubMed] [Google Scholar]
- 12.Raben A, Agerholm-Larsen L, Flint A, Holst JJ, and Astrup A (2003). Meals with similar energy densities but rich in protein, fat, carbohydrate, or alcohol have different effects on energy expenditure and substrate metabolism but not on appetite and energy intake. Am J Clin Nutr 77, 91–100. DOI 10.1093/ajcn/77.1.91. [DOI] [PubMed] [Google Scholar]
- 13.van der Klaauw AA, Keogh JM, Henning E, Trowse VM, Dhillo WS, Ghatei MA, and Farooqi IS (2013). High Protein Intake Stimulates Postprandial GLP1 and PYY Release. Obesity 21, 1602–1607. 10.1002/oby.20154. [DOI] [PMC free article] [PubMed] [Google Scholar]
- 14.Hall KD, Guo J, Courville AB, Boring J, Brychta R, Chen KY, Darcey V, Forde CG, Gharib AM, Gallagher I, et al. (2021). Effect of a plant-based, low-fat diet versus an animal-based, ketogenic diet on ad libitum energy intake. Nat Med 27, 344–353. 10.1038/s41591-020-01209-1. [DOI] [PubMed] [Google Scholar]
- 15.Matthews DR, Hosker JP, Rudenski AS, Naylor BA, Treacher DF, and Turner RC (1985). Homeostasis model assessment: insulin resistance and beta-cell function from fasting plasma glucose and insulin concentrations in man. Diabetologia 28, 412–419. 10.1007/BF00280883. [DOI] [PubMed] [Google Scholar]
- 16.Hall KD, Chen KY, Guo J, Lam YY, Leibel RL, Mayer LE, Reitman ML, Rosenbaum M, Smith SR, Walsh BT, and Ravussin E (2016). Energy expenditure and body composition changes after an isocaloric ketogenic diet in overweight and obese men. Am J Clin Nutr 104, 324–333. 10.3945/ajcn.116.133561. [DOI] [PMC free article] [PubMed] [Google Scholar]
- 17.Sonnenberg GE, Krakower GR, Hoffmann RG, Maas DL, Hennes MM, and Kissebah AH (2001). Plasma leptin concentrations during extended fasting and graded glucose infusions: relationships with changes in glucose, insulin, and FFA. The Journal of clinical endocrinology and metabolism 86, 4895–4900. 10.1210/jcem.86.10.7951. [DOI] [PubMed] [Google Scholar]
- 18.Hengist A, Davies RG, Rogers PJ, Brunstrom JM, van Loon LJC, Walhin JP, Thompson D, Koumanov F, Betts JA, and Gonzalez JT (2022). Restricting sugar or carbohydrate intake does not impact physical activity level or energy intake over 24 h despite changes in substrate use: a randomised crossover study in healthy men and women. Eur J Nutr. 10.1007/s00394-022-03048-x. [DOI] [PMC free article] [PubMed] [Google Scholar]
- 19.Keim NL, Stern JS, and Havel PJ (1998). Relation between circulating leptin concentrations and appetite during a prolonged, moderate energy deficit in women. Am J Clin Nutr 68, 794–801. 10.1093/ajcn/68.4.794. [DOI] [PubMed] [Google Scholar]
- 20.Bodnaruc AM, Prud’homme D, Blanchet R, and Giroux I (2016). Nutritional modulation of endogenous glucagon-like peptide-1 secretion: a review. Nutr Metab (Lond) 13, 92. 10.1186/s12986-016-0153-3. [DOI] [PMC free article] [PubMed] [Google Scholar]
- 21.Watkins JD, Koumanov F, and Gonzalez JT (2021). Protein- and Calcium-Mediated GLP-1 Secretion: A Narrative Review. Adv Nutr 12, 2540–2552. 10.1093/advances/nmab078. [DOI] [PMC free article] [PubMed] [Google Scholar]
- 22.Elliott RM, Morgan LM, Tredger JA, Deacon S, Wright J, and Marks V (1993). Glucagon-like peptide-1 (7–36)amide and glucose-dependent insulinotropic polypeptide secretion in response to nutrient ingestion in man: acute post-prandial and 24-h secretion patterns. J Endocrinol 138, 159–166. 10.1677/joe.0.1380159. [DOI] [PubMed] [Google Scholar]
- 23.Essah PA, Levy JR, Sistrun SN, Kelly SM, and Nestler JE (2007). Effect of macronutrient composition on postprandial peptide YY levels. Journal of Clinical Endocrinology & Metabolism 92, 4052–4055. 10.1210/jc.2006-2273. [DOI] [PubMed] [Google Scholar]
- 24.Hengist A, Edinburgh RM, Davies RG, Walhin JP, Buniam J, James LJ, Rogers PJ, Gonzalez JT, and Betts JA (2020). Physiological responses to maximal eating in men. The British journal of nutrition 124, 407–417. 10.1017/S0007114520001270. [DOI] [PubMed] [Google Scholar]
- 25.Lewis HB, Ahern AL, Solis-Trapala I, Walker CG, Reimann F, Gribble FM, and Jebb SA (2015). Effect of reducing portion size at a compulsory meal on later energy intake, gut hormones, and appetite in overweight adults. Obesity (Silver Spring) 23, 1362–1370. 10.1002/oby.21105. [DOI] [PMC free article] [PubMed] [Google Scholar]
- 26.Fazzino TL, Courville AB, Guo J, and Hall KD (2023). Ad libitum meal energy intake is positively influenced by energy density, eating rate and hyper-palatable food across four dietary patterns. Nat Food. 10.1038/s43016-022-00688-4. [DOI] [PubMed] [Google Scholar]
- 27.Robinson E, Khuttan M, McFarland-Lesser I, Patel Z, and Jones A (2022). Calorie reformulation: a systematic review and meta-analysis examining the effect of manipulating food energy density on daily energy intake. Int J Behav Nutr Phy 19. ARTN 48 10.1186/s12966-022-01287-z. [DOI] [PMC free article] [PubMed] [Google Scholar]
- 28.Robinson E, Almiron-Roig E, Rutters F, de Graaf C, Forde CG, Smith CT, Nolan SJ, and Jebb SA (2014). A systematic review and meta-analysis examining the effect of eating rate on energy intake and hunger. Am J Clin Nutr 100, 123–151. 10.3945/ajcn.113.081745. [DOI] [PubMed] [Google Scholar]
- 29.Forde CG, and de Graaf K (2022). Influence of Sensory Properties in Moderating Eating Behaviors and Food Intake. Frontiers in Nutrition 9. ARTN 841444 10.3389/fnut.2022.841444. [DOI] [PMC free article] [PubMed] [Google Scholar]
- 30.Appleton KM, Newbury A, Almiron-Roig E, Yeomans MR, Brunstrom JM, de Graaf K, Geurts L, Kildegaard H, and Vinoy S (2021). Sensory and physical characteristics of foods that impact food intake without affecting acceptability: Systematic review and meta-analyses. Obesity Reviews 22. 10.1111/obr.13234. [DOI] [PMC free article] [PubMed] [Google Scholar]
- 31.Cummings DE, and Overduin J (2007). Gastrointestinal regulation of food intake. The Journal of clinical investigation 117, 13–23. 10.1172/JCI30227. [DOI] [PMC free article] [PubMed] [Google Scholar]
- 32.Fazzino TL, Rohde K, and Sullivan DK (2019). Hyper-Palatable Foods: Development of a Quantitative Definition and Application to the US Food System Database. Obesity 27, 1761–1768. 10.1002/oby.22639. [DOI] [PubMed] [Google Scholar]
- 33.Demeke S, Rohde K, Chollet-Hinton L, Sutton C, Kong KL, and Fazzino TL (2023). Change in hyper-palatable food availability in the US food system over 30 years: 1988–2018. Public health nutrition 26, 182–189. Pii S1368980022001227 10.1017/S1368980022001227. [DOI] [PMC free article] [PubMed] [Google Scholar]
- 34.Fazzino TL, Bjorlie K, Rohde K, Smith A, and Yi R (2022). Choices Between Money and Hyper-Palatable Food: Choice Impulsivity and Eating Behavior. Health Psychol 41, 538–548. 10.1037/hea0001185. [DOI] [PMC free article] [PubMed] [Google Scholar]
- 35.Overgaard RV, Hertz CL, Ingwersen SH, Navarria A, and Drucker DJ (2021). Levels of circulating semaglutide determine reductions in HbA1c and body weight in people with type 2 diabetes. Cell Rep Med 2, 100387. 10.1016/j.xcrm.2021.100387. [DOI] [PMC free article] [PubMed] [Google Scholar]
- 36.Overgaard RV, Navarria A, Ingwersen SH, Baekdal TA, and Kildemoes RJ (2021). Clinical Pharmacokinetics of Oral Semaglutide: Analyses of Data from Clinical Pharmacology Trials. Clin Pharmacokinet 60, 1335–1348. 10.1007/s40262-021-01025-x. [DOI] [PMC free article] [PubMed] [Google Scholar]
- 37.Meier JJ, Nauck MA, Kranz D, Holst JJ, Deacon CF, Gaeckler D, Schmidt WE, and Gallwitz B (2004). Secretion, degradation, and elimination of glucagon-like peptide 1 and gastric inhibitory polypeptide in patients with chronic renal insufficiency and healthy control subjects. Diabetes 53, 654–662. 10.2337/diabetes.53.3.654. [DOI] [PubMed] [Google Scholar]
- 38.Daniels D, and Mietlicki-Baase EG (2019). Glucagon-Like Peptide 1 in the Brain: Where Is It Coming From, Where Is It Going? Diabetes 68, 15–17. 10.2337/dbi18-0045. [DOI] [PMC free article] [PubMed] [Google Scholar]
- 39.Williams DL, Baskin DG, and Schwartz MW (2009). Evidence that intestinal glucagon-like peptide-1 plays a physiological role in satiety. Endocrinology 150, 1680–1687. 10.1210/en.2008-1045. [DOI] [PMC free article] [PubMed] [Google Scholar]
- 40.Scrocchi LA, Brown TJ, MaClusky N, Brubaker PL, Auerbach AB, Joyner AL, and Drucker DJ (1996). Glucose intolerance but normal satiety in mice with a null mutation in the glucagon-like peptide 1 receptor gene. Nat Med 2, 1254–1258. 10.1038/nm1196-1254. [DOI] [PubMed] [Google Scholar]
- 41.Song Y, Koehler JA, Baggio LL, Powers AC, Sandoval DA, and Drucker DJ (2019). Gut-Proglucagon-Derived Peptides Are Essential for Regulating Glucose Homeostasis in Mice. Cell Metab 30, 976–986 e973. 10.1016/j.cmet.2019.08.009. [DOI] [PMC free article] [PubMed] [Google Scholar]
- 42.Lampropoulos C, Alexandrides T, Tsochatzis S, Kehagias D, and Kehagias I (2021). Are the Changes in Gastrointestinal Hormone Secretion Necessary for the Success of Bariatric Surgery? A Critical Review of the Literature. Obes Surg 31, 4575–4584. 10.1007/s11695-021-05568-7. [DOI] [PubMed] [Google Scholar]
- 43.Papamargaritis D, and le Roux CW (2021). Do Gut Hormones Contribute to Weight Loss and Glycaemic Outcomes after Bariatric Surgery? Nutrients 13. 10.3390/nu13030762. [DOI] [PMC free article] [PubMed] [Google Scholar]
- 44.Yousseif A, Emmanuel J, Karra E, Millet Q, Elkalaawy M, Jenkinson AD, Hashemi M, Adamo M, Finer N, Fiennes AG, et al. (2014). Differential effects of laparoscopic sleeve gastrectomy and laparoscopic gastric bypass on appetite, circulating acyl-ghrelin, peptide YY3-36 and active GLP-1 levels in non-diabetic humans. Obes Surg 24, 241–252. 10.1007/s11695-013-1066-0. [DOI] [PMC free article] [PubMed] [Google Scholar]
- 45.Flint A, Raben A, Ersboll AK, Holst JJ, and Astrup A (2001). The effect of physiological levels of glucagon-like peptide-1 on appetite, gastric emptying, energy and substrate metabolism in obesity. International journal of obesity and related metabolic disorders : journal of the International Association for the Study of Obesity 25, 781–792. 10.1038/sj.ijo.0801627. [DOI] [PubMed] [Google Scholar]
- 46.Flint A, Raben A, Astrup A, and Holst JJ (1998). Glucagon-like peptide 1 promotes satiety and suppresses energy intake in humans. The Journal of clinical investigation 101, 515–520. 10.1172/JCI990. [DOI] [PMC free article] [PubMed] [Google Scholar]
- 47.Long SJ, Sutton JA, Amaee WB, Giouvanoudi A, Spyrou NM, Rogers PJ, and Morgan LM (1999). No effect of glucagon-like peptide-1 on short-term satiety and energy intake in man. The British journal of nutrition 81, 273–279. [PubMed] [Google Scholar]
- 48.Smits MM, and Holst JJ (2023). Endogenous glucagon-like peptide (GLP)-1 as alternative for GLP-1 receptor agonists: Could this work and how? Diabetes Metab Res Rev, e3699. 10.1002/dmrr.3699. [DOI] [PubMed] [Google Scholar]
Associated Data
This section collects any data citations, data availability statements, or supplementary materials included in this article.