

Abstract
Mitochondrial oxidative phosphorylation (OXPHOS) complexes are assembled from proteins encoded by both nuclear and mitochondrial DNA. These dual-origin enzymes pose a complex gene regulatory challenge for cells requiring coordinated gene expression across organelles. To identify genes involved in dual-origin protein complex synthesis, we performed FACS-based genome-wide screens analyzing mutant cells with unbalanced levels of mitochondrial- and nuclear-encoded subunits of Complex IV. We identified genes involved in OXPHOS biogenesis, including two uncharacterized genes: PREPL and NME6. We found that PREPL specifically impacts Complex IV biogenesis by acting at the intersection of mitochondrial lipid metabolism and protein synthesis, while NME6, an uncharacterized nucleoside diphosphate kinase (NDPK), controls OXPHOS biogenesis through multiple mechanisms reliant on its NDPK domain. First, NME6 forms a complex with RCC1L, which together perform NDPK activity to maintain local mitochondrial pyrimidine triphosphate levels essential for mitochondrial RNA abundance. Second, NME6 modulates the activity of mitoribosome regulatory complexes, altering mitoribosome assembly and mitochondrial RNA pseudouridylation. Taken together, we propose that NME6 acts as a link between compartmentalized mitochondrial metabolites and mitochondrial gene expression.
Introduction
Establishing the mitochondrial proteome requires coordinated gene expression programs across two distinct and physically separated genomes1-3. Mitochondria maintain an extrachromosomal genome (mtDNA), which in humans encodes 13 subunits of the oxidative phosphorylation (OXPHOS) complexes – enzymes responsible for cellular energy conversion and aerobic life. The remainder of the OXPHOS complex subunits are encoded in the nucleus, synthesized in the cytosol, and imported into mitochondria for proper complex assembly. This gene regulatory challenge is critical for the cell to overcome as dysfunctional mitochondria are implicated in a variety of human diseases, ranging from neurodegeneration to cancer4-8.
At every stage of mitochondrial gene expression, from mtDNA replication to transcription and translation, the mitochondrial genome is controlled by nuclear-encoded factors3. While the proteins known to control mitochondrial gene expression have expanded in recent years (for review, see9,10), a mechanistic understanding of these regulatory pathways, which likely contribute to the co-regulated expression of nuclear and mitochondrial-encoded OXPHOS subunits, remains unknown. Nuclear- and mitochondrial-encoded OXPHOS subunits are synthesized in a remarkably balanced manner across a variety of human cell lines11. Failure to synthesize the correct stoichiometries of OXPHOS subunits results in ‘mitonuclear imbalance’, which leads to cellular stress responses12-16. In addition, human mitochondria maintain an extensive proteolytic system poised to respond to misassembled OXPHOS subunits17. Mitonuclear imbalance caused by disruptions in mitoribosome subunit levels has been implicated in longevity and aging phenotypes in yeast, worms, and mice18-21. Thus, the establishment and maintenance of a healthy mitochondrial proteome via proper mito-cellular communication are critical for cellular physiology.
To identify regulators of mitonuclear balance, we performed FACS-based genome-wide CRISPR screens to uncover factors that altered the accumulation of two dual-genome encoded OXPHOS subunits of Complex IV – COX1 and COX4. Our screens found known regulators of OXPHOS gene regulation and assembly, as well as genes with uncharacterized mitochondrial functions whose depletion led to imbalanced OXPHOS subunit levels. We investigated two poorly characterized genes, PREPL and NME6, both of which altered Complex IV subunit accumulation but in opposite directions. We found that PREPL encodes a dual cytosolic- and mitochondrial-localized protein that is enriched in the brain and functions at the intersection of lipid metabolism and protein synthesis to regulate Complex IV biogenesis. Furthermore, we observed that NME6, an uncharacterized member of the nucleotide diphosphate kinase (NDPK) family, enzymes that catalyze the synthesis of nucleotide triphosphates (NTPs) via phosphate transfer to nucleotide diphosphates (NDPs)22-24, controls OXPHOS biogenesis through multifaceted mechanisms. We found that NME6, when bound to RCC1L exhibits NDPK activity, which is used to establish mitochondrial pyrimidine triphosphate pools essential for maintaining mitochondrial (mt)-encoded RNA abundance. Moreover, NME6 modulates the activity of mitoribosome regulatory factors, mt-RNA pseudouridylation, and MT-CO1 (COX1) transcript stability. Thus, we propose that NME6 is a key enzyme coordinating compartmentalized mitochondrial nucleotide pools with the regulation of mitochondrial gene expression. Altogether, these screens provide a resource of genes for further avenues of research into mito-cellular communication and the regulation of mitochondrial gene expression.
Results
CRISPR screens identify genes regulating mitonuclear balance
To uncover genetic regulators of mitonuclear balance, we designed a FACS-based genome-wide screen to identify factors controlling the levels of OXPHOS subunits destined for the same complex (Complex IV) but encoded by either nuclear or mitochondrial DNA (Fig. 1a). Complex IV assembly, a tightly orchestrated process requiring over 30 assembly factors26, begins with the synthesis of mitochondrial-encoded MT-CO1, which must bind nuclear-encoded COX4I1 (COX4) to initiate assembly27. We found that depleting COX4 with sgRNAs targeting COX4I1 led to both the predicted reduction in COX4 and a concurrent reduction in COX1, consistent with COX1 sensing and responding to COX4 levels, as described previously (Fig. 1b, c)27. Inhibitors of mitochondrial transcription and translation, ethidium bromide or chloramphenicol, respectively, reduced the levels of mitochondrial-encoded COX1 but not nuclear-encoded COX4 (Fig. 1b, c). Together, these data established the specificity and dynamic range of our FACS screening conditions and also suggested a directionality to Complex IV biogenesis with mitochondrial gene expression programs poised to respond to nuclear subunit levels.
Figure 1.

Genome-wide CRISPR screens identify regulators of mitonuclear balance. (a) Dual genome-encoded Complex IV biogenesis initiates with synthesis of mito-encoded COX1 and nuclear-encoded COX4. (b) FACS immunostaining of COX1, COX4, and ACTB levels after mitochondrial transcriptional inhibition with ethidium bromide (EtBr; 2 μg/mL, 3 days) or with sgRNAs targeting nuclear-encoded COX4I1 in K562-Cas9 cells. (c) Western blot analysis after ethidium bromide treatment (2 μg/mL, 5 days), chloramphenicol treatments (CAP; 200 μg/mL, 5 days), or COX4 knockdown (COX4I1 targeting sgRNA or non-targeting (NT) control sgRNA). Representative blot of 3 independently repeated experiments. (d) Schematic of genome-wide FACS-based CRISPR screening approach to measure mito-nuclear subunit expression. sgRNA libraries include 10 sgRNAs/gene and ~10,000 negative control sgRNAs. Cells were fixed, immunostained, and sorted based on expression levels of mito- and nuclear-encoded Complex IV (CIV) subunits (COX1 and COX4, respectively) after 10-14 days. DNA was purified from sorted (Gates A - D) and unsorted control cells to determine sgRNA enrichment or depletion from populations of interest. (e, f) Volcano plots summarizing gene knockout (KO) effect (enrichment or depletion of sgRNAs in the sorted population relative to unsorted controls) vs. confidence scores (blue or green points: hits < 10% FDR; screens were performed in duplicate, independently; analyzed by MAGeCK, see methods). COX4I1 and hits studied in more detail are shown in red. Significantly enriched gene ontology terms for positively selected genes (GO Biological Process, PANTHER: Fisher’s exact test with FDR) are shown below. Source numerical data and unprocessed blots are available in source data.
To perform these screens, we measured endogenous levels of mitochondrial- (COX1) and nuclear- (COX4) encoded subunits using FACS in K562-Cas9 cells transduced with a genome-wide single guide RNA (sgRNA) library (10 sgRNAs per gene targeting ~21,000 human nuclear-encoded genes and ~10,000 safe-targeting control sgRNAs; Fig. 1d)28. By analyzing cells with altered levels of both nuclear and mitochondrial derived subunits, as well as cells with disrupted ratios of nuclear/mitochondrial subunits, we disentangled genes generally required for mitochondrial health from genes controlling either specific nuclear or mitochondrial gene expression pathways (Fig. 1e, f, Fig. ED1a-c).
Our screens revealed known players in mitochondrial biology, as well as many unknown genetic regulators of OXPHOS biogenesis (Fig. 2a, Table S1). Positive control sgRNAs targeting COX4I1 behaved in our screens as predicted, as did genes known to control mitochondrial gene expression at various stages, including mitochondrial transcription (e.g., TFB2M, POLRMT), mtRNA processing (e.g., PDE12, FASTKD5), mitoribosome subunits and translation factors (e.g., TUFM, C12ORF65/MTRFR, TACO1), and Complex IV assembly factors (e.g., COA3, COA5, COA7, PET117). However, many hits were genes with unknown functions in mitochondrial biology, and several had predicted mitochondrial localization in MitoCarta3.029 (Fig. 2a).
Figure 2.

Summary of OXPHOS biogenesis regulators identified by CRISPR screens. (a) Schematic of selected genes (FDR < 10%) grouped by subcellular localization and reported functions. Genes predicted to localize to mitochondria (present in MitoCarta3.0), but with uncharacterized functions in mitochondrial biology are highlighted in red (TFs = transcription factors). (b) FACS validation of individual sgRNAs in methanol-fixed K562 cells, 10 days post-transduction (NT = non-targeting control sgRNA). (c) Western blot validation of individual sgRNAs, 10 days post-transduction. Representative blot of 3 independently repeated experiments. (d) Western blot analysis and quantification of COX1 and COX4 levels in PREPL and NME6 homozygous KO K562 cells (2 independently generated clonal KO lines quantified each; normalized to ACTB levels). Source numerical data and unprocessed blots are available in source data.
We validated our top hits by infecting cells with individual sgRNAs targeting genes of interest, and measuring COX1, COX4, and ACTB levels by FACS to control for non-specific translation effects (Fig. 2b). Using immunoblots, we confirmed that many hits (~50 genes tested) altered COX1, COX4, and ACTB expression in the directions predicted from our FACS screens (Fig. 2c, Fig. ED2a). We further screened these hits by assessing mitochondrial content (MitoTrackerRed), TFAM levels (as a proxy for mtDNA levels), and Complex V subunit levels to disentangle general mitochondrial regulators from Complex IV specific regulators (Fig. ED2b, c). We then characterized two top hits with uncharacterized mitochondrial functions, which altered COX1/COX4 ratios in opposite directions: PREPL (deletion led to a decreased COX1/COX4 ratio) and NME6 (deletion led to an increased COX1/COX4 ratio) (Fig. 1e, f). We generated homozygous knockout (KO) clones of PREPL and NME6 using CRISPR and confirmed their imbalance phenotypes (Fig. 2d).
Mitochondrial PREPL regulates Complex IV biogenesis
PREPL (prolyl-endopeptidase like) is a human disease gene of unknown function, in which mutations cause congenital myasthenic syndrome30-35. PREPL deletion in K562 cells caused a reduction in mitochondrial-encoded COX1 while nuclear-encoded COX4 remained near wild type levels. Reintroduction of cDNA encoding PREPL into PREPL KO cells rescued these phenotypes (Fig. 3a). PREPL is documented in MitoCarta3.029; however, we observed that endogenous PREPL is both cytosolic- and mitochondrial-localized using subcellular cytosolic and mitochondrial fractionation (Fig. 3b). We found two dominant PREPL isoforms expressed in K562 cells – a shorter cytosolic isoform (PREPL(s)) and a longer mitochondrial isoform (PREPL(L)), consistent with recent observations in HEK293T cells36. We verified a mitochondrial matrix localization for PREPL(L) using STED superresolution microscopy (Fig. 3d, ED3a, b). Furthermore, we observed that PREPL forms a high molecular weight species when localized to mitochondria, suggesting that dimerization may contribute to its function (Fig. ED3d, e). Analysis of various mouse tissues revealed a strong tissue isoform specificity, and high PREPL expression in the brain (Fig. 3c).
Figure 3.

PREPL, a brain-enriched, dual-localized protein, regulates Complex IV biogenesis. (a) Representative western blots of COX1 and COX4 subunit levels in NT (non-targeting control sgRNA), PREPL KO, and PREPL KO rescue cells (PREPL(L) = PREPL-Flag, long isoform). Representative blot of 3 repeated experiments. (b) Subcellular fractionation and western blotting for endogenous PREPL or exogenous PREPL(L)-Flag (WC = whole cell, cyto = cytosol fraction, mito = mitochondrial fraction, PREPL(s) = PREPL-short isoform). Representative blot of 3 repeated experiments. (c) Schematic representation of short and long PREPL protein isoforms and representative western blot detection of PREPL expression and isoform usage across mouse tissues (C57BL/6, 8 week-old, males; Representative blot of 2 independently repeated experiments). (d) Left: Representative micrographs of confocal and STED microscopy in U2OS cells transduced with PREPL(L)-Flag, immunostained with anti-Flag and anti-TOMM40 (outer mitochondrial membrane marker) antibodies. Right: pixel intensity line scans of fluorescence channels across the indicated dashed line (green = FLAG, magenta = TOMM40 or LRPPRC, matrix marker, Fig. ED3a for micrograph; scale bars = 10 μm confocal panel, 500 nm STED panels; experiment repeated twice). (e) Blue-native PAGE (BN-PAGE) followed by western blot detection (indicated antibody above) of native OXPHOS Complexes I-V. Representative blots of 3 independent experiments. (f-h) Seahorse extracellular flux assays to measure OCR linked to Complex I (f) or Complex IV (g) in permeabilized K562 cells supplemented with indicated substrates. (h) Quantification of state 3 respiration defined as the difference between maximal respiratory capacity after addition of substrates specific for Complex I or Complex IV and respiratory capacity after complete inhibition of the respective complex (OCR = oxygen consumption rate, ns = non-significant, **** p < 0.0001, n = 4 independent cultures, 2-way ANOVA with Sidak’s multiple comparisons correction, data are means +/− standard deviation (SD)). (i) Seahorse assay measuring OCR in live cells with mitochondrial stressors (FCCP = carbonyl cyanide-p-trifluoromethoxyphenylhydrazone, AA = antimycin A, perm = XF Plasma Membrane Permeabilizer, ADP = adenosine diphosphate, pyr+mal = pyruvate and malate, TMPD/Asc = N,N,N,N-tetramethyl-p-phenylenediamine/ascorbate; n = 4 (control and KO+PREPL) or 5 (PREPL KO) independent cultures). Source numerical data and unprocessed blots are available in source data.
Loss of PREPL led to specific reductions in Complex IV levels, including the monomeric, dimeric, and supercomplex assemblies as determined by Blue Native PAGE (BN-PAGE); and furthermore, Seahorse analysis of specific OXPHOS-linked respiratory activity demonstrated Complex IV dysfunction without major Complex I disruption (Fig. 3e-h). Disruptions to Complex IV levels and activity led to basal respiratory defects in PREPL KO cells (Fig. 3i), which were rescued by mitochondrial-PREPL(L) expression. To investigate the mechanisms by which PREPL regulates Complex IV biogenesis, we identified PREPL(L) protein-interactors using immunoprecipitation (IP)/mass spectrometry and found that PREPL(L) interacted with mitochondrial proteins significantly enriched for GO terms, including ‘mitochondrial translation’ and ‘fatty acid beta-oxidation’, suggesting a possible link between lipid metabolism and mitoribosome function (Fig. 4a, ED4a, b, Table S2).
Figure 4.

PREPL thioesterase activity mediates Complex IV biogenesis. (a) Gene ontology terms for proteins identified by immunoprecipitation(IP)/mass spectrometry and significantly enriched in PREPL(L)-Flag IPs relative to control IPs (Panther: GO Biological Process, Fisher’s exact test with FDR). (b) Cell proliferation measured by CellTiter-Glo in human plasma like media (HPLM) supplemented with standard FBS (left) or charcoal-stripped FBS (right); S559A = PREPL(L) with serine 559 mutated to alanine (left, n = 5 independent cultures; right, n = 6 independent cultures, 2-way ANOVA with Tukey’s multiple comparisons correction, **** p < 0.0001). (c) Representative western blot analysis of OXPHOS subunits in control (NT), PREPL KO, and KO cells transduced with long or short PREPL isoforms with or without S559A mutation. Experiments repeated twice. (d) Seahorse assay measuring OCR in live cells grown in HPLM + charcoal-stripped FBS with mitochondrial stressors (FCCP = carbonyl cyanide-p-trifluoromethoxyphenylhydrazone, AA = antimycin; n = 5 independent cultures). (e) Western blotting in PREPL-Flag expressing K562 cells on fractions collected from 10-50% sucrose gradients after ultracentrifugation (MRPS18B = small mitoribosome subunit, MRPL12 = large mitoribosome subunit). Representative blot of 2 independent experiments. (f) Left: 35S-methionine metabolic labeling for 30 or 60 min. in the presence of anisomycin (100 ug/mL) followed by autoradiography of mitochondrial translation products and western blotting of ACTB to control for loading. Right: Quantification of COX1 synthesis or total protein synthesis (summed intensity of all bands) normalized to loading controls and plotted relative to NT control samples for each gel (CAP = chloramphenicol, 50 ug/mL; n = 4 independent experiments; Fig ED3 for replicate gels, 2-way ANOVA with Sidak’s multiple comparisons correction, 30 min: ****p<0.0001, 60 min: ***p=0.003). Data are means +/− SD for all plots; ns = non-significant. Source numerical data and unprocessed blots are available in source data.
To test the involvement of lipid metabolism in PREPL function, we measured cell proliferation of PREPL KO cells cultured in standard or charcoal-stripped (lipophilic molecule-depleted) serum. We found that PREPL KO cells exhibited decreased proliferation only in charcoal-stripped FBS, suggesting a role for PREPL in lipid utilization (Fig. 4b). A recent study reported thioesterase activity for PREPL in vitro implicating an active serine residue (S559), as part of a catalytic triad in a putative lipid binding pocket36. By expressing WT or S559A mutant PREPL(L) in PREPL KO cells, we found that S559A-PREPL phenocopied the PREPL KO proliferation defect while WT-PREPL fully restored proliferation levels to those of control cells (Fig. 4b). Moreover, only mitochondrial-localized WT-PREPL(L), but not cytosolic PREPL(s) or S559A mutants, was sufficient to rescue the reduction in COX1 subunit levels (Fig. 4c, ED4g). While we observed small perturbations to mtDNA-encoded OXPHOS subunits in charcoal-stripped media upon PREPL loss, COX1 levels were impacted most severely, with a near complete loss (Fig. ED4g). Additionally, S559A-PREPL was unable to rescue respiratory defects in PREPL KO cells grown in lipid depleted media (Fig. 4d). Consistent with its thioesterase activity and the possible lipid binding pocket observed in its structure36, our data suggest that PREPL is involved in mitochondrial lipid metabolism.
Since GO terms for PREPL protein interactors were also enriched for ‘mitochondrial translation’, we investigated whether PREPL functions via mitochondrial protein synthesis. Using sucrose gradient ultracentrifugation, we observed that PREPL co-sediments with mitoribosomes, up to the assembled monosome fraction (Fig. 4e, ED4c, d). To test the impact on newly synthesized mitochondrial proteins, we performed 35S-methionine labeling. We found that PREPL KO specifically reduced COX1 synthesis without major changes in mtDNA levels, mt-RNA levels, COX1 RNA processing, poly(A) tail length, COX1 subunit turnover, or COX1 translational activator TACO1 levels (Fig. 4f, ED3c, ED4e-f, ED5a-b, ED6a-c). Together, our data suggest that PREPL is a brain-enriched, dual cytosolic- and mitochondrial-localized protein that specifically controls Complex IV biogenesis connecting thioesterase activity to the regulation of mitochondrial translation.
NME6 regulates mitochondrial respiration and OXPHOS biogenesis
Our screens predicted that NME6 mutation disrupts Complex IV subunit ratios by upregulating mitochondrial-encoded COX1 – opposite to the PREPL deletion. NME6, an uncharacterized nucleoside diphosphate kinase (NDPK), contains a highly conserved histidine within its predicted NDPK domain, residues typically used by NDPK enzymes for phosphate transfer22 (Fig. 5a). NME6 is predicted to be an essential gene based on large-scale mouse KO consortia (IMPC; MGI:1861676). While NME6 has no predicted mitochondrial targeting sequence, it is included in MitoCarta3.029. We observed that NME6 localized to the mitochondrial matrix using a combination of confocal microscopy, subcellular fractionations, and Proteinase K protection assays (Fig. 5b, c). NME6 loss led to reduced cellular proliferation in the ‘physiological’ human plasma-like media, consistent with genome-wide screens37 (HPLM; Fig. 5d). Reduced proliferation was concurrent with decreased basal and maximal respiration rates (Fig. 5f) and dysregulated OXPHOS subunit levels (Fig. 5e). To test whether these phenotypes relied on the predicted NDPK activity of NME6, we exogenously expressed NME6 with the highly conserved histidine mutated to alanine (H137A), which, in contrast to WT-NME6, was unable to rescue the phenotypes in NME6 KO cells (Fig. 5d-f).
Figure 5.

Loss of NME6 disrupts OXPHOS biogenesis and mitochondrial respiration. (a) Schematic of NDPK family members and protein sequence alignment indicating the highly conserved active-site histidine 137 in NME6 (shading represents level of conservation by percent identity using Clustal Omega NME1–NME2 = 88%, NME1–NME4 = 55%, NME1–NME6 = 25%). (b) Representative micrographs of U2OS cells transduced with NME6-Flag, immunostained with anti-Flag and anti-LRPPRC antibodies (green = Flag, magenta = LRPPRC, blue = DAPI; scale bar = 10 μm). Experiment repeated twice. (c) Subcellular fractionation and Proteinase K (PK) digestion of mitochondria in the presence or absence of Triton X-100 (TX-100) detergent followed by western blotting with indicated antibodies (WC = whole cell, cyto = cytosol fraction, mito = mitochondrial fraction, NT= non-targeting sgRNA, KO = NME6 KO). Representative blot of 2 independently repeated experiments. (d) Cell proliferation measurements at day 4 relative to day 0 in control (NT) and NME6 KO cells measured by CellTiter-Glo in HPLM media (n = 4 independent cultures, one-way ANOVA with Tukey’s multiple comparisons correction, **** p < 0.0001). (e) Representative western blots of COX1, COX4 (Complex IV) and CYTB (Complex III) subunit levels in control (NT), KO, and WT/H137A rescue cells. (f) Seahorse assay assessing OCR in live cells using mitochondrial stressors (FCCP = carbonyl cyanide-p-trifluoromethoxyphenylhydrazone, AA = antimycin A; n = 5 independent cultures). (g) Blue-native PAGE (BN-PAGE) followed by western blot detection (indicated antibody above) of native OXPHOS Complexes I-V in control, NME6 KO, or KO cells expressing WT- or H137A-NME6. (h) Seahorse extracellular flux assays to measure OCR in Complex I or Complex IV in permeabilized K562 cells supplemented with indicated substrates. (perm = XF Plasma Membrane Permeabilizer, ADP = adenosine diphosphate, pyr+mal = pyruvate and malate, TMPD/Asc = N,N,N,N-tetramethyl-p-phenylenediamine/ascorbate; Complex I: n = 6 independent cultures; Complex IV: n = 3 (NT), n = 5 (NME6 KO) independent cultures). (i) In vitro Complex IV enzymatic activity with indicated mitochondrial lysate amounts (n = 2 biological replicate lysates per protein input, experiments were repeated 2 independent times; lines represent non-linear fit for the dose response curves). (j) Representative electron micrographs of mitochondrial cristae structure by transmission electron microscopy in NT and NME6 KO cells (scale bar = 800 nm, 116 nm inset; representative micrograph from 10 field of views). Data are all means +/− SD. Source numerical data and unprocessed blots are available in source data.
We next asked what mechanisms could lead to the proliferation and respiration phenotypes caused by NME6 loss. Because NME6 KO cells had elevated COX1 levels, we tested whether these increased subunits were being integrated into fully assembled complexes and, if so, why increased Complex IV levels would lead to respiratory defects. Interestingly, we found that NME6 loss had differential effects across OXPHOS Complexes; NME6 KO cells had elevated Complex IV levels but decreased levels of Complex I and III assemblies, leading to reduced supercomplex assemblies. These phenotypes were all reliant on H137A (Fig. 5g). We confirmed the Complex IV upregulation in NME6 KO cells by measuring the Complex IV enzymatic activity in vitro from WT and NME6 KO mitochondrial lysates (Fig. 5i, ED6d). Furthermore, analysis of OXPHOS complex specific respiratory activity demonstrated disruptions to Complex I activity (Fig. 5h). OXPHOS assembly dysregulation across complexes in NME6 KO cells was further accompanied by defects in mitochondrial cristae morphology (Fig. 5j). Together, NME6 deletion led to disrupted OXPHOS biogenesis and abnormal respiration – phenotypes reliant on a conserved histidine in the NDPK domain of NME6.
NME6 loss disrupts mt-RNA abundance
Next, we addressed the mechanism by which NME6 acts to regulate mitochondrial gene expression. To test whether mitochondrial RNA transcripts were affected by NME6 KO, we measured their abundance using a MitoStrings panel38, which directly measures RNA levels with NanoStrings technologies. These data indicated that the majority of mt-RNAs were downregulated in NME6 KO cells, most severely MT-CYB, but with the notable exceptions of MT-RNR1, MT-RNR2, and MT-CO1, which are more proximal to the heavy strand promoter and were, by contrast, upregulated (Fig. 6a). These changes were not due to alterations in mtDNA copy number (Fig. 6b). The disruptions in mt-RNA abundances were consistent with the native OXPHOS complex biogenesis defects we observed where Complex IV was upregulated while Complexes I and III were downregulated (Fig. 5g). NME6 KO did not phenocopy the mutation of the transcription initiation factor TFB2M, which showed near equal reduction across all mitochondrial-encoded transcripts (Fig. ED6e). To test the transcriptional competence of mitochondria lacking NME6, we pulse-labeled purified mitochondria with 32P-UTP and visualized newly transcribed RNAs with autoradiography (Fig. ED7a, b). In these bulk measurements, NME6 KO did not cause large-scale changes in the levels of newly-synthesized transcripts, indicating that NME6 KO-mediated changes in RNA levels were not due to a broad inhibition of transcriptional machinery.
Figure 6.

Loss of NME6 regulates mtRNA abundance due to disruption of mitochondrial pyrimidine pools. (a) Left: schematic of human mitochondrial DNA and right: mRNA abundance quantified by MitoStrings (normalized to nuclear-encoded NDUFA7; p < 0.05 unless otherwise stated, ns = non-significant; n = 3 independent cultures; experiment repeated 3 times independently). (b) qPCR measurements of mtDNA levels normalized to nuclear DNA (mito target = MT-TL1, nuclear target = B2M; n = 4 replicates across 2 independent experiments). Metabolites detected from (c) whole cell or (d) mito-IP lysates using LC-MS (data normalization detailed in methods; n = 3 (whole cell) or 4 (mito-IP) independent cultures per experiment; two-way ANOVA with Dunnett’s multiple comparisons correction, * p = 0.0205, ** p = 0.0048 , *** p = 0.0008 (UMP) , *** p = 0.0003 (CDP) ,**** p < 0.0001). (e) Seahorse assay assessing OCR in live cells using mitochondrial stressors in media supplemented with or without uridine (FCCP = carbonyl cyanide-p-trifluoromethoxyphenylhydrazone, AA = antimycin A; n = 3 independent cultures). (f) qRT-PCR measurements of MT-CO1 and MT-CYB in NT, NME6 KO, KO+NME6-WT cells supplemented with or without uridine (72hr., 50 μg/mL; n = 3 biological replicates, one-way ANOVA with Tukey’s multiple comparisons correction). (g) 4sU transcript incorporation measured by metabolic labeling in control (NT) or NME6 KO cells. Left: schematic of the experimental approach. Right: unlabeled RNAs quantified by MitoStrings (normalized to unlabeled spike-in control; p < 0.05 unless otherwise stated, ns = non-significant; n = 3 independent cultures, experiment repeated independently twice). Data are all means +/− SD. Source numerical data are available in source data.
NME6 establishes mitochondrial pyrimidine pools
As our data implicated the NDPK domain of NME6 for its function, we asked whether NME6 was responsible for maintaining local concentrations of mitochondrial nucleotides. By profiling metabolites using mass spectrometry in whole cell lysates, we observed an accumulation of nucleoside monophosphates, including CMP, UMP, and GMP, in NME6 KO cells, suggesting a possible dysregulation of nucleotide biosynthesis; however, only CMP and UMP were dependent on H137A, indicating a role for NME6 specifically in the regulation of pyrimidine levels (Fig. 6c, ED8, Table S3). Since whole cell metabolite levels may misrepresent mitochondrial metabolite pools, we analyzed mitochondrial-specific metabolite pools using rapid mitochondrial immunoprecipitation (mito-IP)39. We found that NME6 KO led to the abnormal mitochondrial accumulation of mono- and diphosphate pyrimidines without disruptions in mono- and diphosphate purine pools or other general metabolite levels (Fig. 6d, ED8b-g), indicating a disruption in pyrimidine NTP synthesis in NME6 KO mitochondria. Isotope tracing with 13C-glucose followed by mito-IP and metabolite profiling confirmed disruptions to mitochondrial pyrimidine pools with higher 13C labeling of the pyrimidine mono- and diphosphates nucleosides (Fig. ED8c-f). To determine if disrupted pyrimidine homeostasis was the cause of the perturbed mt-RNA abundances and respiratory activity observed in NME6 KO mitochondria, we supplemented NME6 KO cells with uridine for 72 hours (a precursor for pyrimidine NTP biosynthesis). We found that uridine was sufficient to rescue both the altered respiration and downregulated MT-CYB mRNA but did not impact upregulated MT-CO1 mRNA in NME6 KO cells (Fig. 6e, f).
These results suggest that NME6 establishes local pyrimidine NTP levels within mitochondria, which in turn modulates mitochondrial gene expression. Because of the alterations in both steady-state mt-RNA abundance and pyrimidine levels in NME6 KO cells, we tested whether UTP incorporation into mitochondrial transcripts was disrupted upon loss of NME6 using 4-thiouridine (4sU) metabolic labeling (Fig. 6g). NME6 KO cells showed reduced 4sU incorporation into all of the mt-RNAs measured (the highly stable rRNAs did not pass our statistical cut-off), but not into three control nuclear-encoded RNAs. Taken together, these results suggest that NME6 regulates mt-RNA abundance through the establishment of local mitochondrial triphosphate pyrimidine pools.
NME6 interacts with RCC1L to perform NDPK activity
While we observed disrupted pyrimidine homeostasis in NME6 KO mitochondria, due to technical limitations, we did not detect significant NTP levels after mito-IP. Therefore, we tested NDPK activity using recombinant proteins and in vitro NDPK assays. Consistent with previous reports suggesting low NDPK activity by NME6, we were unable to detect ATP hydrolysis, the first step of the NDPK reaction, by NME6 alone24. However, NME6 has been reported to interact with the putative guanine exchange factor, RCC1L (WBSCR16), another hit in our screen, which is a poorly characterized protein with connections to mitoribosome assembly40-42. Using IP-mass spectrometry, we confirmed that NME6 and RCC1L interact and found that they bind each other with high specificity43 (Fig. 7a, Table S2). Moreover, in a co-IP analysis, we observed that NME6/RCC1L interactions were reduced in H137A-NME6 mutant cells relative to WT-NME6 and that the stability of either protein depended on the presence of the other. Strikingly, RCC1L knockdown to ~50% of WT levels led to near complete loss of NME6 (Fig. 7b, c, ED9a).
Figure 7.

NME6 and RCC1L together perform NDPK activity in vitro. (a) IP-mass spectrometry identification of proteins interacting with NME6-Flag or RCC1L-Flag in purified mitochondria (colored points = p < 0.05 and log2(fold-change) > 2 indicated by dashed lines, two-tailed Welch’s t-test). (b) Co-IP analysis of anti-Flag pulldowns in control (NT), NME6 KO, NME6 KO + WT-NME6-Flag, NME6 KO + H137A-NME6-Flag, or NT + RCC1L-Flag cells. Representative blot of 3 independently repeated experiments. (c) Western blot analysis of protein levels in NME6 KO cells or RCC1L knock-down cells (RCC1L sgRNA). Representative blot of 3 independently repeated experiments. (d) Outline of in vitro assays to test NDPK function using recombinant 6xHis-NME6 (WT or H137A) and GST-RCC1L (TLC = PEI cellulose, thin layer chromatography). (e) ATP hydrolysis assays with recombinant RCC1L, NME6-WT, or NME6-H137A using a malachite green phosphate assay to measure the liberation of free orthophosphate after the addition of ATP (monitored with absorbance at 600 nm (n = 6 wells, experiment repeated 3 independent times; data are means −/+ SD). (f) In vitro binding of RCC1L and NME6 using glutathione agarose bead pull downs and immunoblotting with indicated antibodies (top) and (bottom) protein phosphorylation analysis using SDS-PAGE and autoradiography after incubation with γ-32P ATP. Representative blot of 3 independently repeated experiments. (g) Thin layer chromatography (PEI-cellulose plates,1.2M LiCl solvent) analysis of NTP formation using autoradiography. Cold UDP or cold CDP were used as acceptor nucleotides for phosphate transfer reactions (representative TLC plate from 3 independent experiments). (h) Model of NDPK activity by NME6/RCC1L. Briefly, RCC1L is required for initial ATP hydrolysis (step 1), NME6 is phosphorylated at H137 (step 2), and phosphate is transferred from NME6-H137 to acceptor diphosphate nucleosides (step 3). Source numerical data and unprocessed blots are available in source data.
When we studied both NME6 and RCC1L using in vitro NDPK assays we found that RCC1L alone hydrolyzed ATP (Fig. 7d-h, ED8h). We investigated whether NME6 becomes phosphorylated at its conserved histidine by this hydrolyzed phosphate by examining NME6 and RCC1L bound in the presence of [γ32P]ATP. We observed phosphorylation of WT-NME6 but not H137A-NME6 or RCC1L (step 2) (Fig. 7f). This phosphate could then be transferred from NME6 in the presence of acceptor diphosphate nucleotides, forming triphosphate nucleotides, as detected by TLC (step 3) (Fig. 7g). These data indicate that NME6 and RCC1L function as a heterodimer to perform NDPK activity in mitochondria (Fig. 7h), resolving conflicting data from previous reports24,40.
NME6 regulates mitoribosome assembly and pseudouridylation
Due to the strong co-dependence of NME6 and RCC1L, we confirmed previous reports that RCC1L interacts with a larger module of mitoribosome associated proteins that regulate 16S rRNA stability and RNA pseudouridylation levels, including TRUB2, RPUSD4, and RPUSD344,45 (Fig. ED10, Table S2). We next asked whether NME6 loss altered mitoribosome biogenesis and mt-RNA pseudouridylation similar to studies of RCC1L and the associated pseudouridine synthases41,45. We found that NME6 co-sediments with mitoribosomes in sucrose gradients and NME6 KO cells showed assembly defects through disruptions of mainly the small mitoribosome subunit (Fig. ED9b-f). Using CMC-sequencing, NME6 KO cells displayed a ~2-fold increase in pseudouridylation at a previously reported modification site within MT-CO1 mRNA (chrM: 6293), and decreased pseudouridine levels within MT-TL1 (chrM: 3258). Both modifications were restored to wild-type levels by WT-NME6 expression (Fig. 8a). NME6 KO did not cause any alteration in the pseudouridine levels in MT-RNR2 (chrM: 3067), a site previously shown to be regulated by the pseudouridine synthase, RPUSD4, which we confirmed here44.
Figure 8.

NME6 KO disrupts mt-RNA pseudouridylation levels increasing MT-CO1 RNA stability and synthesis. (a) CMC-sequencing of NT, NME6 KO, KO+NME6-WT, and RPUSD4 knockdown (KD) cells to measure pseudouridine levels at three high confidence modification sites in MT-CO1, RNR2 and MT-TL (n = 3 (KO+NME6-WT, RPUSD4 KD) or 4 (NT, NME6) biological replicates across 3 independent sequencing experiments and 2 independently generated clonal KO cell lines for NME6, one-way ANOVA with Tukey’s multiple comparisons corrections). (b) qRT-PCR measurements of MT-CO1 mRNA levels after treatment with IMT1B (500nM) for indicated time in NT or NME6 KO K562 cells (data normalized to ACTB and plotted relative to 0 hr. levels; n = 5 (0 hr., 2 hr., 4 hr., 6hr.), 3 (1hr.), or 2 (8hr.) independent cultures from 2 independent experiments; * p = 0.029,*** p = 0.0006, **** p < 0.0001; two-way ANOVA with Sidak’s multiple comparisons correction). (c) Ribosome profiling analysis plotting synthesis (TPM = transcript per million) representing mitoribosome protected footprints mapped to MT-CO1 or MT-CYB (n = 2 independent sequencing experiments). (d) Schematic of NME6 function linking local mitochondrial metabolites to the regulation of mitochondrial gene expression. NME6 functions as a heterodimer with RCC1L which together perform NDPK activity to regulate mitochondrial pyrimidine levels. Upon deletion of NME6, mitochondrial pyrimidine homeostasis is disrupted leading to decreased levels of most mt-RNAs, with the exception of MT-CO1. NME6/RCC1L further interact with mitoribosome associated assembly factors and alter the activity of pseudouridine synthases (Ψ = pseudouridine modified base). Bar plots all represent means +/− SD. Source numerical data are available in source data.
While the function of pseudouridine mRNA modifications is unclear, especially in mitochondria46,47, they can enhance translation of mRNA-based therapeutics48-51. We reasoned that altered MT-CO1 pseudouridylation levels may impact mRNA stability or translation. After inhibiting the mt-RNA synthesis with the specific inhibitor, IMT1B, we observed increased MT-CO1 mRNA stability in NME6 KO cells (Fig. 8b)52. Furthermore, MT-CO1 mRNA had a higher mitoribosome occupancy compared to control cells, indicating that greater MT-CO1 stability leads to increased synthesis and greater COX1 protein levels (Fig. 8c). On the other hand, transcripts downregulated in NME6 KO, such as MT-CYB, showed lower mitoribosome occupancy (Fig. 8c, ED7c). Thus, in complex with RCC1L, NME6 regulates mitochondrial nucleotide levels, mitoribosome biogenesis, and mt-RNA abundances (Fig. 8d).
Discussion
Here, we performed genome-wide screens to find regulators of mitonuclear balance. In addition to well-established OXPHOS regulators, among our top-ranked hits were several genes with uncharacterized functions in mitochondria. Thus, we believe these screens provide a high-quality resource for investigating OXPHOS biogenesis. We focus on two genes here, PREPL and NME6; out of the many we predict to regulate OXPHOS biogenesis. We found that both PREPL and NME6 connect mitochondrial metabolism to mtDNA expression, highlighting the potential of mitochondrial gene expression to respond to the local metabolic state.
Analysis of mutants with both increased and decreased OXPHOS subunit abundances allowed us to uncover positive and negative regulators of Complex IV biogenesis. These results are complementary to cell death or growth screens with OXPHOS inhibitors to uncover OXPHOS regulators45,53. The majority of our hits impacted levels of mitochondrial-encoded COX1 more so than nuclear-encoded COX4, suggesting that mitochondrial gene expression is dynamic and prone to multiple sources of regulation, a phenomenon also observed recently in genome-scale Perturb-seq studies54.
PREPL, encodes a putative oligoserine peptidase and mutations in PREPL cause congenital myasthenic syndrome 22 (CMS22; OMIM #616224)31, a recessive disorder characterized by neuromuscular transmission defects, neonatal hypotonia, and growth hormone deficiencies. While PREPL KO mice exhibit growth and hypotonia phenotypes55, the molecular mechanisms of PREPL function remain elusive and peptide substrates have not been identified56,57. We found that within the mitochondrial matrix, PREPL(L) associates with protein synthesis machinery leading to defects in COX1 synthesis. Furthermore, PREPL phenotypes were dependent on a serine residue previously implicated in thioesterase function in vitro36. Our data now establish the importance of PREPL thioesterase activity in human mitochondria suggesting that PREPL functions at the interface of lipid metabolism and mitoribosome function. Various mitochondrial fatty acid synthesis pathways impact OXPHOS biogenesis and assembly within the mitochondrial inner membrane. For example, thioester linkages formed through the conserved serine residues of mitochondrial acyl carrier proteins regulate the biogenesis of specific OXPHOS complexes in yeast and human cells58,59. Considering that PREPL has thioesterase activity and co-sediments with the mitoribosome, we speculate that PREPL functions to regulate the co-translational membrane insertion of COX1, and in turn, Complex IV biogenesis.
We observed a significant tissue specificity of PREPL expression and isoform usage with an enrichment of PREPL in the brain, consistent with its genetic involvement in CMS22. In a global analysis, PREPL interacted with the mitoribosome in a tissue-specific manner60. Understanding the tissue-specificity and function of the PREPL isoforms will illuminate the function of PREPL in both physiology and disease.
Next, we characterized NME6, a gene that, when mutated, led to the increased mitochondrial-encoded COX1. Our data show that NME6 is mitochondrial localized and plays a key role in regulating mitochondrial gene expression through its conserved NDPK domain. Despite respiratory and proliferation phenotypes, NME6 KO did not simply lead to general reductions in OXPHOS biogenesis. But rather, NME6 is involved in multifaceted OXPHOS gene regulation playing differential roles across each complex.
NME6 KO cells had decreased levels of most mt-mRNAs, with pronounced exceptions (MT-RNR1, MT-RNR2, MT-CO1). While NME6-deficient mitochondria remained broadly transcriptionally competent, our transcriptomics and metabolomics data indicate that NME6 regulates mitochondrial pyrimidine homeostasis via its NDPK domain, consistent with a recent study61. NME6 binds specifically to RCC1L and their stabilities rely on the presence of one another, suggesting they exist as an obligate heterodimer. Furthermore, NME6 functions as a NDPK enzyme, but it requires ATP hydrolysis by RCC1L to receive and transfer phosphate groups to an acceptor NDP – a distinct mechanism compared to canonical NPDK enzymes62. However, this role is insufficient to explain the upregulated MT-CO1 mt-RNA abundance in NME6 KO cells.
To this end, we identified a second function for NME6 through RCC1L, which interacts with several mitochondrial pseudouridine synthases associated with the mitoribosome44,45. Consistently, NME6 KO cells have increased mt-RNA pseudouridylation, particularly within MT-CO1 mRNA, which we hypothesize upregulates MT-CO1 transcript levels through mRNA stabilization, resulting in higher COX1 synthesis in NME6 KO cells.
Together, our data suggest that NME6 has multifaceted functions in mitochondrial gene regulation, including the regulation of mitochondrial pyrimidine nucleotide pools through its NDPK activity, and the regulation of mitochondrial ribosome assembly, and mt-RNA pseudouridylation. Considering these functions and its activity-dependent stability, we propose that NME6/RCC1L acts as a metabolic sensor to tune mitochondrial gene expression based on compartmentalized metabolite availability in the mitochondria. Metabolite compartmentalization is emerging as a key mechanism underlying important physiological processes, such as proline biosynthesis and mammalian development25,63-65. Interestingly, NME6 is an essential gene for diffuse midline glioma cancer cell growth, a cancer with a selective dependency on pyrimidine biogenesis67. In future work, it will be important to determine which NME6 roles contribute to its essentiality and whether its potential role as a metabolic sensor contributes to interorganellar communication to drive cellular transitions in response to environmental cues.
Methods
All research methods comply with ethical guidelines approved by Harvard University’s Committee on Microbial Safety and approved IACUC protocols.
Cell Culture
K562 cells were grown in RPMI-1640 media with GlutaMAX (Thermo Fisher Scientific), 10% standard FBS or 10% charcoal-stripped FBS, where noted (Thermo Fisher Scientific), penicillin (10,000 IU/mL), and streptomycin (10,000 ug/mL). Cells used for CRISPR-Cas9 screens were cultured without penicillin/streptomycin, and were supplemented with uridine (50 ug/mL) and sodium pyruvate (1 mM) to maintain mutant cells with dysfunctional mitochondria. Cells were maintained in a 37°C humidified incubator with 5% CO2. HEK293T and U2OS cells were cultured in DMEM with 10% FBS, penicillin (10,000 IU/mL), and streptomycin (10,000 ug/mL) in a 37°C humidified incubator with 5% CO2. All cell lines were obtained from ATCC (K562: CCL-243, HEK293T: CRL-3216, U2OS: HTB-96).
Mouse strains
8-week old, male C57BL/6 (Charles River, C57BL/6NCrl) mice were used for tissue collection where indicated.
Lentivirus packaging and transductions
Lentivirus were packaged in HEK293T cells following standard protocols for 3rd generation packaging. Lentivirus containing media was harvested 48 hours post-transfection of HEK293T cells and filtered using 0.45 um PES membranes or centrifuged for 5 minutes at 300g to remove cellular debris. K562 cells were transduced with lentiviral media using spin-infection methods. Filtered lentiviral supernatants were added to K562 cells with 8 ug/mL polybrene and centrifuged for 2 hours at 1000g, 33°C. Cells were resuspended in fresh media and expanded for 48 hours prior to selection. HEK293T or U2OS cells were transduced by adding viral supernatants directly to cell cultures (1:1 ratio viral supernatant to culture media) in the presence of 8 ug/mL polybrene for 16-24 hr. then replaced with fresh media.
Genome-wide CRISPR-Cas9 screens
K562 cells (ATCC) were transduced with lentiCas9-Blast (Addgene #52962) and single cell clones were selected for stable Cas9 expression. Clonal cell lines stably expressing Cas9 were used for CRISPR-Cas9 screening. Genome-wide CRISPR-Cas9 KO screens were performed as described in 68,69 with fixation and FACS staining as described in 70. Briefly, sgRNA libraries cloned into pMCB320 (Addgene #101926, #101927, #101928, #101929, #101930, #101931, #101932, #101933, #101934) targeting human protein coding genes (10 sgRNAs/gene) were packaged using 3rd generation lentivirus. 250x10^6 K562 cells were transduced with the genome-wide sgRNA library at an MOI < 1 and selected with puromycin (2 ug/mL) 48 hr after transduction. A sample of cells was analyzed by FACS for mCherry expression to quantify transduction efficiency and successful sgRNA incorporation (FlowJo v10.8.1). Cells were expanded and the population was maintained 1000 fold over the number of sgRNAs elements to maintain library representation, while passaging cells every 2 days with fresh media. Cells in these screens were cultured without penicillin/streptomycin, and were further supplemented with uridine (50 ug/mL) and sodium pyruvate (1 mM) to maintain any mutant cells with dysfunctional mitochondria. After specified time points (days 10, 12, and 14 post-transduction), cells were pelleted, washed with PBS, and fixed in ice-cold methanol (1mL per 10 million cells) for 10 minutes at −20°C (dropwise while vortexing) and then stained using standard intracellular FACS methods. Stained cells were sorted using a Sony SH800Z flow cytometer ( ~30 million cells per gate) and immediately pelleted and lysed for genomic DNA extraction. Libraries were sequenced using an Illumina NextSeq platform and sgRNA compositions between unsorted control cells and sorted cells were compared using either casTLE69 and MAGeCK71 software packages.
CRISPR KO clones
CRISPR mediated mutagenesis of target genes was performed by transducing K562 cells stably expressing Cas9 (lentiCas9-Blast, Addgene #52962) with lentivirus expressing sgRNAs (lentiGuide-Puro, Addgene #52963) targeting genes of interest. Transductions were performed as described above, and cells were selected with 2 ug/mL puromycin 48 hr after infection. Pooled mutant cells were then serially diluted to reach 1 cell/well in 96-well plates and clonally expanded for ~ 2-3 weeks. Single cell clones were screened by PCR and western blotting to confirm homozygous disruption of genes of interest. See Supplemental Table 4 for list of sgRNA sequences.
Immunoblotting and antibodies
Protein lysates used for immunoblotting were prepared in RIPA buffer in the presence of protease inhibitors, unless otherwise specified. Lysates were normalized using BCA assays, and standard SDS-PAGE and electroblotting protocols were used. Note that samples were not boiled prior to SDS-PAGE when analyzing mitochondrial encoded proteins. The following antibodies were used in this study MT-CO1/COX1 (ABCAM, ab14705, 1:2000), COX4I1/COX4 (CST, 4850, 1:1000), ACTB (CST, 3700, 1:5000), FLAG (Millipore Sigma, F1804,1:5000), LRPPRC (Abcam, Ab97505, 1:1000), TOMM40 (Proteintech, 18409-1-AP,1:5000), MRPS18B (Proteintech, 16139-1-AP,1:1000), MRPL12 (Proteintech, 14795-1-AP,1:750), WBSCR16/RCC1L (Proteintech, 13796-1-AP, 1:1000), NDUFS1 (Abcam, ab169540,1:1000), SDHA (Santa Cruz, sc-166947,1:10,000), UQCR4/CYC1 (Millipore Sigma, HPA001247,1:1000), MT-ATP6 (ProteinTech, 55313-1-AP,1:1000), ATP5H (Abcam, ab110275,1:1000), MT-ND1 (Abcam, ab181848,1:1000), MT-CYB (ProteinTech, 55090-1-AP,1:1000), NME6 (Millipore Sigma, HPA017909,1:1000), PREPL (Abcam, ab202064,1:1000), CHCHD4 (ProteinTech 21090-1-AP,1:1000), TRUB2 (ProteinTech,19891-1-AP, 1:1000), RPUSD4 (Millipore Sigma HPA039689,1:1000), TBRG4 (Sigma , HPA020582,1:1000), GAPDH (Invitrogen, A5-15738,1:1000), TFAM (sc-376672,1:2000) and TACO1 (ProteinTech, 21147-1-AP, 1:1000).
Subcellular mitochondrial and cytosolic fractionations
To obtain the cytosolic fractions, 5x10⁶ K562 cells were resuspended in PBS with EDTA-free protease inhibitor cocktail (Roche) and lysed using a 27.5G needle. Lysates were cleared by centrifugation for 10 min at 800g at 4°C. The supernatant was collected and centrifuged for 10 min at 10,000g at 4°C to pellet organelles, and the supernatant was removed to obtain the cytosolic fraction. To obtain mitochondrial fractions, 30x106 K562 were pelleted and resuspended in 800 ¼L hypotonic buffer (10 mM Tris, pH 7.5; 10 mM NaCl; 1.5 mM MgCl2) and left to swell on ice for 7.5 min. Cells were dounced in a 1 mL glass homogenizer with 20 strokes on ice. 2M sucrose T10E20 buffer (10 mM Tris, pH 7.6; 1 mM EDTA, pH 8.0; 2 M Sucrose) was added to the lysate to bring the sucrose concentration to 250 mM and homogenized cells were centrifuged at 600g for 10 minutes to remove nuclei and unbroken cells. The supernatant was collected and spun at 10,000g to pellet mitochondria. Pellets were then washed twice with 250 mM sucrose T10E20 buffer (10 mM Tris, pH 7.6; 1 mM EDTA, pH 8.0; 250mM Sucrose) before further application.
Mitochondria immunoprecipitation
Mitochondrial immunoprecipitations were performed using K562 cells expressing an HA-mito tag (Addgene #83356) or a control MYC-mito tag (Addgene #83355) as previously described39. For immunoprecipitations, 30x106 cells were pelleted and washed 2X in ice-cold PBS. Cells were then resuspended in 1 mL PBS with 1X EDTA-free protease inhibitor cocktail (Roche) from which 5 μl of the suspension were lysed with RIPA buffer to quantify whole cell protein levels. The remaining suspension was lysed using 8 passages through a 30G needle. Lysates were centrifuged for 1 min at 1000g to pellet unbroken cells and supernatants were incubated with 50 μl HA magnetic beads (Thermo Fisher, #88836) for 4 min. Beads were washed 3X in KPBS, and then lysed in 50 μl RIPA buffer for 10 min on ice for western blotting or for use in downstream applications.
Immunoprecipitation and mass spectrometry
We expressed C-terminal FLAG-tagged PREPL, NME6, and RCC1L for immunoprecipitation using the pCIG3 lentiviral vector ( Addgene 78264) in K562 cells. Cells were sorted for stable expression based on GFP expression as a selectable marker. For immunoprecipitation of PREPL-Flag, cells were lysed in 50 mM Tris/HCl (pH 7.5), 150 mM NaCl, 1 mM MgCl2, 1% NP-40, 1X EDTA-free protease inhibitor cocktail (Roche) for 20 min at 4°C, and the lysate was cleared by centrifugation at 10,000xg for 5 min. Cleared lysates were added to washed anti-FLAG M2 beads (Sigma) and incubated with rotation at 4C for 16 hr. Beads were washed 5X with (50 mM Tris/HCl pH 7.5, 150 mM NaCl, 1 mM MgCl2, 0.1% NP-40) followed by elution with 150 μg/mL 3X FLAG peptide (Sigma) at 4C, 1hr. The elute was concentrated with Amicon Ultra-4 filter units with a 3 kDa MW cutoff. Bait protein enrichment was confirmed silver staining, and the remaining eluate was precipitated using a ProteoExtract protein precipitation kit (Millipore 539180 ) and samples were submitted to the Taplin Biological Mass Spectrometry Facility at Harvard Medical School for mass spectrometry based protein identification. For NME6-Flag and RCC1L-Flag, input cell numbers were increased to 50x106 and mitochondria were isolated prior to immunoprecipitation, as described above.
For co-immunoprecipitation analysis by western blotting, immunoprecipitations were performed as above, but proteins were eluted from beads with 2X-SDS PAGE lysis buffer with boiling at 95°C for 5 min. Supernatants were collected and analyzed by SDS-PAGE and western blot analysis using indicated antibodies.
Proteinase K protection assays
20 μg of isolated mitochondria, as described previously (1 mg/mL in 250mM Sucrose T10E20 buffer) were either left untreated or were treated for 30 min. on ice with 50 μg/ml of proteinase K alone or in combination with 1% Triton-X100. To halt proteinase K treatment, 2 μl of 40 mM phenylmethanesulfonyl fluoride (PMSF) was added to all samples, and samples were incubated on ice for 20 min. Cells were then lysed in RIPA buffer with 1X EDTA-free protease inhibitor cocktail (Roche) and analyzed using western blotting.
RNA abundance measurements by NanoStrings
Total RNA was purified from cells using Trizol and isopropanol precipitations. 25-50 ng of total RNA per sample was used for each NanoStrings run. To hybridize RNA to the probe sets, first probe stocks ‘A’ and ‘B’ were diluted into working stocks by adding 4 ul of each master stock into 29 ul TE + 0.1% Tween-20. Next, 70 ul of nCounter Sprint hybridization buffer was added to a Nanostrings 24-TagSet, followed by 7 ul of the probe ‘A’ working stock, then 7 ul of probe ‘B’ working stock. In a 0.2 mL PCR tube, 8 ul of the TagSet/Probe mastermix was mixed with 25-50 ng RNA/H20 for a 15 ul total reaction volume. Samples were hybridized in a PCR machine at 67°C for 16 hr. before loading onto a nCounter Sprint Cartridge for quantification.
qPCR detection of mtDNA levels and qRT-PCR detection of mRNA levels
DNA was isolated from cells using a Qiagen Blood and Tissue DNeasy kit. Quantitative PCR was performed using Sso EvaGreen Supermix (BioRad), adding 60ng of template DNA per reaction and using mtDNA and nucDNA specific primers (400nM final concentration). MT-TRNA-LEU (mtDNA target): Fwd = CACCCAAGAACAGGGTTTGT, Rev = TGGCCATGGGTATGTTGTTA. B2M (nucDNA target): Fwd = TGCTGTCTCCATGTTTGATGTATCT, Rev = TCTCTGCTCCCCACCTCTAAGT. PCR was performed using a BioRad CFX384 Touch Real-Time PCR Detection System, with the following cycling conditions: 50°C for 2 min, 95°C for 10 min, 40 cycles [95°C for 15 sec, 62°C for 60 sec, + melt curve.
For qRT-PCR measurements of mRNA levels, 500 ng of DNAseI treated total RNA was reverse transcribed using a SuperScript III First-Strand Synthesis system. cDNA were diluted 1:100 and 1 ul was used for Taqman gene expression assays using TaqMan™ Fast Advanced Master Mix, no UNG (Thermo Fisher Scientific) and the following probe sets: ACTB (Hs03023880_g1), MT-CYB (Hs02596867_s1), MT-CO1 (Hs02596864_g1), and MT-RNR2 (Hs02596860_s1). Where indicated, IMT1B (MedChemExpress, cat. # HY-137067) or a DMSO vehicle control was added to cell cultures at 500 nM for the indicated amount of time before total RNA purification.
STED microscopy
Stimulated emission depletion microscopy was performed on U2OS cells transduced with lentivirus expressing Flag-tagged PREPL cDNA (pCIG3, Addgene #78264). Cells were seeded 3 days post-transduction on coverslips (thickness #1.5H, Thor Labs #CG15NH1) and fixed in 4% paraformaldehyde for 20 minutes. Standard immunocytochemistry techniques were used to stain cells with the following antibodies (anti-FLAG M2 clone 1:200; anti-TOMM40 1:200 Proteintech #18409-1-AP; anti-LRPPRC 1:200 Abcam #Ab97505). Secondary antibodies: goat anti-mouse Alexa-555 (1:100); goat anti-rabbit Alexa-647(1:100). Imaging was performed at the HMS Neurobiology Imaging Facility using the Leica SP8X STED system and deconvolution was performed post acquisition using Hyugen’s deconvolution (default parameters; Scientific Volume Imaging).
Electron microscopy
K562 cells were pelleted and fixed in 2.5% Glutaraldehyde 1.25% Paraformaldehyde and 0.03% picric acid in 0.1 M sodium cacodylate buffer (pH 7.4) for 2 hr at RT. Samples were then processed by the HMS Electron Microscopy Facility as described: fixed cells were washed in 0.1M cacodylate buffer and postfixed with 1% Osmiumtetroxide (OsO4)/1.5% Potassiumferrocyanide (KFeCN6) for 1 hour, washed 2X in water, 1X Maleate buffer (MB) 1X and incubated in 1% uranyl acetate in MB for 1 hr followed by 2 washes in water and subsequent dehydration in grades of alcohol (10 min each; 50%, 70%, 90%, 2x10min 100%). The samples were then put in propyleneoxide for 1 hr and infiltrated ON in a 1:1 mixture of propyleneoxide and TAAB (TAAB Laboratories Equipment Ltd)). The following day the samples were embedded in TAAB Epon and polymerized at 60°C for 48 hrs. Ultrathin sections (about 60 nm) were cut on a Reichert Ultracut-S microtome, picked up on to copper grids stained with lead citrate and examined in a JEOL 1200EX Transmission electron microscope or a TecnaiG2 Spirit BioTWIN and images were recorded with an AMT 2k CCD camera.
Seahorse assays
K562 cells were seeded (75,000 cells/well) by centrifugation onto poly-L-lysine coated 96-well Seahorse assay microplates and allowed to equilibrate in Seahorse XF RPMI Medium, pH 7.4 (Agilent, 103576-10) for 60 min, in a non-CO2 controlled incubator before assays were performed. Respiratory parameters were measured using a Seahorse XFe96 analyzer according to manufacturer’s protocols with four basal measurements followed by sequential injections of oligomycin (1 μM), FCCP (2 μM), and rotenone (0.5 μM) with antimycin A (0.5 μM), where three measurements were taken after each injection. To measure the activity for specific OXPHOS complexes, the experiments were performed in permeabilized K562 cells, as described in72. Briefly, 30,000 K562 cells were seeded on poly-L-lysine coated 96 well plate and just prior to measurements, media was replaced by MAS-BSA buffer (70 mM sucrose, 220 mM Mannitol, 10 mM KH2PO4, 5 mM MgCl2, 2 mM Hepes (pH 7.2), 1 mM EGTA, and 4μg/ml BSA). Three basal measurements were taken, upon which the cells were permeabilized using XF Plasma Membrane Permeabilizer (1.5 nM final concentration; Agilent) together with 1 mM ADP and the following specific respiratory complex substrates: Complex I = pyruvate/malate (5 mM/2.5 mM); Complex IV = N,N,N,N-tetramethyl-p-phenylenediamine/ascorbate (0.5 mM/2 mM final concentration). These were followed by injections with Oligomycin (1 μg/ml final) and respective Complex inhibitors (Complex I, 1 μM rotenone; Complex IV, 20 mM sodium azide).
Complex IV enzymatic activity assays
Mitochondria were isolated from cells as described above using hypotonic lysis and differential centrifugation. Proteins were extracted from isolated mitochondria in the presence of protease inhibitors (Halt Protease Inhibitor Cocktail, Thermo Fisher) and protein content was quantified using BCA assays. Complex IV enzyme activity was measured colorimetrically in antibody-coated microplates by measuring the oxidation of cytochrome-c according to the manufacturer's instructions (Abcam cat# ab109909).
Pseudouridine sequencing
CMC (N-cyclohexyl-N′-(2-morpholinoethyl)carbodiimide metho-p-toluenesulfonate; Santa Cruz Biotechnology) based detection of pseudouridine RNA modifications was performed as described in 44,73. Briefly, mitochondria were fractionated from cells as described above and RNA was purified using standard Trizol and isopropanol precipitation methods. 3 ug of RNA from each sample was split into −CMC and +CMC conditions (2 ug used for +CMC and 1 ug used for −CMC) and adjusted to 20 ul each with water. RNA was denatured by adding 2.9 ul of 20 mM EDTA pH 8.0, heated for 3 min. at 80°C, then returned to ice. 0.5 M CMC was prepared fresh in BEU buffer (50 mM bicine pH 8.5, 4 mM EDTA, 7 M urea) just before use, and 100 ul of either CMC or BEU buffer was added to −CMC or +CMC samples respectively and incubated at 40°C for 45 min. mixing at 1000 rpm in a thermomixer. RNA was precipitated (sodium acetate, 100% ethanol, glycoblue) and then CMC bound to U/G residues was reversed by heating RNA samples at 50°C for 2 hr. with mixing at 1000 rpm in sodium carbonate buffer (pH 10.4, 50 mM Na2CO3, 2 mM EDTA). RNA was precipitated (sodium acetate, 100% ethanol, glycoblue), washed, and resuspended in 15 ul of water. RNA was quantified using a Nanodrop, and RNA-sequencing libraries were made using the SMARTer Stranded Total RNA Sample Prep Kit - HI Mammalian (Takara). Libraries were sequenced at the Bauer Core Facility (Harvard University) using 150 bp paired-end reads using an Illumina NovaSeq. Pseudouridine levels were quantified as described in 44. Briefly, reads were aligned to the genome and variants at each position were detected using Samtools mpileup. As CMC-bound pseudouridine bases cause deletions during reverse transcription, we determined the number of deletions at each base across the mitochondrial genome normalized to total read counts (corrected for deletions in -CMC conditions) using previously published software written for this purpose44.
35S metabolic labeling
K562 cells were grown at 5x10⁵ cells/mL in FBS-supplemented RPMI media. For 35S metabolic labeling, 3x10⁶ cells were washed 1X with PBS and resuspended in labeling media (RPMI without cystine, methionine, and cysteine, MP Biomedical 1646454, supplemented with dialyzed FBS and glutamine). Cells were equilibrated for 30 min. at 37°C and 5% CO2 and then treated with 100 μg/mL of anisomycin for 10 min. 200 μCi/mL of EasyTag labeling mix (35S-cysteine/35S-methionine, Perkin Elmer CAT NEG772007MC) was added for 30 min. or 60 min. Subsequently, cells were washed 2X with ice-cold PBS and lysed in RIPA buffer with 1X EDTA-free protease inhibitor cocktail (Roche). Lysates were then separated on a 17.5% acrylamide gel for 6 hr at 150 V and transferred onto a 0.22 μM nitrocellulose membrane using semi-dry transfer methods and signals were imaged using autoradiography.
4sU metabolic labeling
4sU incorporation into K562 cells was determined by measuring the fractions of unlabeled mt-RNA by NanoStrings after 4sU-labeling and depletion, as described in74. In short, K562 cells were labeled with 500 μM 4sU for 30 min and lysed in Trizol. RNA was purified using isopropanol precipitations with the addition of spike-ins using in vitro transcribed RNA: ERCC-000148, as an unlabeled control. RNA was denatured at 60°C for 10 min and biotinylated using 5 μg/mL biotin-MTS (Biotium) in 20% dimethylformamide (Sigma), 20mM Hepes pH 7.4 and 1 mM EDTA with incubation for 30 min. Free biotin was removed using phase-lock heavy gel tubes (5prime), and then the mixture of unlabeled RNA and biotinylated RNA was incubated with streptavidin beads (uMACS Streptavidin kits, Miltenyi Biotec) following manufacturer’s protocol. Post incubation, RNA levels were quantified and equal amounts of RNA/bead mixture (3ug RNA/100ul beads) were loaded on a uMACS column and washed with 100mM Tris pH 7.5, 10mM EDTA, 1M NaCl, 0.1% Tween 20 to collect unlabeled RNA in the flow-through. Collected RNA was purified using miRNeasy kits (Qiagen) with DNAse treatments (Qiagen). MitoStrings measurements were performed as described previously.
Blue Native PAGE
Blue Native polyacrylamide gel electrophoresis (BN-PAGE) was adapted from previously published protocols75. In short, 50 μg of isolated mitochondria, as described above, were resuspended in 20 μL sample buffer cocktail (5 μL 4X NativePAGE sample buffer, 8 μL of 5% digitonin, and 7 μL of water). The suspension was left on ice to solubilize for 20 min, after which the lysate was cleared with centrifugation at 20,000g for 10 min at 4°C. 2 μL of Coomassie G-250 was added to the supernatant and proteins were separated using NativePAGE 3%-12% gradient gels (Thermo Fisher Scientific). During electrophoresis, inner chambers were filled with dark blue cathode buffer (Bis-tris 50 mM, Tricine 50 mM and 0.02% Coomassie blue G250) and outside chambers were filled with running buffer (Bis-tris 50 mM). Gels were run for 30 min at 150 V, upon which the dark blue running buffer was replaced with light blue running buffer (Bis-tris 50 mM, Tricine 50 mM and 0.001% Coomassie blue G250) and run for an additional 90 min at 250 V. Proteins were transferred onto PVDF membranes using wet transfer methods at 200 mA for 90 min, fixed with 8% acetic acid, rinsed twice with water, and then air dried. Dried membranes were then activated in 100% methanol for 5 min, followed by methanol and water rinses to remove coomassie staining, and then blocked using 5% skim milk in TBST. OXPHOS complexes were analyzed by immunoblotting with indicated antibodies towards each complex.
Recombinant NME6/RCC1L expression and in vitro NDPK assays
Recombinant RCC1L (amino acids 32-464) was expressed recombinantly as described previously76 by cloning corresponding cDNA into pGEX-4T-1 with an N-terminal GST tag. For recombinant NME6-WT and NME6-H137A, cDNA corresponding to the full length NME6 CDS was cloned into pET30a with an N-terminal 6xHis tag. Constructs were transformed into T7 Express lysY/Iq E. coli cells (NEB, C3013I) and grown at 37°C with shaking until cultures reached OD600 = 0.6-0.8. Protein expression was induced by the addition of IPTG (1 mM IPTG, 4 hr, 37°C for RCC1L or 0.1 mM IPTG, overnight, 18°C for NME6). Bacteria were pelleted and lysed by sonication in lysis buffer (30 mM Tris-HCl pH 8, 0.5 M NaCl, 7 mM 2-mercaptoethanol, 1X Complete EDTA-free Protease Inhibitor Cocktail) and the resulting lysates were clarified by centrifugation. Cleared lysates were then purified using glutathione agarose in the case of GST-RCC1L or Ni-NTA agarose (Qiagen) in the cases of NME6. Proteins were eluted off beads and dialyzed overnight into SEC buffer for NME6 (25 mM Hepes pH 7.5, 300 mM Nacl, and 5 mM DTT) or dialysis buffer for RCC1L (10 mM Tris-HCl pH 8, 0.25 M NaCl, 2 mM 2-mercaptoethanol). NME6-WT and NME6-H137A were further purified by size-exclusion chromatography (HiLoad 16/60 S200 column, Cytiva 28989335), and fractions were pooled, concentrated, and analyzed for purity by SDS-PAGE. All proteins were stored at −80C with the addition of 10% glycerol.
ATP hydrolysis reactions were performed by incubating the indicated protein amounts in the following reaction buffer (20 mM Tris pH 7.5, 100 mM NaCl, 10 mM MgCl2, 1mM DTT, and 500uM ATP) for 30 min. at 37°C. Released free orthophosphate was quantified using the Malachite Green Phosphate Assay kit (Millipore Sigma). Samples with ATP containing reaction buffer lacking proteins and proteins alone lacking ATP were used to correct for any background readings. NDPK phosphorylation was performed by pre-binding 15 ug of GST-RCC1L to glutathione agarose beads for 30 min at room temperature with rotation followed by the addition of 20 ug NME6-WT or H137A in reaction buffer (50mM Tris pH7.5, 150 mM NaCl, and 10 mM MgCl2). Bound complexes were allowed to form for 2 hr. at 4°C with rotation, and subsequently unbound proteins were washed from the beads. Washed NME6/RCC1L bound beads were resuspended in reaction buffer supplemented with 10 uM cold ATP and 4 uCi of gamma-32P ATP (PerkinElmer, BLU002250UC). Reactions were incubated for 30 min. at 30°C and subsequently, beads were washed 5 times to remove free ATP. Reactions were split in half with one half used to determine protein phosphorylation and the other half used for phosphate transfer reactions. To determine protein phosphorylation, proteins were eluted from beads with SDS-sample buffer (15 min. at room temperature, no boiling) and then analyzed by SDS-PAGE and autoradiography. To determine phosphate transfer activity, washed beads were resuspended with cold acceptor nucleotides (1 mM UDP or CDP in reaction buffer) and incubated for 30 min. at 30°C. UTP or CTP formation was analyzed by autoradiography using thin layer chromatography on PEI-cellulose plates (Millipore Sigma #1.05579) using 1.2M LiCl as a solvent.
Sucrose gradient fractionations
50x106 cells K562 cells were grown at 5x10⁵ cells/mL for sucrose gradient fractionations. Upon removing media, cells were rinsed with ice-cold PBS and resuspended in 600 μL of mitoribosome lysis buffer (0.25% lauryl maltoside,50 mM NH4Cl, 20 mM MgCl2, 0.5 mM DTT, 10 mM Tris, pH 7.5, and 1X EDTA-free protease inhibitor cocktail (Roche)). Lysates were clarified by centrifugation at 10,000g for 5 min. To isolate mitoribosomes, 450 μL of clarified lysate was layered on top of 12 mL 10-50% linear sucrose gradients and centrifuged at 40,000 rpm (273,620g) for 3h at 4°C using an SW41Ti rotor. Gradients were fractionated into 800 μL fractions using a BioComp instrument and mitoribosomes were followed with western blotting using antibodies against MRPL12 and MRPS18B.
Nanopore direct RNA sequencing
Total RNA was extracted using Trizol and isopropanol precipitation, followed by polyA+ enrichment of mRNAs using a Dynabeads mRNA Purification Kit (Thermo Fisher, 61006). 500 ng of polyA+ RNA was used for input into the Oxford Nanopore Technologies Direct RNA sequencing library preparation kit (SQK-RNA002). Steps were performed following the manufacturer’s protocol except for the following changes: 1) RNA CS was not added to the initial ligation mix and instead replaced with nuclease-free water and 2) ligation of the RT adapter was extended from 10 to 15 minutes. The resulting libraries were sequenced on a MinION device (Oxford Nanopore Technologies) for up to 72 hours. Sequencing reads were basecalled live with MinKNOW (release 20.10.3 or later) and filtered for basecalling threshold > 7. U bases were substituted for T bases in the resulting reads, followed by alignment to the reference hg38 genome using minimap277 with parameters -ax splice -uf -k14. Multi-mapping reads were included in downstream analyses. 5’-end processing status of each read mapping to mt-mRNAs was determined by mapping the location of the 5’-end of the read relative to the start of the transcript (−15 to +50 nt from transcript start). Reads that started in the transcript start window of a gene were classified as “processed” and reads that started upstream of this window were classified as “unprocessed”. Poly(A) tail lengths were measured using nanopolish 78. Reads with qc_tag “PASS” and with the 3’-end mapping within −15 to +15 nt of the transcript end were included in poly(A) tail length analyses.
In organello mitochondrial transcription assays
Mitochondria were purified by subcellular fractionation or rapid mitochondrial immunoprecipitation as described above. Transcription assays were performed as described in79. Briefly, purified mitochondria were labeled with 30 μCi of alpha-32P UTP (Perkin Elmer BLU007H250UC) in transcription buffer (10 mM Tris pH 7.5, 25 mM sucrose, 75 mM sorbitol, 100 mM KCl, 10 mM K2HPO4, 50 μM EDTA, 5 mM MgCl2, 10 mM glutamate, 2.5 mM malate, 1 mg/ml BSA, 1 mM ADP) at 37°C for 20 min. then chased with cold UTP in transcription buffer for 5 min. at 37°C. Mitochondria were washed 3 times with wash buffer (10 mM Tris pH 6.8, 0.15 mM MgCl2, 10% glycerol) followed by RNA extraction using Trizol and isopropanol precipitation. RNA was resuspended in 2X urea sample buffer (Thermo Fisher) and separated by denaturing PAGE using Novex 6% TBE-urea gels (Thermo Fisher). Newly transcribed RNAs containing 32P-UTP were visualized by autoradiography.
Mitochondria immunoprecipitation for metabolomics
Mitochondrial immunoprecipitation followed by mass spectrometry was adapted from39. Briefly, mitochondria were immunoprecipitated from 50x106 K562 cells as described above. Pelleted cells were washed 2X with ice-cold KPBS, followed by homogenization using 25 strokes with a polytetrafluoroethylene (PTFE) dounce homogenizer (VWR) and centrifuged for 2 min at 1,000g, 4°C. The supernatant was resuspended with 200 μL anti-HA magnetic beads and the mixture was incubated at 4°C using an end-over-end rotator for 3.5 min. Beads were washed 3X in ice-cold KPBS, and were immediately resuspended in either protein extraction or metabolite extraction buffer.
Metabolite profiling by mass spectrometry for detection of polar metabolites
For whole cell measurements, 1x10⁶ K562 cells were washed with ice cold 0.9% NaCl briefly and metabolites were extracted using 200 μL buffer (80% Methanol, 25 mM Ammonium Acetate and 2.5 mM Na-Ascorbate prepared in LC-MS water, supplemented with isotopically-labelled amino acid standards [Cambridge Isotope Laboratories, MSK-A2-1.2], aminopterin, and reduced glutathione standard [Cambridge Isotope Laboratories, CNLM-6245-10]) for 10 min. The samples were vortexed for 10 sec, then centrifuged for 10 min at 21,000g to pellet cell debris. The supernatant was dried on ice using a liquid nitrogen dryer. Metabolites were reconstituted in 20 μL water supplemented with QReSS [Cambridge Isotope Laboratories, MSK-QRESS-KIT] and 1 μL was injected into a ZIC-pHILIC 150 x 2.1 mm (5 μm particle size) column (EMD Millipore) operated on a Vanquish™ Flex UHPLC Systems (Thermo Fisher Scientific, San Jose, CA, USA). Chromatographic separation was achieved using the following conditions: buffer A was acetonitrile; buffer B was 20 mM ammonium carbonate, 0.1% ammonium hydroxide in water. Gradient conditions were: linear gradient from 20% to 80% B; 20–20.5 min: from 80% to 20% B; 20.5–28 min: hold at 20% B at 150 mL/min flow rate. The column oven and autosampler tray were held at 25°C and 4°C, respectively. MS data acquisition was performed using a QExactive benchtop orbitrap mass spectrometer equipped with an Ion Max source and a HESI II probe (Thermo Fisher Scientific, San Jose, CA, USA) and was performed in positive and negative ionization mode in a range of m/z = 70–1000, with the resolution set at 70,000, the AGC target at 1 x 10⁶, and the maximum injection time (Max IT) at 20 msec. HESI settings were: Sheath gas flow rate: 35. Aux gas flow rate: 8. Sweep gas flow rate: 1. Spray voltage 3.5 (pos); 2.8 (neg). Capillary temperature: 300°C. S-lens RF level: 60. Aux gas heater temp: 350°C. An independent injection was performed for more specific detection of nucleotides. Mass spectrometer was operated in full scan mode in a range of m/z = 200–700 and m/z = 300–600 in negative and positive ionization mode respectively, with the resolution set at 70,000, the AGC target at 1 x 10⁶, and the maximum injection time (Max IT) at 40 msec. HESI settings were: Sheath gas flow rate: 35. Aux gas flow rate: 8. Sweep gas flow rate: 1. Spray voltage 3.5 (pos); 2.8 (neg). Capillary temperature: 400°C. S-lens RF level: 60. Aux gas heater temp: 450°C.
Data analysis for metabolite profiling
Relative quantification of polar metabolites was performed with TraceFinder 5.1 (Thermo Fisher Scientific, Waltham, MA, USA) using a 7 ppm mass tolerance and referencing an in-house library of chemical standards. Pooled samples and fractional dilutions were prepared as quality controls and injected at the beginning and end of each run. In addition, pooled samples were interspersed throughout the run to control for technical drift in signal quality as well as to serve to assess the coefficient of variability (CV) for each metabolite. Data from TraceFinder was further consolidated and normalized with an in-house R script: (https://github.com/FrozenGas/KanarekLabTraceFinderRScripts/blob/main/MS_data_script_v2.4_20221018.R). Briefly, this script performs normalization and quality control steps: 1) extracts and combines the peak areas from TraceFinder output .csvs; 2) calculates and normalizes to an averaged factor from all mean-centered chromatographic peak areas of isotopically labeled amino acids internal standards within each sample; 3) filters out low-quality metabolites based on user inputted cut-offs calculated from pool reinjections and pool dilutions; 4) calculates and normalizes for biological material amounts based on the total integrated peak area values of high-confidence metabolites. In this study, the linear correlation between the dilution factor and the peak area cut-offs are set to RSQ>0.95 and the coefficient of variation (CV) < 30%. Finally, data were Log transformed and Pareto scaled within the MetaboAnalyst-based statistical analysis platform80 to generate PCA, PLSDA, and heatmaps. For mito-IP metabolomics, samples were normalized to total protein in purified mitochondria determined using BCA assays.
Data analysis for 13C-glucose isotope tracing
K562 cells were glucose-deprived in glucose-free RPMI-1640 media for 2 hr. followed by metabolic labeling in glucose-free RPMI-1640 supplemented with either 10mM 13C-glucose (Cambridge Isotope Laboratories) or 10 mM standard glucose (Sigma). Mito-IPs were performed, as described above, after 22 hr. of growth in labeling media. Analysis for 13C-glucose tracing experiments was performed on CompoundDiscoverer (CD) 3.3 (Thermo Fisher Scientific, Waltham, MA, USA) and TraceFinder (TF) 5.1. For CD, an in-house database was used to first filter out features and only consider compounds at level 1 of identification certainty81. Additional background filtering and sample normalization steps as well as normalization for natural isotope abundance of reported compound labeling efficiency were performed within the software. Briefly, cut-offs and biological factor normalizations were calculated from pool reinjection samples. Compounds which were five-fold above background levels were only considered in further analysis. For TF analysis individual isotopologues were quantified using a 7 ppm mass tolerance and referencing an in-house library of chemical standards.
Mitoribosome profiling
50x106 cells K562 cells were grown in RPMI at 5x10⁵ cells/mL for mitoribosome profiling. Culture media was removed, and the cells were rinsed with ice-cold PBS and resuspended in 600 μL of mitoribosome lysis buffer (0.25% lauryl maltoside,10 mM Tris pH 7.5, 50 mM NH4Cl, 20 mM MgCl2, 0.5 mM DTT, and 1X EDTA-free protease inhibitor cocktail (Roche)) and homogenized briefly with a dounce homogenizer. Lysates were digested using 8 units/μL of RNaseI (LGC) for 30 min. at room temperature to generate mitoribosome footprints followed by the addition of 80 units SUPERaseIn (Thermo Fisher Scientific) and a 5 min. spin at 10,000g to clarify the lysate. The mitoribosomes were isolated by loading 450 μL of clarified lysate onto 12 mL 10-50% linear sucrose gradients and centrifugation at 40,000 rpm for 3h at 4°C using an SW41Ti rotor. Gradients were fractionated into 800 μL fractions using a BioComp instrument and mitoribosomes were detected using western blots using antibodies against MRPL12 and MRPL18B. From the mitomonosome fraction, RNA was extracted using 1:1 acid phenol/chloroform extraction and separated on 15% polyacrylamide TBE-urea gel to collect RNA fragments between 28-40 nucleotide size. Libraries were prepared as previously described along with the modification for mitoribosome library preparations11. Samples were sequenced using an Illumina Next-Seq 500 (single-end reads, 75 cycles) and analyzed using the following pipeline (https://github.com/churchmanlab/human-mitoribosome-profiling). Briefly, reads were trimmed and aligned using STAR, periodicity and A-site transformations were determined, and synthesis rates in TPM were calculated for mt-RNAs by counting reads on genes using featureCounts (Subread). Translational efficiency was calculated by dividing the TPMs of ribosome footprints by the TPMs for total RNA-sequencing for each mt-RNA.
Statistics and Reproducibility
All statistical testing was performed using either R or GraphPad Prism software. No statistical methods were used to predetermine sample sizes. No data were excluded from the analyses. These experiments were not randomized. Data collection and analysis were not performed blind to the conditions of the experiments. Data met the assumptions of statistical tests indicated.
Extended Data
Extended Figure 1.
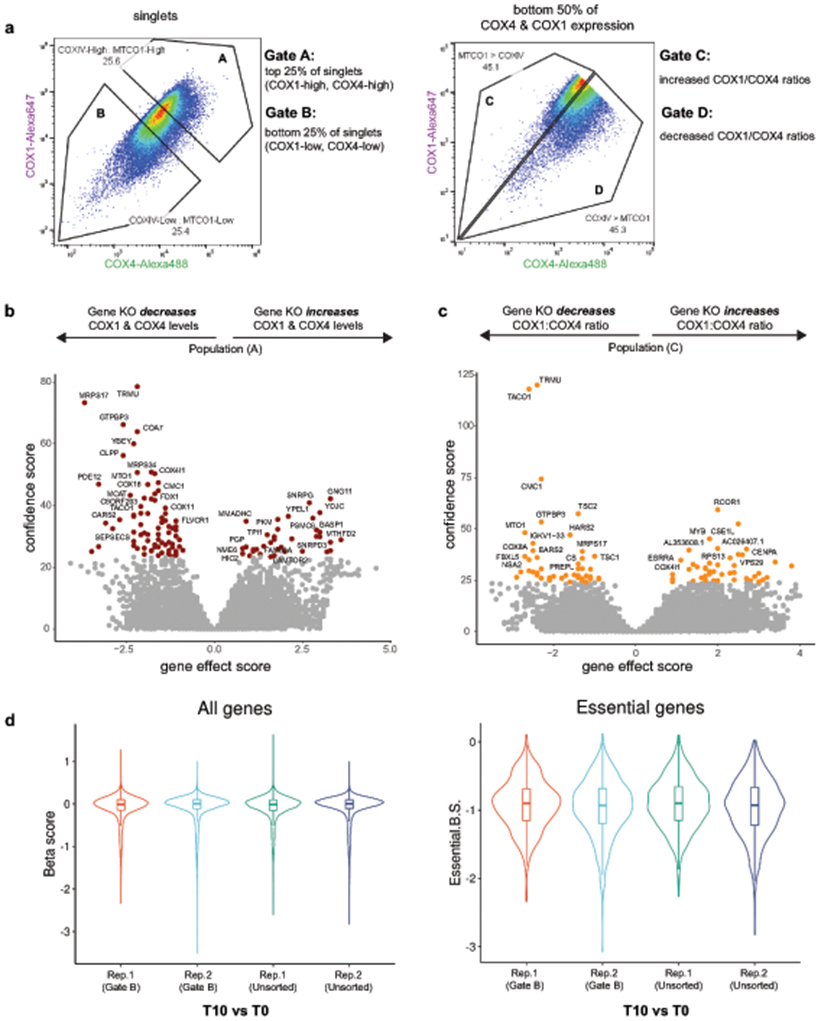
(a) Gating strategies used during flow cytometry depicting populations sorted for analysis in CRISPR screens. (b, c) Volcano plots of gene effect score (enrichment or depletion of sgRNAs in the sorted population relative to unsorted controls) vs confidence scores of genes identified in Population A and Population C. Colored points = genes passing a 10% FDR threshold. (d) Quality control metrics for CRISPR screens showing violin plots of the beta scores (degree of selection, negative values = negative selection, positive values = positive selection; MAGeCK) for all genes (left) or known essential genes (right) for each sample after 14 days in culture (T14) relative to screen day 0 (T0). sgRNAs targeting known essential genes were negatively selected over time indicating functional Cas9 activity and consistent sgRNA library behavior.
Extended Figure 2.
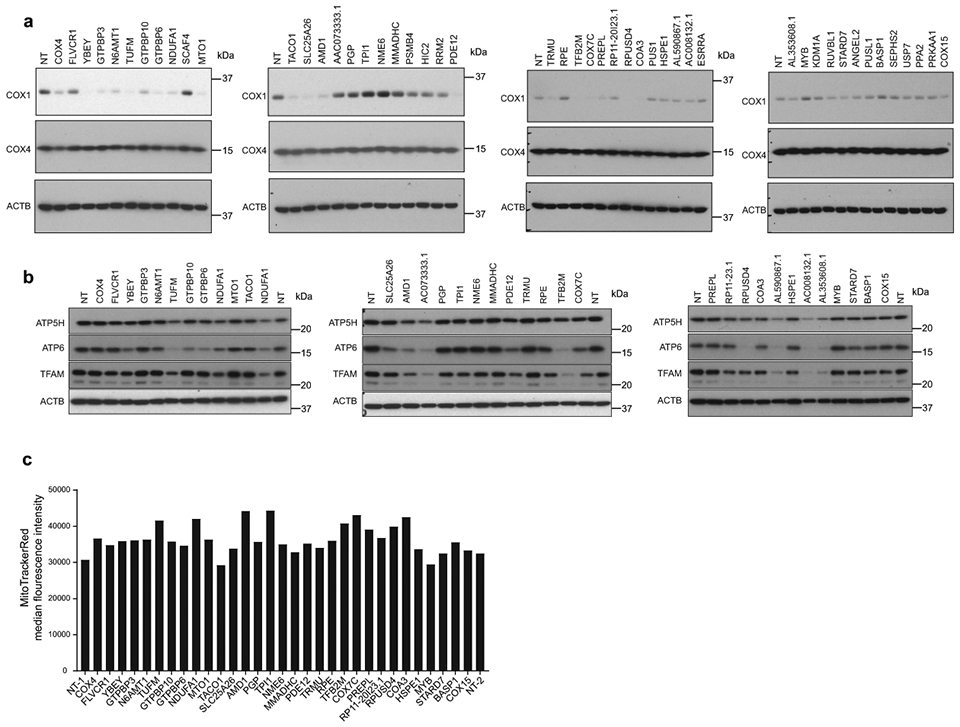
(a) Western blot validation of screen hits after individual sgRNA transductions (NT = non-targeting sgRNA). (b) TFAM and Complex V subunit levels (mito-encoded ATP6, nuclear-encoded ATP5H) levels in selected hits measured by western blotting. (c) FACS analysis of live cells transduced with individual sgRNAs and stained with MitoTracker Red CMXros (data are median fluorescence intensities from 20,000 analyzed cells).
Extended Figure 3.
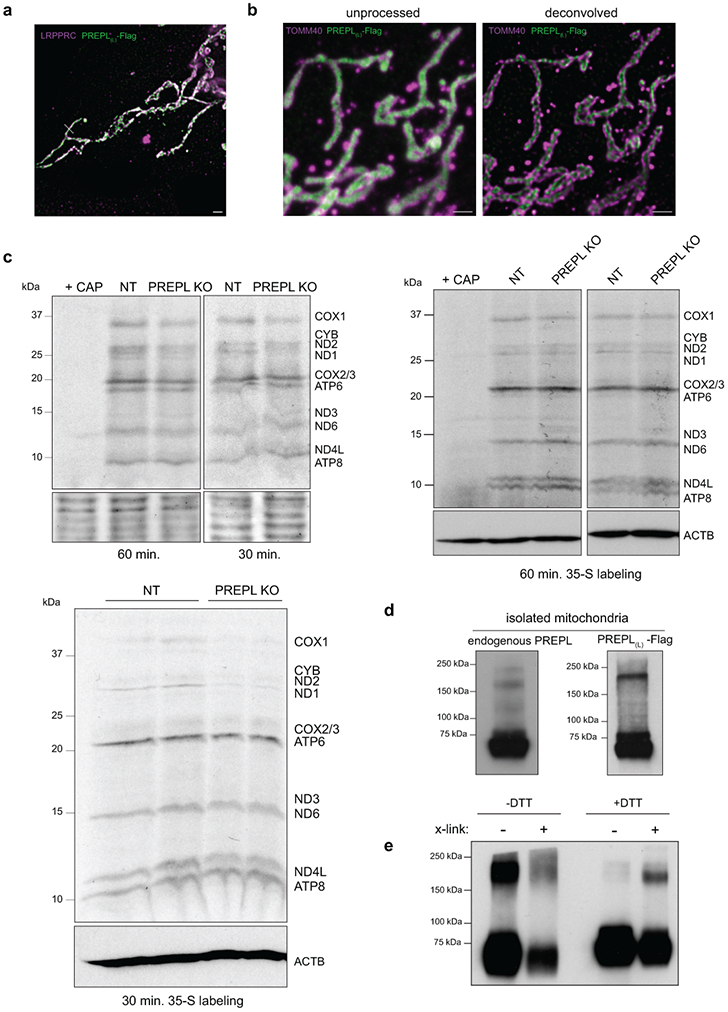
(a) Representative STED micrograph of LRPPRC (magenta; matrix marker) and PREPL(L)-Flag (green) co-staining. Quantification of line scans (across indicated dashed line) of pixel intensity for each fluorescence channel appear in Fig. 3d. (b) STED micrograph showing raw signal compared to deconvolved images using Hyugen’s deconvolution (default parameters, Scientific Volume Imaging; scale bars = 500 nm). (c) 35S-methionine gels to analyze newly synthesized mitochondrial translation products (replicate gels used in quantification presented in Fig. 4f). (d) Immunoblot analysis of PREPL high molecular weight species (potential dimer from purified mitochondrial lysates (K562 endogenous PREPL, left ; K562 cells expressing PREPL-Flag, right). (e) Immunoblot analysis of PREPL putative dimerization after PREPL-Flag immunoprecipitation with or without cross-linking (x-link = crosslinked with 1 mM DSP (dithiobis(succinimidyl propionate, 2hr. at 4C and quenched with Tris pH7.5) and then treated −/+ reducing agent DTT (50 mM, 95C for 10 min) after immunoprecipitation.
Extended Figure 4.
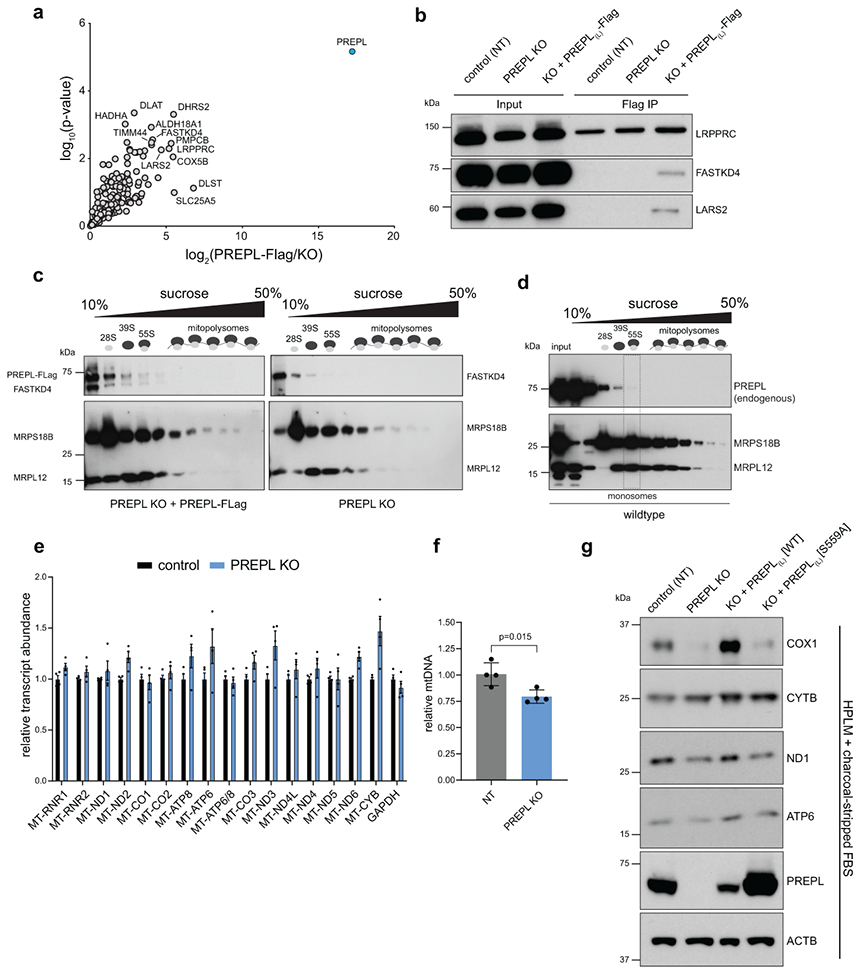
(a) Mass spectrometry identification of proteins in anti-Flag immunoprecipitations from PREPL KO or PREPL-KO + PREPL(L)-Flag whole cell lysates (PREPL(L)-Flag = bait in blue; n = 3 replicates). (b) Co-immunoprecipitation (PREPL-Flag = bait) and western blot analysis of selected mass spectrometry-identified proteins, FASTKD4/TBRG4 and LARS2. (c-d) Sucrose gradient centrifugation and fractionation with western blot detection of mitoribosome subunits, as well as (c) PREPL(L)-Flag and FASTKD4 (MRPS18B = small mitoribosome subunit, MRPL12 = large mitoribosome subunits), and (d) endogenous PREPL. (e) MitoStrings measurements of mt-RNA abundance in control and PREPL KO cells (n = 4 replicates from 2 independent experiments). (f) qPCR measurements of mtDNA levels normalized to nuclear DNA content (mito target = MT-TL1, nuclear target = B2M; n = 4 replicates from 2 independent experiments, data are means +/− SD). (f) Western blot analysis of OXPHOS subunits in NT, PREPL KO, KO + PREPL-WT, and KO + PREPL-S559A, in HPLM media supplemented with charcoal-stripped FBS.
Extended Figure 5.
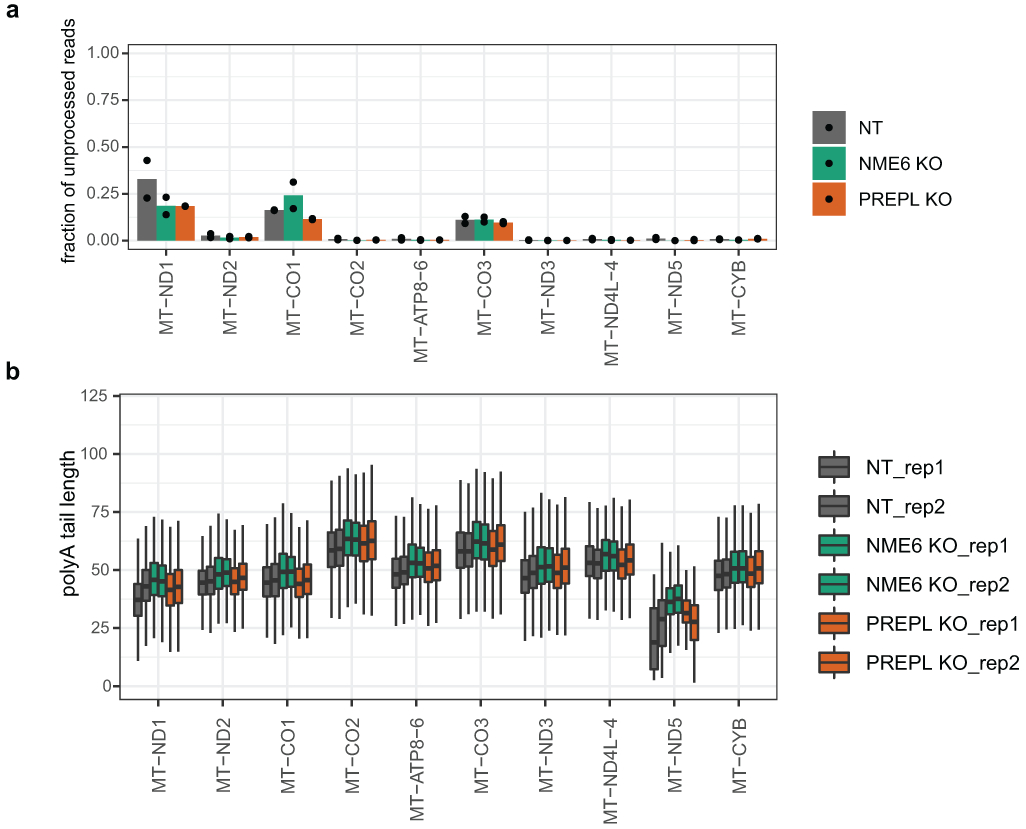
Direct RNA nanopore sequencing in control (NT), PREPL KO and NME6 KO cells. (a) Measurement of 5’-end processing levels for mt-mRNAs encoded on the heavy strand and (b) poly(A) tail lengths of mt-mRNAs in control, NME6 KO and PREPL KO cells. Two biological replicates are shown as dots in (a) and side-by-side in (b).
Extended Figure 6.
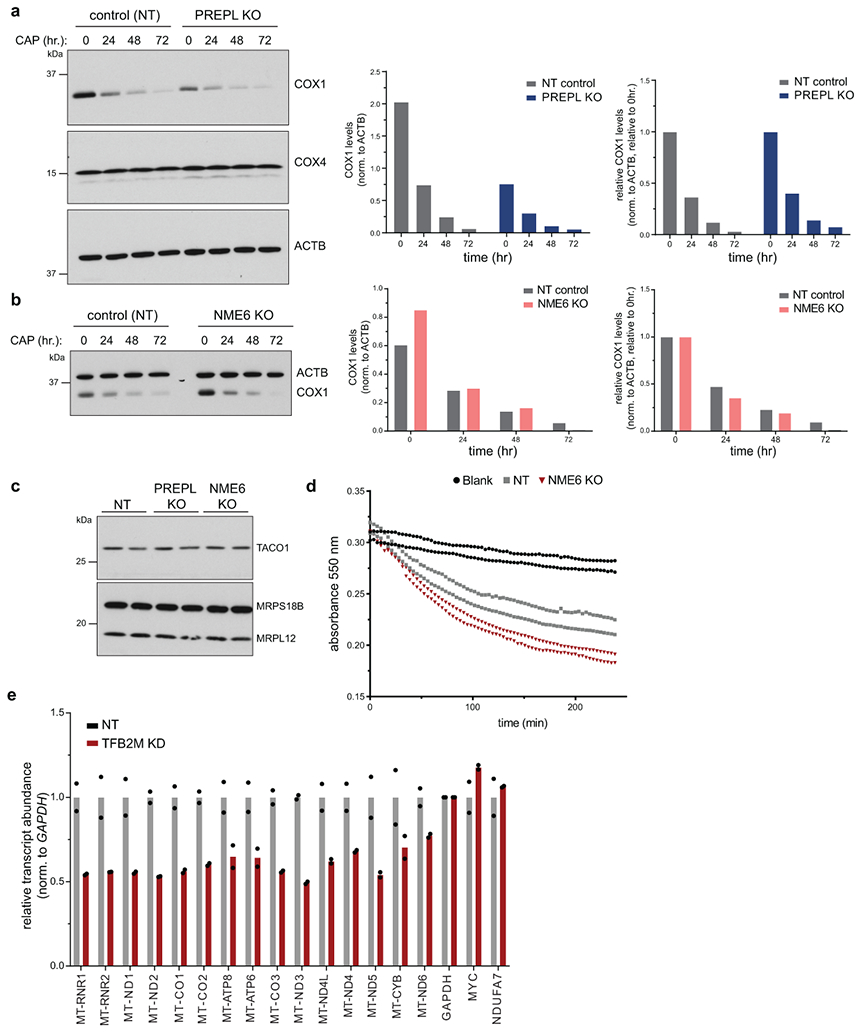
Mitochondrial protein turnover assays in (a) PREPL KO cells or (b) NME6 KO cells. Left panels: Cells were pulsed with 200 μg/mL chloramphenicol (CAP) to inhibit new mitochondrial protein synthesis for 0, 24 hr, 48 hr, or 72 hr., and proteins were detected via western blotting. Right panels: Quantifications of COX1 bands by densitometry were normalized to ACTB levels and plotted directly or normalized to time = 0 timepoints for each genotype to correct for the steady state subunit abundance levels in PREPL or NME6 KO cells. (c) Western blot analysis of TACO1 levels in PREPL KO or NME6 KO cells, MRPS18B and MRPL12 were used for loading controls. (d) Complex IV enzymatic activity measured colorimetrically by monitoring the oxidation of reduced cytochrome c over time from mitochondrial lysates immunocaptured on microplate wells coated with anti-Complex IV antibodies (related to Fig 5j). Shown here are the activities for 10 μg mitochondrial protein added per well in control and NME6 KO cells. Activities in OD/min were determined for Fig 5j by calculating the slope between 2 time points within the linear range of activity. (e) MitoStrings quantifications of RNA transcript abundance in control (NT) or TFB2M pooled CRISPR knock down cells (n = 2 independent cultures, data are means +/− SD).
Extended Figure 7.
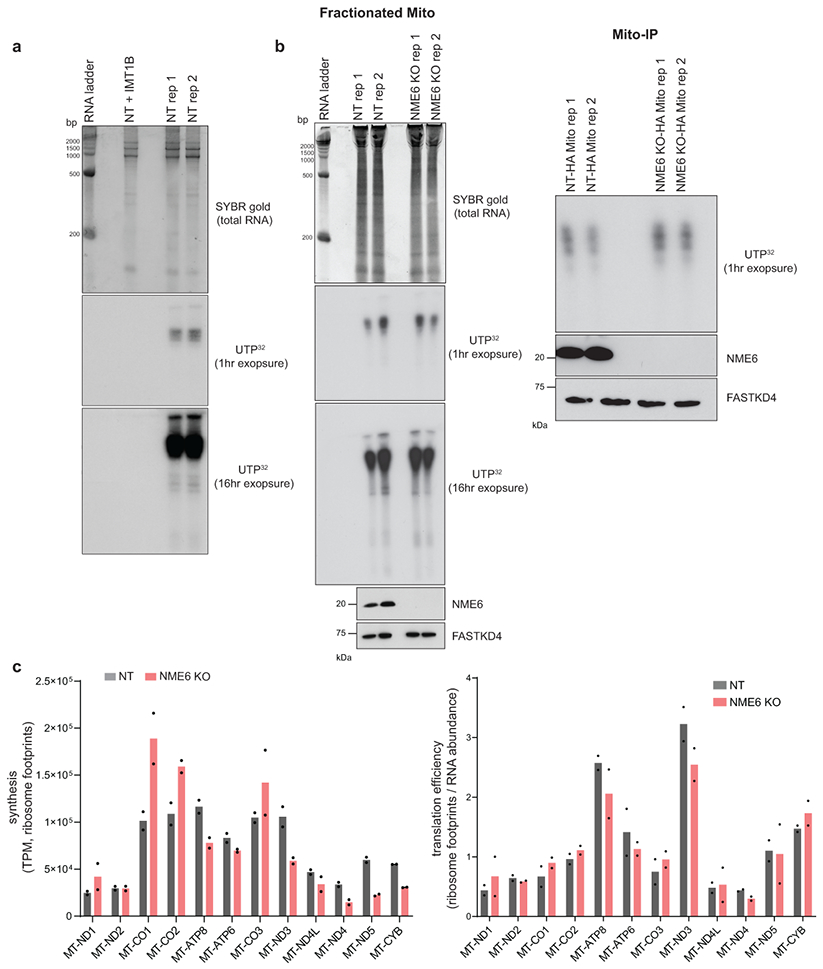
In organello mitochondrial transcription visualized by 32P-UTP labeling in purified mitochondria. RNA was visualized using TBE-urea PAGE, followed by autoradiography of newly synthesized mt-RNA. SYBR gold staining of total RNA and western blots on input mitochondrial lysates were included for controls. (a) IMT1B was used as a positive control to inhibit mitochondrial transcription in NT control cells (5uM, 2 hr. pre-treatment in culture and maintained in labeling reaction). (b) Transcription assays from fractionated or mito-IP purified mitochondria in NT and NME6 KO cells. (c) Ribosome profiling analysis plotting synthesis (TPM = transcript per million) using mitoribosome protected footprints mapped to mitochondrial RNAs (related to Fig. 8c).
Extended Figure 8.
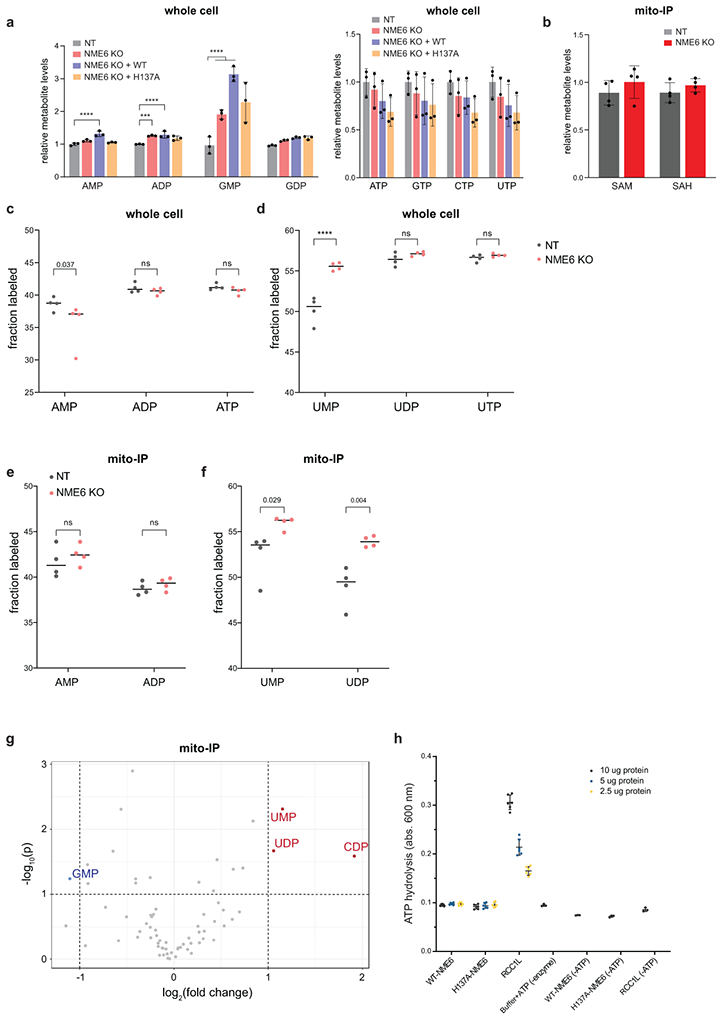
(a) Metabolite levels quantified by mass spectrometry in whole cell extractions from NT, NME6 KO, and WT/H137A rescue cell lines (relative to NT; n = 3 independent cultures). (b) Metabolite levels in NT or NME6 KO mito-IP cell lines after HA-immunoprecipitation (relative to NT; n = 4 independent cultures). SAM = S-adenosylmethionine, SAH = S-adenosylhomocysteine. (c-f) Isotope tracing using 13C-labeled glucose (22 hr. labeling) and mass spectrometry detection of labeling efficiency for plotted metabolites (c-d = whole cell lysates, e-f = mito-IP lysates). (g) Volcano plot for all confidently detected metabolites in mito-IP extracts comparing fold change in metabolites (NME6 KO/NT) vs significance values. (h) Malachite green phosphate assay showing background control values for data presented in Fig. 7e. Data are all means +/− SD; * p< 0.05, ** p< 0.01, *** p < 0.001, **** p < 0.0001.
Extended Figure 9.
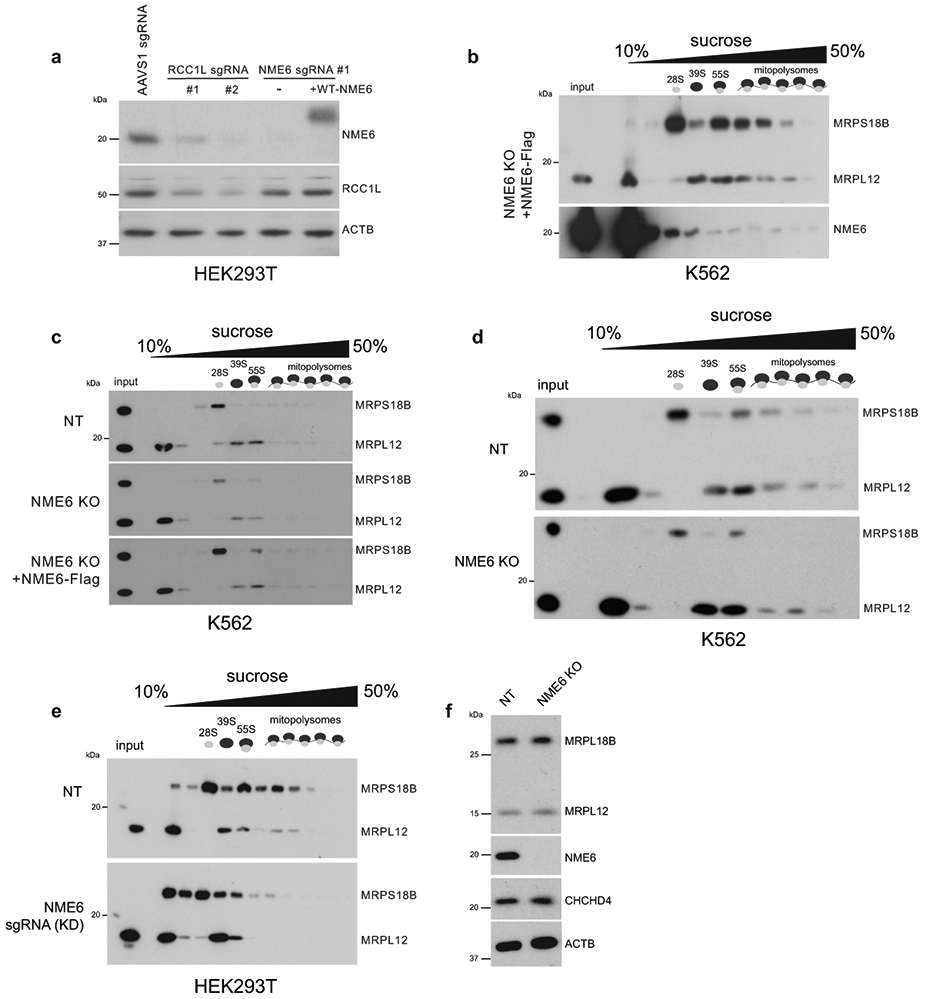
(a) Western blot analysis of HEK293T cells transduced with indicated sgRNAs (AAVS1 = control sgRNA). (b-e) Sucrose gradient centrifugation and fractionation followed by western blotting. (b) NME6 co-sedimentation with mitoribosomes in K562 cells expressing NME6-Flag. (c-e) Mitoribosome assembly phenotypes detected by western blotting after sucrose gradient centrifugation and fractionation using antibodies for small (MRPS18B) and large (MRPL12) mitoribosome subunits to monitor mitoribosome assembly in (c, d) NME6 KO K562 cells and (e) NME6 sgRNA-transduced pooled knockdown (KD) HEK293T cells.
Extended Figure 10.
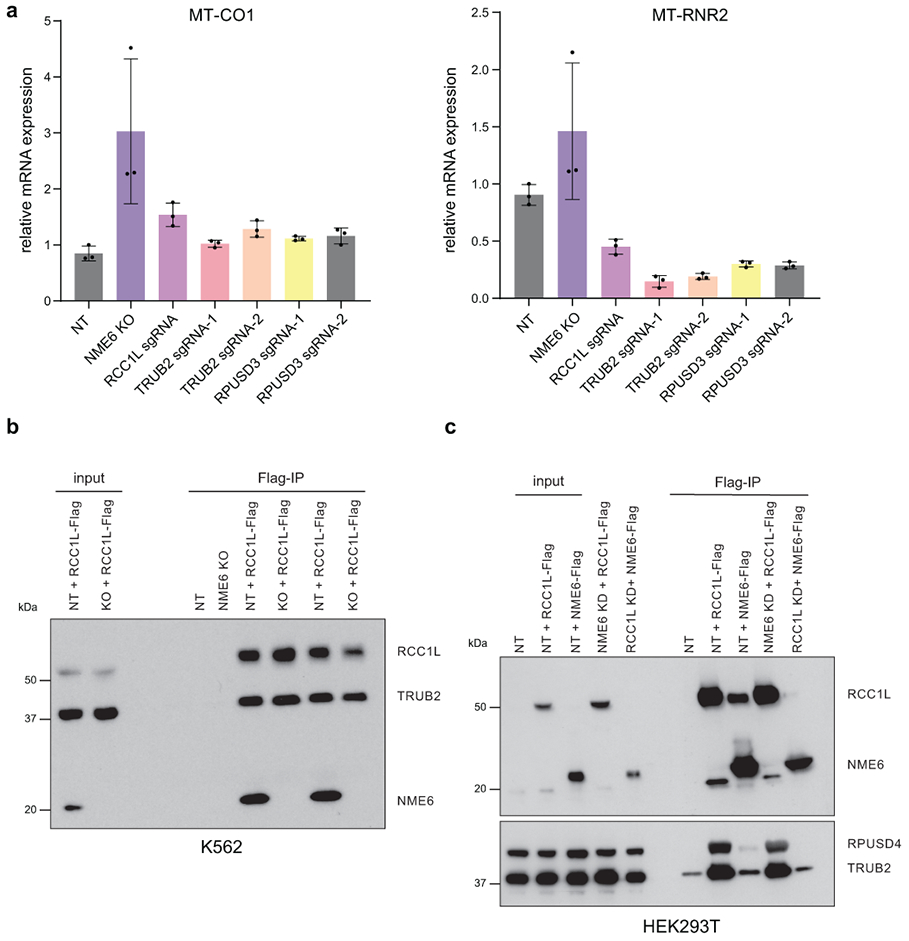
(a) qRT-PCR for MT-CO1 levels (left) or MT-RNR2 levels (right) in NT (control), NME6 KO, or K562 pooled CRISPR knockdown cells with the indicated sgRNAs targeting TRUB2, RCC1L, or RPUSD3. (b, c) Western blot analysis of RCC1L-Flag immunoprecipitations in NT (control) or NME6 KO cell backgrounds in K562 and HEK293T, respectively.
Supplementary Material
Table S1. Gene level data of CRISPR screen hits.
Table S2. Identified proteins from immunoprecipitation-mass spectrometry experiments
Table S3. Metabolite profiling by mass spectrometry: whole cell and mito-IP.
Table S4. List of sgRNA sequences used in this study.
Acknowledgements
We’d like to thank C. Guegler for critical reading of the manuscript, S. Adamson for advice on BN-PAGE experiments, P. Kranzusch for advice on TLC assays, and J. Warner for help with FPLC protein purification. This research was conducted with support from the HMS Electron Microscopy Facility, the HMS Taplin Mass Spectrometry facility, the HMS MicRoN and Neurobiology Imaging Facilities, the Bauer Core facility of Harvard University, and the Boston Children’s Hospital Molecular Genetics Core. This work was supported by the NIH (R01-GM123002 to LSC, F32-GM139244 to NJK) and the Ludwig Neurodegenerative Disease Seed Grants Program at Harvard Medical School. KC is supported by post-doctoral fellowships from the Fonds de Recherche du Québec - Santé and the Canadian Institutes of Health Research. BP and NK are supported by The Smith Family Foundation, NK is a Pew Scholar.
Footnotes
Financial And Non-Financial Competing Interests
Authors have no financial or non-financial competing interests.
Data Availability Statement
Deep-sequencing data that support the findings of this study have been deposited in the Gene Expression Omnibus (GEO) under accession codes GSE224819. Mass spectrometry data have been deposited with ProteomeXchange (PRIDE) with the primary accession code PXD044812. Metabolomics data are available in Supplemental Table 3. Numerical source data and unprocessed blots are available in Source Data. All other data supporting the findings of this study are available from the corresponding author on reasonable request.
Code Availability Statement
Data from TraceFinder was consolidated and normalized with an in-house R script: https://github.com/FrozenGas/KanarekLabTraceFinderRScripts/blob/main/MS_data_script_v2.4_20221018.R
Mitoribosome profiling analysis was done using the Churchman lab’s pipeline: https://github.com/churchmanlab/human-mitoribosome-profiling
References
- 1.Ryan MT & Hoogenraad NJ Mitochondrial-nuclear communications. Annu. Rev. Biochem 76, 701–722 (2007). [DOI] [PubMed] [Google Scholar]
- 2.Mottis A, Herzig S & Auwerx J Mitocellular communication: Shaping health and disease. Science 366, 827–832 (2019). [DOI] [PubMed] [Google Scholar]
- 3.Isaac RS, McShane E & Churchman LS The Multiple Levels of Mitonuclear Coregulation. Annu. Rev. Genet 52, 511–533 (2018). [DOI] [PubMed] [Google Scholar]
- 4.Chan DC Mitochondria: dynamic organelles in disease, aging, and development. Cell 125, 1241–1252 (2006). [DOI] [PubMed] [Google Scholar]
- 5.Wallace DC A mitochondrial paradigm of metabolic and degenerative diseases, aging, and cancer: a dawn for evolutionary medicine. Annu. Rev. Genet 39, 359–407 (2005). [DOI] [PMC free article] [PubMed] [Google Scholar]
- 6.Suomalainen A & Battersby BJ Mitochondrial diseases: the contribution of organelle stress responses to pathology. Nat. Rev. Mol. Cell Biol 19, 77–92 (2018). [DOI] [PubMed] [Google Scholar]
- 7.Vafai SB & Mootha VK Mitochondrial disorders as windows into an ancient organelle. Nature 491, 374–383 (2012). [DOI] [PubMed] [Google Scholar]
- 8.Nunnari J & Suomalainen A Mitochondria: in sickness and in health. Cell 148, 1145–1159 (2012). [DOI] [PMC free article] [PubMed] [Google Scholar]
- 9.Rackham O & Filipovska A Organization and expression of the mammalian mitochondrial genome. Nat. Rev. Genet (2022) doi: 10.1038/s41576-022-00480-x. [DOI] [PubMed] [Google Scholar]
- 10.Kummer E & Ban N Mechanisms and regulation of protein synthesis in mitochondria. Nat. Rev. Mol. Cell Biol 22, 307–325 (2021). [DOI] [PubMed] [Google Scholar]
- 11.Soto I et al. Balanced mitochondrial and cytosolic translatomes underlie the biogenesis of human respiratory complexes. Genome Biol. 23, 170 (2022). [DOI] [PMC free article] [PubMed] [Google Scholar]
- 12.Kujoth GC et al. Mitochondrial DNA mutations, oxidative stress, and apoptosis in mammalian aging. Science 309, 481–484 (2005). [DOI] [PubMed] [Google Scholar]
- 13.Gomes AP et al. Declining NAD(+) induces a pseudohypoxic state disrupting nuclear-mitochondrial communication during aging. Cell 155, 1624–1638 (2013). [DOI] [PMC free article] [PubMed] [Google Scholar]
- 14.Molenaars M, Daniels EG, Meurs A, Janssens GE & Houtkooper RH Mitochondrial cross-compartmental signalling to maintain proteostasis and longevity. Philos. Trans. R. Soc. Lond. B Biol. Sci 375, 20190414 (2020). [DOI] [PMC free article] [PubMed] [Google Scholar]
- 15.Haynes CM & Ron D The mitochondrial UPR - protecting organelle protein homeostasis. J. Cell Sci 123, 3849–3855 (2010). [DOI] [PubMed] [Google Scholar]
- 16.Sutandy FXR, Gößner I, Tascher G & Münch C A cytosolic surveillance mechanism activates the mitochondrial UPR. Nature (2023) doi: 10.1038/s41586-023-06142-0. [DOI] [PMC free article] [PubMed] [Google Scholar]
- 17.Szczepanowska K & Trifunovic A Tune instead of destroy: How proteolysis keeps OXPHOS in shape. Biochim. Biophys. Acta Bioenerg 1862, 148365 (2021). [DOI] [PubMed] [Google Scholar]
- 18.Houtkooper RH et al. Mitonuclear protein imbalance as a conserved longevity mechanism. Nature 497, 451–457 (2013). [DOI] [PMC free article] [PubMed] [Google Scholar]
- 19.Heeren G et al. The mitochondrial ribosomal protein of the large subunit, Afo1p, determines cellular longevity through mitochondrial back-signaling via TOR1. Aging 1, 622–636 (2009). [DOI] [PMC free article] [PubMed] [Google Scholar]
- 20.Delaney JR et al. Stress profiling of longevity mutants identifies Afg3 as a mitochondrial determinant of cytoplasmic mRNA translation and aging. Aging Cell 12, 156–166 (2013). [DOI] [PMC free article] [PubMed] [Google Scholar]
- 21.Caballero A et al. Absence of mitochondrial translation control proteins extends life span by activating sirtuin-dependent silencing. Mol. Cell 42, 390–400 (2011). [DOI] [PubMed] [Google Scholar]
- 22.Boissan M, Schlattner U & Lacombe M-L The NDPK/NME superfamily: state of the art. Lab. Invest 98, 164–174 (2018). [DOI] [PubMed] [Google Scholar]
- 23.Mehus JG, Deloukas P & Lambeth DO NME6: a new member of the nm23/nucleoside diphosphate kinase gene family located on human chromosome 3p21.3. Hum. Genet 104, 454–459 (1999). [DOI] [PubMed] [Google Scholar]
- 24.Tsuiki H et al. A novel human nucleoside diphosphate (NDP) kinase, Nm23-H6, localizes in mitochondria and affects cytokinesis. J. Cell. Biochem 76, 254–269 (1999). [DOI] [PubMed] [Google Scholar]
- 25.Bar-Peled L & Kory N Principles and functions of metabolic compartmentalization. Nat Metab 4, 1232–1244 (2022). [DOI] [PMC free article] [PubMed] [Google Scholar]
- 26.Signes A & Fernandez-Vizarra E Assembly of mammalian oxidative phosphorylation complexes I-V and supercomplexes. Essays Biochem. 62, 255–270 (2018). [DOI] [PMC free article] [PubMed] [Google Scholar]
- 27.Richter-Dennerlein R et al. Mitochondrial Protein Synthesis Adapts to Influx of Nuclear-Encoded Protein. Cell 167, 471–483.e10 (2016). [DOI] [PMC free article] [PubMed] [Google Scholar]
- 28.Morgens DW et al. Genome-scale measurement of off-target activity using Cas9 toxicity in high-throughput screens. Nat. Commun 8, 15178 (2017). [DOI] [PMC free article] [PubMed] [Google Scholar]
- 29.Rath S et al. MitoCarta3.0: an updated mitochondrial proteome now with sub-organelle localization and pathway annotations. Nucleic Acids Res. 49, D1541–D1547 (2021). [DOI] [PMC free article] [PubMed] [Google Scholar]
- 30.Jaeken J et al. Deletion of PREPL, a gene encoding a putative serine oligopeptidase, in patients with hypotonia-cystinuria syndrome. Am. J. Hum. Genet 78, 38–51 (2006). [DOI] [PMC free article] [PubMed] [Google Scholar]
- 31.Régal L et al. PREPL deficiency with or without cystinuria causes a novel myasthenic syndrome. Neurology 82, 1254–1260 (2014). [DOI] [PMC free article] [PubMed] [Google Scholar]
- 32.Régal L et al. PREPL deficiency: delineation of the phenotype and development of a functional blood assay. Genet. Med 20, 109–118 (2018). [DOI] [PubMed] [Google Scholar]
- 33.Chabrol B et al. Deletion of C2orf34, PREPL and SLC3A1 causes atypical hypotonia-cystinuria syndrome. BMJ Case Rep. 2009, (2009). [DOI] [PMC free article] [PubMed] [Google Scholar]
- 34.Yang Q et al. PREPL Deficiency: A Homozygous Splice Site PREPL Mutation in a Patient With Congenital Myasthenic Syndrome and Absence of Ovaries and Hypoplasia of Uterus. Front. Genet 11, 198 (2020). [DOI] [PMC free article] [PubMed] [Google Scholar]
- 35.Parvari R et al. A recessive contiguous gene deletion of chromosome 2p16 associated with cystinuria and a mitochondrial disease. Am. J. Hum. Genet 69, 869–875 (2001). [DOI] [PMC free article] [PubMed] [Google Scholar]
- 36.Rosier K et al. Prolyl endopeptidase-like is a (thio)esterase involved in mitochondrial respiratory chain function. iScience 24, 103460 (2021). [DOI] [PMC free article] [PubMed] [Google Scholar]
- 37.Cantor JR et al. Physiologic Medium Rewires Cellular Metabolism and Reveals Uric Acid as an Endogenous Inhibitor of UMP Synthase. Cell 169, 258–272.e17 (2017). [DOI] [PMC free article] [PubMed] [Google Scholar]
- 38.Wolf AR & Mootha VK Functional genomic analysis of human mitochondrial RNA processing. Cell Rep. 7, 918–931 (2014). [DOI] [PMC free article] [PubMed] [Google Scholar]
- 39.Chen WW, Freinkman E & Sabatini DM Rapid immunopurification of mitochondria for metabolite profiling and absolute quantification of matrix metabolites. Nat. Protoc 12, 2215–2231 (2017). [DOI] [PMC free article] [PubMed] [Google Scholar]
- 40.Proust B et al. NME6 is a phosphotransfer-inactive, monomeric NME/NDPK family member and functions in complexes at the interface of mitochondrial inner membrane and matrix. Cell Biosci. 11, 195 (2021). [DOI] [PMC free article] [PubMed] [Google Scholar]
- 41.Reyes A, Favia P, Vidoni S, Petruzzella V & Zeviani M RCC1L (WBSCR16) isoforms coordinate mitochondrial ribosome assembly through their interaction with GTPases. PLoS Genet. 16, e1008923 (2020). [DOI] [PMC free article] [PubMed] [Google Scholar]
- 42.Huang G et al. WBSCR16 Is a Guanine Nucleotide Exchange Factor Important for Mitochondrial Fusion. Cell Rep. 20, 923–934 (2017). [DOI] [PMC free article] [PubMed] [Google Scholar]
- 43.Antonicka H et al. A High-Density Human Mitochondrial Proximity Interaction Network. Cell Metab. 32, 479–497.e9 (2020). [DOI] [PubMed] [Google Scholar]
- 44.Antonicka H et al. A pseudouridine synthase module is essential for mitochondrial protein synthesis and cell viability. EMBO Rep. 18, 28–38 (2017). [DOI] [PMC free article] [PubMed] [Google Scholar]
- 45.Arroyo JD et al. A Genome-wide CRISPR Death Screen Identifies Genes Essential for Oxidative Phosphorylation. Cell Metab. 24, 875–885 (2016). [DOI] [PMC free article] [PubMed] [Google Scholar]
- 46.Dai Q et al. Quantitative sequencing using BID-seq uncovers abundant pseudouridines in mammalian mRNA at base resolution. Nat. Biotechnol (2022) doi: 10.1038/s41587-022-01505-w. [DOI] [PMC free article] [PubMed] [Google Scholar]
- 47.Martinez NM et al. Pseudouridine synthases modify human pre-mRNA co-transcriptionally and affect pre-mRNA processing. Mol. Cell 82, 645–659.e9 (2022). [DOI] [PMC free article] [PubMed] [Google Scholar]
- 48.Svitkin YV et al. N1-methyl-pseudouridine in mRNA enhances translation through eIF2α-dependent and independent mechanisms by increasing ribosome density. Nucleic Acids Res. 45, 6023–6036 (2017). [DOI] [PMC free article] [PubMed] [Google Scholar]
- 49.Svitkin YV, Gingras A-C & Sonenberg N Membrane-dependent relief of translation elongation arrest on pseudouridine- and N1-methyl-pseudouridine-modified mRNAs. Nucleic Acids Res. (2021) doi: 10.1093/nar/gkab1241. [DOI] [PMC free article] [PubMed] [Google Scholar]
- 50.Nance KD & Meier JL Modifications in an Emergency: The Role of N1-Methylpseudouridine in COVID-19 Vaccines. ACS Cent Sci 7, 748–756 (2021). [DOI] [PMC free article] [PubMed] [Google Scholar]
- 51.Kim KQ et al. N1-methylpseudouridine found within COVID-19 mRNA vaccines produces faithful protein products. Cell Rep. 40, 111300 (2022). [DOI] [PMC free article] [PubMed] [Google Scholar]
- 52.Bonekamp NA et al. Small-molecule inhibitors of human mitochondrial DNA transcription. Nature 588, 712–716 (2020). [DOI] [PubMed] [Google Scholar]
- 53.To T-L et al. A Compendium of Genetic Modifiers of Mitochondrial Dysfunction Reveals Intra-organelle Buffering. Cell 179, 1222–1238.e17 (2019). [DOI] [PMC free article] [PubMed] [Google Scholar]
- 54.Replogle JM et al. Mapping information-rich genotype-phenotype landscapes with genome-scale Perturb-seq. Cell 185, 2559–2575.e28 (2022). [DOI] [PMC free article] [PubMed] [Google Scholar]
- 55.Lone AM et al. Deletion of PREPl causes growth impairment and hypotonia in mice. PLoS One 9, e89160 (2014). [DOI] [PMC free article] [PubMed] [Google Scholar]
- 56.Martens K et al. PREPL: a putative novel oligopeptidase propelled into the limelight. Biol. Chem 387, 879–883 (2006). [DOI] [PubMed] [Google Scholar]
- 57.Szeltner Z, Alshafee I, Juhász T, Parvari R & Polgár L The PREPL A protein, a new member of the prolyl oligopeptidase family, lacking catalytic activity. Cell. Mol. Life Sci 62, 2376–2381 (2005). [DOI] [PMC free article] [PubMed] [Google Scholar]
- 58.Tang JX, Thompson K, Taylor RW & Oláhová M Mitochondrial OXPHOS Biogenesis: Co-Regulation of Protein Synthesis, Import, and Assembly Pathways. Int. J. Mol. Sci 21, (2020). [DOI] [PMC free article] [PubMed] [Google Scholar]
- 59.Van Vranken JG et al. ACP Acylation Is an Acetyl-CoA-Dependent Modification Required for Electron Transport Chain Assembly. Mol. Cell 71, 567–580.e4 (2018). [DOI] [PMC free article] [PubMed] [Google Scholar]
- 60.Busch JD et al. MitoRibo-Tag Mice Provide a Tool for In Vivo Studies of Mitoribosome Composition. Cell Rep. 29, 1728–1738.e9 (2019). [DOI] [PMC free article] [PubMed] [Google Scholar]
- 61.Grotehans N et al. Ribonucleotide synthesis by NME6 fuels mitochondrial gene expression. EMBO J. e113256 (2023). [DOI] [PMC free article] [PubMed] [Google Scholar]
- 62.Schlattner U The Complex Functions of the NME Family-A Matter of Location and Molecular Activity. Int. J. Mol. Sci 22, (2021). [DOI] [PMC free article] [PubMed] [Google Scholar]
- 63.Solmonson A et al. Compartmentalized metabolism supports midgestation mammalian development. Nature 604, 349–353 (2022). [DOI] [PMC free article] [PubMed] [Google Scholar]
- 64.Zhu J et al. Mitochondrial NADP(H) generation is essential for proline biosynthesis. Science 372, 968–972 (2021). [DOI] [PMC free article] [PubMed] [Google Scholar]
- 65.Tran DH et al. Mitochondrial NADP+ is essential for proline biosynthesis during cell growth. Nat Metab 3, 571–585 (2021). [DOI] [PMC free article] [PubMed] [Google Scholar]
- 66.Rossiter NJ et al. CRISPR screens in physiologic medium reveal conditionally essential genes in human cells. Cell Metab. 33, 1248–1263.e9 (2021). [DOI] [PMC free article] [PubMed] [Google Scholar]
- 67.Pal S et al. A druggable addiction to de novo pyrimidine biosynthesis in diffuse midline glioma. Cancer Cell 40, 957–972.e10 (2022). [DOI] [PMC free article] [PubMed] [Google Scholar]
- 68.Kramer NJ et al. CRISPR–Cas9 screens in human cells and primary neurons identify modifiers of C9ORF72 dipeptide-repeat-protein toxicity. Nat. Genet 50, 603–612 (2018). [DOI] [PMC free article] [PubMed] [Google Scholar]
- 69.Morgens DW, Deans RM, Li A & Bassik MC Systematic comparison of CRISPR/Cas9 and RNAi screens for essential genes. Nat. Biotechnol 34, 634–636 (2016). [DOI] [PMC free article] [PubMed] [Google Scholar]
- 70.Kim G et al. Genome-wide CRISPR screen reveals v-ATPase as a drug target to lower levels of ALS protein ataxin-2. Cell Rep. 41, 111508 (2022). [DOI] [PMC free article] [PubMed] [Google Scholar]
- 71.Li W et al. MAGeCK enables robust identification of essential genes from genome-scale CRISPR/Cas9 knockout screens. Genome Biol. 15, 554 (2014). [DOI] [PMC free article] [PubMed] [Google Scholar]
- 72.Salabei JK, Gibb AA & Hill BG Comprehensive measurement of respiratory activity in permeabilized cells using extracellular flux analysis. Nat. Protoc 9, 421–438 (2014). [DOI] [PMC free article] [PubMed] [Google Scholar]
- 73.Carlile TM, Rojas-Duran MF & Gilbert WV Chapter Eleven - Pseudo-Seq: Genome-Wide Detection of Pseudouridine Modifications in RNA. in Methods in Enzymology (ed. He C) vol. 560 219–245 (Academic Press, 2015). [DOI] [PMC free article] [PubMed] [Google Scholar]
- 74.Smalec BM et al. Genome-wide quantification of RNA flow across subcellular compartments reveals determinants of the mammalian transcript life cycle. bioRxiv 2022.08.21.504696 (2022) doi: 10.1101/2022.08.21.504696. [DOI] [PMC free article] [PubMed] [Google Scholar]
- 75.Jha P, Wang X & Auwerx J Analysis of Mitochondrial Respiratory Chain Supercomplexes Using Blue Native Polyacrylamide Gel Electrophoresis (BN-PAGE). Curr. Protoc. Mouse Biol 6, 1–14 (2016). [DOI] [PMC free article] [PubMed] [Google Scholar]
- 76.Koyama M, Sasaki T, Sasaki N & Matsuura Y Crystal structure of human WBSCR16, an RCC1-like protein in mitochondria. Protein Sci. 26, 1870–1877 (2017). [DOI] [PMC free article] [PubMed] [Google Scholar]
- 77.Li H Minimap2: pairwise alignment for nucleotide sequences. Bioinformatics 34, 3094–3100 (2018). [DOI] [PMC free article] [PubMed] [Google Scholar]
- 78.Workman RE et al. Nanopore native RNA sequencing of a human poly(A) transcriptome. Nat. Methods 16, 1297–1305 (2019). [DOI] [PMC free article] [PubMed] [Google Scholar]
- 79.Jiang S et al. TEFM regulates both transcription elongation and RNA processing in mitochondria. EMBO Rep. 20, (2019). [DOI] [PMC free article] [PubMed] [Google Scholar]
- 80.Xia J, Sinelnikov IV, Han B & Wishart DS MetaboAnalyst 3.0--making metabolomics more meaningful. Nucleic Acids Res. 43, W251–7 (2015). [DOI] [PMC free article] [PubMed] [Google Scholar]
- 81.Salek RM, Steinbeck C, Viant MR, Goodacre R & Dunn WB The role of reporting standards for metabolite annotation and identification in metabolomic studies. Gigascience 2, 13 (2013). [DOI] [PMC free article] [PubMed] [Google Scholar]
Associated Data
This section collects any data citations, data availability statements, or supplementary materials included in this article.
Supplementary Materials
Table S1. Gene level data of CRISPR screen hits.
Table S2. Identified proteins from immunoprecipitation-mass spectrometry experiments
Table S3. Metabolite profiling by mass spectrometry: whole cell and mito-IP.
Table S4. List of sgRNA sequences used in this study.
Data Availability Statement
Deep-sequencing data that support the findings of this study have been deposited in the Gene Expression Omnibus (GEO) under accession codes GSE224819. Mass spectrometry data have been deposited with ProteomeXchange (PRIDE) with the primary accession code PXD044812. Metabolomics data are available in Supplemental Table 3. Numerical source data and unprocessed blots are available in Source Data. All other data supporting the findings of this study are available from the corresponding author on reasonable request.
Data from TraceFinder was consolidated and normalized with an in-house R script: https://github.com/FrozenGas/KanarekLabTraceFinderRScripts/blob/main/MS_data_script_v2.4_20221018.R
Mitoribosome profiling analysis was done using the Churchman lab’s pipeline: https://github.com/churchmanlab/human-mitoribosome-profiling