Abstract
Crustal accretion at mid-ocean ridges governs the creation and evolution of the oceanic lithosphere. Generally accepted models1–4 of passive mantle upwelling and melting predict notably decreased crustal thickness at a spreading rate of less than 20 mm year−1. We conducted the first, to our knowledge, high-resolution ocean-bottom seismometer (OBS) experiment at the Gakkel Ridge in the Arctic Ocean and imaged the crustal structure of the slowest-spreading ridge on the Earth. Unexpectedly, we find that crustal thickness ranges between 3.3 km and 8.9 km along the ridge axis and it increased from about 4.5 km to about 7.5 km over the past 5 Myr in an across-axis profile. The highly variable crustal thickness and relatively large average value does not align with the prediction of passive mantle upwelling models. Instead, it can be explained by a model of buoyant active mantle flow driven by thermal and compositional density changes owing to melt extraction. The influence of active versus passive upwelling is predicted to increase with decreasing spreading rate. The process of active mantle upwelling is anticipated to be primarily influenced by mantle temperature and composition. This implies that the observed variability in crustal accretion, which includes notably varied crustal thickness, is probably an inherent characteristic of ultraslow-spreading ridges.
Subject terms: Geophysics, Tectonics, Volcanology, Seismology
Results from a high-resolution ocean-bottom seismometer experiment at the ultraslow-spreading Gakkel Ridge show unexpected highly variable crustal thickness and a relatively large average value, which can be explained by an active mantle upwelling model.
Main
The mid-ocean ridge is an important window into Earth’s interior processes. It is commonly viewed that the mantle beneath mid-ocean ridges upwells passively owing to viscous drag from the diverging tectonic plates, causing pressure-release melting1,2. Passive mantle upwelling models explain well the observed relatively uniform crustal thickness at fast-spreading ridges. At ultraslow-spreading ridges (full spreading rate <20 mm year−1)4, the crustal thickness should decline substantially because the thick lithosphere inhibits either melting or melt migration5,6. This perspective has been challenged by the recent geophysical observations of substantial time-varying and sometimes thick local crust (up to 10 km) at ultraslow-spreading ridges7–12. Various ‘anomalous’ local factors, including mantle temperature, mantle composition, mantle plumes and focused melt supply, have been proposed to explain the varied melt supply10,11,13–16. Nevertheless, the fundamental dynamics governing crustal accretion at ultraslow-spreading ridges remain elusive.
The slower spreading (full spreading rate of about 10 mm year−1) eastern Gakkel Ridge in the Arctic Ocean is an ideal location to investigate melting processes because here crustal accretion is not directly affected by oblique spreading, large-offset transform faults or nearby hotspots (Fig. 1a,b and Extended Data Fig. 1). We conducted a geophysical survey along the eastern Gakkel Ridge between 76° and 100° E using the icebreaker ‘Xuelong 2’, during the Joint Arctic Scientific Mid-ocean ridge Insight Expedition (JASMInE). A high-resolution seismic survey was conducted using an OBS array, which was previously thought to be immensely challenging owing to the severe sea-ice conditions (Supplementary Fig. 1).
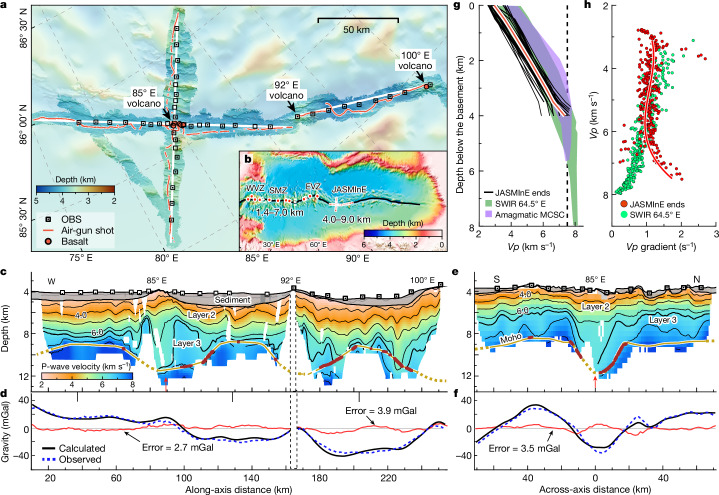
Fig. 1. Survey layout and crustal structure of the JASMInE zone.
a, Bathymetric map of the JASMInE zone. There are three evenly spaced (about 80 km) volcanic centres at 85° E, 92° E and 100° E. b, Bathymetric map of the Gakkel Ridge. Locations and crustal thickness measurements of ice-station seismometers (red circles)16,45, as well as the locations of OBSs (red squares) in the JASMInE zone. EVZ, Eastern Volcanic Zone; SMZ, Sparsely Magmatic Zone; WVZ, Western Volcanic Zone. c, Along-ridge profile illustrating the P-wave velocity (Vp) structure and the Moho from the tomographic model. The two sections comprising the profile were analysed separately, marked here by the dashed frame. Iso-velocity contours are shown every 1 km s−1; the thick line marks the 6.4 km s−1 contour to show the base of layer 2. Brown dots mark the position of the Moho defined by PmP arrivals. The red arrow marks where the along-axis profile intersects the across-axis profile. See Methods, Extended Data Figs. 2–4 and Supplementary Fig. 2 for seismic data processing, model resolution and uncertainties. In the regions in which seismic rays are absent, the Moho (dashed lines) is constrained by forward modelling of gravity data (d and Extended Data Fig. 5). d, Observed and predicted free-air gravity anomaly of along-axis sections. e, Across-ridge profile showing tomographic Vp structure. f, Observed and predicted free-air gravity anomaly of the across-axis profile. g, 1D velocity–depth profiles of the volcanic ends in the along-axis seismic profile overlapped on those of the amagmatic SWIR 64.5° E (ref. 7) and MCSC8. The red line indicates the average of 1D velocity–depth profiles in volcanic ends. h, 1D Vp gradient–Vp profiles of volcanic ends. The profiles are extracted every 2 km at 30–60 km, 120–150 km and 190–220 km of the along-axis profile.
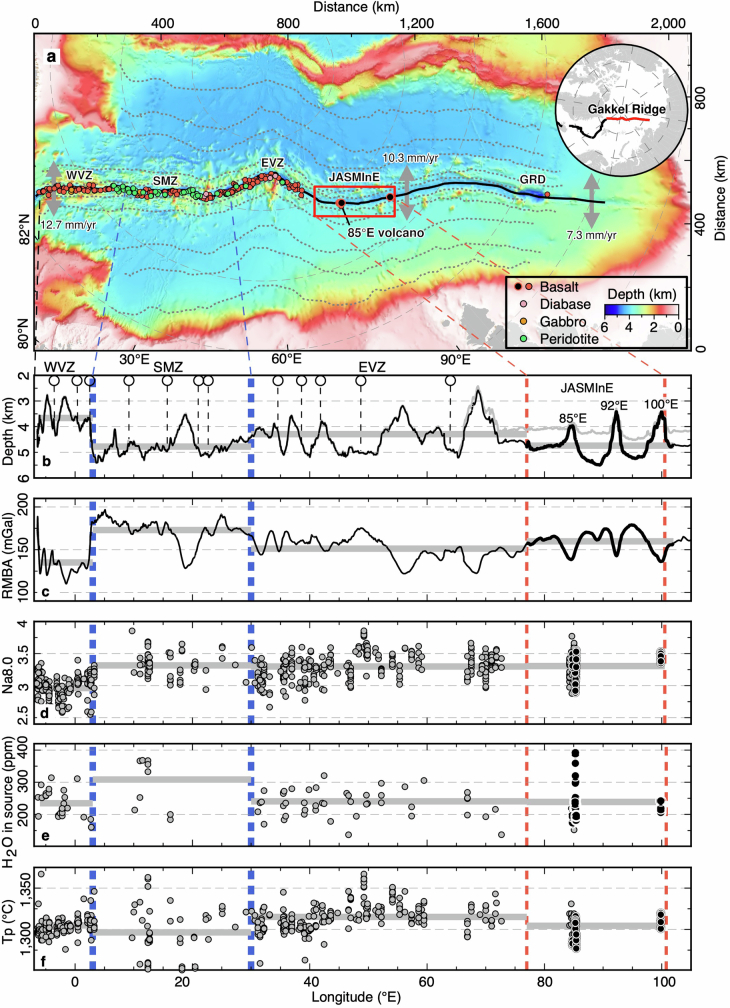
Extended Data Fig. 1. Bathymetric map and along-axis profiles of the Gakkel Ridge.
a, Bathymetric map of the Gakkel Ridge. The full spreading rate of the Gakkel Ridge ranges from 12.7 mm year−1 near the Fram Strait to 7.3 mm year−1 close to the Laptev Sea margin. On the basis of the predominant types of rock sample obtained, the western Gakkel Ridge was divided into the Western Volcanic Zone (WVZ, basalts), the Sparsely Magmatic Zone (SMZ, peridotites) and the Eastern Volcanic Zone (EVZ, basalts)15. GRD, Gakkel Ridge Deep. b, Along-axis depth profiles of the seafloor (grey line) and the basement (black line). In the JASMInE zone, sediment thickness is constrained by sonobuoy data. West of the JASMInE zone, the sediment is assumed to be absent as extensive basalts and peridotites are directly exposed on the seafloor. Circles indicate the positions of seismometers on ice floes16. Most ice-floe seismometers were deployed above the deep part (water depth of 3.8–4.8 km) of the rift valley (that is, segment ends), at which the estimated average crustal thickness is roughly 2.7 km (ref. 16). Near a volcanic centre in the WVZ, the estimated crust thickness is 7 km (ref. 45). Thick grey lines indicate average values of the basement depth. c–f, Along-axis variations in the RMBA, Na8.0 composition of basaltic glasses, H2O in the mantle source and calculated Tp (ref. 26). The average values of each region are indicated by horizontal grey bars. The RMBA is a crude indicator of crustal thickness and/or mantle thermal structure. Black dots indicate data from samples obtained in this study. Na8.0 data suggest that the mantle beneath the Gakkel Ridge has a relatively low Tp and a reduced extent of partial melting15. Tp is calculated using the ReversePetrogen code29. H2O in source is calculated using the method PRIMELT3 MEGA.XLSM68.
Evidence for highly variable crust
Most geological and geophysical surveys along the 1,800-km-long Gakkel Ridge have been conducted to the west of 85° E. The JASMInE study region, located in the eastern Gakkel Ridge, is divided into three distinct topographic segments centred at 85° E, 92° E and 100° E, respectively (Fig. 1a and Extended Data Fig. 1). Overall, the mean crustal thickness (excluding sediments) determined by seismic tomography and gravity modelling is 5.5 km along the 240-km-long axial profile. The segment-averaged crustal thicknesses of the three segments from west to east are 5.2 km, 5.6 km and 6.2 km, respectively (Fig. 1c,d). The maximum crustal thickness reaches 7.5 km at 85° E. Constrained partly by seismic data, the best-fitting gravity model suggests maximum values of crustal thickness of 8.0 km and 8.9 km at centres of the 92° E and 100° E segments, respectively (Extended Data Fig. 5). Within these three segments, the crustal thicknesses at the centres exceed twice those at their segment ends. The thickness of the upper crust (defined by Vp < 6.4 km s−1) ranges from 2 km to 5 km near volcanic centres, whereas it remains relatively uniform, approximately 3–4 km, at segment ends. The thickness of the lower crust (that is, the region between Vp = 6.4 km s−1 and the Moho) varies notably from about 4 km beneath volcanic centres to near zero close to the distal ends (Fig. 1c).
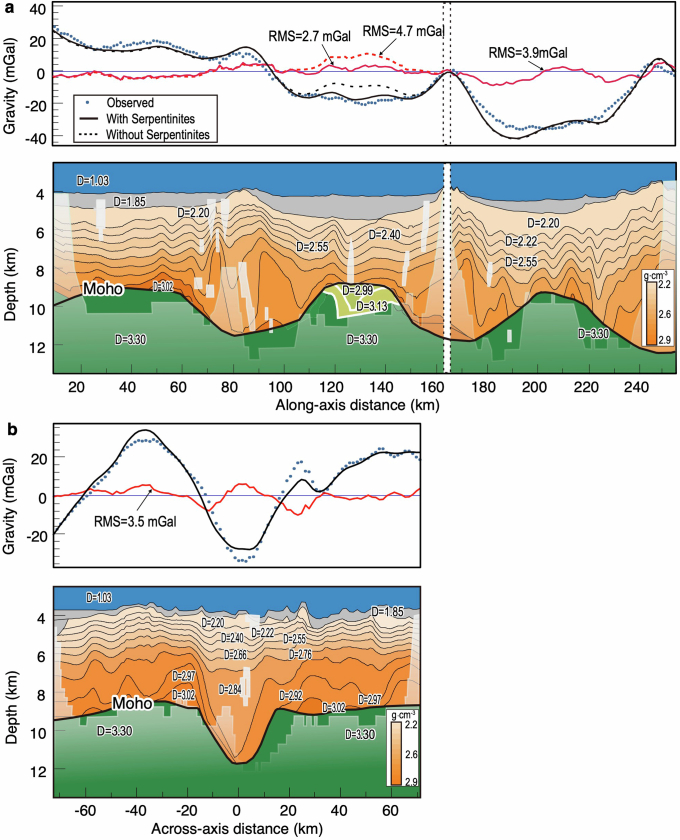
Extended Data Fig. 5. Observed and predicted free-air gravity anomaly along and across the ridge axis.
a, Along the ridge axis. b, Across the ridge axis. For the crustal part, we used the density structure achieved from the velocity structure, along with the velocity–density relationship for igneous crust63. We also tested the presence of low densities in the mantle by applying the velocity–density relationship for serpentinized mantle64 and found that incorporating low-density mantle within the 120–150 km distance along the axis profile (yellow parts) led to reduced errors. These low densities may be attributed to serpentinized mantle17,18 and/or mantle with trapped melts19. A linear trend was removed from the free-air gravity anomaly of the along-axis profile. The magnitude of the linear trend is 7.5 mGal over 240 km, which may reflect the effect of the colder mantle in the east. A cooling effect was corrected from the free-air gravity anomaly of the across-axis profile (Supplementary Fig. 3). The numbers indicate density in g cm−3. On the basis of the 138 crossovers, the root mean square is 0.2 mGal.
The depth gradients of Vp at the segment ends are almost constant for Vp < 6.4 km s−1 (Fig. 1g,h). These gradients are typically associated with thin, highly fractured and altered basaltic crust17,18. In some 1D profiles, the depth gradients of Vp increase abruptly from Vp = 6.4 km s−1 to the seismic Moho, which differs notably from that seen at amagmatic zones of the ultraslow-spreading Southwest Indian Ridge (SWIR) at 64.5° E (ref. 7) and the Mid-Cayman Spreading Centre (MCSC)8. However, the velocity model does not allow discriminating the presence of serpentinites in the crust of segment ends. Beneath the seismic Moho of the segment end between 85° E and 92° E, low densities are required to match the gravity data (Extended Data Fig. 5). These low densities could be attributed to the serpentinized mantle17,18 and/or the mantle with trapped melts19. The seismically determined crustal thickness thus provides a first-order constraint on the amount of melt at the segment ends in the JASMInE zone.
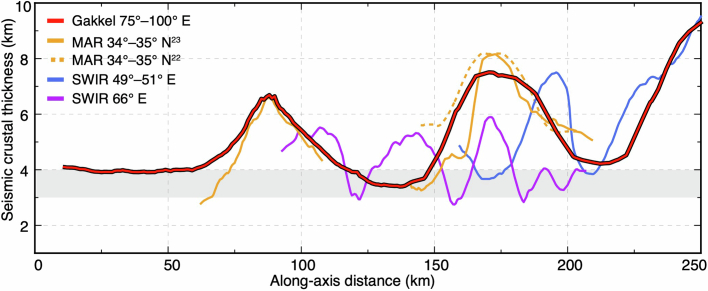
The seismically determined crustal thickness of the along-axis profile is comparable with the global average value of approximately 6 km (refs. 20,21), which is substantially higher than the predictions of about 2 km based on models of passive mantle upwelling and melting1 and the average value of 2.7 km measured by an ice-station-based seismic experiment in the western Gakkel Ridge16. The crust at the centre of the 100° E segment is comparable in thickness with that of the magmatically robust areas on slow-spreading Mid-Atlantic Ridge (MAR) (OH-1 segment)22,23 and ultraslow-spreading SWIR (50.5° E)10,11,24 (Extended Data Fig. 6). These results, together with existing ice-station seismic observations16, reveal a highly variable crustal structure along the Gakkel Ridge, with a segment-averaged crustal thickness ranging from 1.9 km to 6.2 km and local values ranging from 1.4 km to 8.9 km (Figs. 1b and 2a).
Extended Data Fig. 6. Comparison between the along-axis crustal thickness of the JASMInE zone and other slow-spreading and ultraslow-spreading ridges.
The Moho at the MAR (34–35° N)22,23, the SWIR 49–51° E (ref. 10) and the SWIR 66° E (ref. 12) are defined by PmP arrivals. Although the MAR at 34–35° N has a spreading rate roughly twice that of the JASMInE region, their crustal thicknesses and variations along the axis remain comparable22,23. This pattern of anomalously thick crust at a segment centre and large along-axis variations could be observed in both slow-spreading22,23 and ultraslow-spreading ridges12.
Fig. 2. Observed crustal thickness and predictions of buoyant and passive mantle upwelling models.
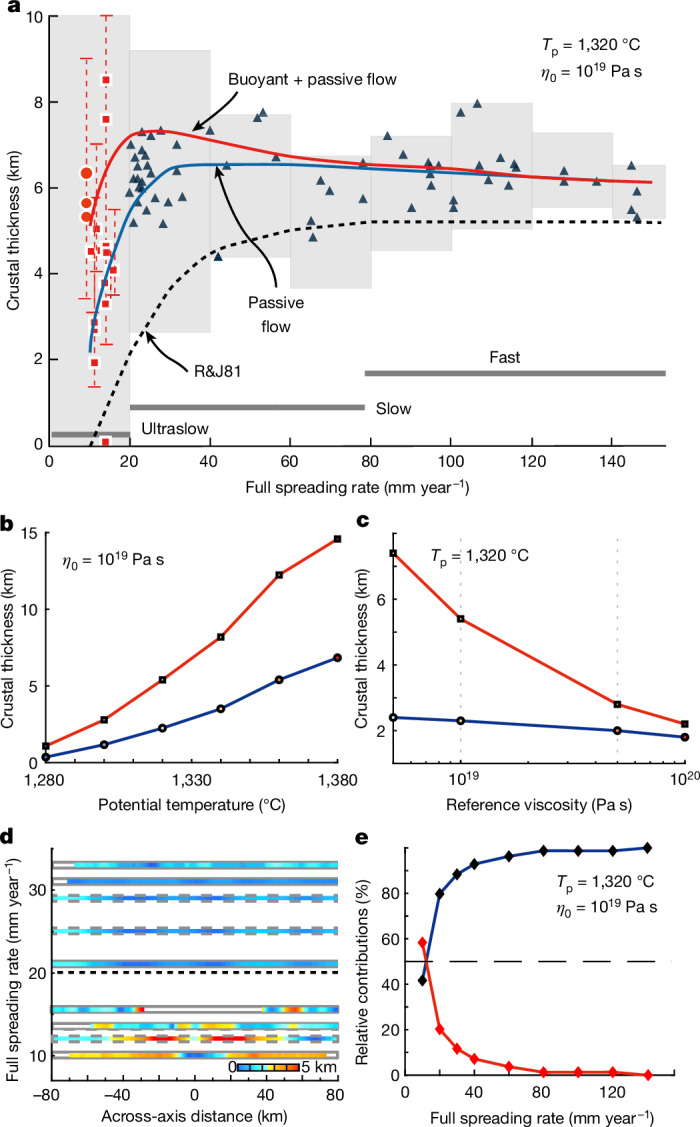
a, Segment-averaged seismic crustal thickness and modelling results versus spreading rate. Red circles mark the three segments in the JASMInE zone. Squares represent other seismic measurements at ultraslow-spreading ridges10,12,16,45. Vertical dashed lines show the range of crustal thickness with local maximum and minimum values. Triangles indicate the segment-averaged crustal thickness of faster-spreading ridges46, omitting measurements proximate to hotspots or fracture zones, which could be substantially influenced by large perturbations in mantle temperature or composition. The shaded regions represent the maxima of the binning of the seismically determined crustal thickness21,46,47 (Supplementary Fig. 5). The blue and red lines indicate the simulated crustal thickness of the passive mantle upwelling with the lithospheric wedge2 and active mantle upwelling models, respectively. The modelled results of the pure passive mantle upwelling model1 are also shown as a dashed line. b,c, Sensitivity of crustal thickness to mantle temperature and mantle viscosities at a full spreading rate of 10 mm year−1. Red and blue lines indicate the results of active and passive mantle upwelling models, respectively. d, Across-axis profiles of seismic (solid frame) and gravity-determined (dashed frame) crustal thickness at slow-spreading and ultraslow-spreading ridges7,8,48–50 (Extended Data Fig. 9 and Supplementary Fig. 6). To highlight temporal variations, the minimum value of each profile was removed. From top to bottom, the profiles are MAR 5° S, MAR 2° S, MAR 2° N, MAR 26° N, MAR 45° N, MCSC, SWIR 64.5° E, Gakkel 19° E and Gakkel 85° E. e, Spreading-rate dependence of active versus passive mantle upwelling. The red and blue lines indicate the ratio of the crust created by active and passive mantle upwelling, respectively.
The crust imaged across the ridge axis at the 85° E volcanic centre is generally symmetrical on conjugate flanks but exhibits substantial variations (Fig. 1e,f). The crustal thickness decreases from 7.5 km to approximately 4.5 km from the ridge axis to both flanks over a distance of 20–30 km, indicating an enhanced axial melt supply from about 5 Myr ago to the present. The gravity data also align with the seismically observed pattern of increased melt supply near the ridge axis (Fig. 1f and Supplementary Fig. 3). The gravity data coverage suggests that this pattern extended to a larger area (width >20 km), rather than being limited to the isolated volcano. Near the ridge axis, the thickness between iso-velocity contours of 6.0 km s−1 and 6.4 km s−1 can exceed 4.0 km. This intriguing observation can be compared with similar findings at the magma-rich segments of the MAR22,25 and the SWIR24, at which deep low-velocity zones are interpreted as indications of high temperatures and melt in this setting22.
To investigate the effect of mantle compositions on melt production, fresh basalts were collected at the volcanic centres of 85° E and 100° E (Supplementary Fig. 1), at which sediments are very thin or absent. Basalts at both segments have similar 87Sr/86Sr (0.702576–0.702723 and 0.702575–0.702678) and εNd (8.7–9.5 and 8.7–9.3) values (Supplementary Table 1), overlapping with estimates for average global normal mid-ocean ridge basalts (MORB)26,27. The water content in the mantle source varies widely between 170 ppm and 392 ppm at the 85° E volcanic centre; this range narrows to about 217 ± 13 ppm at the 100° E volcanic centre (Extended Data Fig. 1e). Combined with the data from previous studies26,27, the average mantle water content in the JASMInE zone is 245 ppm, suggesting a relatively water-enriched mantle compared with the source of Pacific MORB (<200 ppm)27,28. The inferred mantle potential temperature (Tp) of the JASMInE zone ranges between 1,280 °C and 1,320 °C (Extended Data Fig. 1f), with averages of about 1,300 °C and about 1,310 °C at 85° E and 100° E, respectively (Supplementary Table 2). The inferred Tp in the JASMInE zone (average Tp = 1,305 °C) falls within the global average range of 1,322 ± 56 °C (ref. 29) and is close to the Tp of Pacific MORB (average Tp = 1,300 °C) and slightly higher than the average of roughly 1,290 °C (ranging between 1,250 °C and 1,370 °C) observed within the Sparsely Magmatic Zone (SMZ) of the Gakkel Ridge (Extended Data Fig. 1f).
Variable magmatic accretion
Our observations suggest that the crust in the JASMInE zone is relatively thick, with the maximum crustal thickness being approximately twice the minimum value in both along-axis and across-axis profiles. The highly diverse crustal thickness markedly differs from the relatively uniform crust observed at fast-spreading ridges20,21 and contradicts the very thin crust predicted by models of passive mantle upwelling and melting1,2.
The ridge axis within the JASMInE zone seems to be undergoing a surge of enhanced melt supply at present. The observed thick (7.5–8.9 km) crust at the three segment centres and the vanishing layer 3 (generally interpreted as gabbros) near segment ends suggests that there was concentrated melt supply to segment centres at depth, followed by a shallower along-axis redistribution of magma to segment distal ends. Along an ultraslow-spreading ridge axis, the permeability barrier near the base of the lithosphere could be strong30 and relatively steep31. This could facilitate the migration of melts in the melting column towards the centre at the lithospheric base32. By contrast, across-axis melt focusing may be less efficient, as suggested by ref. 33. The virtually absent layer 3 near segment ends could be analogous to observations at other slow-spreading and ultraslow-spreading ridges12,22,34, being consistent with a model in which the upper crust away from a segment centre is mostly constructed by dyke intrusions from the segment centre12,32,35.
Considering the typical MORB mantle source (Supplementary Table 1), the mantle temperature and the relative water enrichment in the JASMInE zone, models of passive mantle upwelling and wet melting36 predict a crustal thickness to be approximately 2 km (Supplementary Fig. 4). Focused melting along a ridge axis may redistribute melts in a segment and produces a locally thick crust at the segment centre, yet it cannot alter the segment-averaged melt volume. A conceptual model involving melt that pools at the base of thick lithosphere until a large-volume eruption was proposed to explain the presence of episodic enhanced magmatism across the eastern SWIR and the western Gakkel Ridge37,38. This model seems to be inconsistent with the observation of crust >4 km along the entire across-axis profile at the 85° E segment. Therefore, the unexpectedly thick crust observed at 85° E and 100° E cannot be straightforwardly ascribed to passive upwelling of anomalous mantle temperature or composition coupled with along-axis melt migration.
We investigated whether active mantle upwelling can explain the observed anomalously thick and time-varying crust seen at the Gakkel Ridge (Fig. 2a and Extended Data Figs. 7 and 8). We used 2D numerical models to simulate the dynamic processes of mantle upwelling and melting (Methods). Here buoyancy-driven active upwelling would be excited by lateral density gradients from thermal expansion, melt retention and melting-related mantle depletion39,40. The change in the chemical composition of the mantle is because of melt extraction, which leads to a lower Fe/Mg in the residual mantle and its associated density reduction. The resulting crustal thickness reflects the combined effects of mantle buoyancy and plate separation.
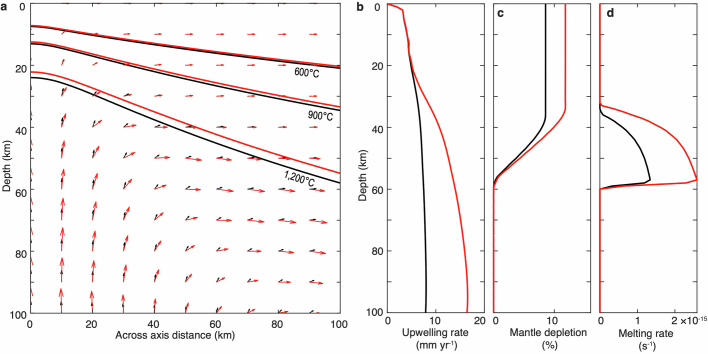
Extended Data Fig. 7. Steady-state model results from passive (black) and buoyant (red) models with half spreading rate of 5 mm year−1, Tp of 1,320 °C and reference mantle viscosity of 1019 Pa s.
a, Mantle flow patterns. The solid lines indicate the isotherms. b–d, Vertical variations of mantle upwelling rate (b), mantle depletion (c) and melting rates (d) beneath the ridge axis.
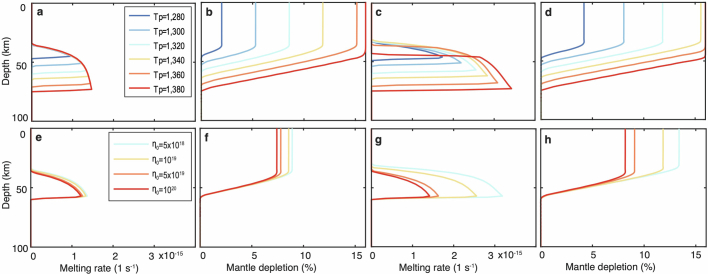
Extended Data Fig. 8. Vertical variations of melting rate and mantle depletion.
Results of the passive (a,b) and the active (c,d) mantle upwelling models at a reference mantle viscosity of 1019 Pa s and varying Tp. Results of the passive (e,f) and the active (g,h) mantle upwelling models at a Tp of 1,320 °C and varying reference mantle viscosity. All the results are calculated with a half spreading rate of 5 mm year−1.
For a ridge with a full spreading rate of 10 mm year−1 and a global average Tp of 1,320 °C, the velocity of the passive mantle upwelling model including the lithospheric wedge2 is predicted to be 7.5 mm year−1 beneath the axial melting zone, with a maximum melt fraction of 8.5% and associated constant crustal thickness of about 2.1 km (Fig. 2a and Extended Data Fig. 7). By contrast, mantle upwelling in buoyant models is further accelerated, inducing an average upwelling velocity beneath the melting zone of about 15 mm year−1. The associated maximum melt fraction is up to 12% (Extended Data Fig. 7), which could generate crust with an average thickness of roughly 5.2 km (Fig. 2a). Thus, given a relative normal mantle temperature and mantle compositions, the active mantle upwelling model prediction could explain the average crustal thickness along the ridge axis in the JASMInE zone.
The melt volume in the active mantle upwelling model is much more sensitive to variations in mantle temperature and viscosity than that of a passive upwelling model (Fig. 2b,c). Owing to the coupled mantle rheology and melting, changes in mantle temperature or composition give rise to positive feedback between the melt fraction and mantle upwelling velocity in the active upwelling model. In the case of a mantle rich in volatiles (for example, water and carbon dioxide) and/or fusible components, this would lead to a higher extent of melting, reducing mantle density and viscosity. Consequently, buoyant mantle upwelling would accelerate, leading to an even greater extent of melting. The variation in the predicted crustal thickness in the active upwelling model is approximately twice that of the passive model for a Tp perturbance of 100 °C (1,280–1,380 °C) with a reference mantle viscosity of 1019 Pa s (Fig. 2b and Extended Data Fig. 8a–d). Given a loosely constrained yet reasonable range of mantle viscosity (5 × 10¹⁸–1020 Pa s at a depth of 100 km)41, the variation in predicted crust thickness in the active model is approximately ten times that of the passive upwelling model (Fig. 2c and Extended Data Fig. 8e–h).
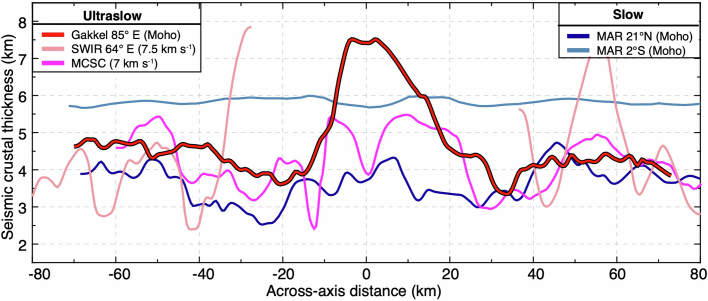
The high sensitivity of active mantle upwelling amplifies the effects of mantle heterogeneity on melt production. Further considering that the melting zone is small beneath an ultraslow-spreading ridge, the extent of melting would then be susceptible to small-scale mantle heterogeneities, which could more frequently trigger marked variations in mantle buoyancy. This susceptibility may account for the observed high-amplitude oscillations (>2 km) of crustal thickness through time at ultraslow-spreading ridges (Fig. 2d, Extended Data Fig. 9 and Supplementary Fig. 6). In the magmatic zones of ultraslow-spreading ridges, mantle domains metasomatized by slab-derived material (SWIR 50° E (ref. 13)), fertile mantle (SWIR 57–60° E (ref. 14)) and/or water-enriched mantle (JASMInE zone) may lead to increased melt production and reduced mantle viscosities. Active mantle upwelling should be more intensive in these regions, which will further enhance melting. At amagmatic zones, in which extensive serpentinized peridotites have been collected, the subaxial mantle could be either more refractory and viscous (SWIR 0–16° E (ref. 42), 64.5° E (ref. 43) and SMZ44) or colder (SMZ; Extended Data Fig. 1f). These effects would reduce both melt fraction and the upwelling velocity of the buoyant mantle, thereby decreasing its melt production.
Extended Data Fig. 9. Across-axis profiles of seismically determined crustal thickness at slow-spreading and ultraslow-spreading ridges7,8,48,49.
For the Gakkel Ridge 85° E (this study), MAR 21° N (ref. 48) and MAR 2° S (ref. 49), the Moho is defined by PmP arrivals. The lower boundary of the crust is defined by Vp = 7.0 km s−1 and Vp = 7.5 km s−1 for the MCSC8 and the SWIR 64° E (ref. 7), at which PmP arrivals are absent, respectively. Ultraslow-spreading ridges exhibit higher variations in crustal thickness than that at the slow-spreading MAR.
Spreading-dependent active upwelling
Extending our modelling approach to the global mid-ocean ridge, we find that the importance of active mantle upwelling on melt production increases with decreasing spreading rate (Fig. 2e). At fast-spreading and intermediate-spreading ridges, a notable fraction of the relatively uniform crust is formed by a high degree of melting in a relatively large melting zone that arises from steady-state passive mantle upwelling, so that the contribution of buoyant mantle upwelling is not prominent. Here the oscillations in crustal thickness, excluding measurements near hotspots or fracture zones, are much subdued (about 2 km) for passive mantle upwelling (Fig. 2a). At slow-spreading and ultraslow-spreading ridges with relatively hot, volatile-rich or fertile mantle, active mantle upwelling could dominate over passive mantle upwelling and locally generate excess melts and thick crust. The high sensitivity of active mantle upwelling, coupled with ubiquitous local mantle temperature and compositional heterogeneity, leads us to suggest that the relatively large variations (up to 5 km) in crustal thickness are an intrinsic characteristic of ultraslow-spreading ridges (Fig. 2d). The spreading-rate dependence of the relative importance of active mantle upwelling versus passive mantle upwelling is predicted to strongly shape the variability in crustal accretion of the global mid-ocean ridges.
Methods
Data acquisition
Active-source seismic refraction experiments with OBSs were conducted during the JASMInE expedition aboard the recently launched icebreaker ‘Xuelong 2’ in August 2021 (ref. 51). Two seismic profiles located at Gakkel 76–92° E and 92–100° E along the ridge axis (roughly 240 km in total) and one profile across the Gakkel 85° E (about 135 km) were recorded, at which the sea ice (thickness of 1.3 m on average) covered >80% of the sea surface. The OBSs were adapted for positioning using short-baseline and/or ultrashort-baseline systems on board. In total, 43 OBSs were deployed with spacing of about 5 km near 85° E and about 10 km for the other regions, and 42 OBSs were successfully recovered. Data from 35 OBSs were used to compute the velocity structure in this study (Fig. 1). Each OBS included three-component geophones and one hydrophone. The seismic source was an air-gun array of 2 × 32.7 litres (4,000 cubic inches) operating at an average shot interval of 32 s (approximately 30–60 m shot spacing) with a pressure of 10.79 MPa. A total of 5,252 shots were recorded.
Bathymetry, gravity and sonobuoys data, as well as rock samples, were also collected during the JASMInE expedition (Extended Data Fig. 1). Bathymetry data were collected with a SeaBeam 3020 multibeam system. A total of 108 sonobuoys were deployed to measure the sediment structure. Shipborne gravity data were recorded using a Micro-g S model gravimeter. Rock samples, primarily containing basalts, were collected at six TV-grab stations at the nearly sediment-free 85° E and 100° E volcanic centres.
Seismic data processing
The OBS data processing included corrections for OBS clock drifts, relocations of OBSs and shots using direct arrivals and seismic signal processing using band-pass filtering between 4 and 20 Hz. The final straight-line approximation of the profile was calculated by performing a least-squares fit on all shots of the profile. The depth of each OBS was initially estimated from bathymetric data and then adjusted by fitting the direct water arrivals.
Seismic phase analysis and selection
Seismic phases were identified using initial-travel-time modelling. We identified the direct water wave (Pw), the refracted waves from oceanic layers 2 (P2) and 3 (P3), the Moho reflection (PmP) and the refracted wave from the upper mantle (Pn).
The Pw and P2 arrivals were recorded by all OBSs (Supplementary Table 3), except for OBS 12. Maximum offsets of the Pn phase were observed up to 40 km (Extended Data Fig. 2 and Supplementary Fig. 2), making a good overlap control for the velocity models. Travel-time uncertainties were dominated by uncertainties in phase picking and off-profile time errors (Extended Data Table 1). According to the signal-to-noise ratio and band-pass filter parameters (4–20 Hz)52, we estimated the picking uncertainties to be about 50, 60, 80, 100 and 120 ms for Pw, P2, P3, PmP and Pn arrivals, respectively. To account for the difference in water depth between the true and modelled shot locations, we added an uncertainty term for each pick, with calculated values ranging from 1 ms to 130 ms (Extended Data Table 1). The extra time uncertainties were calculated by
in which Tunc is the time uncertainty, Ds0 is the depth of the true shot position, Ds1 is the depth of the modelled shot position, Vwater is the P-wave water velocity (1.5 km s−1) and Vsed is the average sediment velocity in our final velocity model.
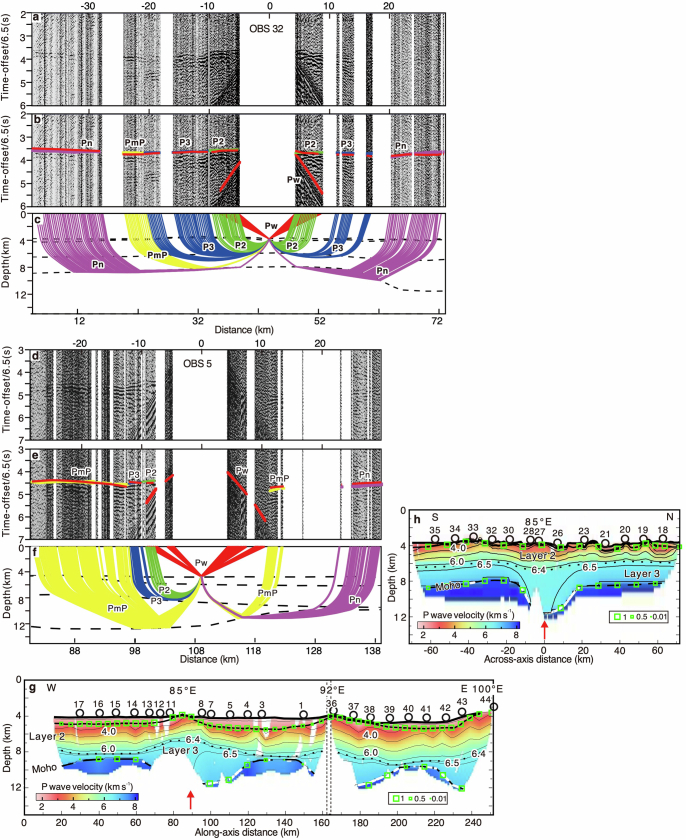
Extended Data Fig. 2. Seismic sections and travel-time ray tracing based on the forward model of OBSs 32 and 5 and forward P-wave velocity models.
a, A seismic section of the hydrophone component of OBS 32 in the across-axis profile. b, The recorded section with picked and calculated travel time overlaid. Red lines represent the predicted travel time. The coloured vertical bars represent the observed travel time in the same colour of rays in panel c. The size of the vertical bars indicates twice the uncertainty52. P2 and P3, refracted rays from oceanic layers 2 and 3, respectively; PmP, reflected rays at the Moho; Pn, turning rays in the upper mantle. c, A simulation of ray tracing using the final forward model. The dashed black lines represent the seabed, the sediment basement, the interface between oceanic layer 2 and layer 3 and the Moho discontinuity, from top to bottom. d–f, Seismic section of OBS 5. We select the two OBSs to show the good (OBS 32) and poor quality (OBS 5) of the raw OBS data. g,h, The forward seismic P-wave velocity structures. Thick black lines represent the seabed and sediment basement. Thin black lines indicate the contour of Vp in every 1 km s−1. The dotted line represents the iso-velocity contour of 6.4 km s−1. The thick dashed black lines show the Moho discontinuity, on which the sections constrained by PmP reflections are marked with thick white lines. The green rectangles along the interfaces represent the values of resolution for the velocity nodes of the top of layer 2 and the bottom of layer 3, and values greater than 0.5 are considered reliable.
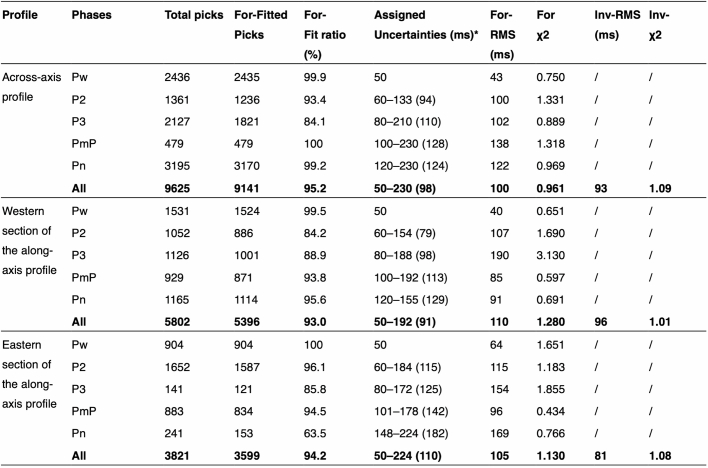
Extended Data Table 1.
Statistics of P-wave travel-time analysis for the forward and inversion models of the JASMInE profiles
*The values in the parentheses denote the average uncertainties of each phase.
Seismic velocity structure modelling
The velocity model was first obtained using the 2D forward ray-tracing software RAYINVR52 and then refined by the joint inversion code Tomo2D53 using both the refraction and reflection travel-time information.
During forward modelling, the initial model comprised three crustal layers, representing sediments, oceanic crust layer 2 and layer 3. The thickness and velocity models for the three layers were based on the typical oceanic crustal structure at the slow-spreading MAR54, with 1D linear velocity gradients within these layers. The initial model of sediment-layer thickness was constrained by the sonobuoy data with velocities of 1.8 km s−1 at its top and 3.4 km s−1 at its bottom. The initial model of oceanic layer 2 had a thickness of 2 km with velocities of 3.4 km s−1 at its top and 6.4 km s−1 at its bottom. The initial model of oceanic layer 3 had a thickness of 4 km with velocities of 6.4 km s−1 at its top and 7.0 km s−1 at its base. The initial model of the upper mantle had a velocity of 8.0 km s−1 beneath the Moho. Horizontal node spacing within oceanic layers 2 and 3 was 5 km and 10 km, respectively. The node spacing was 20 km in the upper mantle. The velocities and boundaries were adjusted manually by trial and error52.
The results of forward modelling (Extended Data Fig. 2) were used as the initial models of the inversion. The velocity model was parameterized as a sheared mesh hanging beneath the seafloor; it was then interpolated to form a continuous velocity field. The sheared mesh allowed accurate travel-time calculation by ray-bending and graph methods, whereas the velocity field was estimated on the basis of the travel-time residuals53. For the across-axis profile, the horizontal correlation length increased from 1 km at the top to 4 km at the bottom, whereas the vertical correlation length increased from 1 km at the top to 6 km at the bottom. For along-axis sections, the horizontal correlation length increased from 1 km at the top to 3 km at the bottom, whereas the vertical correlation length increased from 1 km at the top to 5 km at the bottom. The correlation length of the Moho reflector was set to 2 km and 3 km for across-axis and along-axis profiles, respectively. After two iterations, the optimal P-wave models were obtained (Fig. 1c,e).
Error and uncertainty of seismic model
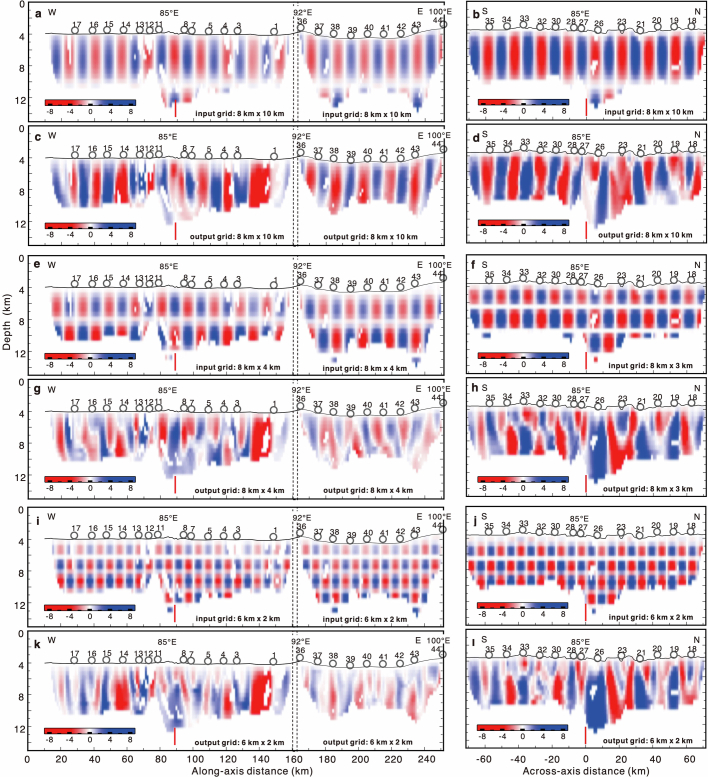
The root mean square misfits of the Tomo2D models along the across-axis profile and the western and eastern sections of the along-axis profile were 93, 96 and 81 ms, with corresponding χ2 values of 1.09, 1.01 and 1.08, respectively (Extended Data Table 1). We conducted checkerboard tests to assess the resolution of the tomographic velocity models. In this study, the final velocity models were perturbed by velocity variations of ±8% in cells with varying sizes. For the across-axis model, the considered dimensions are 8 km × 10 km, 8 km × 3 km and 6 km × 2 km. Along-axis models considered dimensions of 8 km × 10 km, 8 km × 4 km and 6 km × 2 km. On the basis of these perturbed models, synthetic travel times were calculated using the same source–receiver geometry. After adding a random noise of 100 ms, the synthetic travel times were inverted for the output models, using the same starting models that we used in the inversion procedure (Extended Data Fig. 4). Checkerboard recovery is best in the sediments and upper crust; at greater depths, the resolution is better in the vertical direction than in the horizontal direction. Resolution is poor at edges of models, at which the ray coverage is limited. The models have relatively good recoveries for the 8 km × 4 km anomaly and 8 km × 3 km anomaly along-axis and across-axis profiles, respectively. We also computed the derivative weight sum, which was the column-sum vector of the Fréchet velocity kernel and served as a measure of the linear sensitivity of the inversion. The derivative weight sum shows better coverage in the upper crust than in the lower crust (Extended Data Fig. 3a,b).
Extended Data Fig. 4. Checkerboard resolution tests of the inversion models.
The distance and depth grid spacing of the along-axis input model in panels a, e and i are 8 km × 10 km, 8 km × 4 km and 6 km × 2 km, respectively. For the across-axis profile, the distance and depth grid spacing in panels b, f and j are 8 km × 10 km, 8 km × 3 km and 6 km × 2 km, respectively. Panels c, d, g, h, k and l show output models.
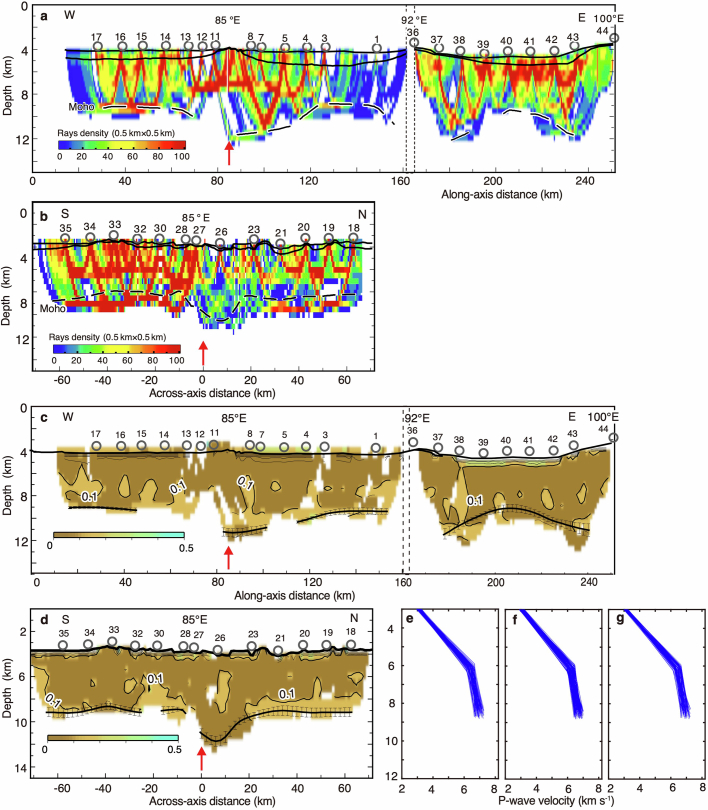
Extended Data Fig. 3. Derivative weight sum results and uncertainties test of tomographic inversion models.
a,b, The derivative weight sum results with horizontal and vertical grid spacings of 0.5 km. c,d, Standard deviation for velocity derived from ten Monte Carlo ensembles of the along-axis and across-axis crustal velocity models. The contour interval of the mean standard deviation is 0.1 km s−1. The thick contour marks the 0.1 km s−1 standard deviation velocity. The thick line with error bars marks the average Moho boundaries. e–g, The 100 1D randomly perturbed initial models for the western (e) and eastern (f) sections of the along-axis profile and the across-axis profile (g).
To assess the uncertainties and robustness of the final velocity models, we used a Monte Carlo method53. We generated 100 1D initial velocity models with randomly perturbed velocities for each profile. The velocity perturbations for all of the layers in the starting models ranged from −5% to 5%. Furthermore, we perturbed the Moho depth in along-axis sections within the range 9–12 km and in the across-axis profile within the range 8–11 km. Using the corresponding 100 reference models for both along-axis and across-axis profiles, we estimated inversion uncertainties based on the standard deviation of all solutions (Extended Data Fig. 3c–g), which is less than 0.1 km s−1 in the upper crust across all three models. Meanwhile, the standard deviations of velocities in the lower crust ranged from 0.1 to 0.2 km s−1 for both along-axis and across-axis profiles. The Moho depth uncertainties are within the range ±0.1 km to ±0.5 km.
Sonobuoy data analysis
The disposable sonobuoys were equipped with a 5–2,400 Hz hydrophone, which radioed the signals back at a water depth of 60 m. In this study, we use 65 sonobuoys with relatively high data quality. Most of them have offsets ranging from 6 km to 10 km, with a maximum range of approximately 20 km.
Profiles of sonobuoy data were generated using a process similar to that of single-channel seismic surveys. For each shot, we calculated the midpoint position between the source and receiver based on their GPS coordinates. Next, we extracted the depth of this midpoint from the multibeam bathymetry data. A time shift was then applied to the data of each shot according to the travel time of seafloor reflection and midpoint depth, assuming a seawater velocity of 1,500 m s−1. To enhance the data quality, we used a processing sequence that included low-cut filtering (2–3 Hz), high-energy noise suppression (remove three times the average amplitude) and single-trace predictive deconvolution (a filter length of 160 ms and a prediction distance of 64 ms). Finally, two-way travel time was converted to depth using regional sedimentary velocities from ref. 55. The depth of the basement was identified as a transition from high-amplitude reflections to semitransparent with low or few indistinct reflections (Supplementary Fig. 7).
Gravity data analysis
For the JASMInE zone, we calculated mantle Bouguer anomalies (MBA) by subtracting the gravity effects of a water layer (determined by bathymetry data), a sediment layer (constrained by sonobuoy data) and a constant crustal thickness of 5 km from the shipborne free-air gravity anomalies56,57. The calculation was conducted using the ‘gravfft’ model of the Generic Mapping Tools software58. The densities of the water, sediment, crust and mantle layers were assumed to be 1.03, 2.0, 2.7 and 3.3 g cm−3, respectively. For the Gakkel Ridge between 6° W and 105° E, the same approach was applied to obtain the MBA. Satellite altimetric gravity data (DTU21)59 and IBCAO 4.0 (ref. 60) were used in the calculation. Residual MBA (RMBA; Extended Data Fig. 1c) was calculated by removing the gravity effect of lithosphere thermal cooling related to seafloor age56. The mantle thermal structure of the Gakkel Ridge was calculated using the method in ref. 61 based on a state-of-the-art global model of seafloor age62. This thermal structure was then converted into density variations. The gravity effects of mantle thermal variations, which are consistent with predictions from the numerical geodynamic model used in this study (Supplementary Fig. 3), were removed from the MBA data to obtain the RMBA data.
The best-fitting density model was achieved with Geosoft Oasis montaj v9.7. In the areas covered by seismic rays, the density is converted from the P-wave velocity model using velocity contours and matching velocity–density relationships for the oceanic crust63 and serpentinized mantle64 (Extended Data Fig. 5). In the areas without seismic rays, the density refers to the densities of neighbouring areas and areas with similar topography. In the areas with seismic rays, we use the Moho from the tomographic model, whereas in the areas without seismic rays, we adjust the level of Moho to achieve a good fit to the observation.
Rock samples analysis
Fresh quenched glass chips and some plagioclase-olivine-phyric basalts were carefully selected from six TV-grab stations at 85° E and 100° E volcanic centres. Sr–Nd isotopes of 14 basaltic rock powers and glass chips were measured at Nanjing FocuMS Technology Co. Ltd. using a Nu Plasma II multi-collector inductively coupled plasma mass spectrometer. The detailed digestion and Sr–Nd purification follow the procedures described in ref. 65 Raw data of isotopic ratios were internally corrected for mass fractionation by normalizing to 86Sr/88Sr = 0.1194 for Sr and 146Nd/144Nd = 0.7219 for Nd. International isotopic standards (NIST SRM 987 for Sr and JNdi-1 for Nd) were periodically analysed to correct instrumental drift. The analytical data are given in Supplementary Table 1. USGS reference materials of BCR-2, BHVO-2 and AVG-2 were run together with our samples and their results agreed with previous publications within analytical uncertainty66.
Major elements and H2O contents on 43 glasses were determined at the Key Laboratory of Submarine Geosciences, Second Institute of Oceanography, Ministry of Natural Resources. The major-element compositions were identified on a JEOL JXA-8100 electron microprobe using an accelerating voltage of 15 kV, a beam current of 20 nA and a spot size of 15 μm. Natural minerals and synthetic oxides were used as standards and a program based on the ZAF procedure was used for data correction. The analytical error for most elements was less than 5%. Compositions were then determined using the average of three analyses per glass (Supplementary Table 2). The H2O contents of the glasses were analysed by Fourier-transform infrared spectroscopy following ref. 67. Analyses are the average of five point determinations (Supplementary Table 2). Replicate analyses of each glass wafer were typically reproducible to ±5%. The H2O was then corrected to calculate the water contents of the mantle source using the method PRIMELT3 MEGA.XLSM68.
Numerical modelling
We used the geodynamic code ASPECT69,70 to perform 2D numerical models to simulate the dynamic processes of the sub-ridge mantle upwelling and melting71. The rectangular model domains extend to a depth of 100 km and have a horizontal width range of 200–800 km, depending on the spreading rates.
The half-spreading rate (U0) is imposed on the top surface. The left boundary, which symbolizes the ridge axis, is designed as a free slip to inhibit lateral mantle flow. The bottom and right boundaries exert no traction, permitting materials to pass through them unimpeded. The top surface is set at 0 °C, whereas the temperature at the bottom boundary is calculated by adding the Tp and an adiabatic temperature gradient of about 0.3 °C km−1. All remaining boundaries are heat insulating. All compositional fields at the inflow bottom boundary are set to zero. The initial temperature is uniformly distributed horizontally, determined arbitrarily by a combination of an adiabat for the given Tp and cooling from the top by an age of 50 Myr. All compositional fields are initially set to zero.
Mantle viscosity depends on temperature and pressure and is also weakened by retained melts, as follows:
in which η0 is the reference mantle viscosity under the pressure at the model bottom and temperature T0, R is the universal gas constant, E is activation energy, V is activation volume, h0 is the height of the model domain (that is, 100 km), T0 is the reference mantle temperature and ϕ is the melt retention. The values of these parameters are listed in Supplementary Table 4. The minimum and maximum cutoff values of 1018 Pa s and 1023 Pa s are applied to limit mantle viscosity for numerical simulations.
In buoyant models, buoyancy arises from lateral variations in mantle temperature, mantle depletion and melt retention. The variation in density is calculated by
in which ρ0 is the reference density of the unmelted mantle at T0 and ρζ and ρϕ are density reductions owing to mantle depletion and melt retention, respectively. In passive models, no buoyancy is considered.
The spreading-rate-dependent crustal production, for both cases of passive and buoyant upwelling, is tested by performing numerical models with varying half spreading rates (U0 = 5–70 mm year−1) for a given Tp of 1,320 °C. To focus on the crustal production at the Gakkel Ridge (U0 = 5 mm year−1), we also perform models with varying potential mantle temperature and reference mantle viscosity. The reference mantle viscosity (η0 = 5 × 10¹⁸–1020 Pa s) is from ref. 41 and is strongly dependent on mantle temperature, pressure and mantle water content. To justify the uniform 6.0 km crust at fast spreading rates, we assume that 85% of the generated melts within a particular pooling width (W0), such as 80 km, are instantly extracted to form oceanic crust. The steady-state crustal thickness is calculated following ref. 72.
Online content
Any methods, additional references, Nature Portfolio reporting summaries, source data, extended data, supplementary information, acknowledgements, peer review information; details of author contributions and competing interests; and statements of data and code availability are available at 10.1038/s41586-024-07831-0.
Supplementary information
This file contains Supplementary Figs. 1–7 and Supplementary Tables 1–4.
Source data
Acknowledgements
We are very grateful to the captain and crew of the icebreaker ‘Xuelong 2’ for a successful cruise and to Y. J. Chen, Q. Sun, Z. Shen, Z. Yu, J. Zhang and M. Cannat for helpful conversations. We thank the National Arctic and Antarctic Data Center of China. Funding was generously provided by the National Natural Science Foundation of China (42330308, 42176086), the Chinese Arctic and Antarctic Administration (CHINARE N12), Donghai Laboratory (DH-2022ZY0007) and Zhejiang Provincial Natural Science Foundation of China (LDQ23D060001).
Extended data figures and tables
Author contributions
Conceptualization T.Z., J.Li. Methodology: T.Z., X.N., C.Z., J.C., X.W., J.Lu. Fieldwork: T.Z., J.Li, X.N., W.D., Y.F., Y.W., P.T., F.K. Seismic modelling: X.N., X.W. Visualization: T.Z., J.Li, X.N., C.Z., J.C., X.W. Funding acquisition: J.Li. Supervision: J.Li, W.D., J.Lin. Writing (original draft): T.Z., J.Li. Writing (review and editing): all authors contributed to the review and editing.
Peer review
Peer review information
Nature thanks Tim Minshull and the other, anonymous, reviewer(s) for their contribution to the peer review of this work.
Data availability
All geophysical data, including bathymetry data, seismic data and picks of phases and gravity data, that support the findings of this study are available at Figshare (10.6084/m9.figshare.25557210; ref. 73). All geochemistry data are available at Figshare (10.6084/m9.figshare.26123878; ref. 74). Source data are provided with this paper.
Code availability
Seismic data processing and analysis were performed using the Seismic Unix software v41 on operating system openSUSE 11.2. Travel-time picking and modelling were performed using the RAYINVR software52. The inversion models were performed using the Tomo2D software53. The mantle Bouguer anomaly was calculated with Generic Mapping Tools software v6.4. The best-fitting density model was achieved with Geosoft Oasis montaj v9.7. Numerical simulations were performed using the open-source geodynamic code ASPECT v2.0.1 (refs. 69,70). The numerical codes and results are available for download at Figshare (10.6084/m9.figshare.25557210; ref. 73).
Competing interests
The authors declare no competing interests.
Footnotes
Publisher’s note Springer Nature remains neutral with regard to jurisdictional claims in published maps and institutional affiliations.
Extended data
is available for this paper at 10.1038/s41586-024-07831-0.
Supplementary information
The online version contains supplementary material available at 10.1038/s41586-024-07831-0.
References
- 1.Reid, I. & Jackson, H. R. Oceanic spreading rate and crustal thickness. Mar. Geophys. Res.5, 165–172 (1981). 10.1007/BF00163477 [DOI] [Google Scholar]
- 2.Bown, J. W. & White, R. S. Variation with spreading rate of oceanic crustal thickness and geochemistry. Earth Planet. Sci. Lett.121, 435–449 (1994). 10.1016/0012-821X(94)90082-5 [DOI] [Google Scholar]
- 3.Shen, Y. & Forsyth, D. W. Geochemical constraints on initial and final depths of melting beneath mid‐ocean ridges. J. Geophys. Res. Solid Earth100, 2211–2237 (1995). 10.1029/94JB02768 [DOI] [Google Scholar]
- 4.Dick, H. J. B., Lin, J. & Schouten, H. An ultraslow-spreading class of ocean ridge. Nature426, 405–412 (2003). 10.1038/nature02128 [DOI] [PubMed] [Google Scholar]
- 5.Cannat, M. How thick is the magmatic crust at slow spreading oceanic ridges? J. Geophys. Res. Solid Earth101, 2847–2857 (1996). 10.1029/95JB03116 [DOI] [Google Scholar]
- 6.Conley, M. M. & Dunn, R. A. Seismic shear wave structure of the uppermost mantle beneath the Mohns Ridge. Geochem. Geophys. Geosyst.12, Q0AK01 (2011). 10.1029/2011GC003792 [DOI] [Google Scholar]
- 7.Corbalán, A. et al. Seismic velocity structure along and across the ultraslow-spreading Southwest Indian Ridge at 64°30′E showcases flipping detachment faults. J. Geophys. Res. Solid Earth126, e2021JB022177 (2021). 10.1029/2021JB022177 [DOI] [Google Scholar]
- 8.Grevemeyer, I. et al. Episodic magmatism and serpentinized mantle exhumation at an ultraslow-spreading centre. Nat. Geosci.11, 444–448 (2018). 10.1038/s41561-018-0124-6 [DOI] [Google Scholar]
- 9.Momoh, E., Cannat, M., Watremez, L., Leroy, S. & Singh, S. C. Quasi‐3‐D seismic reflection imaging and wide‐angle velocity structure of nearly amagmatic oceanic lithosphere at the ultraslow‐spreading Southwest Indian Ridge. J. Geophys. Res. Solid Earth122, 9511–9533 (2017). 10.1002/2017JB014754 [DOI] [Google Scholar]
- 10.Li, J. et al. Seismic observation of an extremely magmatic accretion at the ultraslow spreading Southwest Indian Ridge. Geophys. Res. Lett.42, 2656–2663 (2015). 10.1002/2014GL062521 [DOI] [Google Scholar]
- 11.Niu, X. et al. Along‐axis variation in crustal thickness at the ultraslow spreading Southwest Indian Ridge (50°E) from a wide‐angle seismic experiment. Geochem. Geophys. Geosyst.16, 468–485 (2015). 10.1002/2014GC005645 [DOI] [Google Scholar]
- 12.Minshull, T. A., Muller, M. R. & White, R. S. Crustal structure of the Southwest Indian Ridge at 66°E: seismic constraints. Geophys. J. Int.166, 135–147 (2006). 10.1111/j.1365-246X.2006.03001.x [DOI] [Google Scholar]
- 13.Liu, J. et al. Water enrichment in the mid-ocean ridge by recycling of mantle wedge residue. Earth Planet. Sci. Lett.584, 117455 (2022). 10.1016/j.epsl.2022.117455 [DOI] [Google Scholar]
- 14.Yu, X. & Dick, H. J. B. Plate-driven micro-hotspots and the evolution of the Dragon Flag melting anomaly, Southwest Indian Ridge. Earth Planet. Sci. Lett.531, 116002 (2020). 10.1016/j.epsl.2019.116002 [DOI] [Google Scholar]
- 15.Michael, P. J. et al. Magmatic and amagmatic seafloor generation at the ultraslow-spreading Gakkel ridge, Arctic Ocean. Nature423, 956–961 (2003). 10.1038/nature01704 [DOI] [PubMed] [Google Scholar]
- 16.Jokat, W. et al. Geophysical evidence for reduced melt production on the Arctic ultraslow Gakkel mid-ocean ridge. Nature423, 962–965 (2003). 10.1038/nature01706 [DOI] [PubMed] [Google Scholar]
- 17.Minshull, T. A. et al. Crustal structure at the Blake Spur fracture zone from expanding spread profiles. J. Geophys. Res. Solid Earth96, 9955–9984 (1991). 10.1029/91JB00431 [DOI] [Google Scholar]
- 18.Canales, J. P., Detrick, R. S., Lin, J., Collins, J. A. & Toomey, D. R. Crustal and upper mantle seismic structure beneath the rift mountains and across a nontransform offset at the Mid‐Atlantic Ridge (35°N). J. Geophys. Res. Solid Earth105, 2699–2719 (2000). 10.1029/1999JB900379 [DOI] [Google Scholar]
- 19.Dunn, R. A. in Treatise on Geophysics (Second Edition) (ed. Schubert, G.) 419–451 (Elsevier, 2015).
- 20.Chen, Y. J. Oceanic crustal thickness versus spreading rate. Geophys. Res. Lett.19, 753–756 (1992). 10.1029/92GL00161 [DOI] [Google Scholar]
- 21.Christeson, G. L., Goff, J. A. & Reece, R. S. Synthesis of oceanic crustal structure from two‐dimensional seismic profiles. Rev. Geophys.57, 504–529 (2019). 10.1029/2019RG000641 [DOI] [Google Scholar]
- 22.Dunn, R. A., Lekić, V., Detric, R. S. & Toomey, D. R. Three‐dimensional seismic structure of the Mid‐Atlantic Ridge (35°N): evidence for focused melt supply and lower crustal dike injection. J. Geophys. Res. Solid Earth110, B09101 (2005). 10.1029/2004JB003473 [DOI] [Google Scholar]
- 23.Hooft, E. E. E., Detrick, R. S., Toomey, D. R., Collins, J. A. & Lin, J. Crustal thickness and structure along three contrasting spreading segments of the Mid‐Atlantic Ridge, 33.5°–35°N. J. Geophys. Res. Solid Earth105, 8205–8226 (2000). 10.1029/1999JB900442 [DOI] [Google Scholar]
- 24.Jian, H., Singh, S. C., Chen, Y. J. & Li, J. Evidence of an axial magma chamber beneath the ultraslow-spreading Southwest Indian Ridge. Geology45, 143–146 (2017). 10.1130/G38356.1 [DOI] [Google Scholar]
- 25.Seher, T. et al. Crustal velocity structure of the Lucky Strike segment of the Mid‐Atlantic Ridge at 37°N from seismic refraction measurements. J. Geophys. Res. Solid Earth115, B03103 (2010). [Google Scholar]
- 26.Gale, A., Dalton, C. A., Langmuir, C. H., Su, Y. & Schilling, J. The mean composition of ocean ridge basalts. Geochem. Geophys. Geosyst.14, 489–518 (2013). 10.1029/2012GC004334 [DOI] [Google Scholar]
- 27.Yang, A. Y. et al. A subduction influence on ocean ridge basalts outside the Pacific subduction shield. Nat. Commun.12, 4757 (2021). 10.1038/s41467-021-25027-2 [DOI] [PMC free article] [PubMed] [Google Scholar]
- 28.Danyushevsky, L. V., Eggins, S. M., Falloon, T. J. & Christie, D. M. H2O abundance in depleted to moderately enriched mid-ocean ridge magmas; part I: incompatible behaviour, implications for mantle storage, and origin of regional variations. J. Petrol.41, 1329–1364 (2000). 10.1093/petrology/41.8.1329 [DOI] [Google Scholar]
- 29.Krein, S. B., Molitor, Z. J. & Grove, T. L. ReversePetrogen: a multiphase dry reverse fractional crystallization-mantle melting thermobarometer applied to 13,589 mid-ocean ridge basalt glasses. J. Geophys. Res. Solid Earth126, e2020JB021292 (2021). 10.1029/2020JB021292 [DOI] [Google Scholar]
- 30.Hebert, L. B. & Montési, L. G. J. Generation of permeability barriers during melt extraction at mid‐ocean ridges. Geochem. Geophys. Geosyst.11, Q12008 (2010). 10.1029/2010GC003270 [DOI] [Google Scholar]
- 31.Schlindwein, V. & Schmid, F. Mid-ocean-ridge seismicity reveals extreme types of ocean lithosphere. Nature535, 276–279 (2016). 10.1038/nature18277 [DOI] [PubMed] [Google Scholar]
- 32.Magde, L. S. & Sparks, D. W. Three‐dimensional mantle upwelling, melt generation, and melt migration beneath segment slow spreading ridges. J. Geophys. Res. Solid Earth102, 20571–20583 (1997). 10.1029/97JB01278 [DOI] [Google Scholar]
- 33.Wanless, V. D., Behn, M. D., Shaw, A. M. & Plank, T. Variations in melting dynamics and mantle compositions along the Eastern Volcanic Zone of the Gakkel Ridge: insights from olivine-hosted melt inclusions. Contrib. Mineral. Petrol.167, 1005 (2014). 10.1007/s00410-014-1005-7 [DOI] [Google Scholar]
- 34.Jokat, W., Kollofrath, J., Geissler, W. H. & Jensen, L. Crustal thickness and earthquake distribution south of the Logachev Seamount, Knipovich Ridge. Geophys. Res. Lett.39, L08302 (2012). 10.1029/2012GL051199 [DOI] [Google Scholar]
- 35.Fialko, Y. A. & Rubin, A. M. Thermodynamics of lateral dike propagation: implications for crustal accretion at slow spreading mid‐ocean ridges. J. Geophys. Res. Solid Earth.103, 2501–2514 (1998). 10.1029/97JB03105 [DOI] [Google Scholar]
- 36.Robinson, C. J., Bickle, M. J., Minshull, T. A., White, R. S. & Nichols, A. R. L. Low degree melting under the Southwest Indian Ridge: the roles of mantle temperature, conductive cooling and wet melting. Earth Planet. Sci. Lett.188, 383–398 (2001). 10.1016/S0012-821X(01)00329-6 [DOI] [Google Scholar]
- 37.Cannat, M., Rommevaux‐Jestin, C. & Fujimoto, H. Melt supply variations to a magma‐poor ultra‐slow spreading ridge (Southwest Indian Ridge 61° to 69°E). Geochem. Geophys. Geosyst.4, 9104 (2003). 10.1029/2002GC000480 [DOI] [Google Scholar]
- 38.Zhou, F. & Dyment, J. Temporal and spatial variation of seafloor spreading at ultraslow spreading ridges: contribution of marine magnetics. Earth Planet. Sci. Lett.602, 117957 (2023). 10.1016/j.epsl.2022.117957 [DOI] [Google Scholar]
- 39.Parmentier, E. M. & Morgan, J. P. Spreading rate dependence of three-dimensional structure in oceanic spreading centres. Nature348, 325–328 (1990). 10.1038/348325a0 [DOI] [Google Scholar]
- 40.Sparks, D. W. & Parmentier, E. M. The structure of three‐dimensional convection beneath oceanic spreading centres. Geophys. J. Int.112, 81–91 (1993). 10.1111/j.1365-246X.1993.tb01438.x [DOI] [Google Scholar]
- 41.Hirth, G. & Kohlstedt, D. Rheology of the upper mantle and the mantle wedge: a view from the experimentalists. Geophys. Monogr.138, 83–106 (2003). [Google Scholar]
- 42.Liu, C.-Z. et al. Archean cratonic mantle recycled at a mid-ocean ridge. Sci. Adv.8, eabn6749 (2022). 10.1126/sciadv.abn6749 [DOI] [PMC free article] [PubMed] [Google Scholar]
- 43.Meyzen, C. M., Toplis, M. J., Humler, E., Ludden, J. N. & Mével, C. A discontinuity in mantle composition beneath the southwest Indian ridge. Nature421, 731–733 (2003). 10.1038/nature01424 [DOI] [PubMed] [Google Scholar]
- 44.Liu, C.-Z. et al. Ancient, highly heterogeneous mantle beneath Gakkel ridge, Arctic Ocean. Nature452, 311–316 (2008). 10.1038/nature06688 [DOI] [PubMed] [Google Scholar]
- 45.Kristoffersen, Y., Husebye, E. S., Bungum, H. & Gregersen, S. Seismic investigations of the Nansen Ridge during the FRAM I experiment. Tectonophysics82, 57–68 (1982). 10.1016/0040-1951(82)90088-9 [DOI] [Google Scholar]
- 46.White, R. S., Minshull, T. A., Bickle, M. J. & Robinson, C. J. Melt generation at very slow-spreading oceanic ridges: constraints from geochemical and geophysical data. J. Petrol.42, 1171–1196 (2001). 10.1093/petrology/42.6.1171 [DOI] [Google Scholar]
- 47.Harding, J. L. et al. Magmatic-tectonic conditions for hydrothermal venting on an ultraslow-spread oceanic core complex. Geology45, 839–842 (2017). 10.1130/G39045.1 [DOI] [Google Scholar]
- 48.Dannowski, A. et al. Seismic structure of an oceanic core complex at the Mid‐Atlantic Ridge, 22°19′N. J. Geophys. Res. Solid Earth115, B07106 (2010). 10.1029/2009JB006943 [DOI] [Google Scholar]
- 49.Vaddineni, V. A., Singh, S. C., Grevemeyer, I., Audhkhasi, P. & Papenberg, C. Evolution of the crustal and upper mantle seismic structure from 0–27 Ma in the equatorial Atlantic Ocean at 2° 43′S. J. Geophys. Res. Solid Earth126, e2020JB021390 (2021). 10.1029/2020JB021390 [DOI] [PMC free article] [PubMed] [Google Scholar]
- 50.Wang, T., Tucholke, B. E. & Lin, J. Spatial and temporal variations in crustal production at the Mid‐Atlantic Ridge, 25°N–27°30′N and 0–27 Ma. J. Geophys. Res. Solid Earth120, 2119–2142 (2015). 10.1002/2014JB011501 [DOI] [Google Scholar]
- 51.Ding, W. et al. Submarine wide-angle seismic experiments in the High Arctic: the JASMInE Expedition in the slowest spreading Gakkel Ridge. Geosyst. Geoenviron.1, 100076 (2022). 10.1016/j.geogeo.2022.100076 [DOI] [Google Scholar]
- 52.Zelt, C. A. & Smith, R. B. Seismic traveltime inversion for 2-D crustal velocity structure. Geophys. J. Int.108, 16–34 (1992). 10.1111/j.1365-246X.1992.tb00836.x [DOI] [Google Scholar]
- 53.Korenaga, J. et al. Crustal structure of the southeast Greenland margin from joint refraction and reflection seismic tomography. J. Geophys. Res. Solid Earth105, 21591–21614 (2000). 10.1029/2000JB900188 [DOI] [Google Scholar]
- 54.White, R. S., McKenzie, D. & O’Nions, R. K. Oceanic crustal thickness from seismic measurements and rare earth element inversions. J. Geophys. Res. Solid Earth97, 19683–19715 (1992). 10.1029/92JB01749 [DOI] [Google Scholar]
- 55.Nikishin, A. M., Gaina, C., Petrov, E. I., Malyshev, N. A. & Freiman, S. I. Eurasia Basin and Gakkel Ridge, Arctic Ocean: crustal asymmetry, ultra-slow spreading and continental rifting revealed by new seismic data. Tectonophysics746, 64–82 (2018). 10.1016/j.tecto.2017.09.006 [DOI] [Google Scholar]
- 56.Kuo, B.-Y. & Forsyth, D. W. Gravity anomalies of the ridge-transform system in the South Atlantic between 31 and 34.5° S: upwelling centers and variations in crustal thickness. Mar. Geophys. Res.10, 205–232 (1988). 10.1007/BF00310065 [DOI] [Google Scholar]
- 57.Lin, J., Purdy, G. M., Schouten, H., Sempere, J.-C. & Zervas, C. Evidence from gravity data for focused magmatic accretion along the Mid-Atlantic Ridge. Nature344, 627–632 (1990). 10.1038/344627a0 [DOI] [Google Scholar]
- 58.Wessel, P. et al. The generic mapping tools version 6. Geochem. Geophys. Geosyst.20, 5556–5564 (2019). 10.1029/2019GC008515 [DOI] [Google Scholar]
- 59.Andersen, O. B., Knudsen, P., Kenyon, S., Holmes, S. & Factor, J. K. in International Association of Geodesy Symposia Vol. 149 (eds Freymueller, J. T. & Sánchez, L.) 77–81 (Springer, 2019).
- 60.Jakobsson, M. et al. The international bathymetric chart of the Arctic Ocean version 4.0. Sci. Data7, 176 (2020). 10.1038/s41597-020-0520-9 [DOI] [PMC free article] [PubMed] [Google Scholar]
- 61.Behn, M. D., Boettcher, M. S. & Hirth, G. Thermal structure of oceanic transform faults. Geology35, 307–310 (2007). 10.1130/G23112A.1 [DOI] [Google Scholar]
- 62.Seton, M. et al. A global data set of present-day oceanic crustal age and seafloor spreading parameters. Geochem. Geophys. Geosyst.21, e2020GC009214 (2020). 10.1029/2020GC009214 [DOI] [Google Scholar]
- 63.Carlson, R. L. & Herrick, C. N. Densities and porosities in the oceanic crust and their variations with depth and age. J. Geophys. Res. Solid Earth95, 9153–9170 (1990). 10.1029/JB095iB06p09153 [DOI] [Google Scholar]
- 64.Christensen, N. I. Serpentinites, peridotites, and seismology. Int. Geol. Rev.46, 795–816 (2004). 10.2747/0020-6814.46.9.795 [DOI] [Google Scholar]
- 65.Ma, X., Meert, J. G., Xu, Z. & Yi, Z. Late Triassic intra-oceanic arc system within Neotethys: evidence from cumulate appinite in the Gangdese belt, southern Tibet. Lithosphere10, 545–565 (2018). 10.1130/L682.1 [DOI] [Google Scholar]
- 66.Weis, D. et al. High-precision isotopic characterization of USGS reference materials by TIMS and MC-ICP-MS. Geochem. Geophys. Geosyst.7, Q08006 (2006). 10.1029/2006GC001283 [DOI] [Google Scholar]
- 67.Zong, T. et al. H2O in basaltic glasses from the slow-spreading Carlsberg Ridge: implications for mantle source and magmatic processes. Lithos332–333, 274–286 (2019). 10.1016/j.lithos.2019.01.022 [DOI] [Google Scholar]
- 68.Herzberg, C. & Asimow, P. D. PRIMELT3 MEGA.XLSM software for primary magma calculation: peridotite primary magma MgO contents from the liquidus to the solidus. Geochem. Geophys. Geosyst.16, 563–578 (2015). 10.1002/2014GC005631 [DOI] [Google Scholar]
- 69.Heister, T., Dannberg, J., Gassmöller, R. & Bangerth, W. High accuracy mantle convection simulation through modern numerical methods – II: realistic models and problems. Geophys. J. Int.210, 833–851 (2017). 10.1093/gji/ggx195 [DOI] [Google Scholar]
- 70.Kronbichler, M., Heister, T. & Bangerth, W. High accuracy mantle convection simulation through modern numerical methods. Geophys. J. Int.191, 12–29 (2012). 10.1111/j.1365-246X.2012.05609.x [DOI] [Google Scholar]
- 71.Zha, C., Zhang, F., Lin, J., Zhang, T. & Tian, J. On the relative importance of buoyancy and thickening of aging lithosphere in mantle upwelling and crustal production beneath global mid-ocean ridge system. J. Geophys. Res. Solid Earth129, e2023JB028432 (2024). 10.1029/2023JB028432 [DOI] [Google Scholar]
- 72.Forsyth, D. W. Crustal thickness and the average depth and degree of melting in fractional melting models of passive flow beneath mid‐ocean ridges. J. Geophys. Res. Solid Earth98, 16073–16079 (1993). 10.1029/93JB01722 [DOI] [Google Scholar]
- 73.Zhang, T. Data and Codes of JASMInE_2021. Figshare 10.6084/m9.figshare.2555721 (2024).
- 74.Zhang, T. JASMINE2021_GeochemistryData. Figshare 10.6084/m9.figshare.26123878 (2024).
Associated Data
This section collects any data citations, data availability statements, or supplementary materials included in this article.
Supplementary Materials
This file contains Supplementary Figs. 1–7 and Supplementary Tables 1–4.
Data Availability Statement
All geophysical data, including bathymetry data, seismic data and picks of phases and gravity data, that support the findings of this study are available at Figshare (10.6084/m9.figshare.25557210; ref. 73). All geochemistry data are available at Figshare (10.6084/m9.figshare.26123878; ref. 74). Source data are provided with this paper.
Seismic data processing and analysis were performed using the Seismic Unix software v41 on operating system openSUSE 11.2. Travel-time picking and modelling were performed using the RAYINVR software52. The inversion models were performed using the Tomo2D software53. The mantle Bouguer anomaly was calculated with Generic Mapping Tools software v6.4. The best-fitting density model was achieved with Geosoft Oasis montaj v9.7. Numerical simulations were performed using the open-source geodynamic code ASPECT v2.0.1 (refs. 69,70). The numerical codes and results are available for download at Figshare (10.6084/m9.figshare.25557210; ref. 73).


