

Keywords: chorionic somatomammotropin, fetal growth restriction, glucose transfer, placenta, RNA interference
Abstract
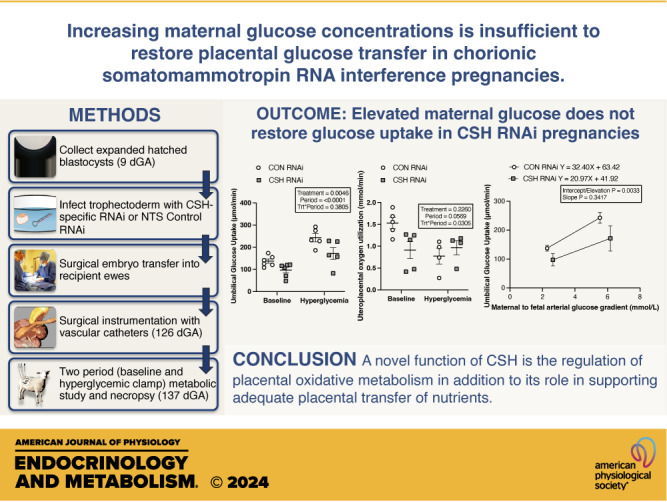
We previously demonstrated impaired placental nutrient transfer in chorionic somatomammotropin (CSH) RNA interference (RNAi) pregnancies, with glucose transfer being the most impacted. Thus, we hypothesized that despite experimentally elevating maternal glucose, diminished umbilical glucose uptake would persist in CSH RNAi pregnancies, demonstrating the necessity of CSH for adequate placental glucose transfer. Trophectoderm of sheep blastocysts (9 days of gestational age; dGA) were infected with a lentivirus expressing either nontargeting control (CON RNAi; n = 5) or CSH-specific shRNA (CSH RNAi; n = 7) before transfer into recipient sheep. At 126 dGA, pregnancies were fitted with vascular catheters and underwent steady-state metabolic studies (3H2O transplacental diffusion) at 137 ± 0 dGA, before and during a maternal hyperglycemic clamp. Umbilical glucose and oxygen uptakes, as well as insulin and IGF1 concentrations, were impaired (P ≤ 0.01) in CSH RNAi fetuses and were not rescued by elevated maternal glucose. This is partially due to impaired uterine and umbilical blood flow (P ≤ 0.01). However, uteroplacental oxygen utilization was greater (P ≤ 0.05) during the maternal hyperglycemic clamp, consistent with greater placental oxidation of substrates. The relationship between umbilical glucose uptake and the maternal-fetal glucose gradient was analyzed, and while the slope (CON RNAi, Y = 29.54X +74.15; CSH RNAi, Y = 19.05X + 52.40) was not different, the y-intercepts and elevation were (P = 0.003), indicating reduced maximal glucose transport during maternal hyperglycemia. Together, these data suggested that CSH plays a key role in modulating placental metabolism that ultimately promotes maximal placental glucose transfer.
NEW & NOTEWORTHY The current study demonstrated a novel, critical autocrine role for chorionic somatomammotropin in augmenting placental glucose transfer and maintaining placental oxidative metabolism. In pregnancies with CSH deficiency, excess glucose in maternal circulation is insufficient to overcome fetal hypoglycemia due to impaired placental glucose transfer and elevated placental metabolic demands. This suggests that perturbations in glucose transfer in CSH RNAi pregnancies are due to compromised metabolic efficiency along with reduced placental mass.
INTRODUCTION
Fetal growth restriction (FGR) is a significant human health concern, impacting 6–8% of pregnancies worldwide (1, 2). FGR is characterized by an inability of the fetus to reach its growth potential in utero, reducing perinatal survival and increasing the risk of metabolic disease in adulthood (3, 4). Although the etiologies responsible for FGR are numerous, they can broadly be classified as maternal, fetal, or placental in origin. Of these, the most frequent origin is placental, resulting from structural or functional abnormalities (5). More specifically, placental insufficiency is responsible for ∼60% of growth-restricted pregnancies in the absence of fetal malformations (6).
A study by Daikoku et al. (7) found 60% of mothers who gave birth to FGR infants had reduced circulating chorionic somatomammotropin (CSH) from 36 wk to term. In fact, a single low (<4 μg/mL) maternal blood sample during late gestation (35 wk of gestation) was predictive of a 30% increased risk of neonatal hypoxia and fetal distress (8). The causal relationship between CSH gene product deficiency and FGR was demonstrated using lentiviral-mediated RNA interference (RNAi) in sheep (9–11). Despite the demonstrated link between CSH and fetal growth, the exact biological function of CSH remains to be fully determined.
To begin to directly assess the physiological ramifications of CSH gene product deficiency, previous studies (11, 12) combined the use of CSH RNAi in vivo with the transplacental diffusion technique to measure changes to placental blood flow and nutrient transport. Using this approach, the physiological responses of CSH RNAi pregnancies of differing severities including FGR (11, 13) and normal weight pregnancies (12, 13) have been assessed. These divergent phenotypes have also been observed in human pregnancies with either low-maternal CSH (7) or CSH gene loci disruptions (14). Regardless of fetal weight reductions, one of the primary biological impacts of CSH appears to be regulating uteroplacental glucose utilization (11, 12). In CSH RNAi pregnancies characterized by FGR, uteroplacental glucose utilization decreases dramatically (11). However, it appears that in less-severe CSH RNAi phenotypes, a compensatory mechanism responds by increasing uteroplacental glucose utilization and this may be how placental function is rescued in a manner that can still support fetal growth, despite other perturbations (12). Based on this evidence, the objective of the current study was to test how experimentally increasing maternal glucose concentrations will impact placental glucose utilization and transfer in a cohort of CSH RNAi pregnancies. We hypothesized that CSH RNAi pregnancies would have diminished umbilical glucose uptake despite elevated maternal glucose concentrations, demonstrating impaired maximal uteroplacental glucose transfer.
MATERIALS AND METHODS
Ethical Approval
All animal procedures were approved by the Colorado State University Institutional Animal Care and Use Committee (Protocol #6), the Institutional Biosafety Committee (18-029B), and the University of Colorado Anschutz Medical Campus Institutional Animal Care and Use Committee (Protocol #00714). Experimental work was performed and reported according to the Animal Research: Reporting of In Vivo Experiments (ARRIVE) guidelines (15).
Lentiviral Generation
Lentiviral generation of hLL3.7 tg6 (CSH RNAi) and hLL3.7 control/NTS (nontargeting sequence; CON RNAi) are as described previously (9–12). Briefly, both the control/NTS and tg6 sequences (9–12) were cloned into the LL3.7 vector, and all subsequent virus generation and titering were completed in accordance with our previously described procedures (9).
Generation of CSH RNAi Pregnancies
All ewes (Dorper breed composition) were group housed in pens at the Colorado State University Animal Reproduction and Biotechnology Laboratory and provided access to hay, trace minerals, and water to meet or slightly exceed their National Research Council (16) requirements. All animal procedures were as previously extensively described (9–12). In summary, fully expanded and hatched blastocysts were collected by flushing the uteri at 9 days postconception after synchronizing and breeding. Each blastocyst was infected with 100,000 transducing units of either CON RNAi or CSH RNAi and surgically transferred randomly (9–12) into a synchronized recipient ewe. Each recipient ewe was monitored daily for return to standing estrus and confirmed pregnant at 50 days of gestational age (dGA) by ultrasound (ALKOA SSD-500V, Wallingford, CT). Using these methods, a total of 17 pregnancies were generated (n = 8 CON RNAi; n = 9 CSH RNAi).
Surgical Instrumentation of Fetus and Ewe
After 110 days of gestation, pregnant recipient ewes were transported to the University of Colorado Anschutz Medical Campus, Perinatal Research Center (Aurora, CO). Animals had access to ad libitum alfalfa pellets (Standlee Hay, Kimberly, ID) and water. All animals underwent surgical placement of fetal and maternal catheters at 130 ± 0 dGA, to determine blood flow and nutrient flux as previously described (11, 12, 17–21). Briefly, the following catheters were placed: fetal descending aorta (representing umbilical artery blood), fetal femoral vein and umbilical vein, maternal femoral artery (representing uterine artery blood), maternal femoral vein, and uterine vein. Due to one ewe morbidity (CON RNAi), and two fetal demises (1 CON RNAi, 1 CSH RNAi), a total of 14 pregnancies were fully studied (n = 6 CON RNAi; n = 8 CSH RNAi).
Baseline Studies and Blood Flow Calculations
At 137 ± 0 dGA, uterine and umbilical blood flows were determined by the steady-state 3H2O transplacental diffusion technique as summarized previously (12, 22). Briefly, samples were simultaneously collected from maternal femoral artery (A), uterine vein (V), umbilical vein (γ), and fetal descending aorta (α) every 20 min and averaged across four draws for analysis of blood biochemistry, nutrient content, 3H2O, and hormone concentrations (12).
Uterine and umbilical blood flows were calculated by the steady-state diffusion technique described previously (23). Uterine, umbilical, and uteroplacental uptakes of oxygen, glucose, lactate, and amino acids were calculated by the Fick principle and the transplacental diffusion technique (24) and reported as an average of draws one through four. All other calculations were described extensively in Tanner et al. (11, 12).
Hyperglycemic Clamp Study and Tissue Collection
To test the impacts of altering the transplacental glucose gradient on uteroplacental glucose utilization and transfer, ewes were made hyperglycemic by a 3-mL bolus of 70% dextrose (wt:vol in saline) for a bolus rate of 208 mmol/kg, followed by a constant infusion of 70% dextrose at a rate of 16 mL/h for 170 min. This procedure was titrated to keep the plasma glucose concentration over 7.0 mmol·L−1 [average euglycemia concentrations ∼2.8 mmol·L−1 (25)]. After 90 min of dextrose infusions, blood samples were simultaneously drawn from all four vessels every 20 min for 80 min. One pregnancy in each treatment was excluded from the hyperglycemic clamp analyses for failure to reach hyperglycemic glucose concentrations, thus leaving 12 pregnancies to be studied (n = 5 CON RNAi; n = 7 CSH RNA). The two pregnancies that failed to reach hyperglycemic glucose levels were still included in all baseline measurements.
Following the last draw at 170 min after initiation of the infusion, all ewes and fetuses were euthanized (n = 14), and tissues were harvested at 137 ± 0 dGA as previously described by Tanner et al. (12). Briefly, after trimming, placentomes were selected from each placenta and separated into cotyledonary (fetal) and caruncular (maternal) components then snap frozen in liquid nitrogen and stored at −80°C. Fetal length, weight, and dissected organ weights were recorded, and tissues were snap-frozen in liquid nitrogen. Ponderal index and fetal brain:liver weight ratios were calculated as previously described (12).
Biochemical Analysis of Blood Samples
Whole blood O2 content, hemoglobin O2 saturation (SO2), partial pressure of oxygen (Po2), partial pressure of carbon dioxide (Pco2), pH, and hematocrit measurements were analyzed by an ABL 800 Blood Gas analyzer as previously described (11, 12). Plasma glucose and lactate were measured by Yellow Springs Instrument 2900 (YSI Incorporated, Yellow Springs, OH) as described previously (12). Baseline plasma amino acids were measured by HPLC (11, 12). Maternal (uterine) and fetal (umbilical) concentrations of insulin (ALPCO Immunoassays 80-INSOV-E01) and glucagon (ALPCO; 48-GLUHU-E01) were assessed before commencement of the baseline study and during the period of maternal hyperglycemia by enzyme-linked immunosorbent assay as described previously (11, 22, 26, 27). Maternal and fetal concentrations of IGF1 (ALPCO; 22-IGFHU-E01) and cortisol (ALPCO; 11-CORHU-E01-SLV) were also analyzed by enzyme-linked immunosorbent assay but during the baseline period only. Estradiol and CSH were both analyzed by radioimmunoassay as previously described (9, 11).
Statistical Analysis
As previously described, due to one ewe morbidity (CON), a fetal demise in each treatment group, a total of six CON RNAi (3 females, 3 males) and eight CSH RNAi (3 females, 5 males) pregnancies were included in this analysis. Data collected at a single study time point were evaluated for fetal sex interactions by a two-way ANOVA in GraphPad Prism (8.3.1) with the fixed effects of treatment (CON RNAi vs. CSH RNAi) and fetal sex. Due to no significant interactions, sex was not included in the final statistical model, and data from male and female fetuses were combined and analyzed by Student’s t test. All variables assessed across both study periods (baseline vs. maternal hyperglycemic clamp) were analyzed by a two-way ANOVA to examine the interactions between period (baseline vs. hyperglycemic clamp) and treatment. Animals were only included in both period analyses if they achieved maternal hyperglycemia (n = 5 CON RNAi; n = 7 CSH RNAi). The data figures are presented as scatter plots, with the horizontal line representing the mean, and the capped vertical lines representing the standard error of the mean (SE). Data were considered statistically significant if the P ≤ 0.05 and a statistical tendency if P ≥ 0.05 but ≤ 0.10.
RESULTS
Near-Term Fetal and Uteroplacental Measures
No significant interactions between treatment × fetal sex were observed. Fetal mass was reduced (P = 0.0152; Fig. 1) by 21% in CSH RNAi pregnancies. As summarized in Supplemental Table S1, crown-rump length (cm) tended to be reduced (P = 0.0835) in CSH RNAi pregnancies, and the fetal brain:liver weight ratio, an indicator of asymmetric fetal growth was increased (P = 0.0249) by 45%. However, fetal ponderal index and lower leg length did not differ between treatments. Fetal liver weights were reduced (P = 0.0129) by 28% in CSH RNAi pregnancies. Other fetal organs such as the kidneys (P = 0.0058) and hearts (P = 0.0275) were also reduced in CSH RNAi pregnancies, with the spleen also tending (P = 0.0914) to be smaller. The fetal pancreas, lung, adrenal glands, perirenal adipose tissue, and brain weights were not impacted by treatment. On a relative basis, the brain-to-fetal weight ratio (P = 0.0187) was elevated, along with a tendency (P = 0.0687) for the pancreas:fetal weight ratio to be elevated. Placental weight was reduced (P = 0.0033; Fig. 1) by 37% in CSH RNAi pregnancies, along with both uterine (P = 0.0250; Fig. 1) and uteroplacental weight (P = 0.0039). As placental weights were reduced more severely than fetal weight, it is unsurprising that placental efficiency was elevated (P = 0.0252) in CSH RNAi pregnancies, however, neither fetal membrane weights nor placentome number was impacted. The relationship between placental weight to fetal weight by treatment was not altered by CSH RNAi (Supplemental Fig. S1).
Figure 1.

Measures of fetal and uteroplacental mass at 137 ± 0 dGA: fetal weight in g (A), placental weight in g (B), and uterus weight in g (C). All data presented were analyzed by Student's t test. Data are shown as means ± SE for all pregnancies in each treatment group. CON (n = 6 pregnancies), control; CSH (n = 8 pregnancies), chorionic somatomammotropin; RNAi, RNA interference.
Uterine and Umbilical Blood Flow Assessments Near-Term
Uterine and umbilical measures of blood flow were assessed by the 3H2O transplacental diffusion technique near term (137 ± 0 dGA) over both study periods. No significant treatment × period interactions were observed, nor were there any significant main effects of period as summarized in Table 1. Uterine blood (P = 0.0043; Fig. 2) and plasma (P = 0.0077; Fig. 2) flow (mL/min) were reduced by 34% in CSH RNAi pregnancies. However, relative to either fetal, uterine, or placental weight, neither uterine blood nor plasma flow (mL/min/kg) differed between treatments.
Table 1.
Uterine and umbilical blood flow for CON versus CSH RNAi pregnancies at 137 ± 0 dGA
| Variable | Baseline |
Maternal Hyperglycemia |
P Values |
||||||
|---|---|---|---|---|---|---|---|---|---|
| CON RNAi(n = 6) | CSH RNAi (n = 8) | % Change | CON RNAi (n = 5) | CSH RNAi (n = 7) | % Change | Treatment | Period | Treatment × Period | |
| Uterine measurements | |||||||||
| Blood flow, mL/min/kg fetus | 533.54 ± 109.05 | 454.34 ± 91.01 | 14.84 | 449.84 ± 101.26 | 446.53 ± 98.34 | 0.74 | 0.278 | 0.2308 | 0.3171 |
| Plasma flow, mL/min/kg fetus | 365.39 ± 77.2 | 313.05 ± 62.67 | 14.32 | 311.06 ± 70.84 | 308.19 ± 67.88 | 0.92 | 0.3377 | 0.3049 | 0.3889 |
| Blood flow, mL/min/kg uterus | 3603.17 ± 743.53 | 2925.00 ± 625.71 | 18.82 | 3046.35 ± 683.34 | 2902.37 ± 687.5 | 4.73 | 0.2378 | 0.4002 | 0.4372 |
| Plasma flow, mL/min/kg uterus | 2466.96 ± 525.77 | 2016.93 ± 431.08 | 18.24 | 2105.76 ± 477.19 | 2006.38 ± 476.41 | 4.72 | 0.2784 | 0.4587 | 0.4842 |
| Placental blood flow, mL/min/100 g placenta | 462.60 ± 92.06 | 529.58 ± 112.57 | 14.48 | 396.59 ± 89.74 | 492.45 ± 112.94 | 24.17 | 0.1126 | 0.3034 | 0.7697 |
| Umbilical measurements | |||||||||
| Blood flow, mL/min/kg fetus | 184.91 ± 9.65 | 159.98 ± 30.95 | 13.49 | 179.048 ± 13.38 | 149.39 ± 34.01 | 16.56 | 0.0192 | 0.4483 | 0.8264 |
| Plasma flow, mL/min/kg fetus | 120.35 ± 6.77 | 95.36 ± 18.81 | 20.76 | 115.811 ± 9.38 | 89.97 ± 21.07 | 22.32 | 0.0047 | 0.5371 | 0.957 |
| Placental blood flow, mL/min/100 g placenta | 168.79 ± 16.18 | 174.53 ± 35.15 | 3.4 | 165.984 ± 19.42 | 152.11 ± 35.02 | 8.36 | 0.8028 | 0.4425 | 0.5492 |
| Uterine:Umbilical flow | 3.06 ± 0.65 | 2.81 ± 0.68 | 7.92 | 2.700 ± 0.61 | 3.27 ± 0.88 | 21.02 | 0.5408 | 0.8473 | 0.1398 |
| Average umbilical vein hematocrit | 0.3490 ± 0.009 | 0.40 ± 0.08 | 15.61 | 0.3519 ± 0.0114 | 0.3980 ± 0.09 | 13.09 | 0.0082 | 0.9604 | 0.7998 |
| Average uterine artery hematocrit | 0.3210 ± 0.012 | 0.3132 ± 0.0424 | 2.59 | 0.3123 ± 0.0129 | 0.3158 ± 0.0493 | 1.13 | 0.8191 | 0.7521 | 0.5608 |
Data are shown as means ± SE for all ewes in each treatment group. All data presented were analyzed by a two-way ANOVA to examine the interactions between period (baseline vs. hyperglycemic clamp) and treatment (CON RNAi vs. CSH RNAi). CON, control/nontargeting sequence; CSH, chorionic somatomammotropin; RNAi, RNA interference.
Figure 2.

Measures of blood and plasma flow at 137 ± 0 dGA: uterine blood flow as assessed by the transplacental diffusion technique (A), uterine plasma flow as assessed by the transplacental diffusion technique (B), umbilical blood flow as assessed by the transplacental diffusion technique (C), and umbilical plasma flow as assessed by the transplacental diffusion technique (D). All data presented were analyzed by a two-way ANOVA to examine the interactions between period (baseline vs. hyperglycemic clamp) and treatment (CON RNAi vs. CSH RNAi). Uterine baseline measures included CON RNAi n = 5, CSH RNAi n = 6. Umbilical baseline measures include CON RNAi n = 6, CSH RNAi n = 6. Uterine hyperglycemic measures included CON RNAi n = 4, CSH RNAi n = 5. Umbilical hyperglycemic measures include CON RNAi n = 5, CSH RNAi n = 5. Data are shown as means ± SE for all pregnancies in each treatment group. CON, control; CSH, chorionic somatomammotropin; RNAi, RNA interference.
Umbilical blood (P = 0.002; Fig. 2) and plasma (P = 0.0012; Fig. 2) flow (mL/min) were reduced by 28% and 33%, respectively, in CSH RNAi pregnancies. These reductions were also observed relative to fetal weight, with relative (mL/min/kg fetus) umbilical blood flow (P = 0.0192) and plasma flow (P = 0.0047) both being reduced in CSH RNAi pregnancies. Neither umbilical blood flow relative to placental weight nor the uterine:umbilical blood flow ratio differed between treatments. Uterine artery hematocrit was not altered by treatment, however, both umbilical vein (P = 0.0082) and umbilical artery hematocrits (P = 0.0314) were elevated by 16% and 13% respectively in CSH RNAi fetuses.
Blood Gases and Electrolytes in Response to Maternal Hyperglycemia
Limited uterine artery or vein blood gas changes were observed in response to CSH RNAi or due to the maternal hyperglycemic clamp (Supplemental Table S2). Uterine artery chloride content (meq/L) was reduced (P = 0.0073) in CSH RNAi dams and there was a tendency for methemoglobin to be reduced (P = 0.0817). Furthermore, there was a tendency (P = 0.0935) for uterine artery pH to be elevated in CSH RNAi dams. No uterine vein measures were altered by treatment or period.
Umbilical artery pH was unaltered by CSH RNAi but tended (P = 0.0858; Supplemental Table S3) to be reduced during maternal hyperglycemia. Umbilical artery and vein blood partial pressure of oxygen (Po2; mmHg), oxyhemoglobin (%), and soluble O2 (%) were all reduced (P ≤ 0.05) in CSH RNAi fetuses, whereas total hemoglobin (mmol/L) was elevated (P = 0.0332). Both umbilical artery oxygen content (mmol/L) and calcium (meq/L) tended (P ≤ 0.10) to be reduced in CSH RNAi fetuses, along with umbilical vein chloride concentrations (meq/L). Umbilical artery carboxyhemoglobin (%) and potassium (meq/L) both tended (P ≤ 0.10) to be reduced during maternal hyperglycemia regardless of treatment.
Oxygen Uptake and Utilization in Response to Maternal Hyperglycemia
As summarized in Table 2, uterine artery and vein oxygen content did not differ by treatment, nor did the uterine artery to vein oxygen gradient. However, the uterine uptake of oxygen was reduced by 34% (P = 0.0029; Fig. 3) in CSH RNAi pregnancies.
Table 2.
Nutrient uptake and utilization for CON versus CSH RNAi pregnancies at 137 ± 0 dGA
| Variable | Baseline |
Maternal Hyperglycemia |
P Values |
||||||
|---|---|---|---|---|---|---|---|---|---|
| CON RNAi (n = 6) | CSH RNAi (n = 8) | % Change | CON RNAi (n = 5) | CSH RNAi (n = 7) | % Change | Treatment | Period | Treatment × Period | |
| Oxygen | |||||||||
| Umbilical artery O2 content, mmol/L | 3.85 ± 0.10 | 3.22 ± 0.52 | 16.24 | 3.39 ± 0.17 | 2.75 ± 0.545 | 18.76 | 0.0337 | 0.1098 | 0.9701 |
| Umbilical vein O2 content, mmol/L | 5.65 ± 0.14 | 5.22 ± 0.77 | 7.72 | 5.41 ± 0.21 | 4.84 ± 0.82 | 10.58 | 0.1183 | 0.2993 | 0.8552 |
| Umbilical vein-artery O2 gradient, mmol/L | 1.81 ± 0.12 | 1.97 ± 0.38 | 8.76 | 2.02 ± 0.14 | 2.00 ± 0.44 | 0.99 | 0.5794 | 0.3046 | 0.4699 |
| Relative umbilical O2 uptake, mmol/min/kg fetus | 0.33 ± 0.02 | 0.32 ± 0.06 | 5.07 | 0.36 ± 0.02 | 0.30 ± 0.07 | 16.97 | 0.079 | 0.8922 | 0.3069 |
| O2 transferred per placental unit mmol/min/kg placenta | 3.06 ± 0.35 | 3.38 ± 0.67 | 10.63 | 3.30 ± 0.31 | 3.01 ± 0.68 | 8.79 | 0.9531 | 0.8349 | 0.3006 |
| Uterine artery O2 content, mmol/L | 6.01 ± 0.21 | 5.89 ± 0.12 | 2.08 | 5.86 ± 0.24 | 5.89 ± 0.15 | 0.59 | 0.8255 | 0.6579 | 0.6018 |
| Uterine vein O2 content, mmol/L | 4.70 ± 0.88 | 4.55 ± 0.87 | 3.1 | 4.64 ± 1.06 | 4.54 ± 1 | 2.1 | 0.4874 | 0.8256 | 0.9465 |
| Uterine artery to vein O2 gradient, mmol/L | 1.25 ± 0.24 | 1.24 ± 0.24 | 0.6 | 1.14 ± 0.26 | 1.20 ± 0.26 | 5.49 | 0.5514 | 0.1524 | 0.6176 |
| Relative uterine O2 uptake, mmol/min/kg uterus | 4.37 ± 0.81 | 3.56 ± 0.75 | 18.36 | 3.46 ± 0.79 | 3.49 ± 0.83 | 0.71 | 0.2684 | 0.1657 | 0.2406 |
| Relative O2 uteroplacental utilization, mmol/min/kg placenta | 2.84 ± 0.54 | 2.80 ± 0.8 | 1.43 | 1.48 ± 0.47 | 2.72 ± 0.76 | 83.93 | 0.1789 | 0.1119 | 0.1531 |
| Glucose | |||||||||
| Umbilical artery glucose content, mmol/L | 1.02 ± 0.04 | 0.77 ± 0.08 | 24.16 | 2.49 ± 0.19 | 2.10 ± 0.45 | 15.36 | 0.1199 | <0.0001 | 0.7296 |
| Umbilical vein glucose content, mmol/L | 1.20 ± 0.03 | 0.91 ± 0.15 | 23.89 | 2.81 ± 0.17 | 2.28 ± 0.5 | 18.68 | 0.0713 | <0.0001 | 0.5805 |
| Umbilical vein to artery glucose gradient, mmol/L | 0.18 ± 0.02 | 0.25 ± 0.08 | 44.92 | 0.32 ± 0.03 | 0.33 ± 0.08 | 2.85 | 0.4158 | 0.0505 | 0.5178 |
| Relative umbilical uptake, μmol/min/kg fetus | 29.79 ± 2.32 | 25.39 ± 5.08 | 14.77 | 52.74 ± 4.54 | 44.60 ± 10 | 15.44 | 0.0471 | <0.0001 | 0.5326 |
| Relative umbilical uptake, mg/min/kg placenta | 5.37 ± 0.42 | 4.58 ± 0.92 | 14.77 | 9.50 ± 0.82 | 8.04 ± 1.8 | 15.44 | 0.0471 | <0.0001 | 0.5326 |
| Uterine artery to umbilical artery glucose gradient, mmol/L | 2.29 ± 0.08 | 2.64 ± 0.17 | 15.56 | 5.53 ± 0.19 | 6.18 ± 0.97 | 11.76 | 0.007 | <0.0001 | 0.3913 |
| Uterine artery to umbilical vein glucose gradient, mmol/L | 2.28 ± 0.08 | 2.54 ± 0.37 | 11.55 | 5.63 ± 0.21 | 5.96 ± 0.97 | 5.88 | 0.1806 | <0.0001 | 0.8759 |
| Umbilical glucose:O2 quotient | 0.54 ± 0.03 | 0.49 ± 0.09 | 9.95 | 0.88 ± 0.05 | 0.91 ± 0.21 | 3.01 | 0.7486 | <0.0001 | 0.3467 |
| Uterine artery glucose content, mmol/L | 3.31 ± 0.07 | 3.32 ± 0.11 | 0.39 | 8.02 ± 0.28 | 7.88 ± 0.49 | 1.67 | 0.8414 | <0.0001 | 0.8086 |
| Uterine vein glucose content, mmol/L | 3.15 ± 0.58 | 3.12 ± 0.61 | 1.09 | 7.88 ± 1.78 | 8.01 ± 1.77 | 1.59 | 0.8514 | <0.0001 | 0.7435 |
| Uterine artery to vein glucose gradient, mmol/L | 0.19 ± 0.04 | 0.19 ± 0.04 | 1.3 | 0.31 ± 0.07 | 0.33 ± 0.08 | 5.62 | 0.7378 | 0.0006 | 0.802 |
| Relative uterine glucose uptake, μmol/min/kg uterus | 612.35 ± 121.83 | 516.90 ± 107.1 | 15.59 | 870.67 ± 201.27 | 929.56 ± 276.3 | 6.76 | 0.8862 | 0.0168 | 0.5477 |
| Uterine glucose:O2 quotient | 0.85 ± 0.17 | 0.88 ± 0.17 | 3.39 | 1.51 ± 0.34 | 1.51 ± 0.37 | 0.43 | 0.8907 | <0.0001 | 0.9302 |
| Glucose transferred per placental unit, μmol/min/kg placenta | 274.78 ± 35.01 | 272.64 ± 54.33 | 0.78 | 488.45 ± 59.41 | 450.96 ± 100.37 | 7.68 | 0.5945 | <0.0001 | 0.6348 |
| Fraction of glucose uptake utilized by placenta | 0.69 ± 0.13 | 0.67 ± 0.16 | 2.1 | 0.60 ± 0.15 | 0.69 ± 0.19 | 14.35 | 0.4121 | 0.4326 | 0.2558 |
| Fraction of glucose uptake transferred to fetus | 0.31 ± 0.06 | 0.33 ± 0.08 | 4.59 | 0.40 ± 0.11 | 0.31 ± 0.09 | 21.61 | 0.4121 | 0.4326 | 0.2558 |
| Lactate | |||||||||
| Umbilical artery lactate content, mmol/L | 1.83 ± 0.17 | 2.79 ± 0.8 | 53.09 | 2.32 ± 0.2 | 4.40 ± 1.47 | 89.8 | 0.0906 | 0.2353 | 0.5239 |
| Umbilical vein lactate content, mmol/L | 2.00 ± 0.18 | 2.98 ± 0.8 | 48.79 | 2.50 ± 0.2 | 4.48 ± 1.49 | 79.3 | 0.1019 | 0.2602 | 0.5668 |
| Umbilical vein to artery lactate gradient, mmol/L | 0.18 ± 0.01 | 0.14 ± 0.03 | 21.76 | 0.18 ± 0.01 | 0.15 ± 0.03 | 16.76 | 0.0251 | 0.5802 | 0.7741 |
| Umbilical lactate uptake, μmol/min | 148.77 ± 11.55 | 86.30 ± 22.21 | 41.99 | 147.98 ± 13.21 | 85.76 ± 22.38 | 42.04 | 0.0005 | 0.9648 | 0.9934 |
| Relative umbilical lactate uptake, μmol/min/kg fetus | 32.14 ± 2.4 | 22.51 ± 5.27 | 29.96 | 32.12 ± 3.05 | 22.06 ± 5.08 | 31.33 | 0.0035 | 0.938 | 0.9415 |
| Umbilical lactate:O2 quotient | 0.30 ± 0.04 | 0.2147 ± 0.05 | 28.14 | 0.27 ± 0.02 | 0.22 ± 0.05 | 17.51 | 0.0315 | 0.7142 | 0.5212 |
| Uterine artery lactate content, mmol/L | 0.73 ± 0.06 | 0.80 ± 0.11 | 10.05 | 0.75 ± 0.08 | 0.89 ± 0.09 | 17.79 | 0.2981 | 0.5753 | 0.7572 |
| Uterine vein lactate content, mmol/L | 0.83 ± 0.16 | 0.77 ± 0.17 | 6.72 | 0.86 ± 0.21 | 0.94 ± 0.22 | 8.83 | 0.9037 | 0.2458 | 0.4424 |
| Uterine vein to artery lactate gradient, mmol/ L | 0.06 ± 0.01 | 0.05 ± 0.02 | 6.17 | 0.07 ± 0.02 | 0.05 ± 0.02 | 22.16 | 0.4558 | 0.5732 | 0.636 |
| Uterine lactate export, μmol/min | 143.58 ± 35.41 | 79.89 ± 21.06 | 44.36 | 147.16 ± 33.6 | 74.78 ± 24.94 | 49.18 | 0.0052 | 0.9715 | 0.839 |
| Relative uterine lactate export, μmol/min/kg uterus | 209.45 ± 52.66 | 139.64 ± 33.74 | 33.33 | 214.54 ± 48.89 | 139.42 ± 45.41 | 35.02 | 0.0448 | 0.9428 | 0.9374 |
| Relative placental lactate export, μmol/min/kg placenta | 267.50 ± 63.08 | 269.91 ± 74.29 | 0.9 | 282.04 ± 68.21 | 273.96 ± 86.38 | 2.87 | 0.9634 | 0.8804 | 0.9323 |
| Uteroplacental lactate production, μmol/min | 292.03 ± 57.2 | 173.02 ± 47.21 | 40.75 | 284.35 ± 64.56 | 157.27 ± 48.81 | 44.69 | 0.0006 | 0.684 | 0.8883 |
| Relative uteroplacental lactate production, μmol/min/kg placenta | 546.97 ± 107.07 | 550.79 ± 151.46 | 0.7 | 541.56 ± 126.1 | 481.57 ± 149.14 | 11.08 | 0.7397 | 0.6595 | 0.7061 |
| Relative placental lactate transferred, μmol/min/kg placenta | 292.51 ± 29.01 | 248.96 ± 59.54 | 14.89 | 298.55 ± 40.78 | 224.58 ± 52.46 | 24.78 | 0.1169 | 0.8001 | 0.675 |
| Fraction of lactate uptake utilized by placenta | 0.48 ± 0.1 | 0.54 ± 0.13 | 12.52 | 0.52 ± 0.12 | 0.42 ± 0.17 | 18.89 | 0.8425 | 0.6546 | 0.4087 |
| Fraction of lactate uptake transferred to fetus | 0.52 ± 0.11 | 0.4581 ± 0.11 | 11.63 | 0.48 ± 0.11 | 0.58 ± 0.2036 | 20.32 | 0.8425 | 0.6546 | 0.4087 |
Data are shown as means ± SE for all ewes in each treatment group. CON, control/nontargeting sequence; CSH, chorionic somatomammotropin; RNAi, RNA interference. All data presented were analyzed by a two-way ANOVA to examine the interactions between period (baseline vs. hyperglycemic clamp) and treatment (CON RNAi vs. CSH RNAi).
Figure 3.

Uterine, umbilical, and uteroplacental oxygen uptakes and fractional utilization at 137 ± 0 dGA: uterine oxygen uptakes (mmol/min; A), umbilical oxygen uptakes (mmol/min; B), uteroplacental oxygen utilization (mmol/min; C), fraction of uteroplacental oxygen utilized by the placenta (D), and fraction of uteroplacental oxygen transferred to the fetus (E). All data presented were analyzed by a two-way ANOVA to examine the interactions between period (baseline vs. hyperglycemic clamp) and treatment (CON RNAi vs. CSH RNAi). Uterine baseline measures included CON RNAi n = 5, CSH RNAi n = 6. Umbilical baseline measures include CON RNAi n = 6, CSH RNAi n = 6. Uteroplacental baseline measures include CON RNA n = 5, CSH RNAi n = 5. Uterine hyperglycemic measures included CON RNAi n = 4, CSH RNAi n = 5. Umbilical hyperglycemic measures include CON RNAi n = 5, CSH RNAi n = 5. Uteroplacental hyperglycemic measures and fractional utilization measures include CON RNAi n = 4, CSH RNAi n = 4. Data are shown as means ± SE for all pregnancies in each treatment group. CON, control; CSH, chorionic somatomammotropin; RNAi, RNA interference.
Umbilical artery oxygen content was reduced (P = 0.0337) in CSH RNAi animals but neither umbilical vein oxygen content nor the umbilical vein to artery oxygen gradient (mmol/L) were impacted by treatment. Umbilical oxygen uptake (P = 0.0053; Fig. 3) was reduced by 21% and tended (P = 0.0790) to be reduced independent of fetal weight (mmol/min/kg fetus) in CSH RNAi animals.
Significant treatment × period interactions (P = 0.0305; Fig. 3) were observed for uteroplacental oxygen utilization (mmol/min), with reduced oxygen utilization by the placenta of CSH RNAi animals under basal conditions, but an increase in oxygen utilization during hyperglycemic conditions. This change in uteroplacental oxygen utilization is further supported by significant treatment × period interactions (P = 0.0315; Fig. 3) in fractional placental and fetal oxygen utilization and transfer, with reduced proportions of oxygen being utilized by the placenta of CSH RNAi animals under basal conditions and greater proportions of oxygen being transferred to the fetus. This effect, however, is reversed (P = 0.0315; Fig. 3) under maternal hyperglycemic conditions as the CSH RNAi placenta uses elevated proportions of oxygen and transfers less oxygen to the fetus, possibly identifying a compensatory mechanism that is activated under periods of greater nutrient availability. Oxygen transferred relative to placental mass (mmol/min/kg placenta) did not differ between treatments.
Glucose Uptake and Utilization in Response to Maternal Hyperglycemia
Uterine artery and vein glucose content did not differ between treatments but did increase (P < 0.0001; Table 2) across both treatments in response to maternal hyperglycemia, as did the uterine artery to vein glucose gradient (P < 0.0001). However, the uterine artery to umbilical artery glucose gradient was greater (P = 0.0070) in CSH RNAi animals versus CON animals regardless of study periods.
Although uterine glucose uptake (µmol/min) did not differ statistically by treatment (P = 0.1368; Fig. 4), the slope of the relationship between fetal body weight (y-axis, g; Fig. 5) and uterine glucose uptake (x-axis, µmol/min) was steeper (P = 0.0075) in CSH RNAi pregnancies versus CON RNAi. Relative uterine glucose uptake (μmol/min/kg uterus; Table 2) did not differ between treatments or across periods (baseline vs. hyperglycemia). However, maternal hyperglycemia did increase (P < 0.001) the total and relative glucose uptake by the uteri of both treatments, along with the uterine glucose to oxygen quotient (P < 0.0001).
Figure 4.

Uterine, umbilical, and uteroplacental glucose uptakes (total and relative) at 137 ± 0 dGA: uterine glucose uptakes (μmol/min; A), umbilical glucose uptakes (μmol/min; B), uteroplacental glucose utilization (μmol/min; C), and relative uteroplacental glucose utilization (μmol/min/kg placenta; D). All data presented were analyzed by a two-way ANOVA to examine the interactions between period (baseline vs. hyperglycemic clamp) and treatment (CON RNAi vs. CSH RNAi). Uterine baseline measures included CON RNAi n = 5, CSH RNAi n = 6. Umbilical baseline measures include CON RNAi n = 6, CSH RNAi n = 6. Uteroplacental baseline measures include CON RNA n = 5, CSH RNAi n = 5. Uterine hyperglycemic measures included CON RNAi n = 4, CSH RNAi n = 5. Umbilical hyperglycemic measures include CON RNAi n = 5, CSH RNAi n = 5. Uteroplacental hyperglycemic measures include CON RNAi n = 4, CSH RNAi n = 4. Data are shown as means ± SE for all pregnancies in each treatment group. CON, control; CSH, chorionic somatomammotropin; RNAi, RNA interference.
Figure 5.

Linear regressions: impact of in vivo CSH RNAi on umbilical glucose uptake in relationship to the maternofetal arterial glucose gradient at 137 ± 0 dGA (A) and the impact of in vivo CSH RNAi on fetal body weight in relationship to uteroplacental glucose uptake (B). CON, control; CSH, chorionic somatomammotropin; RNAi, RNA interference.
Umbilical vein glucose content (mmol/L) tended (P = 0.0713; Table 2) to be reduced in CSH RNAi fetuses but umbilical artery glucose content was not altered by treatment (P = 0.1199). However, both umbilical vein and artery glucose content increased (P < 0.0001) in response to maternal hyperglycemia across treatments, as did the umbilical artery-to-vein glucose gradient (P = 0.0505). The umbilical uptake of glucose was suppressed (P = 0.0046; Fig. 4) by 29% in CSH RNAi fetuses, and this reduction is consistent even when normalizing to fetal weight (µmol/min/kg fetus; P = 0.0471) and placental weight (µmol/min/kg placenta; P = 0.0471). The uptake of glucose increased (P < 0.0001) in all animals regardless of treatment during maternal hyperglycemia, but reductions (P = 0.0046) in glucose uptake in CSH RNAi fetuses were still present during maternal hyperglycemia. The umbilical glucose to oxygen quotient was not impacted by CSH RNAi but did increase (P < 0.0001) in response to greater substrate availability during the maternal hyperglycemic clamp across both treatments.
Uteroplacental glucose utilization (µmol/min) was not altered by treatment but did increase (P = 0.0494; Fig. 4) in both treatment groups with greater availability of substrate during the maternal hyperglycemic clamp. Maximal glucose transfer was calculated by examining the relationship between umbilical glucose uptake (y-axis, μmol/min; Fig. 5) and the transplacental plasma glucose concentrations represented by the uterine artery to umbilical artery glucose gradient (x-axis, mmol/L). For CON RNAi pregnancies, the linear regression equation is y = 29.54 X + 74.15, with an x-intercept of −2.51 mmol/L. For CSH RNAi pregnancies, the linear regression equation is y = 19.05X + 52.40, with an x-intercept of −2.751 mmol/L. While the overall slopes did not statistically differ from each other (P = 0.3417), the elevations or maximal glucose transfer were different (P = 0.0033) with CSH RNAi having a lower y-intercept than CON RNAi. Regardless of the treatment group, both total and relative glucose utilization by the placenta increased (P < 0.05) during maternal hyperglycemia, as did glucose transferred per volume of placenta (µmol/min/kg placenta; P < 0.0001).
Lactate Uptake and Utilization in Response to Maternal Hyperglycemia
Uterine artery and vein lactate content (mmol/L) did not differ by treatment or period, nor did the uterine vein-to-artery lactate gradient. However, the uterine export of lactate (P = 0.0052; Table 2) was reduced in CSH RNAi pregnancies, and this reduction (P = 0.0448; Table 2) was independent of maternal glycemic conditions and uterine mass (µmol/min/kg uterus) but not placental mass (µmol/min/kg uterus).
The umbilical artery and vein lactate tended to be reduced (P ≤ 0.10) in CSH RNAi fetuses, as was the umbilical vein-to-artery lactate gradient (P = 0.0251) regardless of the treatment period. Both umbilical lactate uptake (µmol/min) and relative umbilical lactate uptake (µmol/min/kg fetus) were significantly reduced (P ≤ 0.001; Table 2) in CSH RNAi pregnancies by 42% and 30%, respectively. This reduction was independent of maternal hyperglycemia and resulted in a reduced (P = 0.0315) lactate-to-oxygen quotient for CSH RNAi fetuses.
Independent of maternal hyperglycemia, uteroplacental lactate production was reduced (P = 0.0006; Table 2) by 41% in CSH RNAi pregnancies. However, this effect appears to be largely related to placental mass as relative uteroplacental lactate production and transfer (µmol/min/kg placenta) were not different between treatments. Furthermore, the fraction of lactate being either utilized by the placenta or transferred to the fetus did not differ by treatment or study period.
Amino Acids during Baseline
Amino acids were analyzed during the baseline period only. Despite the reduced uterine blood flow and uterine mass, only the uterine amino acid uptake (µmol/min; Supplemental Table S4) of threonine (P = 0.0409) was reduced (49%) in CSH RNAi pregnancies. No uterine amino acid uptakes were impacted on a relative basis (µmol/min/kg uterus; Supplemental Table S4).
Despite the normal uptakes of amino acids by the gravid uteroplacental unit, the umbilical uptakes (µmol/min) of amino acids were impacted to a greater degree as summarized by Supplemental Table S5. The umbilical uptakes of leucine, phenylalanine, and lysine were all reduced (P ≤ 0.05) in CSH RNAi fetuses, and the uptakes of glutamine, tyrosine, and tryptophan all tended to be reduced (P ≤ 0.10). On a relative basis (µmol/min/kg fetus; Supplemental Table S5), the umbilical uptake of phenylalanine was reduced (P = 0.0036) in CSH RNAi fetuses and the uptake of leucine (P = 0.0974) tended to be reduced.
The uteroplacental utilization (µmol/min; Supplemental Table S6) of alanine and phenylalanine was greater in CSH RNAi pregnancies, and the utilization of both asparagine and glycine tended to be greater (P ≤ 0.10). On a relative basis (µmol/min/kg placenta; Supplemental Table S6), the uteroplacental utilization of asparagine, alanine, and phenylalanine tended (P ≤ 0.10) to be greater in CSH RNAi pregnancies. However, the utilization of aspartate tended (P = 0.0765) to be reduced in CSH RNAi pregnancies.
Total Nutrient Uptakes during Baseline
Due to amino acid concentrations not being assessed during the maternal hyperglycemic clamp, total nutrient uptakes could not be assessed during that period, thus all total nutrient uptakes are calculated during the baseline period only. As summarized by Supplemental Table S7, the uterine uptakes of nitrogen and carbon from amino acids did not differ by treatment. However, uterine carbon uptake (µmol/min) from glucose was reduced (P = 0.0338) by 31% in CSH RNAi pregnancies, and uterine carbon uptake from lactate tended (P = 0.0682) to be reduced by 44%. Together, this resulted in a 35% reduction (P = 0.0465) in total carbon uptake by the uteri of CSH RNAi pregnancies, although not on a relative basis (µmol/min/kg uterus).
While umbilical uptakes (µmol/min; Supplemental Table S7) of nitrogen and carbon from amino acids were not significantly impacted by treatment, the uptakes of carbon from glucose (P = 0.0300) and lactate (P = 0.0148) were reduced by 29% and 42%, respectively, in CSH RNAi fetuses. This resulted in a 32% reduction (P = 0.0072) in total umbilical carbon uptake (µmol/min) in CSH RNAi fetuses. These reductions in total carbon uptake were somewhat independent of fetal mass as they tended (P = 0.0790) to be reduced on a relative basis (µmol/min/kg fetus). While none of the individual nutrient:oxygen quotients statistically differed by treatment during the baseline period, fetal total nutrient quotient, the number of carbon:oxygen molecules taken up by the fetus, was reduced (P = 0.0117) in CSH RNAi animals.
Endocrine Responses to CSH RNAi
Neither uterine artery insulin concentrations (ng/mL) nor insulin:glucose ratio differed by treatment, but unsurprisingly, both increased (P < 0.0001; Supplemental Table S8) in response to the maternal hyperglycemic clamp irrespective of treatment. Maternal insulin concentrations did not differ between CSH RNAi and CON animals (Table 3). Uterine vein CSH did not differ by treatment or period (Table 3). The relationship between uterine vein CSH (y-axis, ng/mL; Supplemental Fig. S1) and fetal or placental weight (x-axis, g) was examined, and no treatment differences were observed. This numerical reduction was largely independent of placental mass as CSH secretion was still 72% lower than controls when normalized to placental weight (Table 3). Uterine IGF1 (ng/mL), cortisol (ng/mL), and estradiol (ng/mL) concentrations did not differ by treatment. Interestingly, uterine artery glucagon concentrations (pg/mL) were reduced (P = 0.0054; Fig. 6) by 45% in CSH RNAi pregnancies. While glucagon concentrations unsurprisingly fell (P = 0.0006) in both treatment groups during maternal hyperglycemia, the degree of reductions in glucagon concentrations in ewes with CSH RNAi persisted compared with controls during both study periods (45% vs. 45%). While the uterine insulin to glucagon ratio was not different between treatments (Supplemental Table S8), it unsurprisingly increased in both treatment groups during maternal hyperglycemia (P = 0.0387).
Table 3.
Maternal and fetal endocrine responses to CSH RNAi under baseline conditions at 137 ± 0 dGA
| CON RNAi (n = 6) | CSH RNAi (n = 8) | P Value | % Change | |
|---|---|---|---|---|
| Maternal | ||||
| Uterine vein insulin, ng/mL | 0.58 ± 0.14 | 0.84 ± 0.17 | 0.2916 | 46.09 |
| Uterine vein insulin:glucose | 0.20 ± 0.05 | 0.29 ± 0.06 | 0.2953 | 47.69 |
| Uterine artery CSH, ng/mL | 330.35 ± 42.47 | 239.88 ± 52.33 | 0.2902 | 27.39 |
| Placental CSH secretion, ng/min | 20,0143 ± 80,084 | 43,878 ± 44,783 | 0.1147 | 78.07 |
| Relative placental CSH secretion, ng/min/kg placenta | 348.92 ± 134.63 | 97.09 ± 154.98 | 0.2732 | 72.17 |
| Uterine vein IGF1, ng/mL | 182.18 ± 17.13 | 179.68 ± 14.31 | 0.9125 | 1.37 |
| Uterine vein cortisol, ng/mL | 168.04 ± 74.59 | 186.30 ± 64.44 | 0.8573 | 10.86 |
| Uterine vein estradiol, ng/mL | 15.46 ± 2.14 | 12.34 ± 2.87 | 0.4396 | 20.16 |
| Fetal | ||||
| Umbilical vein estradiol, ng/mL | 9.84 ± 3.33 | 10.13 ± 2.25 | 0.9429 | 2.92 |
| Umbilical artery glucagon, pg/mL | 147.59 ± 16.25 | 183.32 ± 55.64 | 0.5858 | 24.21 |
All data presented were analyzed by Student's t test. Data are shown as means ± SE for all ewes in each treatment group. CON, control/nontargeting sequence; CSH, chorionic somatomammotropin; RNAi, RNA interference.
Figure 6.

The effects of maternal hyperglycemia on umbilical artery insulin and insulin:glucose ratios at 137 ± 0 dGA: uterine artery glucagon (pg/mL; A), umbilical artery insulin (ng/mL; B) and umbilical artery insulin:glucose ratios (C). All data presented were analyzed by a two-way ANOVA to examine the interactions between period (baseline vs. hyperglycemic clamp) and treatment (CON RNAi vs. CSH RNAi). Data are shown as means ± SE for all pregnancies in each treatment group. Uterine and umbilical baseline measures included CON RNAi n = 6, CSH RNAi n = 8. Uterine hyperglycemic measures included CON RNAi n = 5, CSH RNAi n = 7. Umbilical artery insulin hyperglycemic measures include CON RNAi n = 5, CSH RNAi n = 7. Umbilical artery insulin:glucose hyperglycemic measures include CON RNAi n = 5, CSH RNAi n = 6. CON, control; CSH, chorionic somatomammotropin; RNAi, RNA interference.
Umbilical artery insulin was reduced (P = 0.0138; Fig. 6) by 51% in CSH RNAi pregnancies independent of maternal hyperglycemia. However, insulin concentrations did increase (P = 0.0022) across both treatments during the maternal hyperglycemic clamp, although the relative difference in insulin concentrations between CON RNAi and CSH RNAi pregnancies remained consistent from the baseline to maternal hyperglycemic clamp (51% vs. 51%). The umbilical artery insulin:glucose ratio, an indicator of glucose sensitivity, tended (P = 0.0604; Fig. 6) to decrease in CSH RNAi fetuses. Umbilical vein CSH concentrations were not impacted by treatment or period (Supplemental Table S8). Umbilical artery IGF1 concentrations were reduced (P = 0.0294; Fig. 7) by 42% in CSH RNAi fetuses and while not statistically different (P = 0.1728; Fig. 7), umbilical artery cortisol was elevated by 75%. Umbilical vein estradiol, umbilical artery glucagon, and the umbilical artery insulin:glucagon ratio were not altered (Table 3) in response to CSH RNAi.
Figure 7.

Umbilical hormone concentrations under baseline conditions at 137 ± 0 dGA: umbilical artery IGF1 concentrations (ng/mL; A) and umbilical artery cortisol (ng/mL; B). All data presented were analyzed by Student's t test. Data are shown as means ± SE for all pregnancies in each treatment group. CON (n = 6), control; CSH (n = 7), chorionic somatomammotropin; RNAi, RNA interference.
DISCUSSION
Previously, we showed that CSH RNAi impairs in vivo uteroplacental glucose uptake and utilization, demonstrating a likely role of CSH in regulating placental function (11, 12). Based on this evidence, we set out to investigate the ramifications of experimentally increasing the transplacental glucose gradient via maternal hyperglycemic clamp during late gestation in CSH RNAi pregnancies. We hypothesized that despite elevated maternal glucose concentrations, umbilical glucose uptakes would still be impaired in CSH RNAi pregnancies, demonstrating dysfunction in placental glucose metabolism and transfer. The results from this investigation support this hypothesis.
In the current cohort, despite experimentally increasing maternal glucose concentrations, umbilical glucose uptake was not restored in the CSH RNAi fetus. This was evidenced by persistently reduced umbilical glucose uptakes independent of maternal hyperglycemia in CSH RNAi fetuses, as well as an increased transplacental glucose gradient (uterine artery - umbilical artery gradient), a hallmark of dysfunction in placental glucose transfer. Because placental glucose transfer is characterized by saturable, carrier-mediated transport, a higher glucose concentration in maternal circulation should facilitate greater transfer across the placenta (28, 29) barring placental dysfunction. A multiplicity of factors can impact placental glucose transfer including uteroplacental blood flow, the transplacental glucose gradient, the availability of placental glucose transporters, placental mass, and placental metabolic demands (30, 31).
While the uterine uptakes of glucose did not statistically differ between treatments in this cohort, we have previously reported differences in uterine glucose uptakes using this model (11, 13) and we did still observe a 34% reduction in glucose being taken up by the gravid uterus during the baseline period, which could, in part, explain some of the persistent fetal hypoglycemia present in this study as well as previously reported (11, 13). However, during the maternal hyperglycemic clamp, uterine glucose uptake by the uteri in CSH RNAi pregnancies did increase to significantly greater levels from baseline. This increase in substrate being taken up by the gravid uterus is despite the consistently lower uterine blood flow in CSH RNAi animals during both study periods. This appears to indicate that reduced uterine blood flow is not the primary reason for the reduced umbilical glucose uptakes during the maternal hyperglycemic clamp, which points toward dysfunction in either placental glucose transporter availability, decreased placental mass, or increased placental glucose metabolism as potential explanations for persistent fetal hypoglycemia.
A previous study (11) that investigated the in vivo physiology of CSH RNAi pregnancies described similar patterns to the current cohort of reduced uterine and umbilical glucose uptakes but documented no significant changes to placental SLC2A1 (GLUT1) or SLC2A3 (GLUT3) concentrations. This contrasts with Jeckel et al. (10) who noted decreased SLC2A3 concentrations in CSH RNAi placentae near-term (135 dGA) pregnancies, however that study was performed under fasted, anesthetized conditions as described by Baker et al. (9), which may potentially explain the discrepancy. Another potential explanation for this difference is changes to SLC2A1 and SLC2A3 localization may have occurred without changes in transporter concentrations, which could have contributed to reduced placental glucose transfer. Future studies should examine the localization of SLC2A1 and SLC2A3 using this model. While it is possible that glucose transporter availability was impacted in the current cohort, the physiological data point toward increases in placental oxidative demands as the most robust explanation for why fetal glucose concentrations were not restored with elevated maternal glucose.
This is best illustrated by examining both uteroplacental glucose and oxygen utilization relative to placental mass during maternal hyperglycemia. It is worth noting that due to maternal or fetal catheter patency complications, only four of the seven CSH RNAi animals had calculable uteroplacental substrate utilization, somewhat limiting our sample size. Despite this limitation, relative (μmol/min/kg placenta) uteroplacental glucose utilization rose by 51% during the maternal hyperglycemic clamp (but was not statistically different, P = 0.15) in CSH RNAi pregnancies. This could in part, explain why the umbilical glucose uptakes were not rescued by increasing the maternal glucose concentrations as less glucose was available for transfer to the fetus.
This is further supported by the two-point regression analysis of placental glucose transfer that documented reduced y-intercepts in CSH RNAi pregnancies, supporting the notion of reduced glucose transfer during maternal hyperglycemia. Together, these data point toward a previously discussed (12) compensatory mechanism, activated during CSH gene product deficiency, which appears to increase the placental utilization of oxidative substrates to support adequate fetal growth (12). However, in instances of CSH RNAi with fetal growth restriction (11), where greater reductions in blood flow and nutrient uptake occur, it appears this compensatory mechanism may be deleterious as increasing placental oxidation fails to support adequate fetal growth. This mechanism is further supported by a small cohort of more severely growth-restricted (32% reduction in fetal weight, 52% reduction in placental weight) CSH RNAi animals, where the slope of the regression between umbilical glucose uptake and maternofetal arterial glucose gradient did tend to be reduced in CSH RNAi animals, along with the Y-intercept (32) supporting the idea that glucose transfer by the placenta is impaired. Together, these data support the potential role of CSH in regulating glucose transfer to the fetus by regulating placental metabolism.
While it appears that CSH RNAi results in reduced umbilical glucose uptake as a byproduct of increased uteroplacental oxidative demands, this response differs from another model of FGR in sheep. During maternal hyperthermia-induced PI-FGR (33), placental glucose transfer is suppressed without substantial changes to uteroplacental glucose consumption or perfusion. This is evidenced by measuring uteroplacental glucose utilization, blood flow, and linear regression analysis of umbilical glucose uptake (y-axis) in relation to maternal-fetal plasma arterial glucose concentrations [x-axis (33)]. Due to limited changes in uptake and perfusion, along with nonparallel and statistically different regression lines, it was determined that fetuses from hyperthermic PI-FGR fetuses had reduced glucose uptakes due to reduced placental glucose transfer capacity (33). The distinctions between these two models support the idea that different placental perturbations may result in a similar fetal phenotype.
Another novel finding from this study regarding the role of CSH is in maintaining blood gas and electrolyte balances. Previously, limited changes in uterine and umbilical blood gases exempting oxygen content had been reported (11, 12), likely due to smaller sample sizes. In the current cohort of CSH RNAi pregnancies assessed over basal and hyperglycemic study periods, there was a significant reduction in uterine artery chloride content and a tendency for reductions in methemoglobin % which could be a function of reduced uterine blood flow. Furthermore, uterine artery pH tended to be elevated in CSH RNAi animals, which could be partially explained by reduced uteroplacental lactate production. Overall, however, limited changes to maternal blood gas and electrolyte balances were observed as a consequence of CSH RNAi. In contrast, umbilical blood gas and electrolyte balances were more impacted by CSH RNAi. Umbilical artery and vein blood partial pressure of oxygen, oxyhemoglobin, and soluble O2 were all diminished along with carboxyhemoglobin, while total hemoglobin was elevated. These effects are likely due to reductions in both uterine and umbilical blood flow and chronic fetal hypoxia. This would also explain why total hemoglobin and umbilical hematocrit were elevated. Umbilical calcium concentrations also tended to be reduced in CSH RNAi pregnancies, which has been observed previously (34) along with umbilical vein chloride concentrations, a likely consequence of lower maternal chloride concentrations. Umbilical artery potassium levels were also reduced. While the specific reasons for each of these changes remain to be determined, they are likely driven by substantial decreases in uterine and umbilical blood flow and oxygen uptakes, along with the shifts in substrate availability and oxidation during the maternal hyperglycemic clamp period. Changes in fetal blood gases reflective of lower oxygen uptakes have been documented in other sheep models of FGR (21) and thus, support this idea.
A key finding confirmed by the current study was the role of CSH on uterine growth. This relationship supports the Tanner et al. (11) study, which suggested CSH may act to promote uterine growth via regulation of uterine blood flow. The strong relationship between CSH and uterine blood flow has been demonstrated across all physiological experiments on CSH RNAi pregnancies (11–13; current cohort) regardless of fetal weight. However, the degree of blood flow reductions appears to be enhanced based on the severity of CSH RNAi phenotype as evidenced by Hord et al. (13). Furthermore, the effect of CSH RNAi on uterine blood flow disappears when normalized to uterine weight suggesting CSH may first be acting to promote blood flow leading to uterine growth and nutrient uptake to promote placental function and fetal growth. This would certainly point toward why a 30% reduction in uterine blood flow was observed in the current cohort and is supported by previous studies (11, 12) although the degree of fetal growth restriction is greater with significant reductions in maternal CSH concentrations (13).
Another finding that strengthens our previous characterization of the CSH RNAi model is amino acid uptake and transfer. While the uterine uptakes of fewer amino acids in total were impacted in this cohort compared with a previous study (11), the reduction in the umbilical uptakes of some of the individual amino acids was impacted in a similar fashion to what has been previously reported (11). This resulted in overall reductions in total carbon available for uptake by the CSH RNAi fetus, which was observed independent of fetal mass. Uterine total carbon uptakes were likewise impaired, further supporting our previous report (11) on the consequences of CSH RNAi on global nutrient transfer and uptake.
While the exact biological role of CSH continues to be investigated, Handwerger (35) postulated that one of the main functions of CSH was to act as a partitioning agent to regulate fetal nutrient supply, acting distinctively in the mother and the fetus. In the mother, Handwerger speculated that CSH increased late-gestation IGF1 concentrations (36, 37) along with promoting glucose intolerance, proteolysis, and lipolysis to facilitate greater nutrient partitioning in the fetus (35). While we have repeatedly demonstrated limited effects of CSH RNAi on maternal IGF1 concentrations (11, 13; current study), the data from our current cohort may provide an intriguing alternative explanation as to the metabolic actions of CSH in the mother.
Handwerger predicted that the main maternal action of CSH was to increase circulating glucose to drive more substrate across the placenta and that this effect was being potentiated by CSH increasing peripheral insulin resistance (35). The mechanism behind this hypothesis is the actions of CSH on the β cell. Experiments indicating that β-cell numerical increases due to CSH are based largely on experiments in rodent where species-specific increases in β-cell number as well as mass over gestation have been well documented (38–40). However, important distinctions between rodent and human β cells exist including the distribution of islets, β-cell clusters, and organization (41). Furthermore, rodent and human β cells differ drastically in their propensity to enter cell cycle replication, with human β cells rarely if ever dividing in contrast to rodents (42). Thus, the rodent-specific observation that CSH stimulates β-cell replication does not necessarily carry through to humans, with β cells mostly expanding in size with very limited proliferation over pregnancy (43).
Not only have we not observed the predicted effects of CSH RNAi on maternal insulin concentrations in all our in vivo CSH RNAi studies (9, 11–13; current cohort), we have occasionally observed the converse relationship (9). While much research has rightfully focused on investigating maternal insulin sensitivity during pregnancy, there is a paucity of research interrogating the role of maternal glucagon in liberating glucose to augment placental glucose transfer. In the current study, maternal glucagon concentrations are reduced significantly (45%) due to CSH deficiency. This impaired glucagon secretion in CSH RNAi versus CON RNAi dams is also detectable during maternal hyperglycemia, suggesting altered pancreatic responsiveness due to chronic CSH deficiency. Perhaps, one of the maternal roles of CSH is to stimulate maternal glucagon levels to increase maternal peripheral glucose concentrations rather than insulin driving this effect.
Several potential possibilities as to the actions of CSH on maternal glucagon may exist, either directly or indirectly impacting its production and secretion. A potential direct action of CSH on maternal glucagon is that CSH is directly acting on the α-cells in the maternal pancreas to either stimulate glucagon production or secretion. To test this, the responsiveness of the α-cells to CSH would need to be directly assessed. It is unknown whether the α-cells express CSH receptors. Alternatively, CSH could be acting indirectly by regulating maternal insulin which could result in elevated maternal glucagon. This is supported by our current study which demonstrated similar converse relationships between reduced maternal glucagon (45%) and numerically elevated (46%) maternal insulin, despite maternal insulin not differing statistically. Therefore, whether direct or indirect, CSH appears to be stimulating maternal glucagon secretion, thereby increasing maternal glucose concentrations (especially via gluconeogenesis) to increase glucose transfer across the placenta. However, it is possible that this relationship is more robust within ruminant animals due to gluconeogenesis being the primary source of glucose production.
A third potential explanation is another indirect action of CSH. It could simply be that the reductions in maternal glucagon in CSH RNAi animals are due to the reduction in uterine blood flow resulting in decreased uterine uptakes of nutrients, which resulted in less oxidative substrate available to support placental function. Impaired placental function could then cause less of a currently unknown but important regulator of maternal glucagon levels to be produced by the placenta. This explanation is supported by data from Lynch et al. (44), as the same reductions were observed in maternal glucagon concentrations in a sheep in vivo model of placental SLC2A3 RNAi, independent of uterine CSH concentrations. This was hypothesized to be due to the deficit in glucose uptake by the gravid uteroplacental unit which did not produce as much of a key, but unknown maternal endocrine regulators. To really understand the potential actions of CSH in regulating maternal glucose, future studies should examine the relationship between glucagon and CSH.
In the fetus, Handwerger predicted that CSH would stimulate IGF1 to promote somatogenic activity and nutrient uptake (35). Our data largely support Handwerger’s hypothesis pertaining to fetal physiology as we have previously and repeatedly demonstrated that CSH RNAi results in decreased IGF1 regardless of fetal weight reductions (9, 11, 13, 45). Our data also support that CSH RNAi impaired oxidative substrate uptake by CSH RNAi fetuses in vivo (11, 13; current study). While we have previously reported that CSH RNAi reduces fetal insulin concentrations (11), the data from the current study may point toward a greater functional purpose of CSH in maintaining fetal pancreatic function. This is supported by the similar degree of impairments of CSH RNAi fetal insulin concentration compared with controls during both basal (51%) and maternal hyperglycemic (51%) conditions combined with the reduced insulin:glucose ratios. We postulate that CSH may be important for regulating glucose sensitivity as CSH-deficient animals appeared to have reduced pancreatic responsiveness to elevated glucose. Future studies should explicitly examine the role of CSH on fetal glucose-stimulated insulin secretion. Together, these data do support the purported role of CSH by Handwerger in the fetus and stress the necessity of adequate CSH to promote adequate fetal growth, endocrine health, and placental function.
Conclusions
Ultimately, based on the literature and the data presented in the study, it appears that two of the key biological roles of CSH are 1) to promote blood flow and nutrient uptake by the uteroplacental unit and 2) to regulate uteroplacental oxidative metabolism. Furthermore, it appears that CSH acts in an endocrine fashion to promote fetal liver growth as well as IGF and insulin secretion, and likely, glucose sensitivity. When CSH gene product deficiency occurs, deficiencies in blood flow and nutrient uptake occur, impacting both the fetus and the placenta and resulting in metabolic maladaptation. In the placenta, a greater volume of oxidative substrates is required to maintain function, resulting in fewer nutrients being available for transfer to the fetus. In the fetus, the liver and pancreas have reduced capacity to produce IGF1 and insulin, respectively. Ultimately, these adaptations lead to the development of fetal and placental growth restriction.
DATA AVAILABILITY
Source data for this study are openly available at https://doi.org/10.6084/m9.figshare.24246709.
SUPPLEMENTAL DATA
Supplemental Fig. S1 and Supplemental Tables S1–S8: https://doi.org/10.6084/m9.figshare.24247099.
GRANTS
This work was supported by National Institutes of Health Grants R01HD093701 (Co-PI: P.J.R. and R.V.A.), R01HD111557 (to P.J.R.), S10OD023553 (PI: Laura D. Brown), and T32HD007186 (PI: P.J.R., trainee: A.R.T.), and Agriculture and Food Research Initiative Grants 2016–38420- 25289 (PI: Thomas R. Hansen, trainee: A.R.T.) and 2019–67011-29614 (PI: A.R.T.) from the US Department of Agriculture.
DISCLOSURES
No conflicts of interest, financial or otherwise, are declared by the authors.
AUTHOR CONTRIBUTIONS
A.R.T., R.V.A., and P.J.R. conceived and designed research; A.R.T., V.C.K., C.S.L., Q.A.W., R.V.A., and P.J.R. performed experiments; A.R.T., R.V.A., and P.J.R. analyzed data; A.R.T., R.V.A., and P.J.R. interpreted results of experiments; A.R.T., R.V.A., and P.J.R. prepared figures; A.R.T., R.V.A., and P.J.R. drafted manuscript; A.R.T., V.C.K., C.S.L., Q.A.W., R.V.A., and P.J.R. edited and revised manuscript; A.R.T., V.C.K., C.S.L., Q.A.W., R.V.A., and P.J.R. approved final version of manuscript.
ACKNOWLEDGMENTS
The authors thank Bailyn Furrow, Blake Gash, Collin Soderstrom, David Caprio, Gates Roe, Gregory Harding, Jessica Craig, Karen Tremble, Larry Toft, Malini Dasai, Richard Brandes, Serhat Tasdelen, and Vince Abushaban for animal care and additional technical support.
REFERENCES
- 1. Brar HS, Rutherford SE. Classification of intrauterine growth retardation. Semin Perinatol 12: 2–10, 1988. [PubMed] [Google Scholar]
- 2. Pollack RN, Divon MY. Intrauterine growth retardation: definition, classification, and etiology. Clin Obstet Gynecol 35: 99–107, 1992. doi: 10.1097/00003081-199203000-00015. [DOI] [PubMed] [Google Scholar]
- 3. Regnault TR, Galan HL, Parker TA, Anthony RV. Placental development in normal and compromised pregnancies– a review. Placenta 23 Suppl A: S119–S129, 2002. doi: 10.1053/plac.2002.0792. [DOI] [PubMed] [Google Scholar]
- 4. Gagnon R. Placental insufficiency and its consequences. Eur J Obstet Gynecol Reprod Biol 110 Suppl 1: S99–S107, 2003. doi: 10.1016/s0301-2115(03)00179-9. [DOI] [PubMed] [Google Scholar]
- 5. Anthony RV, Scheaffer AN, Wright CD, Regnault TR. Ruminant models of prenatal growth restriction. Reprod Suppl 61: 183–194, 2003. [PubMed] [Google Scholar]
- 6. Ghidini A. Idiopathic fetal growth restriction: a pathophysiologic approach. Obstet Gynecol Surv 51: 376–382, 1996. doi: 10.1097/00006254-199606000-00023. [DOI] [PubMed] [Google Scholar]
- 7. Daikoku NH, Tyson JE, Graf C, Scott R, Smith B, Johnson JW, King TM. The relative significance of human placental lactogen in the diagnosis of retarded fetal growth. Am J Obstet Gynecol 135: 516–521, 1979. doi: 10.1016/0002-9378(79)90443-5. [DOI] [PubMed] [Google Scholar]
- 8. Letchworth AT, Chard T. Placental lactogen levels as a screening test for fetal distress and neonatal asphyxia. Lancet 1: 704–706, 1972. doi: 10.1016/s0140-6736(72)90227-9. [DOI] [PubMed] [Google Scholar]
- 9. Baker CM, Goetzmann LN, Cantlon JD, Jeckel KM, Winger QA, Anthony RV. Development of ovine chorionic somatomammotropin hormone-deficient pregnancies. Am J Physiol Regul Integr Comp Physiol 310: R837–R846, 2016. doi: 10.1152/ajpregu.00311.2015. [DOI] [PMC free article] [PubMed] [Google Scholar]
- 10. Jeckel KM, Boyarko AC, Bouma GJ, Winger QA, Anthony RV. Chorionic somatomammotropin impacts early fetal growth and placental gene expression. J Endocrinol 237: 301–310, 2018. doi: 10.1530/JOE-18-0093. [DOI] [PMC free article] [PubMed] [Google Scholar]
- 11. Tanner AR, Lynch CS, Kennedy VC, Ali A, Winger QA, Rozance PJ, Anthony RV. CSH RNA interference reduces global nutrient uptake and umbilical blood flow resulting in intrauterine growth restriction. Int J Mol Sci 22: 8150, 2021. doi: 10.3390/ijms22158150. [DOI] [PMC free article] [PubMed] [Google Scholar]
- 12. Tanner AR, Lynch CS, Ali A, Winger QA, Rozance PJ, Anthony RV. Impact of chorionic somatomammotropin RNA interference on uterine blood flow and placental glucose uptake in the absence of intrauterine growth restriction. Am J Physiol Regul Integr Comp Physiol 320: R138–R148, 2021. doi: 10.1152/ajpregu.00223.2020. [DOI] [PMC free article] [PubMed] [Google Scholar]
- 13. Hord TK, Tanner AR, Kennedy VC, Lynch CS, Winger QA, Rozance PJ, Anthony RV. Impact of chorionic somatomammotropin in vivo RNA interference phenotype on uteroplacental expression of the IGF axis. Life (Basal) 13: 1261, 2023. doi: 10.3390/life13061261. [DOI] [PMC free article] [PubMed] [Google Scholar]
- 14. Rygaard K, Revol A, Esquivel-Escobedo D, Beck BL, Barrera-Saldaña HA. Absence of human placental lactogen and placental growth hormone (HGH-V) during pregnancy: PCR analysis of the deletion. Hum Genet 102: 87–92, 1998. doi: 10.1007/s004390050658. [DOI] [PubMed] [Google Scholar]
- 15. Percie Du Sert N, Ahluwalia A, Alam S, Avey MT, Baker M, Browne WJ, Clark A, Cuthill IC, Dirnagl U, Emerson M, Garner P, Holgate ST, Howells DW, Hurst V, Karp NA, Lazic SE, Lidster K, MacCallum CJ, Macleod M, Pearl EJ, Petersen OH, Rawle F, Reynolds P, Rooney K, Sena ES, Silberberg SD, Steckler T, Würbel H. Reporting animal research: explanation and elaboration for the ARRIVE guidelines 2.0. PLoS Biol 18: e3000411, 2020. doi: 10.1371/journal.pbio.3000411. [DOI] [PMC free article] [PubMed] [Google Scholar]
- 16.National Research Council. Nutrient Requirements of Small Ruminants: Sheep, Goats, Cervids, and New World Camelids. Washington DC: The National Academies Press, 2007. [Google Scholar]
- 17. Bonds DR, Anderson S, Meschia G. Transplacental diffusion of ethanol under steady state conditions. J Dev Physiol 2: 409–416, 1980. [PubMed] [Google Scholar]
- 18. Jones AK, Rozance PJ, Brown LD, Goldstrohm DA, Hay WW, Limesand SW, Wesolowski SR. Sustained hypoxemia in late gestation potentiates hepatic gluconeogenic gene expression but does not activate glucose production in the ovine fetus. Am J Physiol Endocrinol Metab 317: E1–E10, 2019. doi: 10.1152/ajpendo.00069.2019. [DOI] [PMC free article] [PubMed] [Google Scholar]
- 19. Brown LD, Rozance PJ, Bruce JL, Friedman JE, Hay WW, Wesolowski SR. Limited capacity for glucose oxidation in fetal sheep with intrauterine growth restriction. Am J Physiol Regul Integr Comp Physiol 309: R920–R928, 2015. doi: 10.1152/ajpregu.00197.2015. [DOI] [PMC free article] [PubMed] [Google Scholar]
- 20. Hay WW Jr, Sparks JW, Quissell BJ, Battaglia FC, Meschia G. Simultaneous measurements of umbilical uptake, fetal utilization rate, and fetal turnover rate of glucose. Am J Physiol Endocrinol Physiol 240: E662–E668, 1981. doi: 10.1152/ajpendo.1981.240.6.E662. [DOI] [PubMed] [Google Scholar]
- 21. Regnault TR, de Vrijer B, Galan HL, Davidsen ML, Trembler KA, Battaglia FC, Wilkening RB, Anthony RV. The relationship between transplacental O2 diffusion and placental expression of PlGF, VEGF and their receptors in a placental insufficiency model of fetal growth restriction. J Physiol 550: 641–656, 2200. 3. doi: 10.1113/jphysiol.2003.039511. [DOI] [PMC free article] [PubMed] [Google Scholar]
- 22. Cilvik SN, Wesolowski SR, Anthony RV, Brown LD, Rozance PJ. Late gestation fetal hyperglucagonaemia impairs placental function and results in diminished fetal protein accretion and decreased fetal growth. J Physiol 599: 3403–3427, 2021. doi: 10.1113/JP281288. [DOI] [PMC free article] [PubMed] [Google Scholar]
- 23. Meschia G, Cotter JR, Makowski EL, Barron DH. Simultaneous measurement of uterine and umbilical blood flows and oxygen uptake. Quart J Exper Physiol 52: 1–18, 1966. doi: 10.1113/expphysiol.1967.sp001877. [DOI] [Google Scholar]
- 24. Meschia G, Battaglia FC, Hay WW Jr, Sparks JW. Utilization of substrates by the ovine placenta in vivo. Fed Proc 39: 245–249, 1980. [PubMed] [Google Scholar]
- 25. Carver TD, Anderson SM, Aldoretta PW, Hay WW Jr.. Effect of low-level basal plus marked “pulsatile” hyperglycemia on insulin secretion in fetal sheep. Am J Physiol Endocrinol Physiol 271: E865–E871, 1996. doi: 10.1152/ajpendo.1996.271.5.E865. [DOI] [PubMed] [Google Scholar]
- 26. Andrews SE, Brown LD, Thorn SR, Limesand SW, Davis M, Hay WW, Rozance PJ. Increased adrenergic signaling is responsible for decreased glucose-stimulated insulin secretion in the chronically hyperinsulinemic ovine fetus. Endocrinology 156: 367–376, 2015. doi: 10.1210/en.2014-1393. [DOI] [PMC free article] [PubMed] [Google Scholar]
- 27. Benjamin JS, Culpepper CB, Brown LD, Wesolowski SR, Jonker SS, Davis MA, Limesand SW, Wilkening RB, Hay WW Jr, Rozance PJ. Chronic anemic hypoxemia attenuates glucose-stimulated insulin secretion in fetal sheep. Am J Physiol Regul Integr Comp Physiol 312: R492–R500, 2017. doi: 10.1152/ajpregu.00484.2016. [DOI] [PMC free article] [PubMed] [Google Scholar]
- 28. Widdas WF. Inability of diffusion to account for placental glucose transfer in the sheep and consideration of the kinetics of a possible carrier transfer. J Physiol 118: 23–39, 1952. doi: 10.1113/jphysiol.1952.sp004770. [DOI] [PMC free article] [PubMed] [Google Scholar]
- 29. Hay WW Jr. The role of placental-fetal interaction in fetal nutrition. Semin Perinatol 15: 424–433, 1991. [PubMed] [Google Scholar]
- 30. Barry JS, Anthony RV. The pregnant sheep as a model for human pregnancy. Theriogenology 69: 55–67, 2008. doi: 10.1016/j.theriogenology.2007.09.021. [DOI] [PMC free article] [PubMed] [Google Scholar]
- 31. Hay WW Jr, Molina RA, DiGiacomo JE, Meschia G. Model of placental glucose consumption and glucose transfer. Am J Physiol Regul Integr Comp Physiol 258: R569–R577, 1990. doi: 10.1152/ajpregu.1990.258.3.R569. [DOI] [PubMed] [Google Scholar]
- 32. Tanner AR, Kennedy VC, Lynch CS, Hord TK, Winger QA, Rozance PJ, Anthony RV. In vivo investigation of ruminant placenta function and physiology-a review. J Anim Sci 100: skac045, 2022. doi: 10.1093/jas/skac045. [DOI] [PMC free article] [PubMed] [Google Scholar]
- 33. Thureen PJ, Trembler KA, Meschia G, Makowski EL, Wilkening RB. Placental glucose transport in heat-induced fetal growth retardation. Am J Physiol Regul Integr Comp Physiol 263: R578–R585, 1992. doi: 10.1152/ajpregu.1992.263.3.R578. [DOI] [PubMed] [Google Scholar]
- 34. Stenhouse C, Halloran KM, Tanner AR, Suva LJ, Rozance PJ, Anthony RV, Bazer FW. Uptake of phosphate, calcium, and vitamin D by the pregnant uterus of sheep in late gestation: regulation by chorionic somatomammotropin hormone. Int J Mol Sci 23: 7795, 2022. doi: 10.3390/ijms23147795. [DOI] [PMC free article] [PubMed] [Google Scholar]
- 35. Handwerger S. Clinical counterpoint: the physiology of placental lactogen in human pregnancy. Endocr Rev 12: 329–336, 1991. doi: 10.1210/edrv-12-4-329. [DOI] [PubMed] [Google Scholar]
- 36. Hurley TW, D'Ercole AJ, Handwerger S, Underwood LE, Furlanetto RW, Fellows RE. Ovine placental lactogen induces somatomedin: a possible role in fetal growth. Endocrinology 101: 1635–1638, 1977. doi: 10.1210/endo-101-5-1635. [DOI] [PubMed] [Google Scholar]
- 37. Daughaday WH, Kapadia M. Maintenance of serum somatomedin activity in hypophysectomized pregnant rats. Endocrinology 102: 1317–1320, 1978. doi: 10.1210/endo-102-4-1317. [DOI] [PubMed] [Google Scholar]
- 38. Brelje TC, Scharp DW, Lacy PE, Ogren L, Talamantes F, Robertson M, Friesen HG, Sorenson RL. Effect of homologous placental lactogens, prolactins, and growth hormones on islet B-cell division and insulin secretion in rat, mouse, and human islets: implication for placental lactogen regulation of islet function during pregnancy. Endocrinology 132: 879–887, 1993. doi: 10.1210/endo.132.2.8425500. [DOI] [PubMed] [Google Scholar]
- 39. Sorenson RL, Brelje TC. Adaptation of islets of Langerhans to pregnancy: beta-cell growth, enhanced insulin secretion and the role of lactogenic hormones. Horm Metab Res 29: 301–307, 1997. doi: 10.1055/s-2007-979040. [DOI] [PubMed] [Google Scholar]
- 40. Vasavada RC, Garcia-Ocaña A, Zawalich WS, Sorenson RL, Dann P, Syed M, Ogren L, Talamantes F, Stewart AF. Targeted expression of placental lactogen in the beta cells of transgenic mice results in beta cell proliferation, islet mass augmentation, and hypoglycemia. J Biol Chem 275: 15399–15406, 2000. doi: 10.1074/jbc.275.20.15399. [DOI] [PubMed] [Google Scholar]
- 41. Dolensek J, Rupnik MS, Stozer A. Structural similarities and differences between the human and the mouse pancreas. Islets 7: e1024405, 2015. doi: 10.1080/19382014.2015.1024405. [DOI] [PMC free article] [PubMed] [Google Scholar]
- 42. Wang P, Fiaschi-Taesch NM, Vasavada RC, Scott DK, Garcia-Ocana A, Stewart AF. Diabetes mellitus – advances and challenges in human β-cell proliferation. Nat Rev Endocrinol 11: 201–212, 2015. doi: 10.1038/nrendo.2015.9. [DOI] [PubMed] [Google Scholar]
- 43. Baeyens L, Hindi S, Sorenson RL, German MS. β-cell adaptation in pregnancy. Diabetes Obes Metab 18 Suppl 1: 63–70, 2016. doi: 10.1111/dom.12716. [DOI] [PMC free article] [PubMed] [Google Scholar]
- 44. Lynch CS, Kennedy VC, Tanner AR, Ali A, Winger QA, Rozance PJ, Anthony RV. Impact of placental SLC2A3 deficiency during the first-half of gestation. Int J Mol Sci 23: 12530, 2022. doi: 10.3390/ijms232012530. [DOI] [PMC free article] [PubMed] [Google Scholar]
- 45. Ali A, Swanepoel CM, Winger QA, Rozance PJ, Anthony RV. Chorionic somatomammotropin RNA interference alters fetal liver glucose utilization. J Endocrinol 247: 251–262, 2020. doi: 10.1530/JOE-20-0375. [DOI] [PMC free article] [PubMed] [Google Scholar]
Associated Data
This section collects any data citations, data availability statements, or supplementary materials included in this article.
Supplementary Materials
Supplemental Fig. S1 and Supplemental Tables S1–S8: https://doi.org/10.6084/m9.figshare.24247099.
Data Availability Statement
Source data for this study are openly available at https://doi.org/10.6084/m9.figshare.24246709.