Abstract
Breast cancer (BC) is a malignant neoplasm which is classified into various types defined by underlying molecular factors such as estrogen receptor positive (ER+), progesterone receptor positive (PR+), human epidermal growth factor positive (HER2+) and triple negative (TNBC). Early detection of ER+ and TNBC is crucial in the choice of diagnosis and appropriate treatment strategy. Here we report the key genes associated to ER+ and TNBC using RNA-Seq analysis and machine learning models. Three ER+ and TNBC RNA seq datasets comprising 164 patients in-toto were selected for standard NGS hierarchical data processing and data analyses protocols. Enrichment pathway analysis and network analysis was done and finally top hub genes were identified. To come with a reliable classifier which could distinguish the distinct transcriptome patterns associated to ER+ and TNBC, ML models were built employing Naïve Bayes, SVM and kNN. 1730 common DEG’s exhibiting significant logFC values with 0.05 p-value threshold were identified. A list of top ten hub genes were screened on the basis of maximal clique centrality (MCC) which included CDC20, CDK1, BUB1, AURKA, CDCA8, RRM2, TTK, CENPF, CEP55 and NDC80.These genes were found to be involved in crucial cell cycle pathways. k-Nearest Neighbor (kNN) model was observed to be best classifier with accuracy 84%, specificity 66% and sensitivity 95% to differentiate between ER+ and TNBC RNA-Seq transcriptomes. Our screened list of 10 hub genes can thus help unearth novel molecular signatures implicated in ER+ and TNBC onset, prognosis and design of novel protocols for breast cancer diagnostics and therapeutics.
Keywords: Breast cancer, TN, ER+ , Machine learning, Differentially expressed genes, Hub genes
Subject terms: Cancer, Computational biology and bioinformatics, Oncology
Introduction
Breast cancer (BC) is a multifactorial heterogenous disease which is characterized by uncontrolled cell proliferation1,2. BC is the most prevalent cancer type which primarily affects women contributing a huge health burden on public and individual spendings. Breast cancer accounts for nearly 38.9% of all human cancer types. A GLOBOCAN survey for 2022 found that 11.6% of new cases of BC occurred in females, and the death rate was almost 6.9%3. The prevalence of breast cancer in Asia is about 40%4, and Pakistan reported about 1.38 million cases of breast cancer in 20155. Multiple genetical, hormonal and environmental factors are involved in causing breast cancer. Breast cancer affects mostly the females, originating from germ line mutations. Key genes found to be involved in breast cancer include BRCA1/BRCA26, TP537, PTEN8, STK119, CDH110,11.
Complex and diverse BC subtypes make it difficult to study the underlying pathways and risk factors responsible for the onset of the disease. This necessitates a comprehensive understanding of the various pathways responsible for onset and proliferation of the disease; it also implicates that the genes involved in these pathways could be used for prevention, early detection, and personalized treatment approaches.
Aberrations in the expression of Estrogen Receptor (ER), Progesterone Receptor (PR) and Human epidermal growth factor receptor 2 (HER2) have been often associated to three distinct subtypes of breast cancer which are observed both clinically and in molecular expression of hormonal imbalance. ER+ breast cancer is of considerable significance for several impacting factors associated to its diagnosis, prognosis, and treatment. ER+ breast cancer has been found to typically respond well to endocrine therapy in about 70% of cases12.
On the other hand triple negative breast cancer (TNBC) is another type of BC whose molecular characteristics vary from the aforementioned BC types, exhibiting no significant variation in behavior of estrogen receptor (ER), progesterone receptor (PR), and human epidermal growth factor receptor (HER-2)13,14. Approximately, 15–20% of all BCs diagnosed lies in the category of TNBC tumors15. Compared with other types of tumors, TNBC tumors have an aggressive appearance, a poor prognosis, and high recurrence rates16–23. Therefore, accurate identification of differentially expressed genes (DEG) networks is needed for comprehensive understanding and distinct characterization of various breast cancer types.
This study is aimed at identifying the potential hub genes that contribute to both ER+ and TNBC development and progression. In order to determine the molecular basis of biological differences, integrated bioinformatics analyses were performed including classification of the BC types based on machine learning models. DEG analyses were performed to delineate the transcriptomic profiles associated uniquely to ER+ and TNBC types on the basis of LogFC and P values; in the end hub gene were identified for both the types of BC which might serve as biomarkers for the disease. Our findings will contribute to better understanding of distinct phenotypes associated to ER+ and TNBC oncogenesis, and the development of novel diagnostic and therapeutic alternatives against the disease.
Materials and methods
RNA Seq datasets of ER+ and TNBC patients were retrieved from ArrayExpress. The datasets were quality checked, aligned; the duplicate reads were removed, and differentially expressed genes were identified on GALAXY suit24. DAVID and Cytoscape were employed to analyze pathways and networks associated with the disease and to determine which genes are involved in the pathogenesis of breast cancer25,26. Machine learning classifiers including Support Vector Machine, Naïve Bayes and k-Nearest Neighbor were employed for generating a classification model to distinguish both the BC subtypes.
Dataset description
ER+ and TNBC RNA Seq datasets were obtained from ArrayExpress27 repository which is a curated database for high-throughput sequenced data. The datasets used in the study are E-GEOD-58135, E-MTAB-4993 and E-GEOD-45419 and the description of dataset is provided in (Table 1). ArrayExpress is linked to European Nucleotide Archive (ENA), a nucleotide database that provides nucleotide sequencing data, sequence assembly information, and functional annotations. The datasets were uploaded on Galaxy server (https://usegalaxy.eu/) for processing via ENA28. An overview of the layout of various processes employed in the study is presented in (Fig. 1).
Table 1.
Datasets description.
| No | Datasets | ArrayExpress accession no | ENA accession no | ER+ samples | TN samples |
|---|---|---|---|---|---|
| 1 | Breast cancer RNA seq | E-GEOD-58135 | ENA-SRP042620 | 45 | 42 |
| 2 | Whole transcriptome profiling of 63 breast cancer tumors | E-MTAB-4993 | ENA-ERP016798 | 51 | 12 |
| 3 | An integrated model of the transcriptome landscape of HER-2 positive breast cancer | E-GEOD-45419 | ENA-SRP019936 | 8 | 8 |
Figure 1.

Data processing and analysis workflow.
Data pre-processing
Data preprocessing was done by using FASTQC and FASTQ Groomer on the samples. HISAT2 was used for dataset alignment because of its high efficiency. “MarkDuplicates” was used to compare sequences and reads in the SAM file by measuring 5` positions of the reads or sequences or paired reads. Afterwards, “RmDup” was used to remove the duplicate reads. An RNA-expression analysis of datasets was conducted by “featureCounts”, which counts both DNA and RNA expression.
Identification of differential expressed genes
A quality-controlled normalized data set was used for supervised analysis comparing gene expression levels between ER+ and TNBC samples using DESeq2. Genes with p value < 0.05 and fold change < −1 and > 1 were statistically considered significant.
Machine learning
Expression file data was used to build mathematical models employing supervised machine learning classifiers. Three different supervised ML classifiers including SVM29, Naïve bayes30 and kNN30 were used to predict the accuracy, sensitivity and specificity of the model.
Functional enrichment analysis
Database for Annotation, Visualization and Integrated Discovery (DAVID) (https://david.ncifcrf.gov/) was used for the functional annotation of GO terms and the analysis of KEGG pathway enrichment. DAVID is a widely used resource for evaluating the functional significance of quantitative gene expression profiles25. The analysis of molecular or biological function GO terms and enrichment of pathways analysis was performed for candidate DEGs with a p-value cutoff of < 0.05 were considered significant. An online tool called REVIGO (Available online: http://revigo.irb.hr/) was utilized to summarize and visualize long lists of GO terms31. The GO terms were clustered and represented in a scatter plot using a semantic similarity measure.
Network analysis
To evaluate the interactive relationships among DEGs, STRING (Available online: https://string-db.org/) was utilized to construct a network of PPI (protein-protein interactions)32,33. The cutoff standard was set to a confident interaction score of > 0.4 to eliminate PPI interactions that are inconsistent. Thus, a PPI network with a strong degree of confidence was obtained. The STRING tool results were then combined with Cytoscape software34 to visualize PPI interactions of statistically significant DEGs35. Cytohubba was used to constructs a sub-network of hub genes based on maximal clique centrality (MCC) algorithm in such a way that molecular species are represented as nodes and their intermolecular interactions are known as links or edges between those nodes36. Thickness of lines between nodes and edges represents the affinity of interaction. Thicker the line stronger will be the interaction and vice versa.
Expression of hub genes
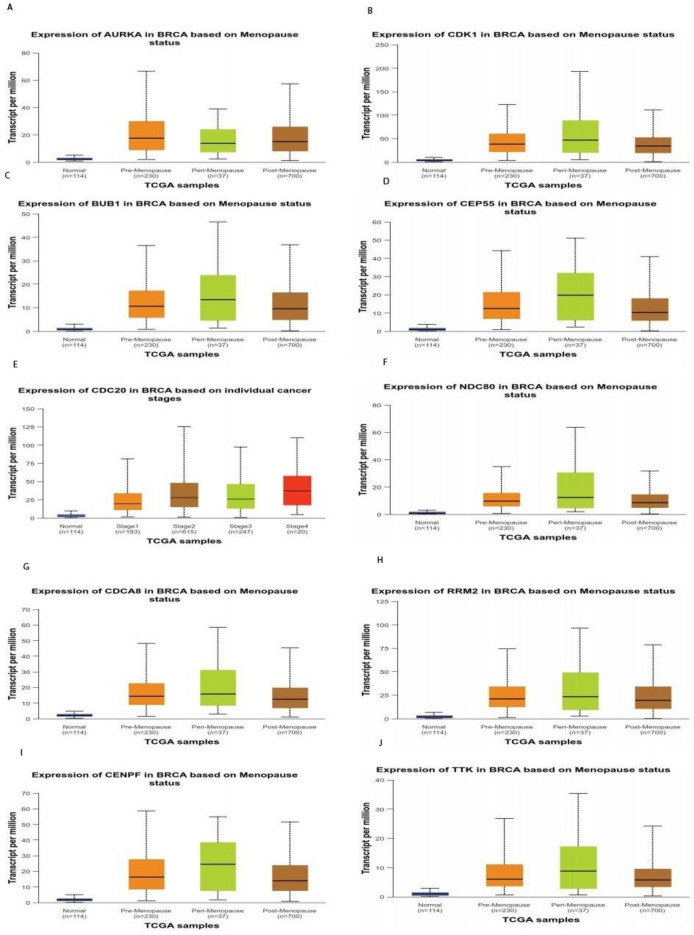
Using cancer data analysis portal (UALCAN, (https://ualcan.path.uab.edu/analysis.html) a web-based tool for analyzing hub gene expression, and clinical data from The Cancer Genome Atlas (TCGA), a box and whisker plot was generated showing gene expression levels in different cancers and their subtypes at various levels of sub-stages37. CDK1,CDC20,CDCA8,RRM2,NDC80,CEP55,CENPF,BUB1,TTK and AURKA were significantly overexpressed in breast cancer tissues based on menopause status than in normal tissues38.
Ethics approval and consent to participate
We further confirm that any aspect of the work covered in this manuscript has not involved human patients and thus requires no ethical approval of any relevant body.
Results
Result of differential expression
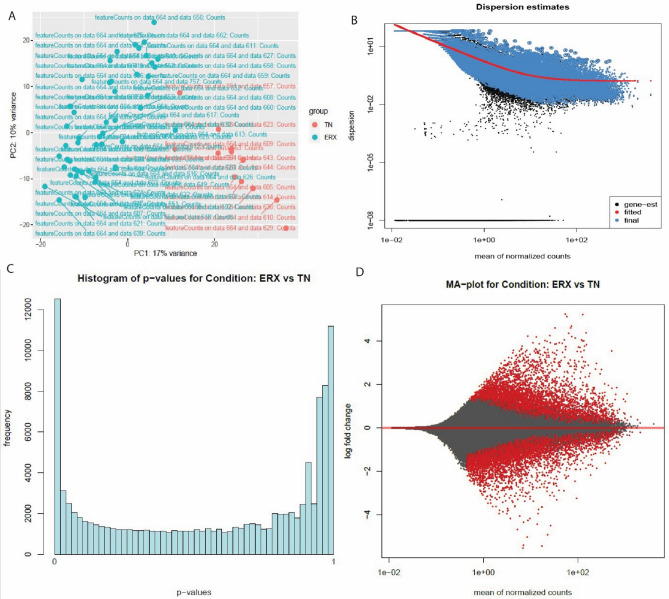
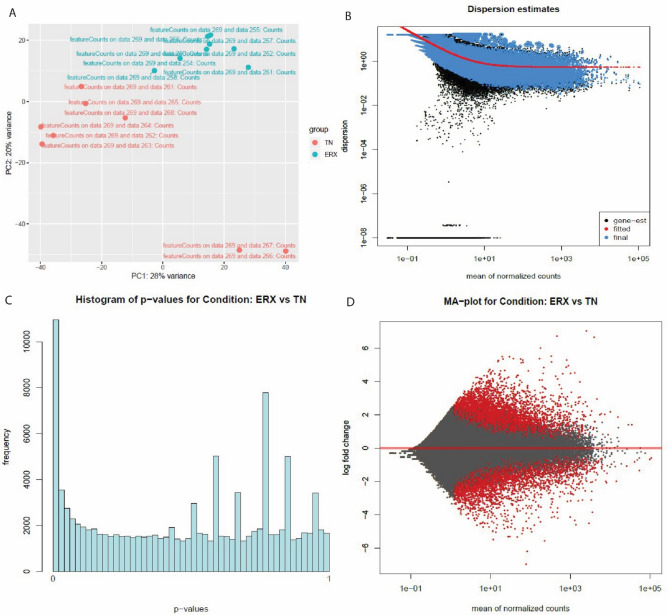
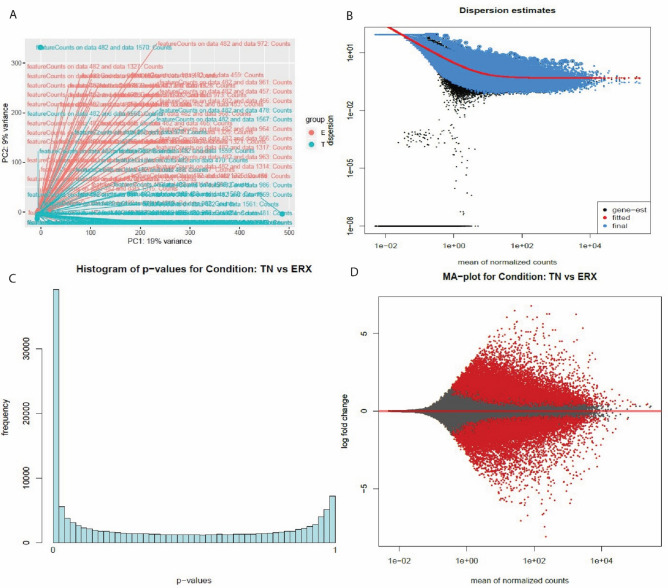
The raw read data was aligned against Hg38Chr using HISAT2; the duplicates were identified and removed using MarkDuplicates and RmDup, respectively. R package DESeq2 was employed to figure out the differentially expressed genes from feature count files of SAM format. DESeq2 generated histogram, MA and PC plot for each dataset shown in (Figs. 2–4). The common DEG’s among three RNA Seq datasets were obtained by Venny tool (https://bioinfogp.cnb.csic.es/tools/venny/)39, 1730 overlapping genes were identified among three datasets as shown in (Fig. 5).
Figure 3.
The PC plot (A) Dispersion estimates (B) histogram (C) and MA plot (D) were created by DESeq2 tool of E-MTAB-4993 dataset. (A) PC plot shows two phenotypes: ER+ and TN. They are grouped on the basis of expression. (B) Dispersion estimates quantify the level of variability in gene expression across samples. Blue dots represent low dispersion estimates of genes and it shows the gene expression is relatively stable while the black dots represent high dispersion estimates. The red line shows the mean or median dispersion estimates. The blue dot close to red line indicated stable expression and the black dots close to red line suggests that the expression values are more variable.(C) Histogram shows the DEG’s grouped into bins or the frequency of genes. (D)MA plot the differences between measurements based on ER+ and TN by transforming the data by using log ratio and mean average. The red color shows the dispersion of differentially expressed genes while grey color shows no variation.
Figure 2.
The PC plot (A), Dispersion estimates (B), histogram (C) and MA plot (D) were created by DESeq2 tool of E-GEOD-45419 dataset. (A) PC plot shows two phenotypes: ER+ and TN. They are grouped on the basis of expression. (B) Dispersion estimates quantify the level of variability in gene expression across samples. Blue dots represent low dispersion estimates of genes and it shows the gene expression is relatively stable while the black dots represent high dispersion estimates. The red line shows the mean or median dispersion estimates. The blue dot close to red line indicated stable expression and the black dots close to red line suggests that the expression values are more variable. (C) Histogram shows the DEG’s grouped into bins or the frequency of genes. (D) MA plot the differences between measurements based on ER+ and TN by transforming the data by using log ratio and mean average. The red color shows the dispersion of differentially expressed genes while grey color shows no variation.
Figure 4.
The PC plot (A) Dispersion estimates (B) histogram (C) and MA plot (D) were created by DESeq2 tool of E-MTAB-58135 dataset. (A) PC plot shows two phenotypes: ER+ and TN. They are grouped on the basis of expression. (B) Dispersion estimates quantify the level of variability in gene expression across samples. Blue dots represent low dispersion estimates of genes and it shows the gene expression is relatively stable while the black dots represent high dispersion estimates. The red line shows the mean or median dispersion estimates. The blue dot close to red line indicated stable expression and the black dots close to red line suggests that the expression values are more variable. (C) Histogram shows the DEG’s grouped into bins or the frequency of genes. (D) MA plot the differences between measurements based on ER+ and TN by transforming the data by using log ratio and mean average. The red color shows the dispersion of differentially expressed genes while grey color shows no variation.
Figure 5.
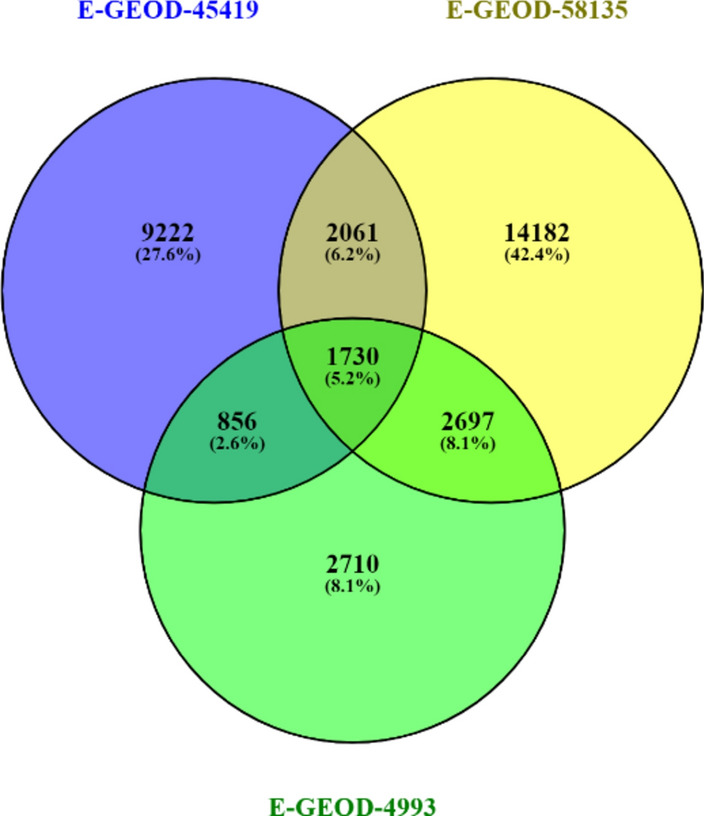
The Venn diagram shows that 1730 common DEG’s were found in the datasets.
Classification outcomes
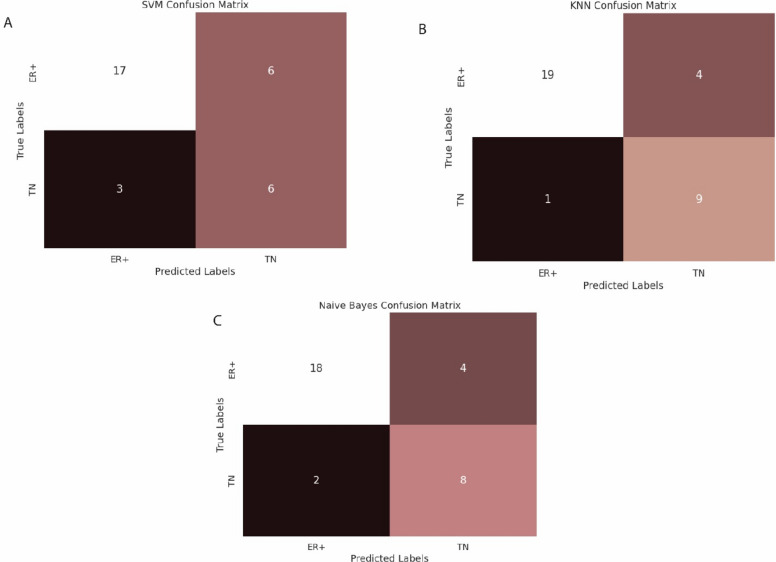
Classification models were built to differentiate BC samples based on DEG’s identified byDESeq2 tool. The classification algorithms including SVM, Naïve Bayes and kNN were employed on the training dataset of 134 samples and test dataset comprising of 32 samples. The train and test datasets were used as input data for the classifier. The accuracy level rose up to 84% in the validation stage of the kNN algorithm whereas the accuracy achieved in SVM was the lowest as 71% while the accuracy of Naïve Bayes was observed to be 81%. All the samples were successfully classified by the models, the results are shown in (Fig. 6) and (Table 2) respectively.
Figure 6.
Results of SVM (A), Naïve Bayes (B) and kNN (C) respectively.
Table 2.
Classifier’s results.
| Classifier | Sensitivity | Specificity | Accuracy | Accuracy Percentage (%) |
|---|---|---|---|---|
| SVM | 0.666 | 0.85 | 0.71875 | 72 |
| kNN | 0.95 | 0.6666 | 0.84375 | 84 |
| Naive byes | 0.667 | 0.9 | 0.8125 | 81 |
Pathway analysis
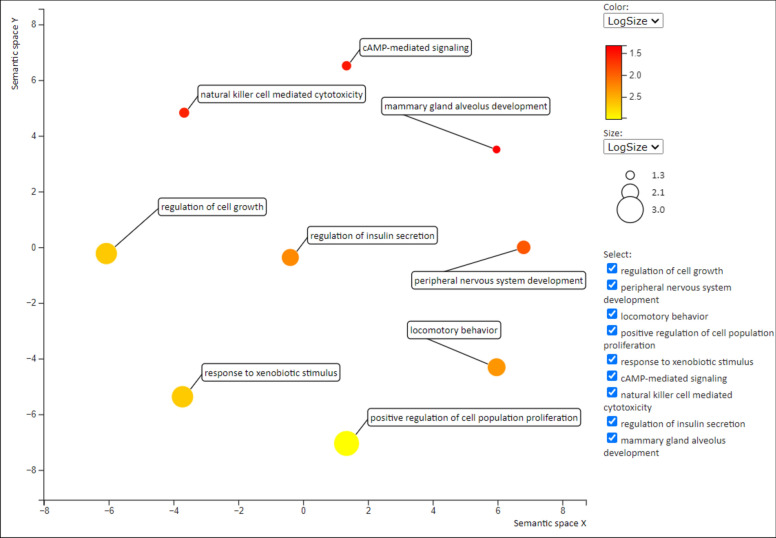
Gene enrichment analysis and KEGG pathways of 1730 common DEG’s were identified by using DAVID tool. The biological processes (BP), molecular functions (MF) and cell components (CC) were obtained which are shown in (Tables 3–5) respectively. Genes were involved in different biological pathways including mammary gland alveolus development (GO:0060749), response to drug (GO:0042493), natural killer cell mediated cytotoxicity (GO:0042267), regulation of insulin secretion (GO:0050796), peripheral nervous system development (GO:0007422), cAMP-mediated signaling (GO:0019933), and regulation of cell growth (GO:0001558), as detailed in (Table 3). The GO molecular function analysis revealed the involvement of DEGs in phosphatidylinositol phospholipase C activity (GO:0004435), mRNA 5’ UTR binding (GO:0048027), and calcium ion binding (GO:0005509), Table 4. In addition, CC group genes were mainly enriched in the extracellular space (GO:0005615), basolateral plasma membrane (GO:0016323), and extracellular region (GO:0005576), (Table 5). Furthermore, we classified DEGs associated with different biological pathways according to the KEGG reference database using the DAVID method (P < 0.05; FDR < 0.05). The KEGG pathway analysis showed the association of DEG’s in cell cycle, Insulin secretion, pathways in cancer and prostate cancer. The results are exhibited in (Table 6). REVIGO was used to visualize gene ontology in form of scatter plot. The scatter plot depicts semantic similarity between GO terms on x-axis, whereas the y-axis indicates p-value or significance, the plot is shown in (Fig. 7). The x-axis shows that terms that are functionally closely related. A lower p-value indicates a greater significance for terms positioned higher on the y-axis. GO hierarchies can be represented by different colors in the scatter plot.
Table 3.
Biological processes in which genes are involved.
| Category | Term | Description | Count | P-value |
|---|---|---|---|---|
| BP | GO:0060749 | Mammary gland alveolus development | 6 | 5.90E-04 |
| BP | GO:0042493 | Response to drug | 27 | 7.21E-04 |
| BP | GO:0042267 | Natural killer cell mediated cytotoxicity | 6 | 7.88E-04 |
| BP | GO:0050796 | Regulation of insulin secretion | 10 | 0.002232 |
| BP | GO:0007422 | Peripheral nervous system development | 6 | 0.003154 |
| BP | GO:0007626 | Locomotory behavior | 11 | 0.003233 |
| BP | GO:0008284 | Positive regulation of cell proliferation | 34 | 0.003703 |
| BP | GO:0019933 | cAMP-mediated signaling | 7 | 0.005342 |
| BP | GO:0001558 | Regulation of cell growth | 10 | 0.007388 |
Table 5.
Cellular Components in which genes are involved.
| Category | Term | Description | Count | P-value |
|---|---|---|---|---|
| CC | GO:0005615 | Extracellular space | 96 | 8.27E-07 |
| CC | GO:0016323 | Basolateral plasma membrane | 19 | 7.34E-04 |
| CC | GO:0005576 | Extracellular region | 91 | 0.005143 |
| CC | GO:0005581 | Collagen trimer | 11 | 0.005922 |
| CC | GO:0005578 | Proteinaceous extracellular matrix | 21 | 0.011515 |
| CC | GO:0019897 | Extrinsic component of plasma membrane | 5 | 0.020575 |
Table 4.
Molecular Functions in which genes are involved.
| Category | Term | Description | Count | P-value |
|---|---|---|---|---|
| MF | GO:0004435 | Phosphatidylinositol phospholipase C activity | 6 | 0.005084 |
| MF | GO:0046703 | Natural killer cell lectin-like receptor binding | 4 | 0.005309 |
| MF | GO:0048027 | mRNA 5'-UTR binding | 4 | 0.005309 |
| MF | GO:0001158 | Enhancer sequence-specific DNA binding | 5 | 0.009123 |
| MF | GO:0005509 | Calcium ion binding | 45 | 0.009493 |
| MF | GO:0015254 | Glycerol channel activity | 4 | 0.012641 |
| MF | GO:0043565 | Sequence-specific DNA binding | 34 | 0.013999 |
| MF | GO:0008236 | Serine-type peptidase activity | 8 | 0.017159 |
| MF | GO:0008134 | Transcription factor binding | 21 | 0.019617 |
Table 6.
KEGG Pathways of DEGs.
| Category | Term | Description | Count | P-value |
|---|---|---|---|---|
| KEGG pathway | hsa04110 | Cell cycle | 18 | 8.72E-06 |
| KEGG pathway | hsa04911 | Insulin secretion | 13 | 1.40E-04 |
| KEGG pathway | hsa05200 | Pathways in cancer | 32 | 2.37E-04 |
| KEGG pathway | hsa04925 | Aldosterone synthesis and secretion | 12 | 3.76E-04 |
| KEGG pathway | hsa04024 | cAMP signaling pathway | 20 | 3.81E-04 |
| KEGG pathway | hsa05214 | Glioma | 10 | 0.001105 |
| KEGG pathway | hsa04114 | Oocyte meiosis | 13 | 0.001653 |
| KEGG pathway | hsa04916 | Melanogenesis | 12 | 0.002226 |
| KEGG pathway | hsa04915 | Estrogen signaling pathway | 11 | 0.006429 |
| KEGG pathway | hsa04923 | Regulation of lipolysis in adipocytes | 8 | 0.006937 |
| KEGG pathway | hsa05215 | Prostate cancer | 10 | 0.008809 |
| KEGG pathway | hsa04020 | Calcium signaling pathway | 15 | 0.013324 |
| KEGG pathway | hsa04115 | p53 signaling pathway | 8 | 0.017886 |
Figure 7.
The Scatterplot represents the cluster representatives (i.e. terms remaining after the redundancy reduction) in a two-dimensional space derived by applying multidimensional scaling to a matrix of the GO term semantic similarities.
Network analysis
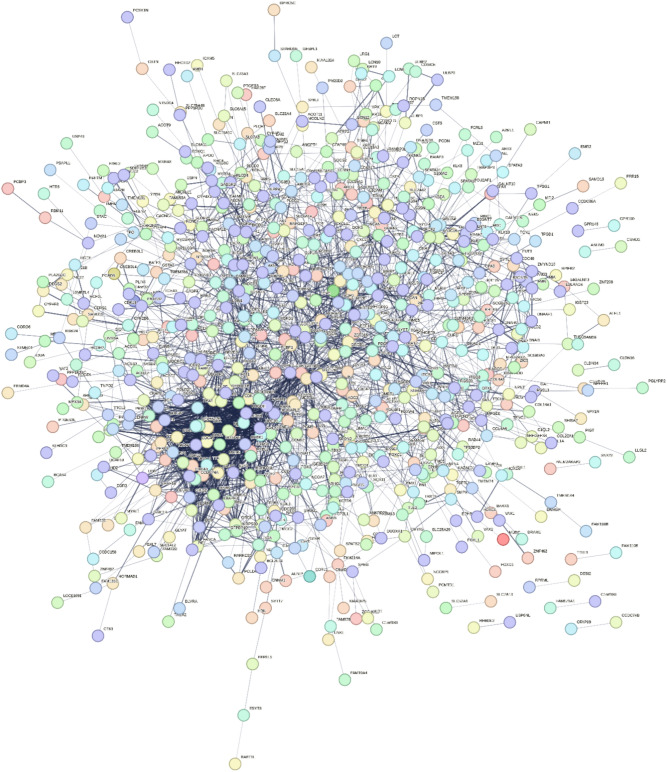
In network analysis, the gene interacting network was constructed by STRING and was visualized by Cystoscape. Network was constructed for 1730 differentially expressed genes which consisted of 1505 nodes and 9714 edges, (Fig. 8); the interaction between the two nodes determined the co-relation. In Cytohubba, the MCC algorithm measures the centrality of nodes by analyzing their involvement in large cliques. A network structure and connectivity can be determined by identifying hub genes. The top 10 Hub genes identified were: CDC20, CDK1, BUB1, AURKA, CDCA8, RRM2, TTK, CENPF, CEP55 and NDC80, the network involving the aforementioned genes is shown in(Fig. 9).
Figure 8.
Network of differentially expressed genes by String. The thick lines indicate significant association, functional similarity or co-regulation between the genes while thin lines represent low level interactions. Genes associated with thin lines still exhibit level of association but the significance is relatively low.
Figure 9.
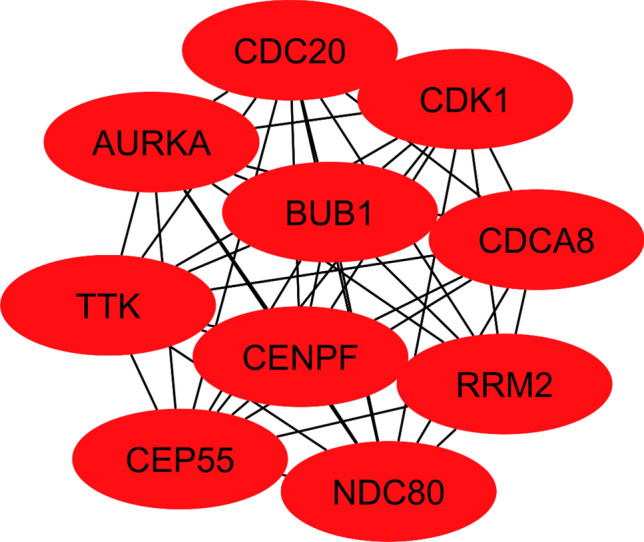
Top 10 hub genes are identified based on MCC algorithm.
Hub genes expression analysis
Transcriptional and translational expression levels of all hub genes were significantly higher (P = 0.05) in cancerous tissues compared with normal tissues. Furthermore, based on patient menopause status, hub gene expression levels were significantly higher in breast cancer samples than in normal samples in patients at different cancer stages as shown by box and whisker plots at (Fig. 10).
Figure 10.
Box and whisker plot exhibiting expression profiles of ten hub-genes at various menopausal stages shows statistically significant differences among premenopausal, perimenopausal and postmenopausal patients compared to normal controls based on data from The cancer genome atlas (TCGA) database.
Discussion
In this study three RNA-Seq datasets comprising of ER+ and TNBC samples were studied, having been-processed, aligned, screened and filtered for duplicates, and finally processed for calculation of expression counts; thus 1730 overlapping DEG’s were identified which served as the training and test dataset for classification models to identify transcriptomic patterns which may help differentiate between ER+ and TNBC. The DEG’s of ER+ and TN samples were filtered on the basis of logFC and p-values. Pathway and network analysis of the selected DEG’s was performed at DAVID25 and Cytoscape26. Classification models were built based on three different algorithms to successfully differentiate between ER+ and TNBC types. The accuracy, sensitivity and specificity of the classifiers were estimated. Highest accuracy was exhibited by kNN classifier that is 84% as compared to other two classifiers SVM and Naïve Bayes whose accuracy was 72 and 81% respectively. Thus, kNN was found to be a best classifier between ER+ and TNBC types.
The DEG’s were identified across three RNA-Seq datasets, and three classification models, Support Vector Machine (SVM), Naïve Bayes, and k-Nearest Neighbors (kNN), were built to distinguish between ER+ and TNBC samples which is clinically extremely important for diagnosis and the choice of therapeutic alternatives. Often a miss diagnosis of TNBC i.e. false negative TNBC cases, which are mistakenly diagnosed as ER+ , lead to a lot of clinical complications and vice versa We therefore improvised ml classifiers training upon aforementioned DEG data to come up with a protocol which could help improving the current methodology for BC. To evaluate the effectiveness of each model in correctly discriminating between ER+ and TNBC cases and minimizing false positives, performance metrics such as accuracy, sensitivity and specificity were used. This comprehensive analysis not only elucidates the key molecular signatures which could serve to discriminate ER+ from TNBC but also underscores the utility of machine learning methodologies in enhancing the accuracy of BC diagnosis.
Results of GO analyses including CC, MF, BP showed that these overlapping DEG’s were primarily enriched in extracellular space and are associated with cell cycle, positive regulation of cell proliferation, cAMP-mediated signaling, transcription factor binding, sequence-specific DNA binding, calcium ion binding. In addition, the KEGG pathway enrichment analysis indicated that these overlapping DEGs were significantly enriched in pathways in cancer, cAMP signaling pathway, cell cycle, oocyte meiosis, estrogen signaling pathway, p53 signaling pathway and calcium signaling pathway. These enriched gene function and KEGG pathways provide insights regarding the molecular mechanism of ER+ and TNBC progression. Our analyses led to the inference that CDC20, CDK1, BUB1, AURKA, CDCA8, RRM2, TTK, CENPF, CEP55, and NDC80 serve as hub genes in the progression of ER+ and TN and also a predictor for the worst survival rates of BC patients. As illustrated in TCGA analysis, the breast cancer samples in multiple clinicopathological subgroups, the ten hub genes were consistently overexpressed (p0.05) in patients.
Previous studies have revealed that CDK1, BUB1, AURKA, CDCA8, RRM2, TTK, CENPF, CEP55 and NDC80 are implicated in cell cycle and associated with tumorigenesis. The CDK1, also known as CDC2, is involved in the precise division of cells40. In the TNBC clinical subtype of breast cancer, inhibiting CDK1 expression can suppress tumor cell growth and induce apoptosis41. In addition, BUB1 is one of the key mitotic checkpoint genes whose expression level is closely correlated with the proliferation of carcinoma cells42–44. RRM2, a breast cancer hub gene has been found to be closely associated with tumor growth, invasion, angiogenesis, tumor metastasis, as well as the prognosis of patients with breast cancer45,46. Furthermore, protein kinase TTK is capable of phosphorylating both serine and threonine simultaneously. The TTK plays a crucial role in cell division and is highly expressed in a wide variety of malignant tumors47.
Approximately 73% of patients with breast cancer overexpress Aurora kinase A (AURKA), a kinase essential to cell division and particularly the process of chromosome segregation during mitosis48,49. AURKA plays an important role in spindle assembly, centrosome maturation, and chromosome alignment49. Breast cancer development is negatively affected by the overexpression of AURKA. Similarly, CDCA8, also known as cell division cycle associated 8, is a part of the chromosomal passenger complex. It plays a crucial role in mitosis by regulating chromosome alignment and segregation at the centromeres50. Centromere protein F (CENPF) has previously been reported to be a marker of cell proliferation in several human malignancies, including breast cancer51,52. The centrosome protein 55 (CEP55) is an important microtubule-binding protein that is located in the centrosome of interphase cells and in the midbody of metaphase cells. It has been observed that CEP55 is overexpressed in several cancer types, such as colon, lung, and breast cancer53. It has been shown that NDC80, CDK1, and CCNB1 play key roles in breast cancer pathophysiology, such as regulating the growth and invasion of the cancer54. In accordance with our research, these hub genes might serve as potential biomarkers for the early-stage diagnosis and prognosis of ER+ and TNBC breast cancer. Thus, aberrations in their expression level (logFC) can be associated to the onset of breast cancer. As a consequence of this inference, we also pursued to develop ML models which could successfully distinguish the RNA Seq profile of an ER+ or TNBC affected individual from the normal healthy individuals, as our datasets include the patients both in the early-stage metastasis stage of the BC. Seven of the ten hub genes identified in the study, CDK1, CDC20, CEP55, CENPF, BUB1, TTK and AURKA have been associated with ER+ immune signature in various studies but they have not been research for their association in TNBC as of now. This study comes up with another three hub genes CDCA80, RRM2 and NDC80 which may help to potentially re-refine the unique immune signature for ER+ and TNBC. Putatively the ten hub genes identified here may also help revise the immune signatures for TNBC and also to distinguish it from rest of BC types.
Of course, these genes have been reported earlier on the basis of various gene association studies to be immune signatures of TNBC. But this study is first of its kind which clearly illustrates that association on the basis of experimental evidence as exhibited by transcriptomic datasets. The analysis also hypothesizes that the key features in variation in expression of these hub genes may also be associated to the BC.
RNA seq analyses of three datasets comprising of 134 samples, also illustrates that these genes may serve as biomarkers or immune signatures distinctly for ER+ and TNBC types. Therefore, we not only report the transcriptomic attributes associated to TNBC etiology but also a set of genes which are also associated to the other uncontrolled BC type such as ER+ . Our models along with identified hub genes provide for key features exclusively associated with both of the BC types.
Globally, breast cancer is one of the most prevalent cancers affecting women. In advanced stages of breast cancer, the disease can spread to the entire body through blood vessels and lymphatics, resulting in death directly caused by the disease. In spite of the promising results of advanced therapies for controlling breast cancer prior to metastasis, the treatment of advanced stage breast cancer remains a challenge. The therapies for preventing breast cancer recurrence and metastasis are also scarce. Hence, finding biomarkers which could help improving the diagnosis strategies, monitoring the metastasis of breast cancer, and understanding its peculiar mechanisms is of utmost importance.
Conclusion
The current study, involving three extensive datasets containing 134 ER+ and TNBC transcriptomes, led to the identification of 1730 differentially expressed genes uniquely associated to ER+ and TNBC individuals. The hub genes can serve as biomarkers for the diagnosis and/or prognosis of ER+ and TNBC patients. Pathway enrichment analysis and network analysis revealed the key signaling pathways implicated by these genes. Classification models based on SVM, Naïve Bayes and kNN were built on datasets. These models were ranked on the basis of accuracy, specificity and sensitivity. kNN was ranked as best classifier with sensitivity of 95%, accuracy of 84%, and specificity of 66%,. We successfully demonstrated that transcriptome analysis integrated with ML classifiers can be used to improve diagnosis of ER+ and TNBC patients.
Author contributions
All authors contributed to the study conception and design. Material preparation, data collection and analysis were performed by Alishbah Saddiqa and Mahrukh Zakir. The formal analysis was done by Mawara Sheikh and Arsalan Hassan. Iqra Ali, Zahid Muneer and Ihtisham Ul Haq assisted in writeup manuscript submission and formal analysis. Azmat Ali Khan and Abdul Malik assisted in writing—review & editing whereas Abdul Rauf Siddiqi has done conceptualization and supervision of the study. All authors read and approved the final manuscript. We, the undersigned authors of the manuscript titled “On Discovery of Novel Hub Genes for ER+ and TN Breast Cancer Types through RNA Seq Data Analyses and Classification Models”, hereby confirm that we have all read and approved the final version of the manuscript for publication in Cancer Causes and Control Journal.
Funding
This work was funded by the Researchers Supporting Project Number (RSP2024R376) at King Saud University, Riyadh 11451, Saudia Arabia. We would like to appreciate King Saud University, Saudi Arabia, for funding this work through the research.
Data availability
Datasets are available on ArrayExpress database with following Accession numbers. Accession No: E-GEOD-58135, E-MTAB-4993 and E-GEOD-45419.
Competing interests
The authors declare no competing interests.
Footnotes
The original online version of this Article was revised: In the original version of this Article Azmat Ali Khan was incorrectly affiliated with ‘Department of Pharmaceutics, College of Pharmacy, King Saud University, 11451, Riyadh, Saudi Arabia’. The correct affiliation is listed here: Pharmaceutical Biotechnology Laboratory, Department of Pharmaceutical Chemistry, College of Pharmacy, King Saud University, 11451, Riyadh, Saudi Arabia.
Publisher's note
Springer Nature remains neutral with regard to jurisdictional claims in published maps and institutional affiliations.
Change history
10/14/2024
A Correction to this paper has been published: 10.1038/s41598-024-74562-7
Contributor Information
Abdul Malik, Email: amoinuddin@ksu.edu.sa.
Abdul Rauf Siddiqi, Email: araufsiddiqi@comsats.edu.pk.
References
- 1.Downie, F. P., Mar Fan, H. G., Houédé-Tchen, N., Yi, Q. & Tannock, I. F. Cognitive function, fatigue, and menopausal symptoms in breast cancer patients receiving adjuvant chemotherapy: Evaluation with patient interview after formal assessment. Psycho Oncol. J. Psychol. Soc. Behav. Dimens. Cancer15, 921–930 (2006). [DOI] [PubMed] [Google Scholar]
- 2.Fan, H. G. M. et al. Fatigue, menopausal symptoms, and cognitive function in women after adjuvant chemotherapy for breast cancer: 1-and 2-year follow-up of a prospective controlled study. J. Clin. Oncol.23(31), 8025–8032 (2005). [DOI] [PubMed] [Google Scholar]
- 3.Bray, F. et al. Global cancer statistics 2022: GLOBOCAN estimates of incidence and mortality worldwide for 36 cancers in 185 countries. CA Cancer J. Clin.74(3), 229–263 (2024). [DOI] [PubMed] [Google Scholar]
- 4.Youn, H. J. & Han, W. A review of the epidemiology of breast cancer in Asia: Focus on risk factors. Asian Pac. J. Cancer Prev. APJCP21(4), 867 (2020). [DOI] [PMC free article] [PubMed] [Google Scholar]
- 5.Menhas, R. & Shumaila, U. Breast cancer among Pakistani women. Iran. J. Pub. Health44(4), 586 (2015). [PMC free article] [PubMed] [Google Scholar]
- 6.Rosen, E. M., Fan, S., Pestell, R. G. & Goldberg, I. D. BRCA1 gene in breast cancer. J. Cell. Physiol.196(1), 19–41 (2003). [DOI] [PubMed] [Google Scholar]
- 7.Olivier, M., Hollstein, M. & Hainaut, P. TP53 mutations in human cancers: Origins, consequences, and clinical use. Cold Spring Harb. Perspect. Biol.2(1), a001008 (2010). [DOI] [PMC free article] [PubMed] [Google Scholar]
- 8.Maehama, T. & Dixon, J. E. The tumor suppressor, PTEN/MMAC1, dephosphorylates the lipid second messenger, phosphatidylinositol 3, 4, 5-trisphosphate. J. Biol. Chem.273(22), 13375–13378 (1998). [DOI] [PubMed] [Google Scholar]
- 9.Gill, R. et al. Frequent homozygous deletion of the LKB1/STK11 gene in non-small cell lung cancer. Oncogene30(35), 3784–3791 (2011). [DOI] [PMC free article] [PubMed] [Google Scholar]
- 10.Campeau, P. M., Foulkes, W. D. & Tischkowitz, M. D. Hereditary breast cancer: new genetic developments, new therapeutic avenues. Hum. Genet.124, 31–42 (2008). [DOI] [PubMed] [Google Scholar]
- 11.Pharoah PD, Guilford P, Caldas C, Consortium IGCL. Incidence of gastric cancer and breast cancer in CDH1 (E-cadherin) mutation carriers from hereditary diffuse gastric cancer families. Gastroenterology121(6), 1348–1353 (2001). [DOI] [PubMed] [Google Scholar]
- 12.Kurosky, S. K., Mitra, D., Zanotti, G. & Kaye, J. A. Treatment patterns and outcomes of patients with metastatic ER+/HER-2− breast cancer: A multicountry retrospective medical record review. Clin. Breast Cancer18(4), e529–e538 (2018). [DOI] [PubMed] [Google Scholar]
- 13.Gonçalves, H. Jr. et al. Survival study of triple-negative and non-triple-negative breast cancer in a Brazilian cohort. Clin. Med. Insights Oncol.12, 1179554918790563 (2018). [DOI] [PMC free article] [PubMed] [Google Scholar]
- 14.Wu, J. & Hicks, C. Breast cancer type classification using machine learning. J.Personal. Med.11(2), 61 (2021). [DOI] [PMC free article] [PubMed] [Google Scholar]
- 15.Perou, C. Molecular stratification of triple-negative breast cancers. Oncologist15, 39–48 (2010). [DOI] [PubMed] [Google Scholar]
- 16.Joyce, D. et al. Prospective comparison of outcome after treatment for triple-negative and non-triple-negative breast cancer. Surgeon15(5), 272–277 (2017). [DOI] [PubMed] [Google Scholar]
- 17.Li, X. et al. Triple-negative breast cancer has worse overall survival and cause-specific survival than non-triple-negative breast cancer. Breast Cancer Res. Treat.161, 279–287 (2017). [DOI] [PubMed] [Google Scholar]
- 18.Pan, X.-B., Qu, S., Jiang, Y.-M. & Zhu, X.-D. Triple negative breast cancer versus non-triple negative breast cancer treated with breast conservation surgery followed by radiotherapy: A systematic review and meta-analysis. Breast Care10(6), 413–416 (2015). [DOI] [PMC free article] [PubMed] [Google Scholar]
- 19.Ye, J. et al. Cellular uptake mechanism and comparative evaluation of antineoplastic effects of paclitaxel–cholesterol lipid emulsion on triple-negative and non-triple-negative breast cancer cell lines. Int. J. Nanomed.11, 4125–4140 (2016). [DOI] [PMC free article] [PubMed] [Google Scholar]
- 20.Qiu, J. et al. Comparison of clinicopathological features and prognosis in triple-negative and non-triple negative breast cancer. J. Cancer7(2), 167 (2016). [DOI] [PMC free article] [PubMed] [Google Scholar]
- 21.Podo, F. et al. Triple-negative versus non–triple-negative breast cancers in high-risk women: Phenotype features and survival from the HIBCRIT-1 MRI-including screening study. Clin. Cancer Res.22(4), 895–904 (2016). [DOI] [PubMed] [Google Scholar]
- 22.Nabi, M., Ahangar, A., Wahid, M. & Kuchay, S. Clinicopathological comparison of triple negative breast cancers with non-triple negative breast cancers in a hospital in North India. Niger. J. Clin. Pract.18(3), 381–386 (2015). [DOI] [PubMed] [Google Scholar]
- 23.Koshy, N., Quispe, D., Shi, R., Mansour, R. & Burton, G. V. Cisplatin–gemcitabine therapy in metastatic breast cancer: Improved outcome in triple negative breast cancer patients compared to non-triple negative patients. Breast19(3), 246–248 (2010). [DOI] [PubMed] [Google Scholar]
- 24.Lei, X. et al. Mitochondrial fission induces immunoescape in solid tumors through decreasing MHC-I surface expression. Nat. Commun.13(1), 3882 (2022). [DOI] [PMC free article] [PubMed] [Google Scholar]
- 25.Huang, D. W., Sherman, B. T. & Lempicki, R. A. Systematic and integrative analysis of large gene lists using DAVID bioinformatics resources. Nat. Protoc.4(1), 44–57 (2009). [DOI] [PubMed] [Google Scholar]
- 26.Kohl, M., Wiese, S. & Warscheid, B.Cytoscape: software for visualization and analysis of biological networks. Data Min. Proteom. Stand. Appl.696, 291–303 (2011). [DOI] [PubMed]
- 27.Sarkans, U. et al. From arrayexpress to biostudies. Nucleic Acids Res.49(D1), D1502–D1506 (2021). [DOI] [PMC free article] [PubMed] [Google Scholar]
- 28.Leinonen, R. et al. The European nucleotide archive. Nucleic Acids Res.39, D28–D31 (2010). [DOI] [PMC free article] [PubMed] [Google Scholar]
- 29.Zararsız, G. et al. A comprehensive simulation study on classification of RNA-Seq data. PloS ONE12(8), e0182507 (2017). [DOI] [PMC free article] [PubMed] [Google Scholar]
- 30.Jabeen, A., Ahmad, N. & Raza, K. Machine learning-based state-of-the-art methods for the classification of rna-seq data. Class. BioApps Automat. Decis. Mak.26, 133–172 (2018).
- 31.Supek, F., Bošnjak, M., Škunca, N. & Šmuc, T. REVIGO summarizes and visualizes long lists of gene ontology terms. PloS ONE6(7), e21800 (2011). [DOI] [PMC free article] [PubMed] [Google Scholar]
- 32.Szklarczyk, D. et al. The STRING database in 2017: Quality-365 controlled protein-protein association networks made broadly accessible. Nucleic Acids Res.45, D36–D368 (2017). [DOI] [PMC free article] [PubMed] [Google Scholar]
- 33.Udhaya Kumar, S. et al. Analysis of differentially expressed genes and molecular pathways in familial hypercholesterolemia involved in atherosclerosis: A systematic and bioinformatics approach. Front. Genet.11, 734 (2020). [DOI] [PMC free article] [PubMed] [Google Scholar]
- 34.Saito, R. et al. A travel guide to cytoscape plugins. Nat. Methods9(11), 1069–1076 (2012). [DOI] [PMC free article] [PubMed] [Google Scholar]
- 35.Shannon, P. et al. Cytoscape: A software environment for integrated models of biomolecular interaction networks. Genome Res.13(11), 2498–2504 (2003). [DOI] [PMC free article] [PubMed] [Google Scholar]
- 36.Chin, C. H. et al. cytoHubba: Identifying hub objects and sub-networks from complex interactome. BMC Syst. Biol.8(4), 1–7 (2014). [DOI] [PMC free article] [PubMed] [Google Scholar]
- 37.Chandrashekar, D. S. et al. UALCAN: A portal for facilitating tumor subgroup gene expression and survival analyses. Neoplasia19(8), 649–658 (2017). [DOI] [PMC free article] [PubMed] [Google Scholar]
- 38.Liu, Z., Zhou, J., Wang, Z. & Zhou, Z. Analysis of SEC24D gene in breast cancer based on UALCAN database. Open Life Sci.14(1), 707–711 (2019). [DOI] [PMC free article] [PubMed] [Google Scholar]
- 39.Oliveros JC: VENNY. An interactive tool for comparing lists with Venn Diagrams. http://bioinfogp.cnb.csic.es/tools/venny/index.html (2007).
- 40.Kang, J., Sergio, C. M., Sutherland, R. L. & Musgrove, E. A. Targeting cyclin-dependent kinase 1 (CDK1) but not CDK4/6 or CDK2 is selectively lethal to MYC-dependent human breast cancer cells. BMC Cancer14(1), 1–13 (2014). [DOI] [PMC free article] [PubMed] [Google Scholar]
- 41.Liu, Y. et al. Triple negative breast cancer therapy with CDK1 siRNA delivered by cationic lipid assisted PEG-PLA nanoparticles. J. Controll. Release192, 114–121 (2014). [DOI] [PubMed] [Google Scholar]
- 42.Yuan, B. et al. Increased expression of mitotic checkpoint genes in breast cancer cells with chromosomal instability. Clin. Cancer Res.12(2), 405–410 (2006). [DOI] [PubMed] [Google Scholar]
- 43.Shigeishi, H. et al. Correlation of human Bub1 expression with tumor-proliferating activity in salivary gland tumors. Oncol. Rep.15(4), 933–938 (2006). [PubMed] [Google Scholar]
- 44.Ouyang, B., Knauf, J. A., Ain, K., Nacev, B. & Fagin, J. A. Mechanisms of aneuploidy in thyroid cancer cell lines and tissues: Evidence for mitotic checkpoint dysfunction without mutations in BUB1 and BUBR1. Clin. Endocrinol.56(3), 341–350 (2002). [DOI] [PubMed] [Google Scholar]
- 45.Bell, R., Barraclough, R. & Vasieva, O. Gene expression meta-analysis of potential metastatic breast cancer markers. Curr. Mol. Med.17(3), 200–210 (2017). [DOI] [PMC free article] [PubMed] [Google Scholar]
- 46.Chen, W. X. et al. Bioinformatics analysis revealing prognostic significance of RRM2 gene in breast cancer. Biosci. Rep.39, BSR20182062 (2019). [DOI] [PMC free article] [PubMed] [Google Scholar]
- 47.Yao, W., Jiang, M., Zhang, M., Zhang, H. & Liang, X. TTK: A promising target in malignant tumors. J. Cell. Signal.2(3), 212–220 (2021). [Google Scholar]
- 48.Tang, A. et al. Aurora kinases: Novel therapy targets in cancers. Oncotarget8(14), 23937 (2017). [DOI] [PMC free article] [PubMed] [Google Scholar]
- 49.Wang, F. et al. Combination of AURKA inhibitor and HSP90 inhibitor to treat breast cancer with AURKA overexpression and TP53 mutations. Med. Oncol.39(12), 180 (2022). [DOI] [PubMed] [Google Scholar]
- 50.Bu, Y., Shi, L., Yu, D., Liang, Z. & Li, W. CDCA8 is a key mediator of estrogen-stimulated cell proliferation in breast cancer cells. Gene703, 1–6 (2019). [DOI] [PubMed] [Google Scholar]
- 51.Sun, J. et al. Overexpression of CENPF correlates with poor prognosis and tumor bone metastasis in breast cancer. Cancer Cell Int.19(1), 1–11 (2019). [DOI] [PMC free article] [PubMed] [Google Scholar]
- 52.Landberg, G., Erlanson, M., Roos, G., Tan, E. M. & Casiano, C. A. Nuclear autoantigen p330d/CENP-F: A marker for cell proliferation in human malignancies. Cytom. J. Int. Soc. Anal. Cytol.25(1), 90–98 (1996). [DOI] [PubMed] [Google Scholar]
- 53.Yin, Y., Cai, J., Meng, F., Sui, C. & Jiang, Y. MiR-144 suppresses proliferation, invasion, and migration of breast cancer cells through inhibiting CEP55. Cancer Biol. Ther.19(4), 306–315 (2018). [DOI] [PMC free article] [PubMed] [Google Scholar]
- 54.Wei, R. et al. Bioinformatic analysis revealing mitotic spindle assembly regulated NDC80 and MAD2L1 as prognostic biomarkers in non-small cell lung cancer development. BMC Med. Genom.13, 1–14 (2020). [DOI] [PMC free article] [PubMed] [Google Scholar]
Associated Data
This section collects any data citations, data availability statements, or supplementary materials included in this article.
Data Availability Statement
Datasets are available on ArrayExpress database with following Accession numbers. Accession No: E-GEOD-58135, E-MTAB-4993 and E-GEOD-45419.


