Abstract
Intestinal absorption of phosphate is bimodal, consisting of a transcellular pathway and a poorly characterized paracellular mode, even though the latter one contributes to the bulk of absorption under normal dietary conditions. Claudin-3 (Cldn3), a tight junction protein present along the whole intestine in mice, has been proposed to tighten the paracellular pathway for phosphate. The aim of this work was to characterize the phosphate-related phenotype of Cldn3-deficient mice. Cldn3-deficient mice and wildtype littermates were fed standard diet or challenged for 3 days with high dietary phosphate. Feces, urine, blood, intestinal segments and kidneys were collected. Measurements included fecal, urinary, and plasma concentrations of phosphate and calcium, plasma levels of phosphate-regulating hormones, evaluation of trans- and paracellular phosphate transport across jejunum and ileum, and analysis of intestinal phosphate and calcium permeabilities. Fecal and urinary excretion of phosphate as well as its plasma concentration was similar in both genotypes, under standard and high-phosphate diet. However, Cldn3-deficient mice challenged with high dietary phosphate had a reduced urinary calcium excretion and increased plasma levels of calcitriol. Intact FGF23 concentration was also similar in both groups, regardless of the dietary conditions. We found no differences either in intestinal phosphate transport (trans- or paracellular) and phosphate and calcium permeabilities between genotypes. The intestinal expression of claudin-7 remained unaltered in Cldn3-deficient mice. Our data do not provide evidence for a decisive role of Cldn3 for intestinal phosphate absorption and phosphate homeostasis. In addition, our data suggest a novel role of Cldn3 in regulating calcitriol levels.
Supplementary Information
The online version contains supplementary material available at 10.1007/s00424-024-02998-x.
Keywords: Intestinal absorption, Phosphate, Calcium, Cldn3, Paracellular transport, Vitamin D3
Introduction
Absorption of inorganic phosphate (Pi) in the gut takes place mostly along the small intestine. The molecular type and content of dietary phosphate depend on the dietary source. Processed food contains high levels of bioavailable inorganic phosphate (Pi), whereas phosphate comes mostly in the form of organic esters or phytate in unprocessed food from animal or plant origin, respectively (for review, see [28]). Regardless of the source, dietary phosphate must be hydrolyzed for Pi to be absorbed. Thus, organic esters are hydrolyzed in the gastrointestinal tract by the action of the alkaline phosphatase, whereas hydrolysis of phytate would require phytase, an enzyme that is not expressed in mammals [33]. Therefore, the source of phosphate critically controls its bioavailability. Upon intestinal absorption and release into the blood stream, Pi in excess is excreted into urine. Therefore, in states of compromised renal function, such as chronic kidney disease (CKD), high phosphate consumption may exceed the renal capacity to compensate for intestinal absorption, thus resulting in hyperphosphatemia. High plasma Pi is known to associate with cardiovascular disease and mortality not only in patients with CKD [1, 3, 19, 34] but also in the normal population [6, 8, 28]. Since the content of phosphate in Western food is well above the levels recommended by the World Health Organization, it is critical to understand the mechanisms mediating intestinal absorption of Pi, as this step has classically received less attention than the renal counterpart.
Intestinal absorption of Pi proceeds via two independent pathways, namely, a passive route the capacity of which is proportional to the luminal concentration of Pi and an active component that gets saturated with increasing luminal concentrations of the substrate [18, 40]. This last component involves uptake of luminal/dietary Pi across the brush border membrane (BBM) of enterocytes, a step mediated by NaPi-IIb/Slc34a2 [13, 21], followed by efflux of Pi across the basolateral membrane via a transporter whose identity remains to be unambiguously defined (for review, see [15]). By analogy with other ions, the passive component is expected to proceed paracellularly across tight junctions [36]. In all intestinal segments of rats and mice, the luminal concentration of Pi is well above the plasma levels (5.7–35 mM vs. 1–2 mM), thus providing the driving force for passive transport [20, 25].
NaPi-IIb localizes to the BBM of enterocytes in the small intestine [16], and though it mediates most if not all active transport of Pi in the gut, its absence in mice has very modest consequences in overall intestinal absorption of the anion [13, 30]. This observation, together with the fact that the Km for Pi of NaPi-IIb (≈50 µM) is far below the intraluminal Pi concentration [25], suggests that the passive route mediates the bulk of Pi absorption. In mice, all intestinal segments show a passive Pi conductance, since transport activity increases with increasing intraluminal concentrations of Pi and the direction of transport follows the gradient of the ion [36]. Unlike the active component, passive Pi transport is not regulated by vitamin D3 [14]. Still, the identity of the tight junction protein(s) responsible for the formation of the Pi paracellular pathway remains unknown. It has been reported that lithocholic acid, a vitamin D receptor (VDR) agonist, increases Pi transport across the whole intestine of mice in a VDR-dependent but Na+-independent manner [11]. Lithocholic acid reduced the intestinal expression of claudin-3/Cldn3 and occludin, two tight junction components, in a VDR-dependent manner, but without changing the expression of NaPi-IIb. Moreover, everted sacs from Cldn3 knockouts (KO) showed an increased transport for Pi when exposed to intraluminal Pi concentrations of 1.2 mM. Also, the Pi concentration in hepatic bile is increased in this mouse model [37]. Based on these observations, it has been suggested that claudin-3 may tighten the paracellular pathway for Pi.
Here, we have analyzed the effect of Cldn3 deletion on intestinal absorption and transport routes of Pi and on several parameters related to Pi metabolism in mice under standard conditions as well as upon a challenge with high Pi diets. Our results do not support a role of claudin-3 in intestinal absorption of Pi.
Material and methods
Ethical approval
All animal experiments were approved by the local veterinary authority, Kantonales Veterinäramt Zürich (ZH240/2019), and performed according to Swiss Animal Welfare laws.
Animal and tissue handling
Generation of global constitutive Cldn3 knockout (KO) mice has been previously described [23]. Mice heterozygous for the deleted allele (Cldn3+/−) were bred to obtain homozygous Cldn3−/− (KO) and Cldn3+/+ (wild type, WT) littermates that were identified by genotyping as reported. Mice were kept at a standard 12 h light and dark cycle with free access to food and water. Experiments were performed with 3-month-old males.
In a first experiment, Cldn3 KO and WT littermates fed ad libitum on standard chow (0.6% Pi, 1% Ca, 1000 IU Vit. D3; ssniff, Soest, Germany) were adapted individually for 24 h to metabolic cages (Tecniplast, Italy), upon which 24 h urine and feces were collected. In a second experiment, mice were also placed in metabolic cages but received ad libitum high Pi diet (1.2% Pi, 1% Ca, 1000 IU Vit. D3; ssniff, Soest, Germany) for a total duration of 3 days, with collection of the last 24 h urine. In both experiments, at the end of the 24 h collection, mice were anaesthetized with vaporized isoflurane for terminal organ extraction, and venous blood was collected with heparinized syringes. Plasma was separated from total blood by centrifugation, aliquoted, and stored at − 80 °C. The animals were then sacrificed by cervical dislocation and their kidneys and intestine harvested. Freshly isolated intestinal segments were flushed with 0.9% NaCl solution, and the middle part of jejunum and ileum was transferred immediately to standard Ringer solution (in mM: 145 NaCl, 3.6 KCl, 3.6 NaHCO3, 5 glucose, 1 MgCl2·6 H2O, 1.3 Ca-gluconate·H2O, pH 6.0). These segments were then cut open longitudinally, inserted into tissue holders, and mounted into Ussing chambers for measurement of radioactively labeled (32P) Pi flux and of dilution potentials as described previously [14, 20]. The rest of the intestinal tissue (duodenum, remains of jejunum, and ileum, as well as proximal and distal colon) was inverted and rinsed with 0.9% NaCl prior collection of the luminal mucosa by scraping; scrapings were stored at − 80 °C. Urine samples were centrifuged at room temperature to remove debris and stored at − 20 °C. Stool samples were dried at 80 °C over the course of 3 days and dissolved in 0.6 M HCl (100 mg/ml) as reported [16]. Upon homogenization and centrifugation, supernatants were kept at room temperature.
Quantification of ions in plasma, stool, and urine
Fecal and urinary Pi content was colorimetrically determined (Randox kit, UK) according to the Fiske-Subbarow method [7], whereas the amount of Ca2+ in stool and urine samples was measured with the QuantiChrom Calcium Assay Kit (BioAssay Systems). The rest of the urinary (Na+, K+, Mg2+, and Cl−) and all plasma ions were measured in a SYNCHRON® System (Beckman Coulter) at the Zürich Integrative Rodent Physiology facility. Fecal excretions were normalized to 24 h food intake, whereas urinary parameters were corrected by the urinary creatinine concentration measured by the Jaffe method.
Quantification of plasma FGF23, PTH, and calcitriol
The amount of intact fibroblast growth factor 23 (FGF23) as well as of intact parathyroid hormone (PTH) in plasma was determined by ELISA (Immutopics International) according to the manufacturers’ protocol. The levels of calcitriol were measured with a radioimmunoassay kit (Immunodiagnostic System).
Flux measurements
Pi (32P) fluxes across the jejunum and ileum were examined in Ussing chambers as previously described [20]. Briefly, freshly isolated intestinal segments were mounted on tissue holders and inserted into Ussing chambers and then equilibrated for 30 min with standard Ringer solution (continuously oxygenated and kept at 37 °C with a water jacket) on both sides of the tissue. Upon equilibration, either a 100 µM or a 70 mM apical-to-basolateral Pi gradient was established by the addition of NaH2PO4/32P solution to the chamber in contact with the luminal side of the tissue (“apical chamber”), whereas the Ringer added to basolateral side contained no Pi. The 100 µM Pi gradient is a condition where active transport is preferred, whereas a concentration gradient of 70 mM Pi favors the passive transport of the anion. Aliquots were taken from the basolateral side 0, 60, 90, and 120 min after the addition of radiolabeled 32P to the apical side. At each time point, apical aliquots of the same volume were also discarded to avoid changes in hydrostatic pressure. In a second set of experiments, jejunal segments were subjected to either a 2 mM or a 70 mM Pi gradient (NaH2PO4/32P) both from the apical to basolateral (AP to BL) and basolateral to apical (BL to AP) sites, and fluxes measured are described above. The amount of 32P transported from the donor to the acceptor side was quantified with a β-counter (Packard BioScience).
Dilution potential measurements
Dilution potential measurements were performed in freshly isolated segments of the jejunum and ileum from mice fed 3 days on high Pi diet as reported [20]. Tissues were mounted in modified Ussing chambers (exposed area of 0.076 cm2) with a flow-through system, where the apical and basolateral sides were independently and continuously perfused with a flow rate of 5–10 ml/min. After equilibration, one side of the chamber was consecutively perfused with either a standard Ringer solution (145 mM NaCl, pH 6), a low NaCl Ringer (30 mM NaCl supplemented with 230 mM mannitol, pH 6), a high Pi Ringer (140 mM NaH2PO4, pH 6), or a high CaCl2 Ringer (72.5 mM CaCl2 supplemented with 75 mM mannitol, pH 6). Solutions were applied first to the apical and then basolateral chamber, while the other chamber was simultaneously perfused with standard Ringer solution. Differences in transepithelial voltage (Vte) upon changes of perfusion solution were measured under open-circuit conditions and corrected for previously defined liquid junction potentials, with Vte referring to the apical side. Transepithelial resistance (Rte) was assessed with short pulses (1 s) of 1.22 µA, and the difference in Vte upon the pulse was used to calculate the Rte according to Ohm’s law (Rte = ΔVte/I) after correction for the resistance of the empty chamber. Relative and absolute permeabilities for monovalent ions (Na+, Cl−, and Pi) were calculated using the Goldman-Hodgkin-Katz equation and Rte, while permeability values for divalent Ca2+ were calculated with the simplified Kimizuka-Koketsu equation. Permeability ratios (PNa/PCl, PNa/PPi, and PNa/PCa) were obtained by the Goldman-Hodgkin-Katz equation, and Rte was used to calculate absolute permeabilities.
Isolation of total membrane fractions from the ileum and jejunum
Ileal and jejunal mucosal scrapings were placed in homogenization buffer consisting of 200 mM mannitol, 41 mM KOH, and 80 mM HEPES (pH 7.5), supplemented with protease/phosphatase inhibitors (Roche, Switzerland). Upon addition of MagNa Lyser Green Beads (Roche, Switzerland), tubes were placed in a Precellys 24 homogenizer (Bertin Instruments) and subjected to two rounds of 6800 rpm, 30 s each. Samples were then centrifuged at 6000 rpm for 20 min at 4 °C. Supernatants were further centrifuged (41,000 rpm, 30 min at 4 °C), and the pellets containing total membrane proteins were resuspended in the homogenization buffer by sonication.
Renal brush border membrane preparation
Renal brush border membranes (BBM) were isolated from frozen kidneys as described in detail [2]. Half of a kidney was homogenized with a Polytron PT 10–35 (Kinematica GmbH) in a buffer containing 300 mM mannitol, 5 mM EGTA, and 12 mM Tris–HCl (pH 7.1), supplemented with protease/phosphatase inhibitors (Roche, Switzerland). Upon addition of MgCl2 (final concentration 12 mM) and 15 min precipitation on ice, the samples were centrifuged (4500 rpm, 15 min, 4 °C), and the supernatants further centrifuged at 17,500 rpm, 30 min at 4 °C. Pellets containing the BBMs were resuspended in a buffer containing 300 mM mannitol, 20 mM HEPES-Tris, pH 7.4.
Protein determination and Western blot
The protein concentration of ileal and jejunal total membrane fractions and renal BBMs was measured with the Bio-Rad DC protein assay kit. Aliquots containing 20 µg protein were mixed with Laemmli sample buffer, separated on 9% or 12% SDS/PAGE gels, and transferred onto polyvinylidene difluoride (PVDF) membranes (Millipore, Switzerland). Membranes were then blocked with 5% fat-free milk powder in Tris-buffered saline (TBS) for 30 min prior to overnight incubation at 4 °C with primary antibodies against NaPi-IIa (1:3000) [5], NaPi-IIb (1:2000) [25], claudin-2 (1:300, #51–6100 Thermo Fisher), claudin-3 (1:1000, #34–1700 Invitrogen, Switzerland), claudin-7 (1:1000, #34–9100 Invitrogen), calbindin-D28k (1:500, #CB38 Swant), VDR (1:300, #sc-13133 Santa Cruz Biotechnology), or β-actin (1:15,000, #A1978 Sigma-Aldrich, Switzerland). Upon washing with TBS, membranes were incubated for 1 h at room temperature with the appropriate HRP-conjugated secondary antibodies (Promega, Switzerland). After further washing with TBS, membranes were exposed to HRP substrate (Western Chemiluminescence HRP Substrate, Millipore, Switzerland) for 5 min before the chemiluminescent signal was detected with a LAS-4000 camera system (Fujifilm). The densitometric analysis was performed with the Image Studio Lite program, and the density of the proteins of interest was normalized to β-actin.
Immunofluorescence of intestinal segments
Intestinal rings of freshly dissected duodenum, jejunum, ileum, and proximal colon were fixed in 4% PFA in PBS, incubated in increasingly concentrated solutions of sucrose in PBS, then embedded in optimal cutting temperature compound (OCT, Tissue-Tek, Sakura, USA), and frozen in liquid propane. For immunostainings, 1–5 µm thick cryosections were cut and mounted on Superfrost Plus Slides (Thermo Scientific, Switzerland) and then rehydrated in PBS for 30 min. Samples were incubated 5 min in 1% SDS in PBS for antigen retrieval, upon which the sections were washed in PBS and blocked with 1% BSA in PBS for 15–30 min. Incubation with the primary antibody of Claudin-3 (1:50, #34–1700 Invitrogen, Switzerland) or of Claudin-7 (1:200, #34–9100 Invitrogen, Switzerland) was done overnight at 4 °C. Upon washes with hypertonic PBS and normal PBS, anti-rabbit secondary antibody (1:1000; Alexa Fluor 594, Life Technologies) mixed with Alexa Fluor 488-coupled phalloidin (1: 500; Life Technologies) and 4,6-diamidino-2-phenylindole (1:500; DAPI, Sigma-Aldrich) were applied and incubated for 1 h at room temperature. After the previous washing protocol was repeated, the sections were mounted with Dako mounting medium (Dako, USA) and analyzed either with a Leica DM 5500B fluorescence microscope or with the CLSM Leica Stellaris 5 upright confocal microscope, provided by the Center for Microscopy and Image Analysis of the University of Zurich, using the software LAS X with a magnification of × 63 and a step size of 0.30 μm. The images obtained with the confocal microscope were processed with the Bitplane Imaris 10.1.1 software.
RNA isolation and quantitative real-time PCR
Total RNA from kidney and jejunum samples was extracted by homogenizing the tissue in TRIzol (Invitrogen, USA) using MagNa Lyser Green Beads (Roche, Switzerland) and the Precellys 24 homogenizer (Bertin Instruments), followed by chloroform extraction. Total RNA was purified with the NucleoSpin RNA mini kit (Macherey–Nagel) in accordance with the manufacturer’s protocol and the purity measured with the ND-1000 NanoDrop spectrophotometer (Thermo Scientific, USA). cDNA was transcribed according to the TaqMan Reverse Transcription protocol (Thermo Scientific, USA), by incubating RNA (10 min at 25 °C, 30 min at 48 °C, 5 min at 95 °C, and holding at 4 °C) in the presence and absence of reverse transcriptase, the latter samples serving as negative control. Gene expression was determined by qRT-PCR incubating cDNAs with the KAPA Probe Fast qPCR Universal Master Mix (2x) Kit (Kapa Biosystems) for probe-based qPCR or the PowerUp SYBR Green Master Mix (Applied Biosystems) for dye-based reactions. Gene expression was determined with the QuantStudio 6 Pro Real-Time PCR System (Applied Biosystems), with the following qRT-PCR conditions: 95 °C for 20 s, 40 cycles of 95 °C for 3 s and 60 °C for 30 s. Gene expression levels were normalized to that of HPRT or 18S rRNA (Applied Biosystems (REF 4310893E)) and calculated with the 2−dCT method. The used primers and FAM/TAMRA labeled probes (when applicable) are listed in Supplementary Table 1.
Reverse transcription PCR (RT-PCR)
Intestinal and renal cDNA obtained from total RNA as described above was used as template to perform PCR. Primers for Cldn3 were designed with the help of National Center of Biotechnology Information (NCBI), checked for specificity by BLAST and ordered from Microsynth (Balgach, Switzerland; Supplementary Table 1). The REDTaq ReadyMix PCR reaction mix (Sigma-Aldrich, REF R2523-100RXN) containing Taq DNA Polymerase was mixed with primers and cDNA, and the PCR (94 °C for 120 s followed by 35 cycles of 94 °C for 30 s, 60 °C for 30 s, and 72 °C for 30 s and final extension of 72 °C for 300 s) was performed on the thermocycler Techne TC-512 (Barloworld Scientific, Ltd., UK). The PCR products were then run on a 2% agarose gel in the presence of GelRed Nucleic Acid Stain (Biotium, REF 41003) and the amplicons visualized under UV light with the Infinity BioVision image acquisition software (Vilber, France).
Statistical analysis
All results were analyzed with the GraphPad Prism 10.1.2 software, and the data is presented as single values together with the means ± standard deviation. Outlier data points were determined with Grubbs’ test. Outliers for any urinary parameter were excluded in further urinary comparisons. In case of two groups, normal distribution was confirmed by the Shapiro–Wilk test and statistical significances were calculated by an unpaired t-test. For analysis of more than two groups, two-way ANOVA followed by Tukey’s multiple comparisons test was used. P values < 0.05 were considered significant.
Results
Cldn3 mRNA is expressed along the whole intestinal tract in mice
RT-PCR on RNA extracted from intestinal mucosa scrapings of WT mice detected Cldn3 mRNA along the whole intestinal tract (Supplementary Fig. 1A). The lack of genomic contamination was confirmed by the near absence of amplicons in PCR using as template RNA samples that were not subjected to reverse transcription (data not shown). Likewise, immunohistochemistry demonstrated the presence of Cldn3 protein in enterocytes (Supplementary Fig. 1B).
Deletion of Cldn3 does not alter basal levels of fecal, urinary, and plasma Pi and Ca2+but increases calcitriol concentration
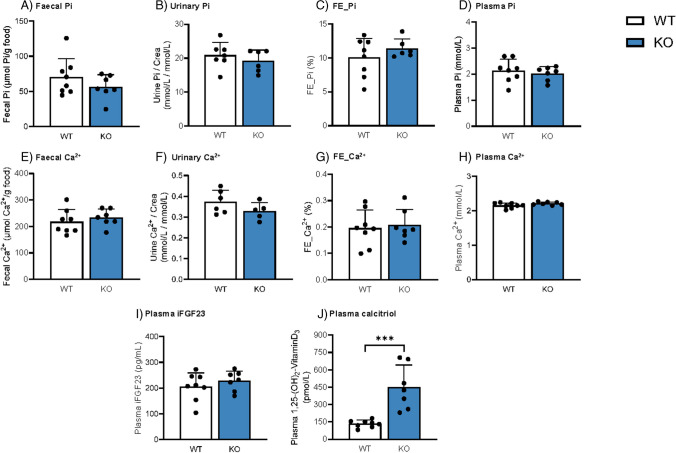
In a first series of experiments, we aimed to elucidate whether global Cldn3 KO mice exhibit a baseline phenotype of altered Pi handling and homeostasis by analyzing several Pi-related parameters in mice fed on standard diet. Fecal and urinary excretion of Pi (the latter either corrected by creatinine or calculated as fractional excretion (FE)) as well as plasma Pi was similar in WT and Cldn3 KO littermates (Fig. 1A–D), as were total Ca2+ levels (Fig. 1E–H). Na+, Cl−, and K+ concentrations were not different between genotypes in neither plasma nor urine (Supplementary Fig. 2A-I). Although the urinary excretion of Mg2+ was slightly elevated in the KO animals when corrected by creatinine, this difference disappeared upon the calculation of the FE (Supplementary Fig. 2 J-K). Plasma levels of Mg2+ were similar in WT and Cldn3 KO mice (Supplementary Fig. 2L).
Fig. 1.
Deletion of Cldn3 does not alter basal levels of fecal, urinary, and plasma Pi and Ca2+ but increases calcitriol concentration. A, E Fecal excretions of Pi and Ca2+ normalized to food intake. B, F Urinary Pi and Ca2+ corrected by creatinine (crea) excretion. C, G Renal fractional excretion (FE %) of Pi and Ca2+. D, H Plasma Pi and Ca.2+ concentrations. I, J Plasma concentrations of intact FGF23 (iFGF23) and calcitriol. N = 7–8 mice per group. A–J Unpaired t-test. ***P < 0.001
The plasma levels of the phosphaturic hormone FGF23 were similar in both genotypes in baseline conditions (Fig. 1I). However, plasma calcitriol, whose levels stimulate intestinal absorption of Pi as well as intestinal and renal transport of Ca2+, was significantly elevated in Cldn3 KO animals (Fig. 1J), despite the absence of differences in fecal and urinary Pi and Ca2+ excretion between the groups.
High Pi diet does not alter Pi levels, but reduces urinary excretion of Ca2+and further increases calcitriol concentration in Cldn3 KO
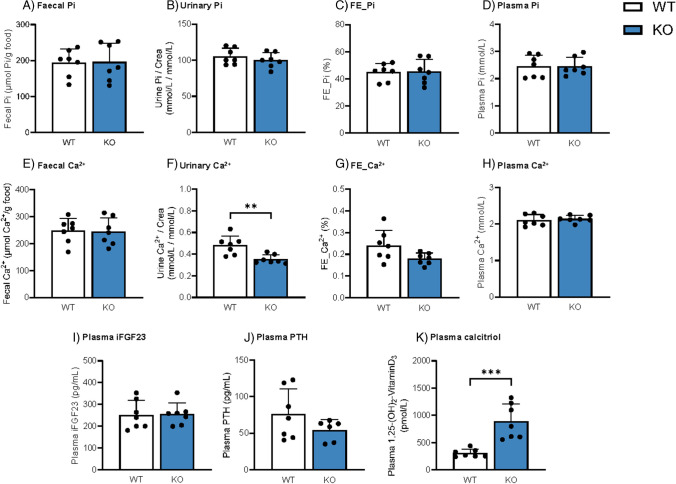
In a second set of experiments, WT and Cldn3 KO mice were placed on high Pi diet (HP) for 3 days to increase intestinal paracellular Pi absorption. Fecal and urinary output of Pi, as well as plasma Pi, was similar in both genotypes (Fig. 2A–D). As expected, fecal and urinary excretion of Pi reflected the dietary content, and both were higher in mice fed on HP than in those fed on normal diet (compare Figs. 1A–C with 2A–C, though determinations were done independently for each diet). Fecal excretion and plasma levels of Ca2+ were also similar in WT and Cldn3 KOs, while the urinary excretion of Ca2+ was lower in KO mice than in their WT littermates, a difference more evident when excretion was normalized to creatinine (Fig. 2E–H). Na+, Cl−, K+, and Mg2+ levels were similar between genotypes in both plasma and urine (Supplementary Fig. 3A-L).
Fig. 2.
Deletion of Cldn3 does not alter Pi levels but reduces urinary excretion of Ca2+ and further increases calcitriol concentration in mice on high Pi diet. A, E Fecal excretions of Pi and Ca2+ normalized to food intake. B, F Urinary Pi and Ca2+ corrected by creatinine (crea) excretion. C, G Renal fractional excretion (FE %) of Pi and Ca2+. D, H Plasma Pi and Ca.2+ concentrations. I–K Plasma concentrations of intact FGF23 (iFGF23), parathyroid hormone (PTH), and calcitriol, respectively. N = 7–8 mice per group. A–K Unpaired t-test. **P < 0.01 and ***P < 0.001
Upon 3 days of HP, no differences between WT and Cldn3 KO littermates were observed in the plasma levels of intact FGF23 (Fig. 2I) or PTH (Fig. 2J). On the other hand, calcitriol levels remained highly elevated in the Cldn3 KO group (Fig. 2K). The persistent elevation of calcitriol levels under 3 days of HP may reflect the impact of high phosphate on intestinal calcium availability.
Deletion of Cldn3 does not alter intestinal fluxes of Pi
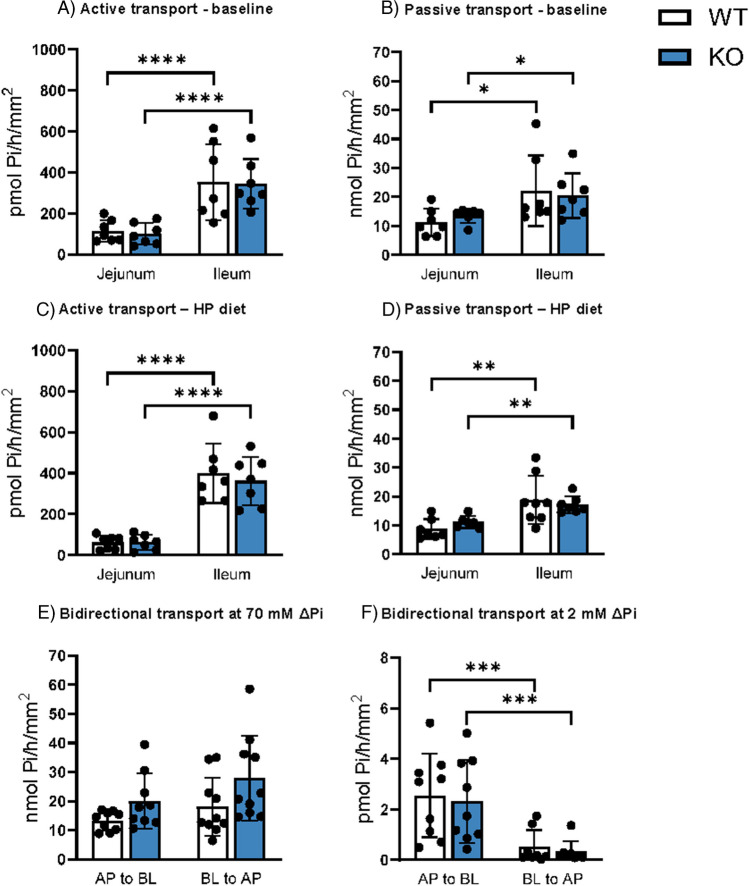
To directly address the effect of Cldn3 deletion on intestinal transport of Pi, we measured 32P fluxes across samples of jejunum and ileum in Ussing chambers. As reported previously [20], fluxes were measured in the presence of two different apical-to-basolateral gradients of Pi that allow to discriminate between active and passive transport mechanisms: a 100 µM gradient (100 µM apical Pi with no Pi added to the basolateral chamber) favors the detection of active transport whereas a 70 mM gradient (70 mM apical Pi with no Pi added to the basolateral chamber) favors detection of the passive process. As expected, in both genotypes and dietary conditions, active transport was higher in the ileum as compared with the jejunum (Fig. 3A, C), reflecting the pattern of expression of NaPi-IIb. However, we found no differences on this active component between genotypes. Passive transport also tended to be higher in the ileum than the jejunum, but again no differences were detected between WT and Cldn3 KO mice neither under normal dietary conditions (Fig. 3B) nor upon 3 days with high dietary Pi (Fig. 3D).
Fig. 3.
Deletion of Cldn3 does not alter intestinal fluxes of Pi. 32P fluxes in the jejunum and ileum of WT and Cldn3 KO mice were measured with the Ussing chamber technique. A, B Active and passive transports under baseline dietary conditions. C, D Active and passive transports upon high dietary Pi challenge. E, F Jejunal transport values upon imposing 70 mM and 2 mM apical-to-basolateral (AP to BL) and basolateral-to-apical (BL to AP) Pi gradients. N = 7–10 mice per group. A–F Two-way ANOVA followed by Tukey’s multiple comparisons test. *P < 0.05, **P < 0.01, ***P < 0.001, and ****P < 0.0001
The bidirectional nature of the passive component was confirmed in jejunal samples from mice fed on standard chow by imposing a 70 mM Pi gradient both apical-to-basolateral (Pi added to the apical chamber and media sampled from the basolateral compartment) as well as basolateral-to-apical (Pi added to the basolateral chamber and media sampled from the apical compartment). As expected, the magnitude of transport was similar for both gradients, with no differences detected between genotypes either (Fig. 3E). Similar experiments were also performed imposing a 2 mM Pi gradient (Fig. 3F). Interestingly, in this experiment, the transport driven by the apical-to-basolateral gradient was significantly larger than the transport elicited by the basolateral-to-apical gradient (though far smaller than the one detected with the 70 mM gradients).
Deletion of Cldn3 does not alter absolute and relative transepithelial permeabilities for Pi, Ca2+, Na+, and Cl−
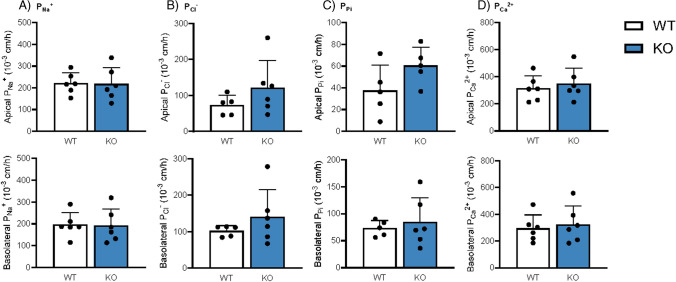
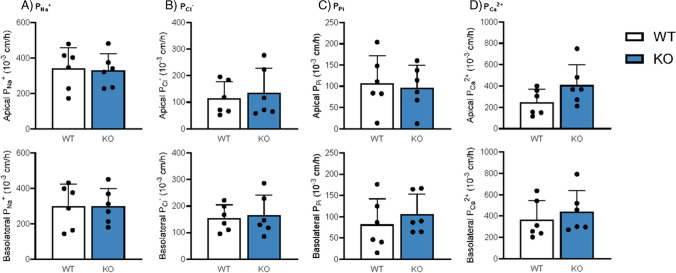
Since Cldn3 KO mice showed diminished urinary Ca2+ excretion upon the high dietary Pi challenge, we next directly assessed the intestinal permeability of WT and Cldn3 KO mice fed 3 days on HP diet. Ileal and jejunal permeabilities for Na+, Cl−, Pi, and Ca2+ were examined with the electrical Ussing chamber technique. No differences were found in the permeabilities for Na+, Cl−, and Pi in the jejunum or ileum (Figs. 4A–C and 5A–C), in line with their normal urinary and fecal excretion values. Despite the reduction observed in urinary Ca2+ excretion, the intestinal permeability for Ca2+ was not affected by the genetic deletion of Cldn3 either (Figs. 4D and 5D). The relative permeabilities of the analyzed ions were also similar in WT and Cldn3 KO mice both in the jejunum (Supplementary Fig. 4A-D) and ileum (Supplementary Fig. 5A-D).
Fig. 4.
Deletion of Cldn3 does not alter absolute permeabilities for Pi, Ca2+, Na+, and Cl− in the jejunum of mice fed on high Pi. Ion permeabilities were calculated from diffusion potential and transepithelial resistance measured with the electrical Ussing chamber technique. Absolute permeabilities for A Na+, B Cl−, C Pi, and D Ca2+ are shown for apical (top) and basolateral (bottom) solution exchange, respectively. N = 6 mice per group. A–D Unpaired t-test
Fig. 5.
Deletion of Cldn3 does not alter absolute permeabilities for Pi, Ca2+, Na+, and Cl− in the ileum of mice fed on high Pi. Ion permeabilities were calculated from diffusion potential and transepithelial resistance measured with the electrical Ussing chamber technique. Absolute permeabilities for A Na+, B Cl−, C Pi, and D Ca2+ are shown for apical (top) and basolateral (bottom) solution exchange, respectively. N = 6 mice per group. A–D Unpaired t-test
Deletion of Cldn3 does not alter intestinal expression of claudin-7 and of NaPi-IIb
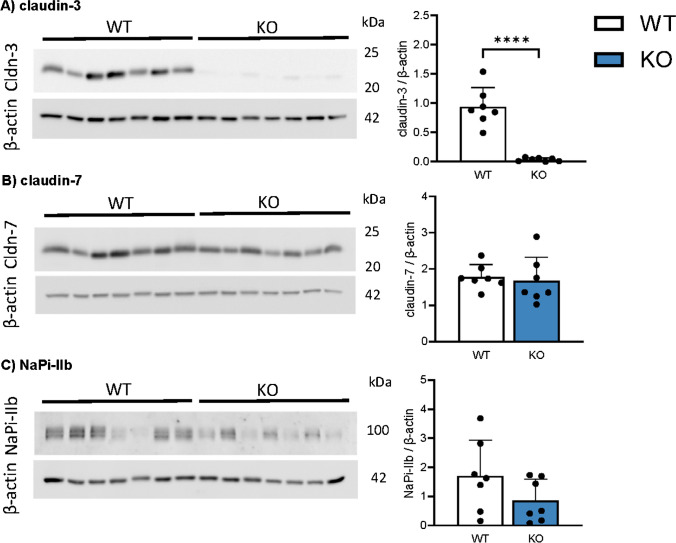
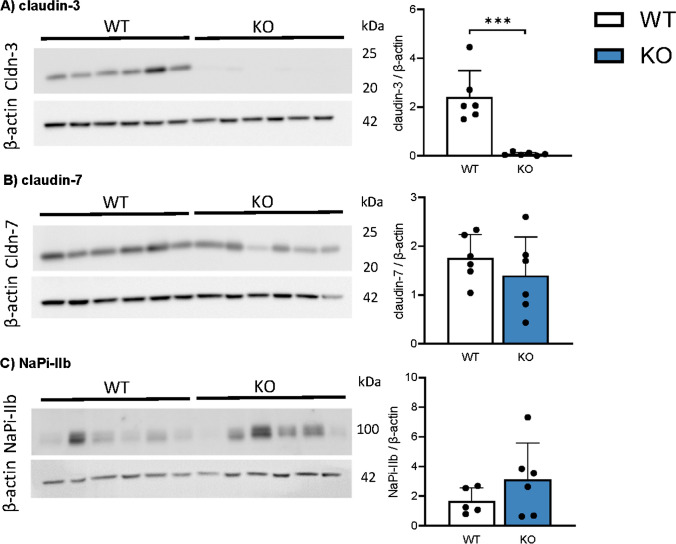
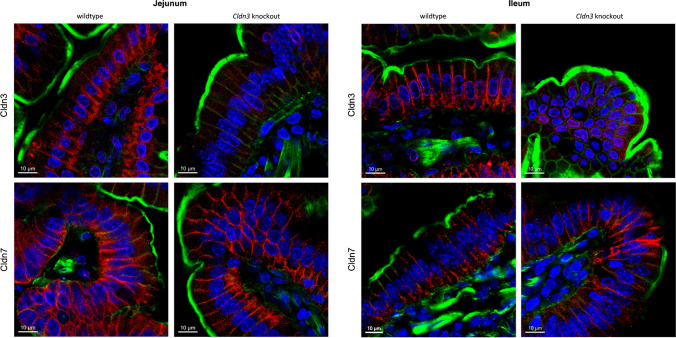
As expected, the protein expression of Cldn3 was almost absent from ileum from Cldn3 KO mice compared with tissue from WT, both in animals fed on standard chow (Fig. 6A) and in those fed on high Pi (Fig. 7A). This near absence of Cldn3 was also confirmed by immunofluorescence: Cldn3 antibodies detected a signal located along the lateral membrane of enterocytes in ileum in WT mice, while this signal was absent in tissue from Cldn3 KO mice (Fig. 8 and Supplementary Figs. 1B and 7). Similar observations were made in the duodenum, jejunum, and proximal colon. Moreover, Cldn3 deletion did not alter the ileal protein abundance of claudin-7, another claudin potentially involved in paracellular transport of ions (Figs. 6B and 7B). Unfortunately, commercial antibodies failed to detect specific bands for claudin-7 and claudin-8, the presence of the latter is required for proper expression of claudin-4 [17]. Similar to claudin-7, the protein expression of NaPi-IIb was unchanged in the ileum of WT and Cldn3 KO fed both on standard (Fig. 6C) and high Pi chow (Fig. 7C).
Fig. 6.
Deletion of Cldn3 does not alter the basal expression of claudin-7 and of NaPi-IIb in the ileum. The protein expression of A claudin-3, B claudin-7, and C NaPi-IIb was analyzed by Western blotting in the ileum of mice fed on standard diet. Graphs show expression of analyzed proteins corrected to the abundance of β-actin. N = 7 mice per group. A–C Unpaired t-test. ****P < 0.0001
Fig. 7.
Deletion of Cldn3 does not alter the expression of claudin-7 and of NaPi-IIb in the ileum of mice fed on high Pi. The protein expression of A claudin-3, B claudin-7, and C NaPi-IIb was analyzed by Western blotting in the ileum of mice fed on high Pi. Graphs show expression of analyzed proteins corrected to the abundance of β-actin. N = 6 mice per group. A–C Unpaired t-test. ***P < 0.001
Fig. 8.
Deletion of Cldn3 does not alter the subcellular localization of claudin-7. Immunofluorescence of intestinal sections of wild-type and Cldn3 KO mice using a Cldn3 or Cldn7 antibody (red), phalloidin (to stain actin: green), and DAPI (blue). Representative images in the jejunum and ileum are shown. Magnification of × 63, scale bar: 10 µm. Larger areas of the same sections are shown in Supplementary Fig. 7
The absence of Cldn3 was also confirmed in jejunal samples from Cldn3 KO mice fed on HP (Supplementary Fig. 6A). The protein abundance of claudin-7 and NaPi-IIb in Cldn3 KO remained similar to WT in this intestinal segment as well (Supplementary Fig. 6B-C).
To assess whether the deletion of Cldn3 altered the intestinal localization of additional claudin subtypes, specifically of claudin-7, confocal microscopy images were obtained in the jejunum and ileum of WT and Cldn3 KO mice (Fig. 8 and Supplementary Fig. 7). Both claudin-3 and claudin-7 showed localization to the lateral membrane of intestinal cells, with the signal for claudin-3 essentially depleted in KO animals. The subcellular localization of claudin-7 did not seem to be affected by the deletion of the Cldn3 gene in neither the jejunal nor the ileal segment.
Deletion of Cldn3 does not alter renal expression of NaPi-IIa
Deletion of Cldn3 did not affect the renal expression of NaPi-IIa, the cotransporter chiefly controlling renal reabsorption of Pi, the abundance of which was similar in WT and KO mice fed both standard and high Pi diets (Supplementary Fig. 8A, B).
Deletion of Cldn3 does not alter intestinal protein expression of several regulators of Ca2+absorption
We next analyzed the protein expression of several targets involved in intestinal Ca2+ handling. In the jejunum of mice fed on HP, claudin-2, a tight junction protein involved in intestinal Ca2+ absorption (and renal proximal tubular Ca2+ reabsorption) showed similar expression in WT and Cldn3 KO mice (Fig. 9A), as did the jejunal expression of the vitamin D receptor (VDR; Fig. 9B). The same results were observed in the ileum (Fig. 9C, D). Calbindin-D28k expression also showed similar values in both genotypes in the jejunum as well as in the ileum (Supplementary Fig. 9A, B).
Fig. 9.
Deletion of Cldn3 does not alter intestinal protein expression of several regulators of Ca2+ absorption. The protein expression of A, C claudin-2 and B, D of the vitamin D receptor (VDR) was analyzed by Western blotting in the jejunum and ileum of mice fed on high Pi. Graphs show expression of analyzed proteins corrected to the abundance of β-actin. N = 6 mice per group. A–D Unpaired t-test
Deletion of Cldn3 results in elevated renal mRNA expression of Cyp27b1
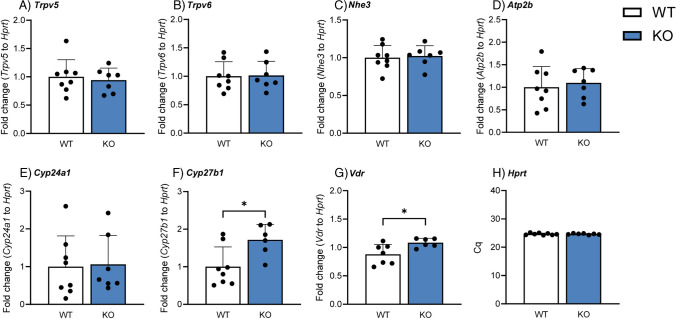
Next, we assessed the mRNA expression of several genes related to Ca2+ handling in the kidneys of WT and Cldn3 KO mice. In agreement with the absence of differences between genotypes in urinary and plasma Ca2+ levels under baseline conditions, the gene expression of the epithelial Ca2+ channels Trpv5 and Trpv6 (Fig. 10 A, B) and the Na+/H+ exchanger 3 (Nhe3, Fig. 10C), whose activity drives the passive reabsorption of approximately 60–70% of all filtered Ca2+ [39], remained unaffected. Additionally, the gene expression of the plasma membrane Ca2+ ATPase (Atp2b, Fig. 10D) was also similar in both groups, as was Cyp24a1 (Fig. 10E), the gene coding for the enzyme responsible for the 24-hydroxylation and subsequent degradation of the active form of vitamin D3. However, the expression of Cyp27b1, the gene encoding the enzyme responsible for the last hydroxylation step in the generation of active vitamin D3, as well as the Vdr was increased in Cldn3 KO mice (Fig. 10F, G). The housekeeping gene Hprt was not affected by the genetic deletion of Cldn3 under baseline conditions (Fig. 10H).
Fig. 10.
Deletion of Cldn3 results in elevated renal mRNA expression of Cyp27b1. Renal gene expression of A Trpv5, B Trpv6, C Nhe3, D Atp2b, E Cyp24a1, F Cyp27b1, G vitamin D receptor (VDR), and H Hprt in mice fed on standard diet. N = 7–8 mice per group. A–H Unpaired t-test. *P < 0.05
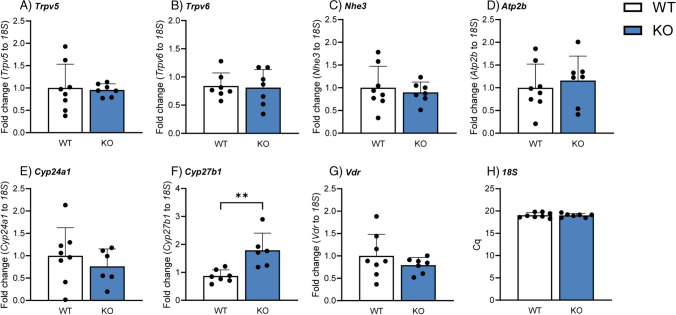
Upon 3 days of high Pi dietary challenge, no alterations in renal gene expression were observed for Trpv5, Trpv6, Nhe3, Atp2b, or Cyp24a1 (Fig. 11A–E). Renal Cyp27b1 mRNA levels (Fig. 11F) were significantly higher in Cldn3 KO animals, in line with the elevated plasma calcitriol in this group. Unlike under baseline conditions, Vdr mRNA levels were not affected by the deletion of Cldn3 in mice challenged with HP (Fig. 11G). Since Hprt gene expression tended to be higher in the KO mice upon high Pi diet (data not shown), mRNA levels of the aforementioned targets were normalized to that of 18S, whose gene expression remained similar in both genotypes (Fig. 11H).
Fig. 11.
Deletion of Cldn3 results in elevated renal mRNA expression of Cyp27b1 in mice fed on high Pi. Renal gene expression of A Trpv5, B Trpv6, C Nhe3, D Atp2b, E Cyp24a1, F Cyp27b1, G vitamin D receptor (VDR), and H 18S in mice fed on high Pi. N = 7–8 mice per group. A–H Unpaired t-test. **P < 0.01
The gene expression of the mentioned candidates was also measured in the jejunum. While Trpv5 and Trpv6 transcripts were not detected in this intestinal segment, Nhe3, Atp2b, and Vdr showed similar expression in WT and Cldn3 KO mice both under baseline conditions (Supplementary Fig. 10A-C), as well as upon high Pi dietary challenge (Supplementary Fig. 10F-H). Moreover, Cldn12, a constituent of tight junctions associated with Ca2+ absorption, was present in the jejunum, but its levels did not show differences between genotypes (Supplementary Fig. 10D, I).
Discussion
While the renal control of Pi homeostasis has been thoroughly investigated, much less is known about the intestinal absorption of this anion. This is especially true for the paracellular pathway, mediated by tight junctions, which is the mode of transport likely contributing to the majority of intestinal Pi absorption in humans consuming a “Western diet” [13, 30]. The understanding of the molecular identity of this pathway is therefore of great importance, particularly in conditions associated with renal failure (such as CKD), when the intestinal absorption is the only remaining means to control serum Pi levels [32]. Claudin-3, a tight junction protein expressed in a variety of epithelia such as the gastrointestinal tract and the kidney, has been recently proposed to have a Pi sealing function in epithelia [4, 26]. Here, we assessed the phenotype of global Cldn3 KO mice, in which intestinal deletion of the protein was confirmed by immunofluorescence and immunoblotting, with regard to Pi homeostasis. Because Pi and Ca2+ share common hormonal regulators (calcitriol, PTH, and FGF23), Ca2+ homeostasis was analyzed as well. Determinations were performed under normal dietary conditions, to assess the basal phenotype, as well as upon 3 days of high dietary Pi challenge. High dietary Pi imposes a larger gradient of Pi between the intestinal lumen and blood/interstitium increasing possible differences between WT mice (with intestinal tight junctions sealed for Pi) and Cldn3 KO (whose tight junctions would be leakier for Pi if claudin-3 indeed seals the paracellular pore for the anion).
Our experiments lead to several important findings. Firstly, the genetic deletion of Cldn3 did not lead to compensation in intestinal protein abundance and/or localization by other claudin subtypes, namely, claudin-4 and claudin-7, despite previous reports noting the ability of claudins to compensate for the other’s absence [9, 38]. The basal phenotype of the Cldn3 KO animals did not reveal any changes of Pi and Ca2+ values in urine, feces, or plasma. However, plasma calcitriol levels were elevated in these mice, probably due to higher renal synthesis, as suggested by the higher mRNA expression of Cyp27b1. This is a surprising finding in face of the normal Pi and Ca2+ concentrations in plasma and urine. On the other hand, FGF23 showed similar levels in both genotypes, despite calcitriol stimulating the production and release of FGF23 by osteocytes [22, 31]. The elevation of calcitriol in Cldn3 KO mice persisted also after 3 days of high Pi feeding, although FGF23, PTH (whose secretion is negatively regulated by calcitriol [29, 35]), and Pi levels remained unaffected. Under both dietary conditions, no differences were found in the renal protein expression of NaPi-IIa, the main Na+/Pi cotransporter in the BBM of proximal tubules, in line with the similar urinary excretion of Pi and normal levels of phosphaturic hormones.
Our group has previously shown that the entire axis of the mouse intestine has a high paracellular permeability for Pi, with the ileum showing the highest permeability [20]. Therefore, we chose this segment to compare active and passive 32P fluxes in WT and Cldn3 KO mice. Additionally, fluxes were also measured in the jejunum, as in mice the expression of NaPi-IIb is by far smaller in this segment than in the ileum [27]; therefore, the contribution of the transcellular pathway to overall Pi absorption is likely small in the jejunum and maximal in the ileum. Accordingly, under both dietary conditions, the active 32P transport measured in the jejunum was much lower than that in the ileum. However, this active component, as well as ileal and jejunal NaPi-IIb protein expression, was similar in Cldn3 KO and WT mice despite the well-established stimulatory effect of calcitriol on NaPi-IIb expression as well as on the active transport of Pi [12, 15]. Under both dietary conditions, the paracellular flux of Pi was also higher in the ileum than in the jejunum (corresponding to the highest Pi permeability reported in the ileal segment [20]), but it was not altered by the absence of Cldn3. The symmetry of the transport (a hallmark of passive transport) was confirmed by measuring equivalent fluxes and permeabilities when establishing a 70 mM Pi concentration gradient from either side of the epithelium. Notably, a 2 mM Pi concentration gradient did not result in similar fluxes but led to higher apical-to-basolateral than basolateral-to-apical transport, suggesting that this gradient is not large enough to drive sufficient passive transport as to mask the contribution of the active component. In contrast to the paracellular pathway, transcellular absorption of Pi is unidirectional (apical-to-basolateral) and is mostly driven by NaPi-IIb whose affinity for Pi is very high (Km in the µM range [16]). This high affinity together with the use of a relatively small Pi gradient (for comparison, up to ≈20 mM Pi difference between intestinal lumen and plasma has been reported in mice under normal dietary conditions [20, 25]) may have contributed to the detection of mostly the active component in the bidirectional experiments performed with the 2 mM gradient. The observation that deletion of Cldn3 did not alter intestinal tight junction permeability for Pi was subsequently confirmed with dilution potential measurements in the jejunum and ileum of mice fed on high Pi, where the permeability of the epithelia for Pi (as well as for Na+, Ca2+, and Cl−) was found to be similar in Cldn3 KO and WT animals. These findings are in contrast with the previous report suggesting that Cldn3 tightens the paracellular route for Pi absorption [11]. This suggestion was exclusively based on the observation that transport of Pi into everted sacs from the jejunum, ileum, and colon from Cldn3 KO was higher than in segments from WT mice. These experiments were performed in the presence of 1.2 mM Pi (a concentration that as discussed above does not effectively discriminate between the active and passive components), but with no Na+ added to the transport solution (which may have reduced the Na+-dependent component). The mice used in Hashimoto’s work as well as the ones used in ours were both generated on a mixed background (129S and C57BL/6 backcrossed into C57BL/6). In both lines, the single exon of Cldn3 is deleted; therefore, the genetic background of the animals is not likely to explain the differences between studies.
The permeability for Ca2+ in the jejunum and ileum of Cldn3 KO mice was similar to the one observed in WT upon high Pi challenge. Moreover, none of the analyzed channels/transporters associated with Ca2+ handling was altered in the intestine of KO mice. For instance, the jejunal and ileal protein expression of Cldn2 and jejunal gene expression of Cldn12 remained unaffected in Cldn3 KOs, despite the stimulating effect of calcitriol on these genes described both in vivo and in vitro [10]. Also, the expression of several components of the transcellular pathway for Ca2+ absorption was similar in both genotypes. This includes the jejunal mRNA expression of Nhe3 and Atp2b, the genes coding the apical Na+/H+ exchanger NHE3 and the basolateral plasma membrane Ca2+ ATPase (PMCA2), as well as the jejunal and ileal protein and/or gene expression of the Vdr and calbindin-D28k, despite these genes known to be regulated by calcitriol [24].
Interestingly, while no changes in intestinal paracellular permeability of Ca2+ were observed in Cldn3 KO mice (at least in the jejunum and ileum), they showed diminished urinary excretion of Ca2+ upon the high Pi challenge together with high calcitriol, though the mRNA expression of Trpv5 and Trpv6 was similar in both genotypes. The cause of elevated calcitriol levels in Cldn3 KO remains elusive. We speculate that absence of Cldn3 may indirectly alter intestinal Ca2+ absorption and that this effect is even further enhanced under conditions of high dietary Pi intake where Pi can precipitate with Ca2+ in the intestine and further reduce its bioavailability.
The inverse correlation between Cldn3 and calcitriol that we found in our study has already been observed by two other groups. Fujita and colleagues noted enhanced jejunal gene expression of Cldn3 in VDR-KO mice compared to WT [10], while Kutuzova and DeLuca reported diminished duodenal Cldn3 expression in rats upon calcitriol treatment [24]. Indeed, the suppressing effects of the VDR-agonist lithocholic acid on claudin-3 were only observed in WT but not in Vdr-KO mice [11]. The VDR-mediated calcitriol signaling therefore downregulates Cldn3, and our study appears to confirm that the genetic deletion of Cldn3 reciprocally stimulates calcitriol production in mice. Previously, we demonstrated in mice that calcitriol stimulates only trans- but not paracellular Pi transport [14], consistent with clinical observations in humans. The interpretation that lithocholic acid regulates in a VDR-dependent manner Cldn3-dependent paracellular Pi permeability is thus unlikely. Nevertheless, why calcitriol’s effects on Pi and Ca2+ metabolism are not present in the Cldn3 KO mice is currently unknown, as the baseline phenotype of these mice already showed elevated levels of the hormone without any abnormalities in Pi or Ca2+ handling. A possible explanation could be a desensitization to calcitriol as a result of the deletion of Cldn3, as these mice also showed increased Vdr gene expression in the kidney. Further analysis is therefore necessary to elucidate the exact molecular pathway underlying this inverse correlation.
In summary, our study does not provide evidence for altered Pi handling and homeostasis in Cldn3 KO mice, though calcitriol is increased and associates with hypocalciuria in Cldn3 KO mice challenged with high dietary Pi.
Supplementary Information
Below is the link to the electronic supplementary material.
Acknowledgements
The use of the Zurich Integrative Rodent Physiology platform is gratefully acknowledged.
Author contribution
ZR, US, EMPA, SH performed experiments, DM, TB provided mice, ZR, NHi, MB, NHe, CAW analyzed data, ZR, NHe, CAW designed experiments, ZR, NHe and CAW wrote the manuscript. All coauthors edited and approved the manuscript.
Funding
Open access funding provided by University of Zurich This study was supported by a grant from the Swiss National Science Foundation (Schweizerischer Nationalfonds zur Förderung der Wissenschaftlichen Forschung) to CAW (212303). DM was supported by the Deutsche Forschungsgemeinschaft (DFG, German Research Foundation)-GRK 2318–318905415. ZR was supported by a Candoc grant from the University of Zurich.
Data availability
The data that supports the findings of this study are available in the supplementary material of this article.
Declarations
Conflict of interest
CAW reports honoraria from Medice and Kyowa Kirin and collaborations with Chugai and Bayer AG outside this study. The rest of the authors declare having no conflict of interest.
Footnotes
NH and CAW share last authorship.
Publisher's Note
Springer Nature remains neutral with regard to jurisdictional claims in published maps and institutional affiliations.
References
- 1.Adeney KL, Siscovick DS, Ix JH, Seliger SL, Shlipak MG, Jenny NS, Kestenbaum BR (2009) Association of serum phosphate with vascular and valvular calcification in moderate CKD. J Am Soc Nephrol JASN 20:381–387. 10.1681/ASN.2008040349 10.1681/ASN.2008040349 [DOI] [PMC free article] [PubMed] [Google Scholar]
- 2.Biber J, Stieger B, Stange G, Murer H (2007) Isolation of renal proximal tubular brush-border membranes. Nat Protoc 2:1356–1359. 10.1038/nprot.2007.156 10.1038/nprot.2007.156 [DOI] [PubMed] [Google Scholar]
- 3.Block GA, Hulbert-Shearon TE, Levin NW, Port FK (1998) Association of serum phosphorus and calcium x phosphate product with mortality risk in chronic hemodialysis patients: a national study. Am J Kidney Dis Off J Natl Kidney Found 31:607–617. 10.1053/ajkd.1998.v31.pm9531176 10.1053/ajkd.1998.v31.pm9531176 [DOI] [PubMed] [Google Scholar]
- 4.Coyne CB, Gambling TM, Boucher RC, Carson JL, Johnson LG (2003) Role of claudin interactions in airway tight junctional permeability. Am J Physiol Lung Cell Mol Physiol 285:L1166-1178. 10.1152/ajplung.00182.2003 10.1152/ajplung.00182.2003 [DOI] [PubMed] [Google Scholar]
- 5.Custer M, Lötscher M, Biber J, Murer H, Kaissling B (1994) Expression of Na-P(i) cotransport in rat kidney: localization by RT-PCR and immunohistochemistry. Am J Physiol 266:F767-774. 10.1152/ajprenal.1994.266.5.F767 10.1152/ajprenal.1994.266.5.F767 [DOI] [PubMed] [Google Scholar]
- 6.Dhingra R, Sullivan LM, Fox CS, Wang TJ, D’Agostino RB, Gaziano JM, Vasan RS (2007) Relations of serum phosphorus and calcium levels to the incidence of cardiovascular disease in the community. Arch Intern Med 167:879–885. 10.1001/archinte.167.9.879 10.1001/archinte.167.9.879 [DOI] [PubMed] [Google Scholar]
- 7.Fiske CH (1925) The colorimetric determination of phosphorus. J Biol Chem 66:375–400 10.1016/S0021-9258(18)84756-1 [DOI] [Google Scholar]
- 8.Foley RN, Collins AJ, Herzog CA, Ishani A, Kalra PA (2009) Serum phosphorus levels associate with coronary atherosclerosis in young adults. J Am Soc Nephrol JASN 20:397–404. 10.1681/ASN.2008020141 10.1681/ASN.2008020141 [DOI] [PMC free article] [PubMed] [Google Scholar]
- 9.Fujita H, Hamazaki Y, Noda Y, Oshima M, Minato N (2012) Claudin-4 deficiency results in urothelial hyperplasia and lethal hydronephrosis. PLoS ONE 7:e52272. 10.1371/journal.pone.0052272 10.1371/journal.pone.0052272 [DOI] [PMC free article] [PubMed] [Google Scholar]
- 10.Fujita H, Sugimoto K, Inatomi S, Maeda T, Osanai M, Uchiyama Y, Yamamoto Y, Wada T, Kojima T, Yokozaki H, Yamashita T, Kato S, Sawada N, Chiba H (2008) Tight junction proteins claudin-2 and -12 are critical for vitamin D-dependent Ca2+ absorption between enterocytes. Mol Biol Cell 19:1912–1921. 10.1091/mbc.e07-09-0973 10.1091/mbc.e07-09-0973 [DOI] [PMC free article] [PubMed] [Google Scholar]
- 11.Hashimoto N, Matsui I, Ishizuka S, Inoue K, Matsumoto A, Shimada K, Hori S, Lee DG, Yasuda S, Katsuma Y, Kajimoto S, Doi Y, Yamaguchi S, Kubota K, Oka T, Sakaguchi Y, Takabatake Y, Hamano T, Isaka Y (2020) Lithocholic acid increases intestinal phosphate and calcium absorption in a vitamin D receptor dependent but transcellular pathway independent manner. Kidney Int 97:1164–1180. 10.1016/j.kint.2020.01.032 10.1016/j.kint.2020.01.032 [DOI] [PubMed] [Google Scholar]
- 12.Hattenhauer O, Traebert M, Murer H, Biber J (1999) Regulation of small intestinal Na-P(i) type IIb cotransporter by dietary phosphate intake. Am J Physiol 277:G756-762. 10.1152/ajpgi.1999.277.4.G756 10.1152/ajpgi.1999.277.4.G756 [DOI] [PubMed] [Google Scholar]
- 13.Hernando N, Myakala K, Simona F, Knöpfel T, Thomas L, Murer H, Wagner CA, Biber J (2015) Intestinal depletion of NaPi-IIb/Slc34a2 in mice: renal and hormonal adaptation. J Bone Miner Res Off J Am Soc Bone Miner Res 30:1925–1937. 10.1002/jbmr.2523 10.1002/jbmr.2523 [DOI] [PubMed] [Google Scholar]
- 14.Hernando N, Pastor-Arroyo EM, Marks J, Schnitzbauer U, Knöpfel T, Bürki M, Bettoni C, Wagner CA (2021) 1,25(OH)2 vitamin D3 stimulates active phosphate transport but not paracellular phosphate absorption in mouse intestine. J Physiol 599:1131–1150. 10.1113/JP280345 10.1113/JP280345 [DOI] [PubMed] [Google Scholar]
- 15.Hernando N, Wagner CA (2018) Mechanisms and regulation of intestinal phosphate absorption. Compr Physiol 8:1065–1090. 10.1002/cphy.c170024 10.1002/cphy.c170024 [DOI] [PubMed] [Google Scholar]
- 16.Hilfiker H, Hattenhauer O, Traebert M, Forster I, Murer H, Biber J (1998) Characterization of a murine type II sodium-phosphate cotransporter expressed in mammalian small intestine. Proc Natl Acad Sci U S A 95:14564–14569. 10.1073/pnas.95.24.14564 10.1073/pnas.95.24.14564 [DOI] [PMC free article] [PubMed] [Google Scholar]
- 17.Hou J, Renigunta A, Yang J, Waldegger S (2010) Claudin-4 forms paracellular chloride channel in the kidney and requires claudin-8 for tight junction localization. Proc Natl Acad Sci U S A 107:18010–18015. 10.1073/pnas.1009399107 10.1073/pnas.1009399107 [DOI] [PMC free article] [PubMed] [Google Scholar]
- 18.Juan D, Liptak P, Gray TK (1976) Absorption of inorganic phosphate in the human jejunum and its inhibition by salmon calcitonin. J Clin Endocrinol Metab 43:517–522. 10.1210/jcem-43-3-517 10.1210/jcem-43-3-517 [DOI] [PubMed] [Google Scholar]
- 19.Kestenbaum B, Sampson JN, Rudser KD, Patterson DJ, Seliger SL, Young B, Sherrard DJ, Andress DL (2005) Serum phosphate levels and mortality risk among people with chronic kidney disease. J Am Soc Nephrol JASN 16:520–528. 10.1681/ASN.2004070602 10.1681/ASN.2004070602 [DOI] [PubMed] [Google Scholar]
- 20.Knöpfel T, Himmerkus N, Günzel D, Bleich M, Hernando N, Wagner CA (2019) Paracellular transport of phosphate along the intestine. Am J Physiol Gastrointest Liver Physiol 317:G233–G241. 10.1152/ajpgi.00032.2019 10.1152/ajpgi.00032.2019 [DOI] [PubMed] [Google Scholar]
- 21.Knöpfel T, Pastor-Arroyo EM, Schnitzbauer U, Kratschmar DV, Odermatt A, Pellegrini G, Hernando N, Wagner CA (2017) The intestinal phosphate transporter NaPi-IIb (Slc34a2) is required to protect bone during dietary phosphate restriction. Sci Rep 7:11018. 10.1038/s41598-017-10390-2 10.1038/s41598-017-10390-2 [DOI] [PMC free article] [PubMed] [Google Scholar]
- 22.Kolek OI, Hines ER, Jones MD, LeSueur LK, Lipko MA, Kiela PR, Collins JF, Haussler MR, Ghishan FK (2005) 1alpha,25-Dihydroxyvitamin D3 upregulates FGF23 gene expression in bone: the final link in a renal-gastrointestinal-skeletal axis that controls phosphate transport. Am J Physiol Gastrointest Liver Physiol 289:G1036-1042. 10.1152/ajpgi.00243.2005 10.1152/ajpgi.00243.2005 [DOI] [PubMed] [Google Scholar]
- 23.Kooij G, Kopplin K, Blasig R, Stuiver M, Koning N, Goverse G, van der Pol SMA, van Het Hof B, Gollasch M, Drexhage JAR, Reijerkerk A, Meij IC, Mebius R, Willnow TE, Müller D, Blasig IE, de Vries HE (2014) Disturbed function of the blood-cerebrospinal fluid barrier aggravates neuro-inflammation. Acta Neuropathol (Berl) 128:267–277. 10.1007/s00401-013-1227-1 10.1007/s00401-013-1227-1 [DOI] [PubMed] [Google Scholar]
- 24.Kutuzova GD, Deluca HF (2004) Gene expression profiles in rat intestine identify pathways for 1,25-dihydroxyvitamin D(3) stimulated calcium absorption and clarify its immunomodulatory properties. Arch Biochem Biophys 432:152–166. 10.1016/j.abb.2004.09.004 10.1016/j.abb.2004.09.004 [DOI] [PMC free article] [PubMed] [Google Scholar]
- 25.Marks J, Lee GJ, Nadaraja SP, Debnam ES, Unwin RJ (2015) Experimental and regional variations in Na+-dependent and Na+-independent phosphate transport along the rat small intestine and colon. Physiol Rep 3:e12281. 10.14814/phy2.12281 10.14814/phy2.12281 [DOI] [PMC free article] [PubMed] [Google Scholar]
- 26.Milatz S, Krug SM, Rosenthal R, Günzel D, Müller D, Schulzke J-D, Amasheh S, Fromm M (2010) Claudin-3 acts as a sealing component of the tight junction for ions of either charge and uncharged solutes. Biochim Biophys Acta 1798:2048–2057. 10.1016/j.bbamem.2010.07.014 10.1016/j.bbamem.2010.07.014 [DOI] [PubMed] [Google Scholar]
- 27.Radanovic T, Wagner CA, Murer H, Biber J (2005) Regulation of intestinal phosphate transport. I. Segmental expression and adaptation to low-P(i) diet of the type IIb Na(+)-P(i) cotransporter in mouse small intestine. Am J Physiol Gastrointest Liver Physiol 288:G496-500. 10.1152/ajpgi.00167.2004 10.1152/ajpgi.00167.2004 [DOI] [PubMed] [Google Scholar]
- 28.Rubio-Aliaga I, Krapf R (2022) Phosphate intake, hyperphosphatemia, and kidney function. Pflugers Arch 474:935–947. 10.1007/s00424-022-02691-x 10.1007/s00424-022-02691-x [DOI] [PMC free article] [PubMed] [Google Scholar]
- 29.Russell J, Ashok S, Koszewski NJ (1999) Vitamin D receptor interactions with the rat parathyroid hormone gene: synergistic effects between two negative vitamin D response elements. J Bone Miner Res Off J Am Soc Bone Miner Res 14:1828–1837. 10.1359/jbmr.1999.14.11.1828 10.1359/jbmr.1999.14.11.1828 [DOI] [PubMed] [Google Scholar]
- 30.Sabbagh Y, O’Brien SP, Song W, Boulanger JH, Stockmann A, Arbeeny C, Schiavi SC (2009) Intestinal npt2b plays a major role in phosphate absorption and homeostasis. J Am Soc Nephrol JASN 20:2348–2358. 10.1681/ASN.2009050559 10.1681/ASN.2009050559 [DOI] [PMC free article] [PubMed] [Google Scholar]
- 31.Saito H, Maeda A, Ohtomo S-I, Hirata M, Kusano K, Kato S, Ogata E, Segawa H, Miyamoto K-I, Fukushima N (2005) Circulating FGF-23 is regulated by 1alpha,25-dihydroxyvitamin D3 and phosphorus in vivo. J Biol Chem 280:2543–2549. 10.1074/jbc.M408903200 10.1074/jbc.M408903200 [DOI] [PubMed] [Google Scholar]
- 32.Saurette M, Alexander RT (2019) Intestinal phosphate absorption: the paracellular pathway predominates? Exp Biol Med Maywood NJ 244:646–654. 10.1177/1535370219831220 10.1177/1535370219831220 [DOI] [PMC free article] [PubMed] [Google Scholar]
- 33.Schlemmer U, Frølich W, Prieto RM, Grases F (2009) Phytate in foods and significance for humans: food sources, intake, processing, bioavailability, protective role and analysis. Mol Nutr Food Res 53(Suppl 2):S330-375. 10.1002/mnfr.200900099 10.1002/mnfr.200900099 [DOI] [PubMed] [Google Scholar]
- 34.Shigematsu T, Kono T, Satoh K, Yokoyama K, Yoshida T, Hosoya T, Shirai K (2003) Phosphate overload accelerates vascular calcium deposition in end-stage renal disease patients. Nephrol Dial Transplant Off Publ Eur Dial Transpl Assoc - Eur Ren Assoc 18(Suppl 3):iii86-89. 10.1093/ndt/gfg1022 10.1093/ndt/gfg1022 [DOI] [PubMed] [Google Scholar]
- 35.Silver J, Naveh-Many T, Mayer H, Schmelzer HJ, Popovtzer MM (1986) Regulation by vitamin D metabolites of parathyroid hormone gene transcription in vivo in the rat. J Clin Invest 78:1296–1301. 10.1172/JCI112714 10.1172/JCI112714 [DOI] [PMC free article] [PubMed] [Google Scholar]
- 36.Suzuki T (2013) Regulation of intestinal epithelial permeability by tight junctions. Cell Mol Life Sci CMLS 70:631–659. 10.1007/s00018-012-1070-x 10.1007/s00018-012-1070-x [DOI] [PMC free article] [PubMed] [Google Scholar]
- 37.Tanaka H, Imasato M, Yamazaki Y, Matsumoto K, Kunimoto K, Delpierre J, Meyer K, Zerial M, Kitamura N, Watanabe M, Tamura A, Tsukita S (2018) Claudin-3 regulates bile canalicular paracellular barrier and cholesterol gallstone core formation in mice. J Hepatol 69:1308–1316. 10.1016/j.jhep.2018.08.025 10.1016/j.jhep.2018.08.025 [DOI] [PubMed] [Google Scholar]
- 38.Tokuda S, Furuse M (2015) Claudin-2 knockout by TALEN-mediated gene targeting in MDCK cells: claudin-2 independently determines the leaky property of tight junctions in MDCK cells. PLoS ONE 10:e0119869. 10.1371/journal.pone.0119869 10.1371/journal.pone.0119869 [DOI] [PMC free article] [PubMed] [Google Scholar]
- 39.Wagner CA (2013) The calcium-sensing receptor directly regulates proximal tubular functions. Kidney Int 84:228–230. 10.1038/ki.2013.128 10.1038/ki.2013.128 [DOI] [PubMed] [Google Scholar]
- 40.Walton J (1979) Gray TK (1979) Absorption of inorganic phosphate in the human small intestine. Clin Sci Lond Engl 56:407–412. 10.1042/cs0560407 10.1042/cs0560407 [DOI] [PubMed] [Google Scholar]
Associated Data
This section collects any data citations, data availability statements, or supplementary materials included in this article.
Supplementary Materials
Data Availability Statement
The data that supports the findings of this study are available in the supplementary material of this article.


