Abstract
The three-dimensional structures of two DNA duplexes d(CATGAGTAC)·d(GTACXCATG) (1) and d(CATGAGTAC)·d(GTACTCATG) (2), where X represents 1-(2′-deoxy-β-d-ribofuranosyl)-3-nitropyrrole, were solved using high resolution nuclear magnetic resonance spectroscopy and restrained molecular dynamics. Good convergence was observed between final structures derived from A- and B-form starting geometries for both 1 and 2. Structures of 1 and 2 are right-handed duplexes within the B-form conformational regime. Furthermore, the structures of 1 and 2 are highly similar, with differences in the structures localized to the vicinity of residue 14 (X versus T). The pyrrole group of 1 is in the syn conformation and it is displaced towards the major groove. Furthermore, unlike T14 in 2, the base of X14 has reduced π–π stacking interactions with C13 and C15 and the nitro group of X14 is pointing out of the major groove. The structures presented here establish the basis of the thermal data of DNA duplexes containing X and should be informative during the design of improved wild card nucleobase analogs.
INTRODUCTION
Nucleic acid base analogs that are able to form base pairs with all four DNA bases with equal affinity would be useful as wild cards in the design of oligonucleotide probes for genes where only the protein sequence is known. The search for such a universal base has been intensive in recent years (1–19). One candidate, 1-(2′-deoxy-β-d-ribofuranosyl)-3-nitropyrrole (Fig. 2B) was synthesized and shown by thermal denaturation studies to pair with the four naturally occurring bases with little discrimination (20,21). 3-Nitropyrrole was designed to stack well and hydrogen bond poorly. The nitro group was chosen to polarize the electrostatic potential of the π-aromatic system of the pyrrole in order to enhance vertical stacking interactions, and calculations showed both the permanent and dipole-induced dipole moments of 3-nitropyrrole to enhance base stacking interactions (21). Because of this property 3-nitropyrrole and related non-hydrogen bonding nitroazole nucleoside analogs are finding increased utility as tools for nucleic acid analysis (22–28).
Figure 2.
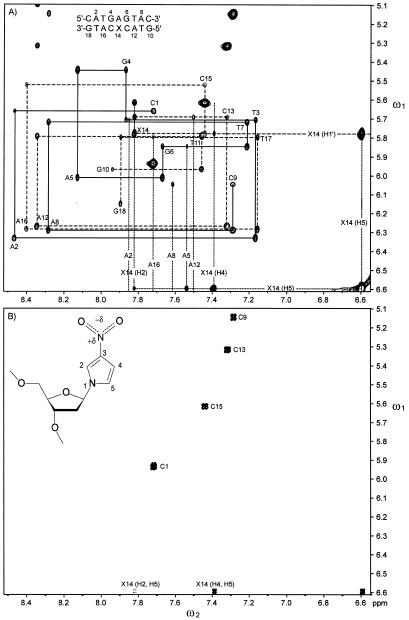
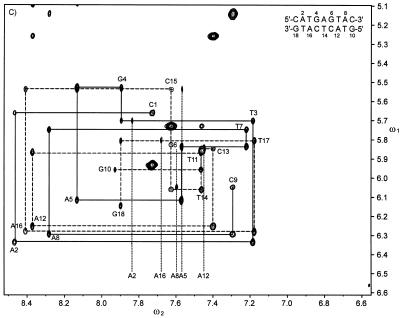
Expansions of (A) D2O NOESY and (B) 2QF-COSY spectra of 1 and of a (C) D2O NOESY spectrum of 2. In the NOESY spectra: solid lines, uninterrupted connectivities of residues 1–9; dashed lines, uninterrupted connectivities of residues 10–18. Dotted lines, adenine H2 and 3-nitropyrrole H2, H4 and H5 chemical shifts. Inset, 1-(2′-deoxy-β-d-ribofuranosyl)-3-nitropyrrole in the syn conformation.
Molecular modeling indicated that 3-nitropyrrole should fit opposite any of the natural bases in a DNA duplex without distorting the duplex (21). However, the relatively low Tm values for nitropyrrole containing oligonucleotides raised a question about how well it may stack between the natural bases within the duplex (21). In addition, Amosova et al. (22) used UV thermal melting data of single-, double- and triple-stranded DNAs that contain 3-nitropyrrole to suggest that 3-nitropyrrole does not stack well. The authors postulated that the poor ability of 3-nitropyrrole to stack was due to the bulkiness, hydrophilicity and dipole moment of the nitro substituent. As knowledge of the structural basis of the thermal data would be instructive towards the design of improved nucleobase analogs, we solved the three-dimensional structures of d(CATGAGTAC)·d(GTACXCATG), hereafter referred to as 1, where X represents 1-(2′-deoxy-β-d-ribofuranosyl)-3-nitropyrrole, and the unmodified sequence, 2, d(CATGAGTAC)·d(GTACTCATG). The choice of DNA sequence was based on earlier work that demonstrated samples of d(CATGAGTAC)·d(GTAC–CATG) with an abasic site showed a chemical shift dispersion and a stability (29,30) suitable for structure determination by nuclear magnetic resonance (NMR). Two-dimensional NOESY spectra of 1 and 2 were used to obtain interproton constraints and distances were generated from the data using the complete relaxation matrix approach. Restrained molecular dynamics, rMD, were applied to energy minimized A- and B-form starting models to generate the structures presented here. These results provide insight into the molecular basis of earlier thermodynamic (21,22) and enzymatic observations (9).
MATERIALS AND METHODS
Sample preparation
The synthesis of 1-(2′-deoxy-β-d-ribofuranosyl)-3-nitropyrrole was carried out as described previously (21). Phosphoramidite chemistry was used to synthesize the nine base oligonucleotides on an automated MilliGen/Biosearch Model 7850 Multiple Column DNA synthesizer at the 15 µmol scale with standard β-cyanoethyl phosphoramidite chemistry for large-scale reactions. The concentration of all phosphoramidites was 50 mg/ml (68 µmol/ml). Solid support was weighed into a large-scale synthesis column (200 mg, 20 µmol) and flushed with anhydrous acetonitrile on the instrument. Prior to the first run, each phosphoramidite reservoir was purged five times with acetonitrile to ensure that the system was dry. The trityl group on the last base added to the 5′-end of the oligonucleotide was left on to aid in the HPLC purification. Once the synthesis was complete, the oligonucleotide was removed from the solid support by soaking the support in the column with fresh concentrated NH4OH (4 × 4 ml) for 30 min. Deprotection was carried out by combining the aqueous fractions and heating to 55°C overnight. The ammonia was removed by vacuum centrifugation and the product was dried by lyophilization. The oligonucleotide was separated from failure sequences by preparative HPLC with a PRP-1 column. The elution method was a gradient of aqueous buffer (0.01 M triethylammonium acetate adjusted to pH 7.5) and acetonitrile (20–40% in 40 min). To remove the last trityl group, the desired fractions were combined, treated with 2 ml of glacial acetic acid and lyophilized to dryness. The detritylated oligonucleotide was purified by preparative HPLC with a PRP-1 column. The product was collected and lyophilized to dryness. The sodium form of the oligonucleotides was prepared as follows: a 5 ml disposable pipette was loaded with Dowex AG 50W-4X ion exchange resin (2.5 ml, 2.75 mEq). The resin was cleaned by treatment with ethanol (2 × 5 ml), water (2 × 5 ml), 1.0 M HCl (3 × 5 ml) and water (3 × 5 ml). The resin was then converted to the sodium form by treatment with 1.0 M NaOH (2 × 5 ml) and washed with water until the elution pH was 7. The oligonucleotide was dissolved in 500 µl of sterile water and passed through the ion exchange resin. The resulting oligonucleotide was then lyophilized to dryness.
A 1:1 ratio of d(CATGAGTAC):d(GTACXCATG) was accomplished by titration of one strand with the other at 80°C in 99.99% D2O (Isotec, Miamisburg, OH) while monitoring the aromatic peak intensities with one-dimensional NMR. This was performed quickly so as to minimize exchange of purine H8 protons for deuterons (31). Subsequently, the sample was lyophilized to dryness and redissolved in 300 µl of buffer which consisted of 100 mM NaCl, 10 mM Na2PO4, 1 mM EDTA pH 7, 100% H2O. The final duplex concentrations for both 1 and 2 were ∼4.5 mM. The samples were placed in thermal contact with 4 l of water at 80°C and allowed to cool slowly overnight. The samples were then lyophilized and redissolved in either 5% D2O/95% H2O for the H2O NOESY experiments or 99.996% D2O (Isotec) for 2QF-COSY and D2O experiments.
NMR spectroscopy
NMR spectra were collected either at the Biomolecular NMR Laboratory at Texas A&M University on 14.1 or 11.7 T Inova spectrometers or at Purdue University on a UnityPlus 14.1 T spectrometer. 2QF-COSY spectra were collected on samples in 99.996% D2O as 512* × 1024* matrices (n* represents n complex points) in the t1 and t2 dimensions which yielded acquisition times of 102.4 and 204.8 ms, respectively. The total acquisition time was 23 h per spectrum. Two-dimensional NOESY spectra of samples dissolved in 99.996% D2O were collected as 475* × 768* matrices with corresponding acquisition times of 85.5 and 138.2 ms in the t1 and t2 dimensions, respectively. The mixing time was 120 ms and the relaxation delay was 9.8 s. Total acquisition time per spectrum was 21.4 h. Solvent suppression during acquisition of NOESY spectra of samples in 5% D2O/95% H2O was accomplished with the WATERGATE sequence (32). H2O NOESY spectra were acquired with a mixing time of 200 ms. All two-dimensional spectra of 1 and 2 were collected at 5 and 12°C, respectively.
Structure calculation
The structures were calculated with the program X-PLOR with the simulated annealing protocol ‘refine_gentle.inp’ (33). The force field used was that developed by Nilsson and Karplus (34). The protocol was applied to ideal, energy minimized A- and B-form starting structures of 1 and 2. NOE-derived distances and hydrogen bond constraints were given force constants of 25 kcal mol–1 Å–2. The force constants for dihedral angle constraints were 200 kcal mol–1 rad–2. Simulated annealing refinement using the Verlet algorithm was computed for 20 ps in 1 fs steps with heating to 900 K for the generation of a family of 50 structures. The program CORMA (35–37) was used to calculate the sixth-root residual index, Rx = Σi|Vexp1/6(i) – Vcalc1/6(i)|/ΣiVexp1/6(i), for each of the 50 structures in order to assess how well the structures were able to reproduce experimental NOE values (38). Vexp(i) and Vcalc(i) are the measured and theoretical volumes of cross peak i, respectively. Unassigned NOESY cross peaks used for lower bound distance constraints were not included in the calculation of Rx values. Ten A- and B-form-derived structures (20 total) with the lowest Rx were then averaged and energy-minimized to generate a single representative structure. The final structures of 1 and 2 have been deposited at the Protein Data Bank (39) and their deposition numbers are 1DK6 and 1DK9, respectively.
RESULTS
Resonance assignments
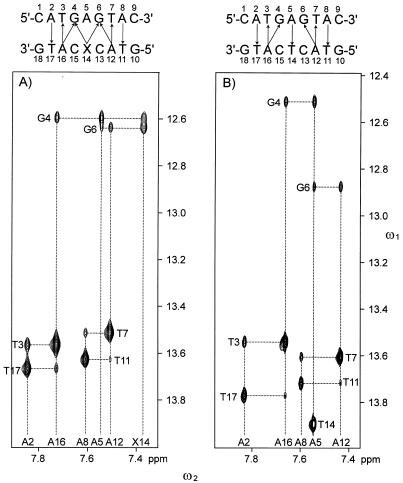
All chemical shifts of non-exchangeable protons except those of H5′ and H5″ of 1 and 2 and H4′ resonances of T14 and C15 of 1 were assigned (relative to DSS) with established techniques (40–42). All imino resonances were also assigned (Supplementary Material). Shown in Figure 1 are the adenine H2 (ω2), imino (ω1) regions of H2O NOESY spectra of 1 and 2. A cross peak between the H2 of an adenine and the imino proton of the opposing thymine was observed for every A:T base pair in both 1 and 2. In addition, the H2 protons of A12 and A16 had NOEs to the imino protons of G6 and G4, respectively. The interstrand NOEs between H4 of X14 and the imino protons of G4 and G5 establish that X14 is directed towards the center of the helix. These interstrand NOESY cross peaks facilitated the assignment of the imino resonances and helped establish the duplex nature of the oligonucleotides. Shown in Figure 2 are aromatic (ω2), H1′/cytosine H5 (ω1) regions of the D2O NOESY and 2QF-COSY spectra of 1 and 2. These spectra were used to assign the chemical shifts of H2, H4 and H5 of X14. As seen in Figure 2A and B, the sequential connectivities implicate three resonances (6.59, 7.39 and 7.82 p.p.m.) as belonging to the base of X14 and the resonance at 5.78 p.p.m. as that of the anomeric proton of X14. The stronger and weaker couplings between the proton at 6.59 p.p.m. with those at 7.39 and 7.82 p.p.m., respectively, indicate that the 6.59 p.p.m. resonance belongs to H5, the 7.39 p.p.m. resonance to H4 and the 7.82 p.p.m. resonance to H2. NMR spectra of purified 1-(2′-deoxy-β-d-ribofuranosyl)-3-nitropyrrole in methanol showed the chemical shifts of H5, H4 and H2 to be 6.68, 7.01 and 7.98 p.p.m. relative to TMS, respectively (21). The JH4H5 and JH2H5 coupling constants of 1-(2′-deoxy-β-d-ribofuranosyl)-3-nitropyrrole were found to be 3.5 and 2.0 Hz, respectively (21). Both the chemical shifts and JHH couplings of 1-(2′-deoxy-β-d-ribofuranosyl)-3-nitropyrrole were entirely consistent with those found for X14 in 1.
Figure 1.
An expansion of H2O NOESY spectra of (A) 1 and (B) 2 in the aromatic to imino proton region. Dashed vertical lines, the positions of the resonances of the H2 and H4 protons of the adenine and 3-nitropyrrole residues; dashed horizontal lines, the positions of the resonances of the imino protons of the cytosine and guanine residues; solid arrows, interstrand cross peaks observed in the spectra.
Analysis of the spectra
Numerous interstrand NOESY cross peaks between adenine H2 and imino (Fig. 1) and H1′ protons (Fig. 2A and C) along the length of 1 and 2 established that these molecules formed a stable duplex. The intensity of the intraresidue cross peak between H5 and H1′ of X14 of 1 was comparable to the H5, H6 cross peaks of the cytosine residues (Fig. 2A), which indicated that the conformation of X14 was syn (the nitro group is located over the sugar ring when X14 is viewed along its glycosidic bond). The integrated intensities of the intra-residue H2 to H1′ and H4 to H1′ cross peaks of X14 were 0.30 and 0.10 times as strong as that of the H5 to H1′ cross peak, respectively, which were also consistent with a syn conformation. The other residues of 1 and all residues of 2 were in the anti conformation about the χ angle. Also, NOEs between H4 of X14 with the imino protons of G4 and G6 (Fig. 1), and between H5 of X14 and H2 of A5 indicated that the 3-nitropyrrole group was in a stable conformation opposite A5 within the DNA helix. Furthermore, NOEs were observed between H2 of X14 and H1′ and H5 protons of C13 and C15 (Fig. 2A), respectively, which indicated that the pyrrole group was packed in the interior of the duplex between the flanking cytosines. Excluding distance constraints involving H5′/H5″ and dihedral angle constraints, 28 non-trivial interproton constraints for X14 were generated from NOESY data and used in X-PLOR calculations as compared to 24 constraints for T14 in 2.
Determination of conformational constraints
Conformational constraints for both 1 and 2 were determined from D2O NOESY spectra collected with a mixing time of 120 ms. The delay between scans was 9.8 s in order to ensure that the protons of 1 and 2 were not differentially saturated to any significant degree (38). Two-dimensional non-linear line fitting of the cross peaks on both sides of the diagonal was performed with the program nlinLS, which is part of the NMRPipe software package (43) and the calculated line shape was used to obtain the cross peak volumes. The goodness of fit (χ2) was estimated with the following equation:
χ2 = (Iexp – Ifit)2/σ2
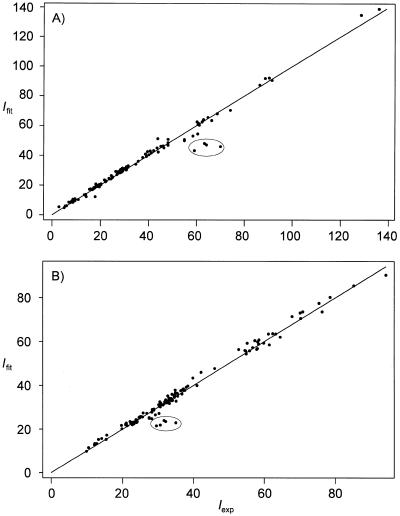
where Iexp and Ifit are the experimental and calculated cross peak intensities, respectively, and σ is the noise of spectrum. The average χ2 values for all non-overlapping cross peaks that were used to generate distance limits were calculated to be 14 and 5 for 1 and 2, respectively. Figure 3 shows correlation plots between Iexp and Ifit for resolved cross peaks on both sides of the diagonal. Corresponding volumes across the diagonal were averaged and the pairwise root mean square (r.m.s.) difference was used as an estimate of the uncertainty in the cross peak volume.
Figure 3.
Correlation plots of D2O NOESY cross peak intensities determined experimentally (Iexp) and from a two-dimensional fit (Ifit) of the (resolved) experimental cross peaks for both (A) 1 and (B) 2. Corresponding cross peaks across the diagonal were not averaged in these plots and the data points correspond to individual cross peaks. Plots such as these are useful for finding poorly fit cross peaks for subsequent refitting. For example, the circled peaks are due to underestimated volumes of methyl (ω2), H1′ (ω1) cross peaks.
The rotational correlation times for both 1 and 2 were estimated to be 3 ± 1 ns based on cytosine H5/H6 cross peak and H5 and H6 diagonal peak intensities in D2O NOESY spectra collected with mixing times of 30 and 60 ms (44). Distances were generated from cross peak volumes of 120 ms mixing time NOESY spectra using a complete relaxation matrix approach with the program RANMARDI (45). Two hundred iterations were carried out by the program RANMARDI where the cross peak volumes were varied randomly by an amount equal to either the uncertainty in the volumes (Fig. 3) or 10% of the cross peak volume, which ever was the larger value. In this manner, a set of 200 distances for each of the integrated cross peaks was generated. The minimum and maximum distances of each set of 200 distances were used as the lower and upper interproton distance constraints for subsequent structure calculations. The average width of the bounds was 20 and 18% of the distance for 1 and 2, respectively. Three hundred and ninety-six and 446 assigned cross peaks from both sides of the diagonal resulted in 198 and 223 non-trivial interproton distance constraints for 1 and 2, respectively.
Dihedral angle constraints for the ɛ angle were determined from indirect measurement of 3JH3′P values from D2O NOESY spectra (46). All H3′ line widths, Δν1/2, were found to be <16 Hz for both 1 and 2. Assuming a natural line width contribution of 3 Hz for the H3′ resonances and a minimum ΣJH3′H (sum of H3′ J couplings) value of 7 Hz (47), an upper limit of 6 Hz for 3JH3′P was obtained. This coupling allowed us to restrain the ɛ angle for all residues between 159 and 232°. Conformational constraints for the β angle were determined from ΣJH5′P and ΣJH5″P as estimated from line widths of the (unassigned) H5′ and H5″ resonances in NOESY spectra (46). The H5′ and H5″ line widths were all <26 Hz. This allowed the conservative restraint of 180 ± 75° for all β angles. Such analyses allowed the addition of 32 dihedral angle constraints for both 1 and 2.
Comparison of the H6/H8–H1′ region of the NOESY spectra with the (unassigned) H6/H8–H5′/H5″, H2′/H2″–H5′/H5″ and H1′–H5′/H5″ regions established that all corresponding distances between base, H1′ and H2′/H2″ to H5′/H5″ are >2.6 Å. Thus, 2.6 Å was used as the lower limit for intraresidue and sequential H6/H8–H5′/H5″, H2′/H2″–H5′/H5″ and H1′–H5′/H5″ constraints. The H1′(i) to H5′/H5″(i+1) lower bound constraints indirectly constrain the α and ζ angles (46). The H2 and H6/H8 to H5′/H5″ constraints help constrain the γ angle. As shown in Figure 1, both 1 and 2 displayed cross-strand NOESY peaks consistent with canonical Watson–Crick base pairs (42). Accordingly, all A:T and G:C base pairs were given wide hydrogen bond constraints, two for A:T and three for G:C base pairs. A constraint of 0.9–3.4 Å was used for the N6···O4, N1···N3 and N2···O2 hydrogen bonds of G:C, and the N6···O4 and N1···N3 hydrogen bonds of A:T. No hydrogen bond angle constraints were applied (48). Also, no attempt was made to extract conformational constraints from the 2QF-COSY spectra and only conservative NOE-derived distance limits were used to constrain the sugar conformations.
DISCUSSION
Analysis of the structures
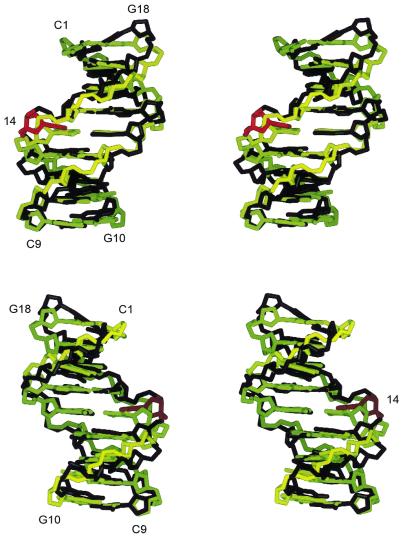
A family of 50 structures was generated by X-PLOR from an energy minimized A-form starting structure with a simulated annealing protocol. Ten structures with the lowest Rx values were averaged with 10 analogously generated B-form derived structures (20 total; Supplementary Material) and then energy minimized to produce a final structure (Fig. 4). The final structures of 1 and 2 were similar (Fig. 4 and Table 1) and minor differences were localized to residues 13–15. The average pairwise r.m.s. differences between the final 20 structures and the mean structures of 1 and 2 for all non-proton atom coordinates were 0.7 ± 0.2 and 0.6 ± 0.2 Å, respectively. When the 10 A- and 10 B-form derived structures were averaged separately and compared, the pairwise r.m.s. differences of the heavy atom coordinates were 0.9 and 0.3 Å for 1 and 2, respectively, which indicates good convergence. Overall, the r.m.s. differences (Table 1) indicate that both 1 and 2 are between ideal A- and B-form geometries. Solution structures of DNA molecules with overall topologies somewhere between A-form and B-form are frequently observed and are not algorithm-dependent (49,50).
Figure 4.
Stereoviews of the final structures of 1 and 2. The final structure of 1 is shown in black except for residue X14, which is shown in red. The final structure of 2 is shown in yellow. Each structure is the energy-minimized average of 10 A- and 10 B-form derived structures. See text for details. The figures were generated by the molecular modeling program SPOCK (56). As there is no experimental data indicating the positions of the oxygen atoms of the nitro group of X14, they are not shown.
Table 1. Pairwise r.m.s. differences between starting and final structures of 1 and 2a.
| A-formb | B-formc | 1d | |
|---|---|---|---|
| B-formc | 5.1 Å | ||
| 1d | 3.1 Å | 2.7 Å | |
| 2e | 3.7 Å | 2.4 Å | 1.3 Å |
aPairwise r.m.s. difference values were calculated between all heavy atom coordinates.
bEnergy minimized A-form starting structure for 1 or 2.
cEnergy minimized B-form starting structure for 1 or 2.
dFinal structure of 1. See text for details.
eFinal structure of 2.
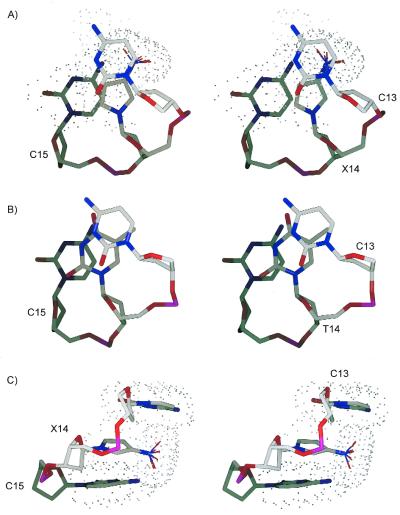
Equally important in measuring the precision of the structures is to assess their accuracy. The accuracies were estimated by comparing the theoretical NOESY cross peak volumes of the final structures, generated by the program CORMA (35,36,51), with the experimental volumes. The Rx values of the final structures are given in Table 2 and indicate that the final structures of 1 and 2 represent the experimental data reasonably well. The Rx values of energy minimized A- and B-form structures show that on a local scale (<5 Å) both 1 and 2 resemble B-form more than A-form (Table 2). Excluding the aromatic protons of residue 14, when the theoretical NOESY cross peak volumes of the final structure of 1 were compared to the experimental spectrum of 2, the Rx value was 0.079. A comparison of the theoretical spectrum of 2 and the experimental data of 1 gave an Rx value of 0.078. These comparisons show that the structures of 1 and 2 are quite similar on a local scale. X14 of 1 was found to be in the syn conformation (Fig. 2C, inset), as was evident from the strong cross peak between H5 and H1′ of X14 in the D2O NOESY spectrum (Fig. 2A). In addition, the A5:X14 base pair in 1 is buckled whereas A5:T14 in 2 is not and the π–π stacking of X14 with C13 and C15 in 1 is reduced relative to the base stacking of C13-T14-C15 in 2 (Fig. 5). Otherwise, 1 and 2 superimpose well (Table 1) and distortions to the helix imparted by 3-nitropyrrole are localized.
Table 2. Statistical analysis of the final structures of 1 and 2a.
| vdWb | Rx c | Bondsd | Anglese | Dihedf | Distance violationsg | |
|---|---|---|---|---|---|---|
| 1h | –262 | 0.066 ± 0.001 (0.159, 0.099) | 0.01 Å | 3.5° | 0.005° | 0 |
| 2i | –262 | 0.072 ± 0.001 (0.186, 0.095) | 0.01 Å | 3.5° | 0.05° | 0 |
aThe final structures of 1 and 2 were the result of energy minimization of the average of 10 A- and 10 B-form derived structures.
bCalculated van der Waals energy in kcal/mol.
cSixth-root R-factor of the 20 final structures as determined by the program CORMA (35,36,51). The values in parentheses are the Rx values of the starting A- or B-form models, respectively.
dr.m.s. deviation of the covalent bonds from their equilibrium values.
er.m.s. deviation of the bond angles from their equilibrium values.
fr.m.s. deviation of the dihedral angle constraints.
gNumber of bounds violations above 0.25 Å.
hFinal structure of 1. See text for details.
iFinal structure of 2.
Figure 5.
Stereoview of residues C13, X14 and C15 of 1 from the (A) top (i.e. 5′→3′) and (C) side. (B) Residues C13, T14 and C15 of 2 from the top. The dots outline the van der Waals surfaces of the bases. The N–O bonds of the nitro group of X14 are drawn as thinner cylinders and they are shown in several orientations. Gray, blue, red and magenta colors are used to shade the carbon, nitrogen, oxygen and phosphorus atoms, respectively.
As there were no experimental data on the position of the oxygen atoms of the nitro group of X14, they are not shown in Figure 4 and were allowed free rotation during structure calculations. The nitro group of X14 was always found to be orthogonal to the pyrrole ring and protruded into the major groove where it could not form interstrand hydrogen bonds. The pyrrole group was shifted towards the major groove, which allowed the nitro group to protrude beyond the edges of the bases of C13 and C15 (Fig. 5). In addition, there was a slight bulge in the phosphodiester backbone between residues C13 and X14 in 1, which was not observed in 2. The nitro group was initially coplanar in the ideal starting models prior to energy minimization, which was consistent with the crystal structure of 1-(2′-deoxy-β-d-ribofuranosyl)-3-nitropyrrole (21). In the B-form model, the distance between the amino proton of A5 and the nearest nitro oxygen of X14 was 2.8 Å prior to energy minimization, which is approximately the sum of their van der Waals radii (33). During energy minimization (without experimental constraints), the separation between C4 of X14 and N1 of A5 decreased from 3.4 to 3.2 Å and a rotation of 90° by the nitro group prevented the amino proton of A5 and the nitro oxygens of X14 from approaching too closely. The rotation increased the distance between the amino proton of A5 and the oxygen of the nitro substituent of X14 to 3.7 Å. If the electrostatic component of the force field was removed, the nitro group was still observed to rotate by 90° during energy minimization. There are standard constraints used during structure calculations that maintain the planarity of the natural DNA bases (33). If the constraints that keep the amino group of A5 coplanar with the rest of the purine were removed during energy minimization, the amine rotated by 90° whereas the nitro group remained in its initial coplanar orientation with the pyrrole. This is consistent with the smaller inertia of an amino group relative to that of a nitro substituent. Aside from the change in the conformation of the 3-nitropyrrole, the energy-minimized B-form starting structure of 1 was very similar to the unminimized starting structure. Similar results were obtained with the A-form starting structure. These simple tests suggested that the rotation of the nitro group alleviated the unfavorably close proximity of the nitro group of X14 with the amino group of A5 in these models. It should be noted that the absence of direct experimental data on the oxygens of the nitro group of 1 prevented us from verifying its orientation relative to the pyrrole group. Whether the nitro group is in a fixed position or is rotating freely is not known from our results.
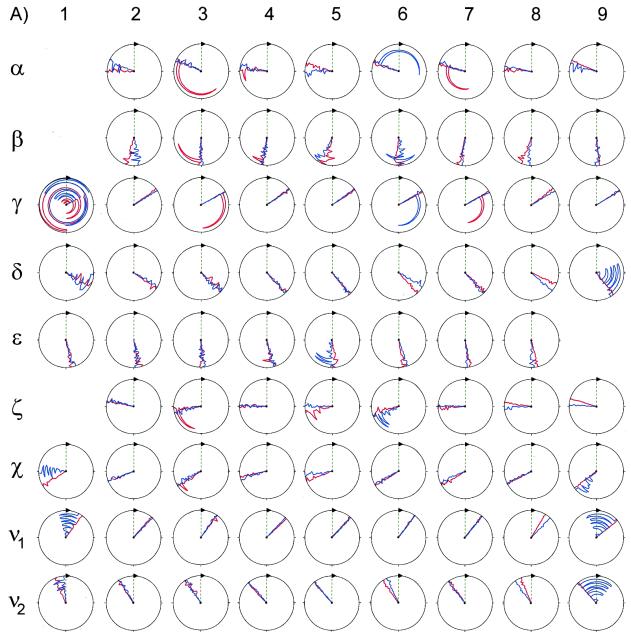
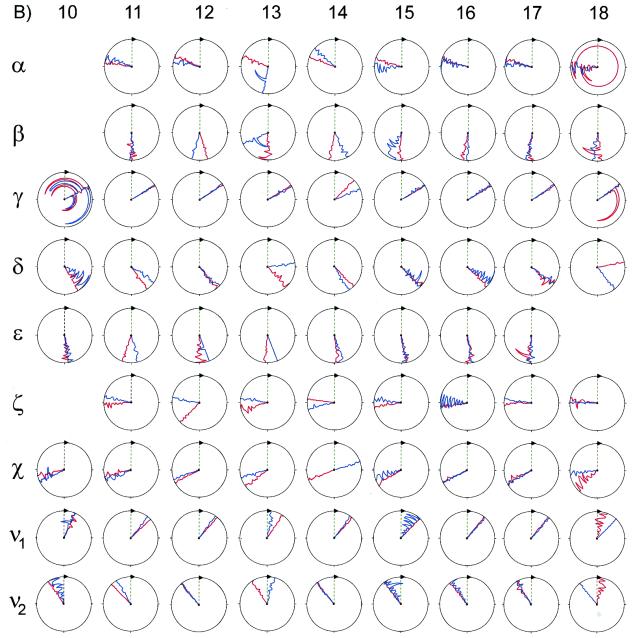
Shown in Figure 6 are the backbone and deoxyribose dihedral angles of 1 and 2. Overall, the non-terminal dihedral angles of 1 and 2 were similar. The only α angle that significantly deviated from the –sc conformational regime (common to A- and B-form DNA duplexes) was that of C13 of 1, which was –ap (52). Only the β angles of C13 and C15 of 1 were –ac, which is that adopted by B-form DNA duplexes. The β angles of other residues were ±ap. All β angles were within the range found from ΣJH5′P and ΣJH5″P analysis (46). All γ angles of both 1 and 2 were +sc, which is common to A- and B-form duplexes. Most non-terminal δ angles of 1 and 2 were on average +ac, which is between A- (+sc) and B-form (+ap) sugar conformations. In other words, the deoxyribose conformations of these residues were ca C1′-exo (53). The only exceptions are C13 and X14 of 1, which were +sc (A-form) and +ap (B-form), respectively. These values were consistent with the values of the deoxyribose angles ν1 and ν2 (Fig. 6). All ɛ angles of 1 and 2 were ±ap, which were consistent with the upper limit of 6 Hz found for 3JH3′P and all ɛ and ζ(O3′-P) angles for both 1 and 2 were, on average, within the BI conformation regime, (t, g–) (52,54). None of the structures possessed the higher energy BII conformation of the phosphodiester backbone, (g–, t). This result is consistent with the narrow dispersion (≤1 p.p.m.) of the 31P chemical shifts of 1 and 2 (Supplementary Material). These results indicate that any perturbations to the backbone conformation of 1 from X14 were small and localized.
Figure 6.
Backbone and glycosidic dihedral angles of residues (A, opposite) 1–9 and (B, above) 10–18 for 1 and 2. Shown for 1 and 2 are the final 10 A- and 10 B-form derived structures. Values for 1 are plotted in blue, those for 2 are shown in red. The vertical green line represents a value of zero. Values for standard A- and B-DNA are, respectively, α (–sc, –sc), β (+ap, –ac), γ (+sc, +sc), δ (+sc, +ap), ɛ (–ac, +ap), ζ (–sc, –ac) and χ (–ap, –ac) (52,57,58). This figure was generated using the program MOLMOL (59).
The enthalpies of 1 and 2 were ΔH1 = –65 ± 5 and ΔH2 = –72 ± 5 kcal mol–1, as measured from a van’t Hoff analysis (Supplementary Material). The difference in the enthalpies (ΔΔH1,2 = 7 ± 7 kcal mol–1) is consistent with the poor base stacking of X14 in 1 as compared with T14 in 2 (Fig. 5). The structure of 1 indicates that the bulkiness of the nitro group was a major factor in the sub-optimal base stacking of X14 with nearest neighbors. Amosova et al. (22) also suggested that the bulkiness and a bent orientation of the nitro group played a role in the poor tendency of X to stack in their DNA sequences. Indeed, if the nitro substituent was forced to maintain a co-planar configuration with the pyrrole, we found that the final rMD structures of 1 had significantly higher energies than when the nitro substituent was allowed to rotate by 90° relative to the pyrrole.
Comparison with other structures
The structures of 1 and 2 are significantly different from the structure of the abasic DNA duplex d(CATGAGTAC)·d(GTAC–CATG) (29), which had the same sequence as 1 and 2 except at position 14. Although the abasic molecule was found to exist as a right-handed duplex, A5 was inserted into the abasic site and two significantly downfield shifted 31P resonances suggested the presence of perturbed phosphodiester backbone geometries. Others have found that base analogs with larger heterocyclic rings provide a DNA duplex with higher stabilities than 3-nitropyrrole (13,23). The increased stabilities are consistent with our findings that 3-nitropyrrole does not stack as well as previously predicted (21). Recently, the structure of d(CGCATFGTTACC)·d(GGTAACAATGCG) was reported, where F represents difluorotoluene (55), a base analog isomorphic with T but which, like 3-nitropyrrole, should not be capable of strong hydrogen bonding interactions. It was found that F6 was well stacked within the B-form helix opposite A19 in the standard anti/anti configuration.
CONCLUSIONS
3-Nitropyrrole was designed to stack well. The nitro group was chosen to polarize the electrostatic potential of the π-aromatic system of the pyrrole in order to enhance vertical stacking interactions, and calculations showed both the permanent and dipole-induced dipole moments of 3-nitropyrrole to enhance base stacking interactions (21). Furthermore, the nitro group is not a strong hydrogen bond acceptor, which gives 3-nitropyrrole decreased selectively. However, stacking of X14 with nearest neighbors was found here to be less than predicted (21). Rather minor perturbations were able to significantly reduce the stacking interactions of X14 because of the small size of the pyrrole ring. The perturbations of X14 to the DNA duplex structure were found by us to be localized. It appears that the rather bulky nitro group protruded into the major groove where it could rotate into an orientation that relieved crowding. Although the Tm values of DNA duplexes containing 3-nitropyrrole opposite A, G, C or T are much lower than those of duplexes with only A:T and G:C base pairs, they fall within a 3°C range of one another (21), which suggests that the overall structural features reported here should be preserved when 3-nitropyrrole is opposite any natural base. These observations are consistent with the recent thermodynamic data of Amosova et al. (22). Based on the structures of 1 and 2, future efforts at designing improved ‘wild card’ bases should be aimed at substituting the nitro group for a less bulky substituent without sacrificing base stacking potential, which is especially important as the small size of the pyrrole ring already restricts the stacking potential.
SUPPLEMENTARY MATERIAL
There are eight figures and one table of 1H chemical shift assignments in the Supplementary Material, available at NAR Online. These include figures of van’t Hoff plots, one-dimensional imino and 31P spectra, D2O NOESY and DQF-COSY spectra and superpositions of the final 20 A- and B-form derived structures of 1 and 2.
Acknowledgments
ACKNOWLEDGEMENTS
We thank Jim Sacchettini for allowing us to use his computers for structure calculations, Jon Christopher for helping us with the molecular modeling program Spock, Liu He for technical assistance and advice with RANMARDI and MARDIGRAS, Thomas Goddard for providing us with Sparky, Frank Delaglio for assistance with nlinLS, Paul Nixon and David Giedroc for assistance with collection of the van’t Hoff data and David Giedroc and Patricia LiWang for many helpful suggestions. We would also like to gratefully acknowledge the generous support of the NIH (GM61398).
PDB accession nos 1DK6, 1DK9
REFERENCES
- 1.Day J.P., Bergstrom,D., Hammer,R.P. and Barany,F. (1999) Nucleic Acids Res., 27, 1810–1818. [DOI] [PMC free article] [PubMed] [Google Scholar]
- 2.van Aerschot A., Rozenski,J., Loakes,D., Pillet,N., Schepers,G. and Herdewijn,P. (1995) Nucleic Acids Res., 23, 4363–4370. [DOI] [PMC free article] [PubMed] [Google Scholar]
- 3.Ahmadian M., Zhang,P.M. and Bergstrom,D.E. (1998) Nucleic Acids Res., 26, 3127–3135. [DOI] [PMC free article] [PubMed] [Google Scholar]
- 4.Bergstrom D.E., Zhang,P.M. and Johnson,W.T. (1997) Nucleic Acids Res., 25, 1935–1942. [DOI] [PMC free article] [PubMed] [Google Scholar]
- 5.Brown D.M. and Lin,P.K.T. (1991) Carbohydr. Res., 216, 129–139. [DOI] [PubMed] [Google Scholar]
- 6.Eritja R., Horowitz,D.M., Walker,P.A., Ziehler-Martin,J.P., Boosalis,M.S., Goodman,M.F., Itakura,K. and Kaplan,B.E. (1986) Nucleic Acids Res., 14, 8135–8153. [DOI] [PMC free article] [PubMed] [Google Scholar]
- 7.Habener J.F., Vo,C.D., Le,D.B., Gryan,G.P., Ercolani,L. and Wang,A.H.-H. (1988) Proc. Natl Acad. Sci. USA, 85, 1735–1739. [DOI] [PMC free article] [PubMed] [Google Scholar]
- 8.Hill F., Loakes,D. and Brown,D.M. (1997) Nucl. Nucl., 16, 1507–1511. [Google Scholar]
- 9.Hoops G.C., Zhang,P., Johnson,W., Paul,N., Bergstrom,D.E. and Davisson,V.J. (1997) Nucleic Acids Res., 25, 4866–4871. [DOI] [PMC free article] [PubMed] [Google Scholar]
- 10.Inoue H., Imura,A. and Ohtsuka,E. (1985) Nucleic Acids Res., 13, 7119–7129. [DOI] [PMC free article] [PubMed] [Google Scholar]
- 11.Johnson W.T., Zhang,P.M. and Bergstrom,D.E. (1997) Nucleic Acids Res., 25, 559–567. [DOI] [PMC free article] [PubMed] [Google Scholar]
- 12.Lin P.K.T. and Brown,D.M. (1989) Nucleic Acids Res., 17, 10373–19383. [DOI] [PMC free article] [PubMed] [Google Scholar]
- 13.Matray T.J. and Kool,E.T. (1998) J. Am. Chem. Soc., 120, 6191–6192. [DOI] [PMC free article] [PubMed] [Google Scholar]
- 14.Millican T.A., Mock,G.A., Patel,M.A.C.T. P., Eaton,M.A.W., Gunning,J., Cutbush,S.D., Neidle,S. and Mann,J. (1984) Nucleic Acids Res., 12, 7435–7453. [DOI] [PMC free article] [PubMed] [Google Scholar]
- 15.Morales J.C. and Kool,E.T. (1999) J. Am. Chem. Soc., 121, 2323–2324. [DOI] [PMC free article] [PubMed] [Google Scholar]
- 16.Moran S., Ren,R.X.-F., IV,S.R. and Kool,E.T. (1997) J. Am. Chem. Soc., 119, 2056–2057. [DOI] [PMC free article] [PubMed] [Google Scholar]
- 17.Ren R.X.-F., Chaudhuri,N.C., Paris,P.L., IV,S.R. and Kool,E.T. (1996) J. Am. Chem. Soc., 118, 7671–7678. [DOI] [PMC free article] [PubMed] [Google Scholar]
- 18.Seela F. and Kaiser,K. (1986) Nucleic Acids Res., 14, 1825–1845. [DOI] [PMC free article] [PubMed] [Google Scholar]
- 19.Zhang P., Johnson,W.T., Klewer,D., Paul,N., Hoops,G., Davisson,V.J. and Bergstrom,D.E. (1998) Nucleic Acids Res., 26, 2208–2215. [DOI] [PMC free article] [PubMed] [Google Scholar]
- 20.Nichols R., Andrews,P.C., Zhang,P.M. and Bergstrom,D.E. (1994) Nature, 369, 492–493. [DOI] [PubMed] [Google Scholar]
- 21.Bergstrom D.E., Zhang,P., Toma,P.H., Andrews,P.C. and Nichols,R. (1995) J. Am. Chem. Soc., 117, 1201–1209. [Google Scholar]
- 22.Amosova O., George,J. and Fresco,J.R. (1997) Nucleic Acids Res., 25, 1930–1934. [DOI] [PMC free article] [PubMed] [Google Scholar]
- 23.Loakes D., Brown,D.M., Linde,S. and Hill,F. (1995) Nucleic Acids Res., 23, 2361–2366. [DOI] [PMC free article] [PubMed] [Google Scholar]
- 24.Fotin A.V., Drobyshev,A.L., Proudnikov,D.Y., Perov,A.N. and Mirzabekov,A.D. (1998) Nucleic Acids Res., 26, 1515–1521. [DOI] [PMC free article] [PubMed] [Google Scholar]
- 25.Ball S., Reeve,M.A., Robinson,P.S., Hill,F., Brown,D.M. and Loakes,D. (1998) Nucleic Acids Res., 26, 5225–5227. [DOI] [PMC free article] [PubMed] [Google Scholar]
- 26.Loakes D., Hill,F., Brown,D.M., Ball,S., Reeve,M.A. and Robinson,P.S. (1999) Nucl. Nucl., 18, 2685–2695. [Google Scholar]
- 27.Parinov S., Barsky,V., Yershov,G., Kirillov,E., Timofeev,E., Belgovskiy,A. and Mirzabekov,A. (1996) Nucleic Acids Res., 24, 2998–3004. [DOI] [PMC free article] [PubMed] [Google Scholar]
- 28.Jacutin S., Zhang,A.J., Russell,D.H., Gibbs,R.A. and Burgess,K. (1997) Nucleic Acids Res., 25, 5072–5076. [DOI] [PMC free article] [PubMed] [Google Scholar]
- 29.Kalnik M.W., Chang,C.-N., Grollman,A.P. and Patel,D.J. (1988) Biochemistry, 27, 924–931. [DOI] [PubMed] [Google Scholar]
- 30.Kalnik M.W., Chang,C.-N., Johnson,F., Grollman,A.P. and Patel,D.J. (1989) Biochemistry, 28, 3373–3383. [DOI] [PubMed] [Google Scholar]
- 31.Wang A.C., Kennedy,M.A., Reid,B.R. and Drobny,G.P. (1992) J. Am. Chem. Soc., 114, 6583–6585. [Google Scholar]
- 32.Sklenár V., Piotto,M., Leppik,R. and Saudek,V. (1993) J. Magn. Reson. A, 102, 241–245. [Google Scholar]
- 33.Brünger A.T. (1987) X-PLOR Version 3.1 A System for X-Ray Crystallography and NMR. Yale University Press, New Haven, CT.
- 34.Nilsson L. and Karplus,M. (1986) J. Comp. Chem., 7, 591–616.
- 35.Liu H., Borgias,B. and James,T.L. (1992) CORMA – Complete Relaxation Matrix Analysis, Version 3.1. University of California, San Francisco, CA.
- 36.Keepers J.W. and James,T.L. (1984) J. Magn. Reson., 57, 404–426. [Google Scholar]
- 37.Borgias B.A. and James,T.L. (1988) J. Magn. Reson., 79, 493–512. [Google Scholar]
- 38.Schmitz U. and James,T.L. (1995) Methods Enzymol., 261, 3–44. [DOI] [PubMed] [Google Scholar]
- 39.Berman H.M., Westbrook,J., Feng,Z., Gilliland,G., Bhat,T.N., Weissig,H., Shindyalov,I.N. and Bourne,P.E. (2000) Nucleic Acids Res., 28, 235–242. [DOI] [PMC free article] [PubMed] [Google Scholar]
- 40.Hare D.R., Wemmer,D.E., Chou,S.-H., Drobny,G. and Reid,B.R. (1983) J. Mol. Biol., 171, 319–336. [DOI] [PubMed] [Google Scholar]
- 41.Feigon J., Leupin,W., Denny,W.A. and Kearns,D.R. (1983) Biochemistry, 22, 5930–5942. [DOI] [PubMed] [Google Scholar]
- 42.Wüthrich K. (1986) NMR of Proteins and Nucleic Acids. Wiley, New York, NY.
- 43.Delaglio F., Grzesiek,S., Vuister,G.W., Zhu,G., Pfeifer,J. and Bax,A. (1995) J. Biomol. NMR, 6, 277–293. [DOI] [PubMed] [Google Scholar]
- 44.Zhu L. and Reid,B.R. (1995) J. Magn. Reson. B, 106, 227–235. [DOI] [PubMed] [Google Scholar]
- 45.Liu H., Spielmann,H.P., Ulyanov,N.B., Wemmer,D.E. and James,T.L. (1995) J. Biomol. NMR, 6, 390–402. [DOI] [PubMed] [Google Scholar]
- 46.Kim S.-G., Lin,L.-J. and Reid,B.R. (1992) Biochemistry, 31, 3564–3574. [DOI] [PubMed] [Google Scholar]
- 47.Rinkel L.J. and Altona,C. (1987) J. Biomol. Struct. Dyn., 4, 621–649. [DOI] [PubMed] [Google Scholar]
- 48.Aramini J.M., Mujeeb,A. and Germann,M.W. (1998) Nucleic Acids Res., 26, 5644–5654. [DOI] [PMC free article] [PubMed] [Google Scholar]
- 49.Ulyanov N.B. and James,T.L. (1995) Methods Enzymol., 261, 90–115. [DOI] [PubMed] [Google Scholar]
- 50.Tonelli M., Ragg,E., Bianucci,A.M., Lesiak,K. and James,T.L. (1998) Biochemistry, 37, 11745–11761. [DOI] [PubMed] [Google Scholar]
- 51.Borgias B.A. and James,T.L. (1990) J. Magn. Reson., 87, 475–487. [Google Scholar]
- 52.Markley J.L., Bax,A., Arata,Y., Hilbers,C.W., Kaptein,R., Sykes,B.D., Wright,P.E. and Wüthrich,K. (1998) Pure Appl. Chem., 70, 117–142. [Google Scholar]
- 53.Saenger W. (1984) In Cantor,C.R. (ed.), Springer Advanced Texts in Chemistry. Springer-Verlag, New York, NY.
- 54.Arnott S., Campbell,P.J. and Chandrasekharan,R. (1975) CRC Handbook of Biochemistry and Molecular Biology. CRC Press, Cleveland, Vol. 2, pp. 411–422.
- 55.Guckian K.M., Krugh,T.R. and Kool,E.T. (1998) Nat. Struct. Biol., 5, 954–959. [DOI] [PubMed] [Google Scholar]
- 56.Christopher J.A. (1998) SPOCK: The Structural Properties Observation and Calculation Kit (Program Manual). College Station, TX.
- 57.Dickerson R.E. (1992) Methods Enzymol., 211, 67–111. [DOI] [PubMed] [Google Scholar]
- 58.Szyperski T., Götte,M., Billeter,M., Perola,E., Cellai,L., Heumann,H. and Wüthrich,K. (1999) J. Biomol. NMR, 13, 343–355. [DOI] [PubMed] [Google Scholar]
- 59.Koradi R., Billeter,M. and Wüthrich,K. (1996) J. Mol. Graph., 14, 51–55. [DOI] [PubMed] [Google Scholar]
Associated Data
This section collects any data citations, data availability statements, or supplementary materials included in this article.


