Abstract
The trend for improved more precise diagnostics and management of disease heavily relies on the measurement of panels of biomarkers in physiological samples of patients. Ideally, the ultimate goal would be to detect as many clinically relevant biomarkers as possible in a single drop of blood, achieving quick, sensitive, reproducible, and affordable detection in small volume physiological samples. Bioluminescent (BL) proteins provide many of the desired characteristics required for such labels, including detection at extremely low concentrations, no interference from physiological fluids leading to excellent detection limits, and compatibility with many miniaturized systems. However, to date the use of BL proteins has been restricted by their limited multiplexing capabilities. BL proteins typically exhibit a single emission profile and decay kinetics making the simultaneous detection of multiple analytes difficult. Recent progresses in this area include the use of two different engineered luminescent proteins to achieve resolved signals via one-dimensional time resolution. This approach, however, to date only lead to a dual analyte detection. Herein, we have demonstrated that using a two-dimensional approach that combines both temporal and spatial resolution, we can expand the multiplexing capabilities of bioluminescent proteins. To that end, the photoprotein aequorin (AEQ) has been employed for the simultaneous detection of three separate analytes in a single well, differentiated through the use of three discrete time/wavelength windows. Through a combination of site-specific mutations and synthetic coelenterazines “semi-synthetic” AEQ variants have been developed with altered emission profiles and decay kinetics. In this study, two AEQ mutant proteins were genetically conjugated to three pro-inflammatory cytokines (tumor necrosis factor alpha, interleukins 6 and 8) resulting in AEQ-labeled cytokines. These fusion proteins were combined with synthetic coelenterazines resulting in proteins with differing emission maxima and half-lives to allow for the simultaneous detection of all three cytokines in a single sample. The validity of the assay was demonstrated in serum by employing human physiological samples and comparing our results with commercially available individual tests for each of the three cytokines.
Introduction
Precise and effective disease diagnosis largely depends on the knowledge of disease-specific biomarkers.1 In a majority of cases, multiple biomarkers are necessary to accurately diagnose a disease. The boom of translational science has undoubtedly helped in the identification of new biomarkers that are proving to be key in the more precise diagnosis and monitoring of disease. While biomarker identification has soared and contributed to the field of precise medicine, analytical detection technologies for the newly discovered biomarkers still rely on traditional techniques. The most common technique for detection of biological markers is the enzyme-linked immunosorbent assay (ELISA), which is designed for the analysis of only one analyte per sample, and, typically, uses quite large volumes of samples for accurate diagnosis. Detection of multiple biomarkers or panels of biomarkers is a trend that has proved to be effective in precise medicine for diagnosis and management of disease. Often, the biomarkers are used to assess the effectiveness of treatment, and, therefore, their analysis needs to be performed often, requiring drawing samples from patients on daily, weekly, or monthly regimes. While the value of obtaining the information needed for precise management of disease outweighs any other drawbacks, there are some important parameters affecting patient’s overall health and comfort, as well as financial burdens that need to be considered. If the panel of biomarkers needs to be detected in blood, then, this undoubtedly increases the physical burden in patients, especially for paediatric, elderly, and chronically ill individuals. Thus, there is a need for a better solution for monitoring these patients. A potential solution to this problem will involve the implementation of highly sensitive assays that can perform rapid and reliable detection in small volumes of physiological samples. The development of such assays come with a series of non-trivial requirements, that include detection of low levels of a target biomarker/analyte selectively in the presence of other components in a complex physiological sample, versatility to be incorporated into miniaturized analytical platforms, reproducibility, accuracy, and precision of the analysis. Moreover, small volume detection also highlights the need for technologies that can detect more than one biomarker without interferences from others present in the same sample, i.e., multiplex detection.
State-of-the-art multiplex detection methods include microarray assays2,3 and bead array assays.4,5 For protein microarray assays, the immobilized capture reagents specific for distinct analytes are arrayed at fixed positions on a solid surface. Quantitative signals are read through each microspot to realize simultaneous detection of multiple analytes. Unlike microarray assays, the bead array assays are based on pre-coated and internally dyed spherical beads instead of planar surface. Each bead population coated with distinct binding reagents are identified by its specific fluorescent spectra. The intensity of a second signal from the reporting label is measured as the quantitative identifier.
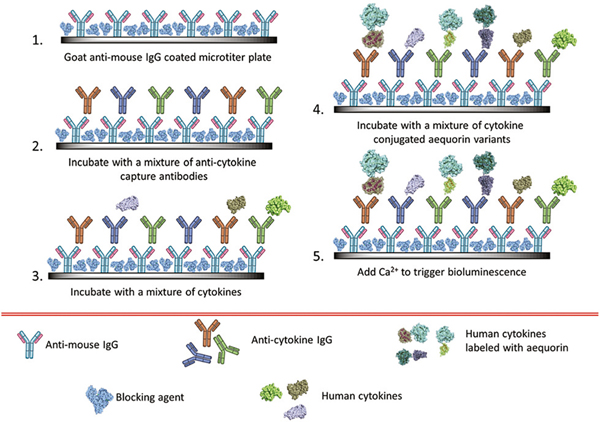
All of these commercially available assays are based on either fluorescence or absorbance. While very valuable newly discovered biomarkers are present in physiological fluids at very low concentrations, neither absorbance nor fluorescence-based assays can reach such low detection limits. Luminescent proteins, including luciferases are inherently endowed with distinct advantages over absorbance or fluorescent reporters for use as labels in bioassays. For instance, bioluminescence is a biochemically-driven reaction that eliminates the need of an external light source, therefore, eliminating background fluorescence, resulting in a higher signal-to-noise ratio when compared to fluorescence. This makes bioluminescent protein labels well suited for use in ultra-sensitive detection. Bioluminescent proteins are highly biocompatible, having been expressed in a variety of biological systems.6 Benefiting from these properties, bioluminescent proteins have established them-selves as vital components of the biosensing toolbox for an assortment of applications including in vivo imaging, immunoassays, in vivo indicators, drug discovery, and the study of protein–protein interactions.7–14 Although, both photoproteins and luciferases are enzymes that catalyzes the oxidation of their corresponding substrates, in the case of photoproteins, the formation of the peroxide intermediate is the rate limiting step and is very slow. Therefore, photoproteins have a slow turnover when compared to the luciferases thus the intensity of the emitted light is proportional to the amount of the protein. On the other hand, luciferases have high turnover numbers, and intensity of their light emission is dependent on the amount of their substrate.15,16 However, unlike fluorescence-based detection, which can be performed at multiple emission wavelengths using different fluorophores or fluorescent proteins, bioluminescence proteins have lagged the versatility of their fluorescent label counterparts. This is due to the lack of diversity in the emission profiles, as well as the broadness of their emission spectra. Several analogues of luciferins with different emission wavelengths, decay half-lives, thermostability, etc., have been developed.17–20 However, unlike multiplex fluorescence-based detection utilizing fluorophores or fluorescent proteins, photoproteins, have not been employed in multiplex detection due to the broadness of their bioluminescence emission spectrum, which hinders their simultaneous measurement. Only those variants that have large Stokes shifts or significantly altered bioluminescence kinetics (longer or shorter emission times) can be successfully employed in multiplex analytical applications. Strategies to address this inherent shortcoming of bioluminescence proteins have been explored successfully to expand the utility of bioluminescent proteins in multiplex assays. Recent progress in this area includes using two different naturally available luminescent proteins to achieve resolved signals,21 genetically engineered bioluminescent proteins exhibiting tuned emission profiles,22,23 and genetically mutated photoproteins, specifically aequorin, differentiated through time resolution.24 The previous studies advanced the versatility and practicality of bioluminescent assays, but still are limited to the detection of only two analytes by employing a one-dimensional approach that either uses spectrally distinct or time-resolved mutants. In this study, we designed a two-dimensional approach that employs time and spectral resolution to design and develop as multiplexed assay to measure three biomarkers of inflammation simultaneously in a single sample solution. This is the first time that a combination of space and time resolution in bioluminescence detection has been employed to expand the application of bioluminescence proteins in multiplex analysis. Specifically, the photoprotein aequorin (AEQ) was engineered and employed for the simultaneous detection of three separate biomarker analytes in a single well, the signals of which are differentiated through the use of three discrete time/wavelength windows (Fig. 1).
Fig. 1.
A schematic of the simultaneous competitive assay for TNF-α, IL-6, and IL-8 using semi-synthetic aequorin mutants.
Aequorin, native of the jellyfish Aequorea victoria, is a 22 kDa bioluminescent photoprotein with the active complex consisting of apoaequorin, imidazopyrazine chromophore coelenterazine contained in the protein’s hydrophobic core, and molecular oxygen. The binding of calcium to the EF-hands in aequorin triggers a conformational change in the protein leading to the oxidation of coelenterazine to an excited state, which upon relaxation results in the emission of light with a λmax ~469 nm.25,26 Aequorin has been mutated both site-specifically and randomly to generate mutant proteins displaying altered emission maxima, emission decay half-lives, and thermostability.27–30 Our group has also introduced non-natural amino acids by global and site-selective incorporation into the protein that confer a series of unique spectral, thermal and half-life characteristic to the newly created variants.18 Additionally, introducing synthetic coelenterazine analogues creates “semi-synthetic” aequorins that have also shown altered bioluminescent properties.31–33 These different aequorin variants or semi-synthetic AEQs have spatial and temporal space features that can make them amenable to simultaneous multi-analyte detection in a single well, expanding the applications of AEQ in not only sensitive, but also versatile and miniaturized analytical systems. Herein, we report the development of a multiplex assay for three main pro-inflammatory cytokines, namely tumour necrosis factor alpha, interleukin 6 and interleukin 8, (TNF-α, IL-6, IL-8) as model biomarkers to demonstrate the detection capabilities of the semi-synthetic AEQ variants. Cytokines play an important role in a variety of biological processes, including inflammation, disease pathogenesis, cancer progression and response to inflammation, and are established markers of a variety of diseases with inflammatory components, including, among others, rheumatoid arthritis, Crohn’s disease, ulcerative colitis, cardiovascular diseases, diabetes, cancer, lupus, and hyperalgesia.34–36 These cytokines are routinely analyzed when diagnosing and managing the health of patients suffering from these chronic or long-term diseases.37 We chose cytokines as model analytes since there are commercially available ELISA kit albeit for individual cytokines, which will help in validating our assay. Although, highly sensitive multiplexed fluorescent bead-based system are available for cytokine analysis, these are flow-based systems whereas our system and ELISAs are direct measurement systems and hence not comparable. Flow based systems are very expensive and it is unlikely to be found in all labs whereas ELISA systems are less expensive and more likely to be easily available. Given this and the fact that, as stated earlier, small volume detection is highly desirable in the health management of patients with long-term illnesses, we believe that rapid, sensitive, multiplex assays for the detection of biomarkers such as cytokines could demonstrate applicability of AEQ in multiplex analysis using a two-dimensional approach. This could contribute to improved clinical diagnostics and management of disease in precision medicine.
Results and discussion
Recently, the need for small volume analysis in clinical samples has been highlighted by both the scientific and non-scientific press. This is in part due to the controversy generated by the company Theranos and their widely publicized small volume test, which failed short on the delivery of their promised technology.38–41 While, unfortunately, Theranos’ misfortune in not being able to demonstrate without question that their tests conform to the analytical parameters needed for a reliable clinical assay, it has also highlighted further the absolute need for better technology that can achieve sensitive, reproducible and low detection assays in small volume physiological samples. This is even more pressing given the fast pace discovery of new biomarkers and the trend of modern medicine to use the levels of these biomarkers in the diagnosis and management of disease. In addition, the issue of detection of panels of biomarkers and the burden imposed on patients when drawing large volumes of blood frequently is also an important consideration that highlights the need for technologies that can perform biological assays in small volumes. Granted, this is not a trivial task, and we must recognize that the current move towards miniaturization of a number of analytical methods that can reliably detect low analyte concentrations in physiological samples requires, among other parameters, extremely sensitive labels. The ability to multiplex assays under such conditions would also greatly improve the value of the newly discovered biomarkers in diagnostic and monitoring of disease. Bioluminescent labels can provide us with the required miniaturization potential and sensitivity, however, to date there have been few examples of their use in multiplex assays. The multiplex assay described herein is based on well-known immunoassay principles. In that respect, we have already developed individual bioluminescent immunoassays using aequorin and other photoproteins as labels for a variety of analytes, thus demonstrating the compatibility of these type of assays for detection of any target analytes.8,9,42 In addition, aequorin has been used in a dual analyte assay based on time resolution,24 while obelin mutants and luciferases have been applied in dual-color assays.22,43 By taking a two-dimensional approach and combining both time and wavelength resolutions, the bioluminescent multiplexing capabilities can be expanded even further in bioanalytical and medical applications. Herein, three pro-inflammatory cytokines (TNF-α, IL-6 and IL-8) were chosen as biomarker candidates for the proof of principle for a multiplex detection system based on the premise that their simultaneous detection would be beneficial in the diagnosis of a number of diseases.36,44–47 Indeed, these cytokines are routinely employed in the management of among others, rheumatoid arthritis, Crohn’s disease, ulcerative colitis, cardiovascular diseases, diabetes, cancer, lupus, and hyperalgesia.34–36
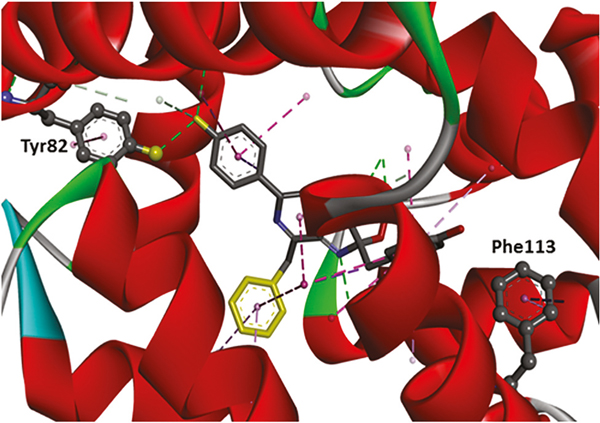
Previous work in our laboratory focused on the use of a series of genetic-based strategies to generate aequorin variants paired with synthetic coelenterazines that resulted in semi-synthetic aequorins with altered wavelength emission maxima and decay kinetics.27 Taking this work and the individual characteristics and potential of these newly pre-pared proteins as bioluminescent labels in assays into consideration, we selected aequorin mutants Y82F and F113W as labels for the development of the multiplex assay. The X-ray crystal structure of aequorin mutants is shown in Fig. 2.
Fig. 2.
Three-dimensional crystal structure of aequorin with the locations of the Tyr82 and Phe113 highlighted. The dotted lines display the interactions between aequorin and coelenterazine. The tyrosine residue at position 82 was substituted by phenylalanine to decrease the H-bond interaction, and thus red-shifted the emission wavelength. On the other hand, the phenylalanine at position 113 was substituted by tryptophan to increase the π-π interaction, and therefore blue-shifted the emission wavelength.
In our work, the genes of the cytokine proteins were fused to the genes of the aequorin mutants. Optimal expression of the TNFα-Y82F and IL8-F113W fusion proteins was achieved by introducing the plasmids into E. coli BL21 (DE3) pLysS strain, while the IL6-Y82F was expressed in a Rosetta (DE3) E. coli strain. Purity of the proteins was verified by SDS-PAGE (see ESI†). Activities and emission characteristics of the proteins were determined in a commercial luminometer.
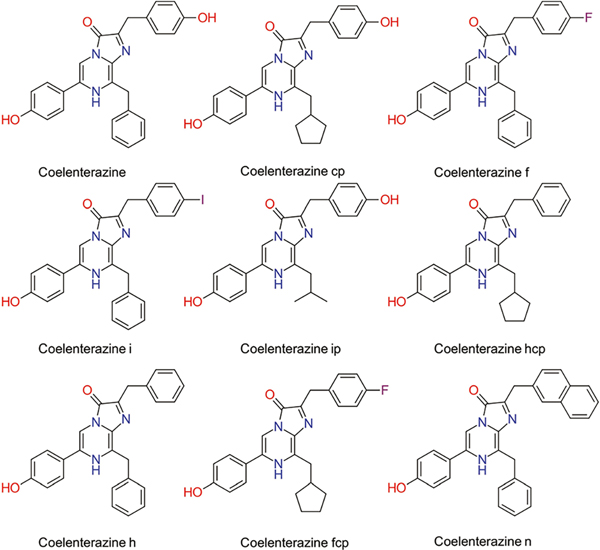
Previous studies have shown that certain genetic mutations and different synthetic coelenterazines can result in altered emission characteristics of aequorin.27 To evaluate the effect of genetically linked cytokines on the bioluminescence emission of aequorin, each fusion protein was paired with an array of synthetic coelenterazines (Fig. 3), and characterized with respect to the wavelength emission maxima (Table 1A) and bioluminescence decay kinetics (Table 1B).
Fig. 3.
Chemical structures of commercially available, native and synthetic coelenterazine analogues.
Table 1.
Wavelength emission maxima and half-life of the different semi-synthetic cytokine-aequorin fusion proteins
| A. | TNFα-Y82F | IL6-Y82F | IL8-F113W |
|---|---|---|---|
| Coelenterazine | λ emission max (nm) | λ emission max (nm) | λ emission max (nm) |
|
| |||
| ntv | 501 | 501 | 480 |
| i | 511 | 511 | 481 |
| f | 509 | 509 | 488 |
| ip | 482 | 480 | 464 |
| hcp | 479 | 478 | 463 |
| h | 504 | 503 | 479 |
| cp | 483 | 477 | 460 |
| fcp | 493 | 492 | 472 |
| n | 507 | 498 | 477 |
|
| |||
| B. | TNFα-Y82F | IL6-Y82F | IL8-F113W |
| Coelenterazine | Half-life (s) | Half-life (s) | Half-life (s) |
|
| |||
| ntv | 1.12 | 1.06 | 2.56 |
| i | 13.53 | 19.98 | 11.65 |
| f | 0.67 | 0.72 | 0.56 |
| ip | 0.48 | 0.46 | 0.35 |
| hcp | 0.15 | 0.14 | 0.10 |
| h | 0.26 | 0.26 | 0.34 |
| cp | 0.19 | 0.21 | 0.21 |
| fcp | 0.33 | 0.31 | 0.20 |
| n | 3.14 | 3.17 | 7.37 |
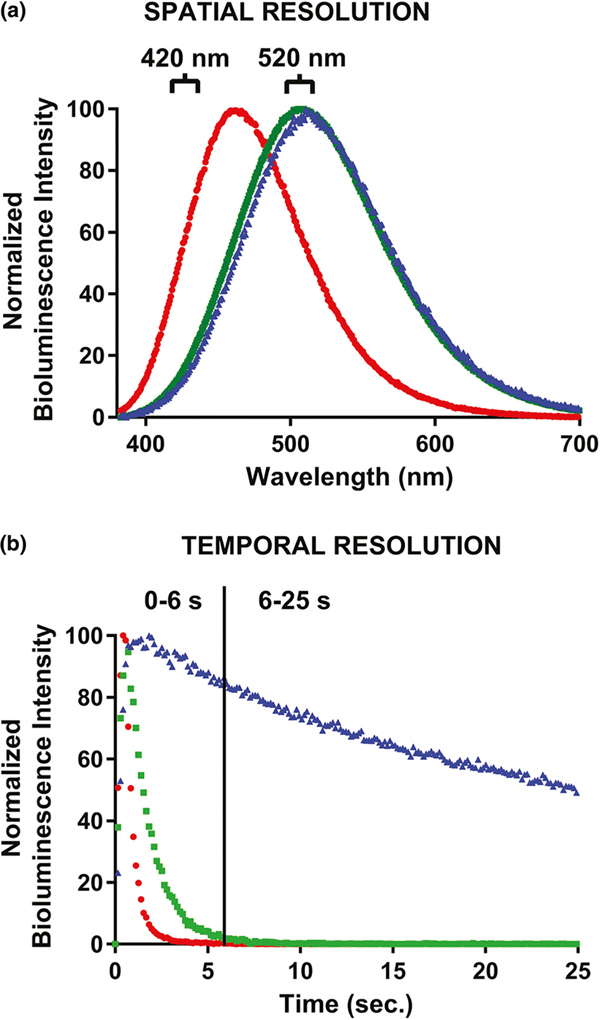
A broad range of bioluminescence emission half-lives was observed ranging from 0.10 s to 19.98 s. In addition, the wavelength emission maxima exhibited were also investigated. The emission profile through the entire spectra was recorded by a cooled CCD camera and the wavelength corresponding to the maximal bioluminescent intensity was determined. A maximal wavelength separation of 51 nm was obtained ranging from 460 nm to 511 nm. Based on these results, aequorin mutants with coelenterazines cp, f, and i were selected for the establishment of three distinct time/wavelength windows in which the simultaneous discrimination of the three separate bioluminescent signals can be achieved. The fusion protein TNFα-Y82F was paired with coelenterazine f, IL6-Y82F with coelenterazine i, and IL8-F113W with coelenterazine cp. This allows for TNF-α to be detected during the 0–6 s interval using a 520 nm filter. IL-6 can be detected in the 6–25 s interval also with the 520 nm filter, and IL-8 can be distinguished in the 0–6 s interval using a 420 nm filter. Wavelength resolution between the TNFα-Y82F and IL8-F113W signals was achieved using the band pass filters of 420 nm and 520 nm, allowing for the detection of both TNF-α and IL-8 in the 0–6 s kinetic window (Fig. 4A). After 6 s the only bioluminescent signal left being emitted results from the IL6-Y82F emission, thus, in the 6–25 s kinetic window with the 520 nm filter, IL-6 can be detected as demonstrated in Fig. 4B.
Fig. 4.
(A) Emission spectra profiles of the three cytokine-aequorin fusion proteins paired with their respective coelenterazines selected for the study. (B) The emission decay kinetics of the three fusion protein/coelenterazine combinations:  TNFα-Y82F with coelenterazine f,
  IL6-Y82F with coelenterazine I, and
  IL8-F113W with coelenterazine cp.
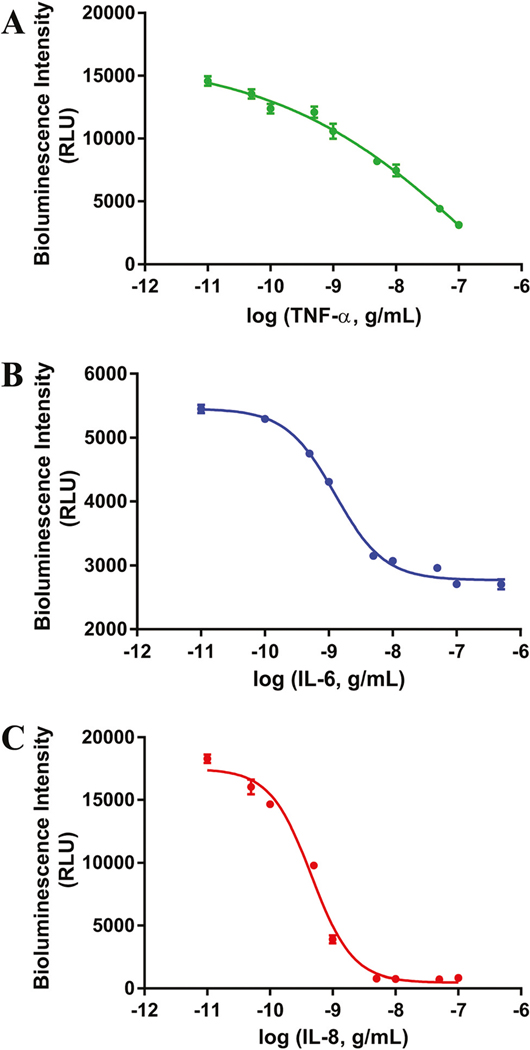
Serial dilutions were made of each cytokine-aequorin fusion protein to determine the optimal concentration to use in the development of the multiplex assay. Concentrations of 1.04 × 10⁻⁸ M for TNFα-Y82F with coelenterazine f, 7.00 × 10⁻⁸ M for IL6-Y82F with coelenterazine i, and 5.81 × 10⁻⁸ M for IL8-F113W with coelenterazine cp were selected for the studies based on the fact that these concentrations allowed for significant amount of signal over the back-ground while minimizing the amounts of reagents used. Additionally, binder-dilution studies with the respective anti-human cytokine antibodies were performed to optimize the antibody concentrations needed in the assay. For this purpose, anti-mouse IgG coated plates were utilized to allow for optimal orientation of the anti-cytokine antibodies (all mouse IgG) in the wells. Antibody concentrations of 1 μg mL−1 for TNF-α and IL-6, 0.5 μg mL−1 for IL-8 were found to be most favourable in terms of the dynamic detection range of the assay. Initially, the dose response-plots for the desired cytokines were executed individually to allow for individual optimization of each cytokine assay. Each of the interleukins were detected within their relevant elevated concentration ranges (~10 pg–10 000 pg)48–51 with detection limits of 53 pg mL−1 for TNF-α, 184 pg mL−1 for IL-6 and 37 pg mL−1 for IL-8 (Fig. 5).
Fig. 5.
Individual dose–response curves of the three cytokines in a buffered solution. (A) TNF-α. (B) IL-6. (C) IL-8. All points are the mean of three measurements ± one standard deviation. Error bars that are not visible are obstructed by the point.
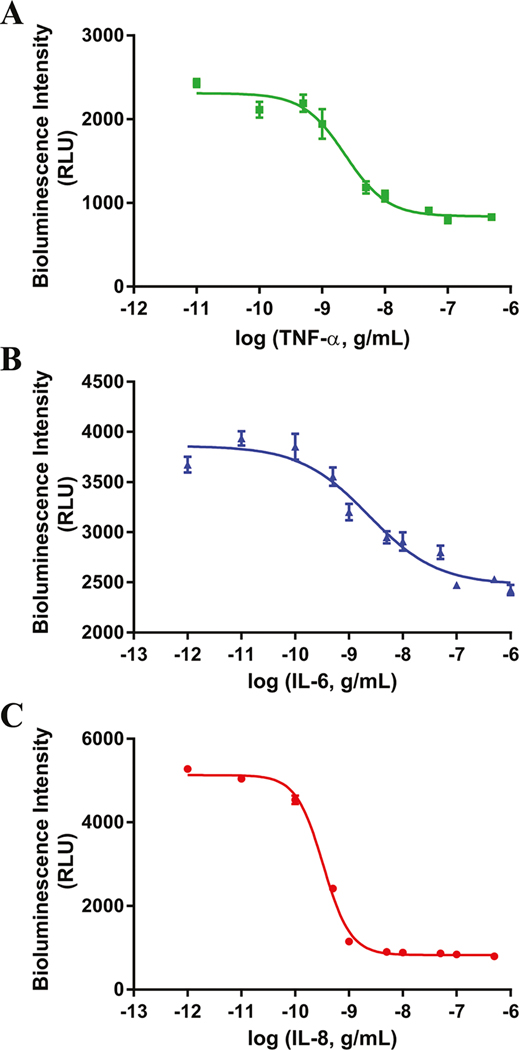
Each cytokine was then assayed in the presence of the other two cytokines in a single well (Fig. 6).
Fig. 6.
Simultaneous dose–response curves of all three analytes in a single well in a buffered solution. The response in the specific time/wavelength window of interest for each cytokine is plotted separately for ease of viewing. (A) TNF-α. (B) IL-6. (C) IL-8. All points are the mean of three measurements ± one standard deviation. Error bars that are not visible are obstructed by the point.
A similar protocol was followed for the individual dose–response curves with the exception that all three of the antibodies, standards, and fusion proteins were added to each well. Two of the cytokine concentrations were held constant while the third was increased through the desired range to demonstrate that the observed change was only affected by the expected fusion protein signal. The concentrations of the two cytokines were held constant at 1000 pg mL−1, which is a typical elevated concentration of these cytokines in patients with typical for inflammatory disease. This was chosen to simulate the actual concentrations in physiological samples and to demonstrate that even though the fixed concentration is high, it does not interfere with the assay for the target cytokine. As expected, the 0–6 s and 420 nm windows were only affected by the response for IL-8, and the 6–25 s and 520 nm windows only counted the signals responsible to IL-6. However, as expected, the 0–6 s and 520 nm window were affected by the response for not only TNF-α, but also the other two analytes. Therefore, a signal deconvolution algorithm (see equation below) was used to subtract the signals response to IL-6 and IL-8 to resolve this issue.
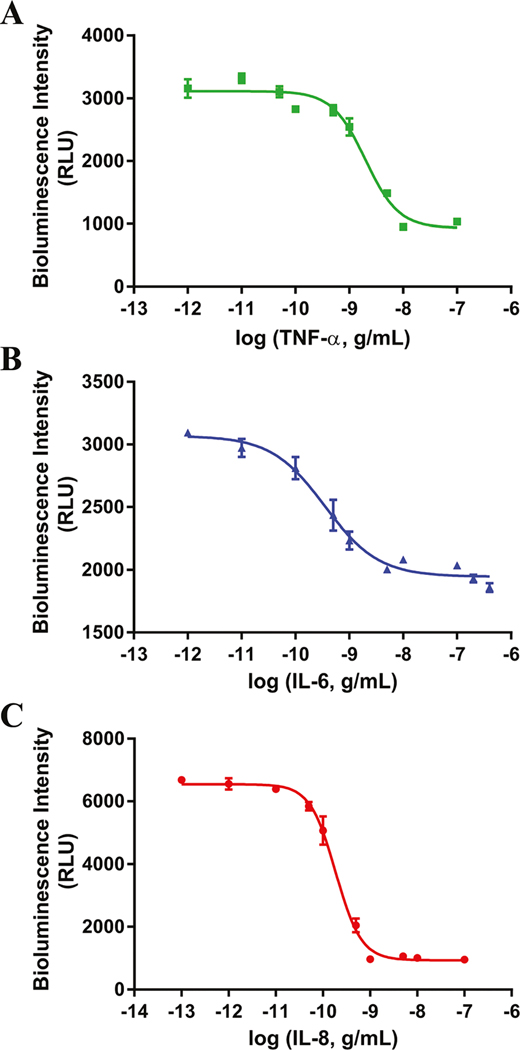
In the equation, 1.56604 is the ratio of signal intensity between 0–6 s and 6–25 s emitted by IL6-Y82F, and 0.72375 is the ratio between signal intensity emitted by IL8-F113W in 520 nm and 420 nm channels. Dose–response curves for the simultaneous detection of three cytokines showed a similar profile as the individual cytokines, thus detecting the analytes in the relevant concentration range with detection limits of 250 pg mL−1 for TNF-α, 213 pg mL−1 for IL-6 and 19 pg mL−1 for IL-8. Additionally, the multiplex assay was performed using human serum as the sample matrix. The inherent ability of bioluminescent-based assays to be performed directly in physiological fluids without the need of sample preparation steps has numerous advantages, such as the ease of the overall analytical method, lower probability to introduce error in the analysis, amenability for incorporation into a variety of platforms, and reduction of the time of analysis. To that end, our multiplex assay showed high sensitivity and specificity in human serum, detecting the desired analyte with a four order of magnitude dynamic range that encompasses the physiological levels of the three target cytokines. Specifically, detection limits of 252 pg mL−1 for TNF-α, 16 pg mL−1 for IL-6 and 13 pg mL−1 for IL-8, (Fig. 7) were obtained. Some of the assay characteristics such as Z′-Factor and EC50 values are summarized in Table 2.
Fig. 7.
Simultaneous dose–response curves of all three cytokines in human serum in a single well. The response in the specific time/wavelength window of interest for each cytokine is plotted separately for ease of viewing. (A) TNF-α. (B) IL-6. (C) IL-8. All points are the mean of three measurements ± one standard deviation. Error bars that are not visible are obstructed by the point.
Table 2.
Comparison of serum levels of TNF-α, IL-6 and IL-8 measured by the bioluminescence assay and ELISA kits
| Z’-Factor |
EC50 (M) |
|||
|---|---|---|---|---|
| Buffer | Serum | Buffer | Serum | |
|
| ||||
| TNF-α | 0.84 | 0.84 | 1.40 × 10⁻⁶ | 2.36 × 10⁻⁹ |
| IL-6 | 0.84 | 0.69 | 1.27 × 10⁻⁹ | 2.20 × 10⁻⁹ |
| IL-8 | 0.90 | 0.91 | 4.50 × 10⁻¹⁰ | 3.29 × 10⁻¹⁰ |
The reproducibility of all the assays was verified by calculating their coefficient of variation (CV). The intra-assay coefficient of variation is smaller than 10% and the inter-assay coefficient of variation is smaller than 13% for all data points. Finally, to demonstrate the accuracy of our multiplex assay, we validated our newly developed multiplex assay by determining the levels of TNF-α, IL-6 and IL-8 in human serum spiked with the three analytes. Our assays were also compared to commercially available ELISA kits for each of the three individual cytokines. The levels measured by our multiplex one pot assay were within 10% difference from those obtained with the three commercial ELISA assays for each individual cytokine, demonstrating validation of our multiplex assay against three individual commercial cytokine assays (Table 3). Importantly, the p-values of TNF-α, IL-6 and IL-8 are 0.7331, 0.4488, and 0.2783 respectively, which demonstrates that the results from our bioluminescence-based assays and those of the commercial ELISA tests are not significantly different. Additionally, the recovery rates of TNF-α, IL-6 and IL-8 are 112%, 119%, and 112% respectively, which are similar to the results from the individual ELISA kits. Typically, the most expensive component of immunoassays are the antibodies, and given that we can produce our fusion proteins using bacterial expression systems, the cost of our assay (~$0.25 per analysis) is comparable to commercially available kits for cytokine analysis (~$0.22 per analysis). In terms of complexity of the assay, our multiplex assay is based on direct detection of each analyte when bound to its corresponding labelled antibody, as opposed to commercial cytokine assays that are based on sandwich-type principles. Therefore, our assays have inherently fewer steps (2 steps) than the commercial ones (5 steps or more), and their assay time is significantly reduced; our assay can be performed in <2 h, whereas, commercially available kits can take >6 h. Multiplex fluorescence bead-based assay for cytokines with superior sensitivities are available commercially. However, the sandwich-format, antibodies used, and flow-based system of fluorescence bead assay platform is different from our approach of direct measurement. Hence we did not use this platform for comparison.
Table 3.
Comparison of serum levels of TNF-α, IL-6 and IL-8 measured by the bioluminescence assay and ELISA kits
| TNF-α (pg mL−1) | IL-6 (pg mL−1) | IL-8 (pg mL−1) | |
|---|---|---|---|
|
| |||
| Bioluminescence assay | 563 ± 55 | 119 ± 8 | 60 ± 3 |
| ELISA | 547 ± 23 | 127 ± 2 | 62 ± 1 |
| p-Value | 0.7331 | 0.4488 | 0.2783 |
Experimental
Reagents and apparatus
Standard human proteins and monoclonal antibodies were purchased from Abcam and R&D systems. Bioluminescence measurements were made on a Polarstar Optima luminometer from BMG Labtech. Emission spectra was taken on a custom-made SpectroScan from Sciencewares. The complete list of reagents and apparatus is listed in the ESI.†
Construction of cytokine-aequorin mutant fusion proteins
Three different fusion protein constructs were developed for assaying tumor necrosis factor alpha (TNF-α), interleukins 6 (IL-6), and 8 (IL-8) simultaneously. The Y82F and F113W aequorin mutants were utilized due to their altered emission spectra. The cytokine coding sequences were genetically attached to the aequorin mutants of choice via overlap polymerase chain reaction (PCR). Aequorin mutant F113W was genetically fused to the 3′ end of IL-8 (IL8-F113W) and aequorin mutant Y82F was genetically attached to the 3′ end of both TNF-α (TNFα-Y82F) and IL-6 (IL6-Y82F). All of the fusion proteins were expressed in Escherichia coli (E. coli) cells and purified through Ni-NTA affinity chromatography. The primers and specifics for each overlap PCR as well as the protein expression and purification procedures are provided in ESI.†
Decay half-life and emission spectra of cytokine-aequorin fusion proteins
The emission characteristics of each cytokine-aequorin fusion protein were examined with an array of coelenterazine analogues (coelenterazine ntv, i, f, cp, hcp, fcp, n, fcp, h). Bioluminescent signals were collected on Polarstar Optima and SpectroScan (ESI†).
Individual cytokine dose–response curves
Anti-mouse IgG coated plates were employed for experiments performed with antibodies. The antibody concentration used for TNF-α and IL-6 was 1 μg mL−1, and for IL-8 was 0.5 μg mL−1. Fusion protein concentrations used in the study were as follows: TNFα-Y82F with coelenterazine f- 1.04 × 10⁻⁸ M, IL6-Y82F with coelenterazine i- 7.00 × 10⁻⁸ M, and IL8-F113W with coelenterazine cp- 5.81 × 10⁻⁸ M. The bioluminescent intensity was measured using the Polarstar Optima through dual luminescence emission detection with two kinetic windows. Channel A contained a 420 nm filter and channel B housed a 520 nm filter. The first kinetic window consisted of the 0–6 s time frame and the second window was 6–25 s. The experimental details of concentration optimization, binder dilution study, as well as individual and simultaneous multiplexed response study are provided in ESI.†
Simultaneous multiplex cytokine dose–response curves in buffer and human serum
For the dose–response curves in buffer, an aliquot of the mixture of three anti-human cytokine antibodies in the same concentrations as used for the individual dose response plots listed above was added to each well. After removing the antibody solution, each cytokine standard solution was then added to the wells. For each of the cytokines, the response was examined in a dose-dependent manner while the concentration of the other two cytokines was held constant at 1000 pg mL−1. The mixture of three cytokine-aequorin fusion proteins was then added to the wells for the establishment of the competitive bioluminescent assay.
The same procedure was followed for the dose–response curve generated using human serum with the exception of the additions of the standard solutions. In order to establish a calibration plot, aliquots of human serum were spiked with the cytokines of interest to the final desired concentrations.
Conclusions
The increasing number of biomarkers available have helped to improve the precision and accuracy of diagnostics and management of disease. However, they also have placed a burden in patients who need to have drawn large volumes of blood for the detection of panels of biomarkers, a process that needs to be repeated as frequently as, on occasions, on a daily basis if the patients require close management of their therapeutic regime or their disease progression. This has highlighted the need for small volume clinical analysis, which dictates that assays require reagents that achieve the detection limits needed while performing in a fast reproducible, sensitive manner in complex physiological samples. Moreover, it is important that those assays require little or no sample preparation and are as simple as possible in order to be amenable for incorporation into miniaturized analytical platforms. In that regard, bioluminescent assays have emerged as exciting alternatives to traditional colorimetric and fluorescent assays. Bioluminescent proteins have shown their usefulness as labels in multiplex analysis and could be key in the advancement of a “one-blood draw, one-pot for all” assay methods for biomarkers. Indeed, the proven ability of bioluminescent proteins as labels in small volume assays42 makes them ideal for use in miniaturized platforms. To that end, herein, we demonstrate the multiplexed detection of three cytokines in a bioluminescent assay format. Specifically, the system was able to respond quickly and efficiently in a dose-dependent manner over several orders of magnitude, including at physiological and elevated ranges for the target cytokine protein biomarkers of interest. Previously, dual-analyte bioluminescent assays have been reported either based on spectral or time resolved bioluminescent proteins. The novelty of this work is the demonstration of a platform that uses both spatial and temporal resolution to detect and quantify multiple analytes based on bioluminescent labels. As the bioluminescent labels continue to improve and novel bioluminescent proteins with shifted emissions wavelengths and half-lives are produced, it will result in further enhancing the multiplexing capability, i.e., number of analytes that can be detected via bioluminescence. The high sensitivity of aequorin allows for easy quantification even in small volumes and high-throughput screening.8 Moreover, in prior work we also demonstrated that bioluminescence-based detection is compatible and amenable for incorporation into microfluidic platforms.14
Supplementary Material
Acknowledgements
This work was supported in part by grants from the National Institute of General Medical Science (R01GM114321, R01GM127706) and the National Science Foundation (CHE-1506740) and (CBET-1841419). D. S. acknowledges support from a NSF-IGERT and the University of Kentucky Presidential Fellowships, and S. D. from the Lucille P. Markey Chair in Biochemistry and Molecular Biology of the Miller School of Medicine of the University of Miami.
Footnotes
Electronic supplementary information (ESI) available. See DOI: 10.1039/c9an00297a
Conflicts of interest
There are no conflicts to declare.
Notes and references
- 1.Henry NL and Hayes DF, Mol. Oncol, 2012, 6, 140–146. [DOI] [PMC free article] [PubMed] [Google Scholar]
- 2.Miller MB and Tang YW, Clin. Microbiol. Rev, 2009, 22, 611–633. [DOI] [PMC free article] [PubMed] [Google Scholar]
- 3.Tseng GC, Ghosh D and Feingold E, Nucleic Acids Res, 2012, 40, 3785–3799. [DOI] [PMC free article] [PubMed] [Google Scholar]
- 4.Elshal MF and McCoy JP, Methods, 2006, 38, 317–323. [DOI] [PMC free article] [PubMed] [Google Scholar]
- 5.Liu H, Li S, Liu L, Tian L and He N, Biosens. Bioelectron, 2010, 26, 1442–1448. [DOI] [PubMed] [Google Scholar]
- 6.Roda A, Guardigli M, Michelini E and Mirasoli M, TrAC, Trends Anal. Chem, 2009, 28, 307–322. [Google Scholar]
- 7.Eglen RM and Reisine T, Assay Drug Dev. Technol, 2008, 6, 659–671. [DOI] [PubMed] [Google Scholar]
- 8.Hamorsky KT, Ensor CM, Dikici E, Pasini P, Bachas L and Daunert S, Anal. Chem, 2012, 84, 7648–7655. [DOI] [PMC free article] [PubMed] [Google Scholar]
- 9.Hamorsky KT, Ensor CM, Pasini P and Daunert S, Anal. Biochem, 2012, 421, 172–180. [DOI] [PMC free article] [PubMed] [Google Scholar]
- 10.Inouye S and Sato J, Protein Expression Purif, 2012, 83, 205–210. [DOI] [PubMed] [Google Scholar]
- 11.Kain SR, Drug Discovery Today, 1999, 4, 304–312. [DOI] [PubMed] [Google Scholar]
- 12.Manjarres IM, Chamero P, Domingo B, Molina F, Llopis J, Alonso MT and Garcia-Sancho J, Pflügers Arch, 2008, 455, 961–970. [DOI] [PubMed] [Google Scholar]
- 13.Martin JR, Rogers KL, Chagneau C and Brulet P, PLoS One, 2007, 2(3), e275. [DOI] [PMC free article] [PubMed] [Google Scholar]
- 14.Scott D, Dikici E, Ensor M and Daunert S, Annu. Rev. Anal. Chem, 2011, 4, 297–319. [DOI] [PubMed] [Google Scholar]
- 15.Sharpe M, Hastings WD and Krause KL, in eLS, John Wiley & Sons, Ltd, 2014, DOI: 10.1002/9780470015902.a0003064.pub2. [DOI] [Google Scholar]
- 16.Shimomura O, Bioluminescence, World Scientific, 2011. [Google Scholar]
- 17.Caysa H, Jacob R, Muther N, Branchini B, Messerle M and Soling A, Photochem. Photobiol. Sci, 2009, 8, 52–56. [DOI] [PubMed] [Google Scholar]
- 18.Grinstead KM, Rowe L, Ensor CM, Joel S, Daftarian P, Dikici E, Zingg JM and Daunert S, PLoS One, 2016, 11(7), e0158579. [DOI] [PMC free article] [PubMed] [Google Scholar]
- 19.Shakhmin A, Hall MP, Machleidt T, Walker JR, Wood KV and Kirkland TA, Org. Biomol. Chem, 2017, 15, 8559–8567. [DOI] [PubMed] [Google Scholar]
- 20.Yeh HW, Karmach O, Ji A, Carter D, Martins-Green MM and Ai HW, Nat. Methods, 2017, 14, 971–974. [DOI] [PMC free article] [PubMed] [Google Scholar]
- 21.Ito K, Nishimura W, Maeda M, Gomi K, Inouye S and Arakawa H, Anal. Chim. Acta, 2007, 588, 245–251. [DOI] [PubMed] [Google Scholar]
- 22.Frank LA, Borisova VV, Markova SV, Malikova NP, Stepanyuk GA and Vysotski ES, Anal. Bioanal. Chem, 2008, 391, 2891–2896. [DOI] [PubMed] [Google Scholar]
- 23.Van de Bittner GC, Bertozzi CR and Chang CJ, J. Am. Chem. Soc, 2013, 135, 1783–1795. [DOI] [PMC free article] [PubMed] [Google Scholar]
- 24.Rowe L, Combs K, Deo S, Ensor C, Daunert S and Qu X, Anal. Chem, 2008, 80, 8470–8476. [DOI] [PubMed] [Google Scholar]
- 25.Head JF, Inouye S, Teranishi K and Shimomura O, Nature, 2000, 405, 372–376. [DOI] [PubMed] [Google Scholar]
- 26.Prendergast FG, Nature, 2000, 405, 291–293. [DOI] [PubMed] [Google Scholar]
- 27.Dikici E, Qu X, Rowe L, Millner L, Logue C, Deo SK, Ensor M and Daunert S, Protein Eng., Des. Sel., 2009, 22, 243–248. [DOI] [PMC free article] [PubMed] [Google Scholar]
- 28.Stepanyuk GA, Golz S, Markova SV, Frank LA, Lee J and Vysotski ES, FEBS Lett, 2005, 579, 1008–1014. [DOI] [PubMed] [Google Scholar]
- 29.Tricoire L, Tsuzuki K, Courjean O, Gibelin N, Bourout G, Rossier J and Lambolez B, Proc. Natl. Acad. Sci. U. S. A, 2006, 103, 9500–9505. [DOI] [PMC free article] [PubMed] [Google Scholar]
- 30.Tsuzuki K, Tricoire L, Courjean O, Gibelin N, Rossier J and Lambolez B, J. Biol. Chem, 2005, 280, 34324–34331. [DOI] [PubMed] [Google Scholar]
- 31.Malikova NP, Borgdorff AJ and Vysotski ES, Photochem. Photobiol. Sci, 2015, 14, 2213–2224. [DOI] [PubMed] [Google Scholar]
- 32.Rowe L, Rothert A, Logue C, Ensor CM, Deo SK and Daunert S, Protein Eng., Des. Sel., 2008, 21, 73–81. [DOI] [PubMed] [Google Scholar]
- 33.Zheng JL, Chen FQ, Hirano T, Ohmiya Y, Maki S, Niwa H and Ohashi M, Bull. Chem. Soc. Jpn, 2000, 73, 465–469. [Google Scholar]
- 34.Akdis M, Burgler S, Crameri R, Eiwegger T, Fujita H, Gomez E, Klunker S, Meyer N, O’Mahony L, Palomares O, Rhyner C, Ouaked N, Schaffartzik A, Van De Veen W, Zeller S, Zimmermann M and Akdis CA, J. Allergy Clin. Immunol, 2011, 127, 701–21.e1–70. [DOI] [PubMed] [Google Scholar]
- 35.Rincon M, Trends Immunol, 2012, 33, 571–577. [DOI] [PubMed] [Google Scholar]
- 36.Sriramula S and Francis J, PLoS One, 2015, 10, e0138372. [DOI] [PMC free article] [PubMed] [Google Scholar]
- 37.Stenken JA and Poschenrieder AJ, Anal. Chim. Acta, 2015, 853, 95–115. [DOI] [PMC free article] [PubMed] [Google Scholar]
- 38.Diamandis EP, Clin. Chem. Lab. Med, 2015, 53, 989–993. [DOI] [PubMed] [Google Scholar]
- 39.Diamandis EP, Clin. Chem. Lab. Med, 2016, 54, e243–e244. [DOI] [PubMed] [Google Scholar]
- 40.Li M and Diamandis EP, Clin. Chem. Lab. Med, 2015, 53, 1911–1912. [DOI] [PubMed] [Google Scholar]
- 41.Li M and Diamandis EP, Clin. Chem. Lab. Med, 2016, 54, e145–e146. [DOI] [PubMed] [Google Scholar]
- 42.Feltus A, Grosvenor AL, Conover RC, Anderson KW and Daunert S, Anal. Chem, 2001, 73, 1403–1407. [DOI] [PubMed] [Google Scholar]
- 43.Ohkuma H, Abe K, Kosaka Y and Maeda M, Luminescence, 2000, 15, 21–27. [DOI] [PubMed] [Google Scholar]
- 44.Garcia-Hernandez P, Prieto B, Martinez-Morillo E, Rodriguez V and Alvarez FV, Ann. Clin. Biochem, 2016, 53, 155–163. [DOI] [PubMed] [Google Scholar]
- 45.Paquette SG, Banner D, Zhao Z, Fang Y, Huang SSH, Leon AJ, Ng DCK, Almansa R, Martin-Loeches I, Ramirez P, Socias L, Loza A, Blanco J, Sansonetti P, Rello J, Andaluz D, Shum B, Rubino S, de Lejarazu RO, Tran D, Delogu G, Fadda G, Krajden S, Rubin BB, Bermejo-Martin JF, Kelvin AA and Kelvin DJ, PLoS One, 2012, 7(6), e38214. [DOI] [PMC free article] [PubMed] [Google Scholar]
- 46.Scheller J, Chalaris A, Schmidt-Arras D and Rose-John S, Biochim. Biophys. Acta, 2011, 1813, 878–888. [DOI] [PubMed] [Google Scholar]
- 47.Urquidi V, Chang M, Dai YF, Kim J, Wolfson ED, Goodison S and Rosser CJ, BMC Urol, 2012, 12, 12. [DOI] [PMC free article] [PubMed] [Google Scholar]
- 48.dos Santos PL, de Oliveira FA, Santos MLB, Cunha LCS, Lino MTB, de Oliveira MFS, Bomfim MOM, Silva AM, de Moura TR, deJesus AR, Duthie MS, Reed SG and de Almeida RP, PLoS Neglected Trop. Dis, 2016, 10, DOI: 10.1371/journal.pntd.0004375. [DOI] [Google Scholar]
- 49.Kobawala TP, Patel GH, Gajjar DR, Patel KN, Thakor PB, Parekh UB, Patel KM, Shukla SN and Shah PM, J. Thyroid Res, 2011, 2011, 270149. [DOI] [PMC free article] [PubMed] [Google Scholar]
- 50.Malamitsi-Puchner A, Protonotariou E, Boutsikou T, Makrakis E, Sarandakou A and Creatsas G, Early Hum. Dev, 2005, 81, 387–392. [DOI] [PubMed] [Google Scholar]
- 51.Tefferi A, Vaidya R, Caramazza D, Finke C, Lasho T and Pardanani A, J. Clin. Oncol, 2011, 29, 1356–1363. [DOI] [PubMed] [Google Scholar]
Associated Data
This section collects any data citations, data availability statements, or supplementary materials included in this article.


