

Abstract
Histone methylation patterns in the human genome, especially in euchromatin regions, have not been systematically characterized. In this study, we examined the profile of histone H3 methylation (Me) patterns at different lysines (Ks) in the coding regions of human genes by genome-wide location analyses by using chromatin immunoprecipitation linked to cDNA arrays. Specifically, we compared H3-KMe marks known to be associated with active gene expression, namely, H3-K4Me, H3-K36Me, and H3-K79Me, as well as those associated with gene repression, namely, H3-K9Me, H3-K27Me, and H4-K20Me. We further compared these to histone lysine acetylation (H3-K9/14Ac). Our results demonstrated that: first, close correlations are present between active histone marks except between H3-K36Me2 and H3-K4Me2. Notably, histone H3-K79Me2 is closely associated with H3-K4Me2 and H3-K36Me2 in the coding regions. Second, close correlations are present between histone marks associated with gene silencing such as H3-K9Me3, H3-K27Me2, and H4-K20Me2. Third, a poor correlation is observed between euchromatin marks (H3-K9/K14Ac, H3-K4Me2, H3-K36Me2, and H3-K79Me2) and heterochromatin marks (H3-K9Me2, H3-K9Me3, H3-K27Me2, and H4-K20Me2). Fourth, H3-K9Me2 is neither associated with active nor repressive histone methylations. Finally, histone H3-K4Me2, H3-K4Me3, H3-K36Me2, and H3-K79Me2 are associated with hyperacetylation and active genes, whereas H3-K9Me2, H3-K9Me3, H3-K27Me2, and H4-K20Me2 are associated with hypoacetylation. These data provide novel new information regarding histone KMe distribution patterns in the coding regions of human genes.
Nucleosomes of chromatin are composed of genomic DNA wrapped around an octamer of core histone proteins consisting of two copies of histones H2A, H2B, H3, and H4 (26). The packaging of genes into chromatin restricts the access of transcription factors and the basal transcription machinery to target promoters. Chromatin is not only a scaffolding structure for genomic DNA but also a dynamic entity that can regulate gene expression and cellular functions. Transcriptional activation and repression of genes are dynamic processes in which the inaccessible compact and repressive nucleosome of heterochromatin is converted to the accessible euchromatin or vice versa. It is now clear that, apart from the binding of transcription factors to their cognate promoter DNA-binding sites, gene activation or repression is also linked to the recruitment of protein complexes that alter chromatin structure and architecture via enzymatic modifications of histone tails and/or nucleosome remodeling. The N termini of histones H3 and H4 are subject to a variety of modifications, including acetylation, phosphorylation, methylation, ubiquitination, and ADP ribosylation (49, 50, 61). These modifications form the basis of the “histone code” which postulates that both the kind and number of histone tail modifications dictate specific transcriptional states and biological outcomes (15, 50, 54, 55). Although these modifications have been observed several years back, their subtle interrelationships and potential functional significance are only recently becoming apparent. However, very little is still known about the biological and physiological outcomes of histone modifications in humans.
Histone lysine acetylation and deacetylation, mediated by coactivator histone acetylases and repressor histone deacetylases, respectively, have been shown to play significant roles in gene expression. Whereas histone lysine acetylation has been extensively studied, it was only recently observed that histone lysine methylation can also cooperate with other factors to regulate chromatin structure and gene transcription negatively or positively (21, 25, 32, 60). Unlike histone lysine acetylation and phosphorylation, histone lysine methylation is generally considered more stable and inheritable. Therefore, changes in histone methylation status can switch a gene from one state to another. However, accumulating new evidence reveals that histone methylation can also be dynamic in cells (1, 43).
Evidence shows that methylations at key histone lysines, H3-K4, H3-K36, and H3-K79 are enriched in transcriptionally active euchromatin, whereas methylations at H3-K9, H3-K27, and H4-K20 are enriched transcriptionally repressed chromatin regions (49). In mammals, a growing body of research has documented the nature of specific histone lysine methyltransferases (HMTs) which methylate histones at H3-K4 (12, 59), H3-K9 (20, 29, 35, 39), H3-K27 (20, 29, 35), H3-K36 (38), H3-K79 (10), and H4-K20 (31). In addition, histone lysine (K) methylation (Me) can be found either in a mono-, di-, or tri-methylated state (KMe, KMe2, and KMe3) (8, 20, 44, 53), and the extent of methylation seems to correlate with the degree of gene activation or silencing (49). Histone lysine methylations have been shown to form an important regulatory layer of transcription. Hence, an evaluation of their key interrelationships on human genes can yield new information and also provide support to the “histone code” concept (15, 50, 54, 55).
Numerous recent efforts have demonstrated that histone lysine modifications indeed participate in many essential biological processes ranging from gene activation, silencing, and repression to X-chromosome inactivation (22, 23). Interestingly, recent evidence shows that elongating RNA polymerase II physically interacts with histone methyltransferases (17, 30), thereby clearly suggesting that RNA polymerase II elongation factors regulate the overall rate of transcription both in vitro and in vivo via histone methylation (11, 13, 47). These new studies indicate that histone modifications occurring not only in the promoter regions but also in the coding regions of genes can play important roles in gene regulation and expression. In fact, the first evidence that systematically demonstrated this came from the study in yeast showing that there is more histone H3-K4 dimethylation (H3-K4Me2) in the coding regions of active genes than in the promoter regions (4), although it was not fully attributed to the involvement of RNA polymerase II. Overall, there is convincing evidence in support of histone methylation in the coding regions of genes. However, the distribution patterns of histone methylation, particularly in human genes, and their roles in transcriptional regulation are largely unknown.
The genome-wide location analysis (GWLA) tool allows protein-DNA interactions to be monitored across the entire genome (40). This method combines chromatin immunoprecipitation (ChIP) procedure with a genomic DNA microarray (ChIP-array). GWLAs for transcription factors have been recently performed and provide substantial information about gene transcription networks (24, 27, 33). This principle has also been utilized to map histone acetylation and methylation in yeast (4, 42). Mapping histone modifications in humans is particularly hampered by the fact that the majority of the available human DNA microarrays are cDNA arrays and human whole-genome arrays, unlike yeast arrays, are not yet well developed. However, we noticed that cDNA arrays have been used for comparative genomic hybridization (CGH) analyses, where they provide very high mapping resolution for ratiometric measurement of variation in copy number of genomic DNA (37). cDNA arrays provide a very attractive platform for CGH analysis because they are well characterized and widely used. Based on the successful use of cDNA microarrays in CGH analysis, in the present study, we mapped histone methylations within the coding regions of human genes by the ChIP-cDNA array approach for the first time. Our results demonstrate not only the feasibility of this GWLA approach but also its ability to identify novel new genome-wide histone methylation patterns. Furthermore, the results provide robust and accurate data that further support and increase our understanding of the “histone code.”
MATERIALS AND METHODS
Antibodies.
Anti-dimethylated-histone H3-K4, K9, K27, K36, K79, H4-K20, anti-trimethylated-histone H3-K4, K9 and anti-acetyl-histone H3-K9/K14 were purchased from Upstate Biotechnology (Lake Placid, NY).
Microarrays.
Human 1.7k cDNA arrays were purchased from the Universal Health Network Microarray Center (Toronto, Ontario, Canada). The array contains 1,781 double-spotted well-characterized human expressed sequence tags. Most of the spots are associated with a Swiss-Prot ID.
Culture of THP-1 cells.
Human THP-1 monocytic cells were maintained as described previously (28) in RPMI 1640 medium containing 10% heat-inactivated fetal calf serum, HEPES (10 mM), glutamine (2 mM), streptomycin (50 μg/ml), penicillin (50 U/ml), β-mercaptoethanol (50 μM), and 5.5 mM glucose in a 5% CO2 incubator at 37°C.
ChIP assays.
ChIP assays were performed according to described protocols (28, 40) with some modifications. Briefly, THP-1 cells (5 × 10⁷) were cross-linked in 1% formaldehyde for 40 min, washed twice in phosphate-buffered saline, and resuspended in lysis buffer (1% sodium dodecyl sulfate [SDS], 10 mM EDTA, 50 mM Tris-HCl [pH 8.1], 1× protease inhibitor cocktail [Roche Molecular Biochemicals]) and sonicated one to three times for 30 s each time at the 40% maximum setting of the sonicator (Branson model 250), followed by centrifugation for 10 min. One-fifth of the total lysate was used for the “no-antibody” control. Supernatants were collected and diluted in buffer (1% Triton X-100, 2 mM EDTA, 150 mM NaCl, 20 mM Tris-HCl [pH 8.1], 1× protease inhibitor cocktail), followed by immunoclearing with sheared salmon sperm DNA for 1 h at 4°C. Immunoprecipitation was performed for 15 h at 4°C with 10 to 20 μg of prelinked antibody-Sepharose. Precipitates were then washed twice with distilled water and extracted twice with 1% SDS containing 0.1 M NaHCO3. Eluates were pooled and heated at 65°C for at least 6 h to reverse the formaldehyde cross-links. Part of the ChIPed DNA was used for conventional ChIP PCRs using primers shown in Table S2 in the supplemental material. mRNA expression of key genes was performed by reverse transcription-PCR (RT-PCR) analyses with the primers presented in Table S2 in the supplemental material.
Amplification of ChIP-assayed genomic DNA and labeling of amplified DNA.
ChIP DNA was amplified by ligation-mediated PCR. For this, DNA was blunted with T4 DNA polymerase, purified, and ligated with linker (5′-GCGGTGACCCGGGAGATCTGAATTC-3′ and 5′-GAATTCAGATC-3′) overnight at 16°C. After purification on Qiagen spin columns, one-fourth of the DNA was used for PCR amplification (20 cycles) with the primer 5′-GCGGTGACCCGGGAGATCTGAATTC-3′. The PCR products were purified by using Qiagen spin columns and eluted with 100 μl of Tris-EDTA (TE) buffer. A total of 200 ng of DNA from the previous step was mixed with 20 μl of 2.5× random primer solution (Invitrogen) and distilled water in a final volume of 42.5 μl. The mixture was boiled for 5 min and then cooled on ice for 5 min. Subsequently, 5 μl of 10× low dCTP nucleotide mixture (2.5 mM concentrations each for dATP, dTTP, and dGTP, plus 0.6 mM dCTP), 2.5 μl of Cy5-dCTP or Cy3-dCTP (Perkin-Elmer), and 40 U of Klenow DNA polymerase (Invitrogen) were added, followed by incubation at 37°C for 8 h. The labeled DNA was then concentrated to 25 μl by using an Amicon Microcon YM-30 (Millipore, Bedford, MA).
Hybridization and washing of microarrays.
In a new Eppendorf tube, the previous Cy5-labeled ChIP DNA was mixed with Cy3-labeled genomic DNA and 30 μg of human Cot-1 DNA (Invitrogen), 100 μg of yeast total tRNA (Roche), and 20 μg of poly(dA-dT) (Sigma) and adjusted to contain 3.4 × SSC (1× SSC is 0.15 M NaCl plus 0.015 M sodium citrate) and 0.3% SDS in a final volume of 100 μl. The mixture was first heated at 95°C for 5 min to denature, cooled at 25°C for 5 min, and then gently spotted onto human 1.7k cDNA microarray slides. A 25-by-60-mm coverslip (Erie Scientific Company, Portsmouth, NH) was then gently placed on top of the sample, and hybridization was performed in an Array IT hybridization cassette at 65°C overnight in a water bath. The microarray slides were then washed once with wash buffer 1 (2× SSC, 0.1% SDS) at 60°C for 5 min in a glass slide staining dish. This was followed by washes with buffer 2 (0.2 × SSC, 0.1% SDS) for 10 min at room temperature and buffer 3 (0.2× SSC) at room temperature. A brief spinning at 1,000 × g was then performed in a tabletop centrifuge to dry the slide.
Microarray data collection and statistical analyses.
The hybridized microarray slides were scanned by using GenePix 4000B scanner (Axon Instruments; Foster City, CA). Acquired microarray images were analyzed with Genepix PRO 4.1 software. Spots with aberrant morphology or those with intensities below the threshold of detection were flagged and subsequently deleted from the data sets. Then the mean ratios were normalized through the standardization and normalization of microarray data (SNOMAD) web utility, based on the R statistical language (7). Through SNOMAD, the signal intensity in each channel of each sample was normalized by a global mean of that channel's intensities. The normalized intensity data were converted into log2 values, and log2 signal ratios and log2 mean intensities were calculated. Log2 ratios were normalized across local log2 mean intensities through use of the “loess” function of R. Details are available in Table S3 in the supplemental material.
For the calculation of Pearson r values, the normalized log2 ratios of each gene were averaged between all of the samples of each histone modification. Scatter plots and Pearson correlations between pairs of groups were determined by using GraphPad Prism software (San Diego, CA), and the resulting Pearson r values were calculated.
For identification of candidate genes, we implemented a statistical technique called significance analysis of microarrays (SAM) (56). We performed a one-class analysis of each modification. Delta values were chosen at a false discovery rate of 1% on microarrays, and the target candidates were chosen as those that also meet the criteria of 635/532 nm ratios of 2.0 over the average of total ratio as a cut off (details of all of the methylated candidates in each group are available in Table S4 in the supplemental material).
RESULTS
H3-K4Me2 and H3-K9Me2 in the coding regions of human genes have distinct distribution patterns and H3-K4Me3 is associated with H3-K4Me2.
We first mapped histone H3-K4 and H3-K9 methylations, since these two H3 lysine modifications are considered to be hallmarks of euchromation and heterchromatin, respectively, and it is now accepted that H3-K4 methylation correlates with active genes, whereas H3-K9 methylation is associated with inactive or silenced genes (49). Using specific antibodies (Abs) to dimethylated histone H3-K4 (H3-K4Me2) and dimethylated H3-K9 (H3-K9Me2), we implemented GWLA in human THP-1 monocytic cells as described in Materials and Methods. The rationale for choosing THP-1 cells is that they are of the monocytic lineage, and studies with this cell type can potentially be extrapolated to human blood cells to determine disease relevance. Ligation-mediated PCR-amplified ChIP DNA and the no-antibody control from the THP-1 cells were labeled with Cy5 or Cy3 fluorophores, respectively. They were then combined and hybridized to human 1.7K cDNA arrays as described in Materials and Methods. The data were normalized by determining the ratios of total intensities between Cy5 and Cy3 over the entire array. We set 635/532-nm ratios of 2 over the average of total ratio as a cutoff line. We used SAM (56) to identify genes with ratios of >2 (red dots) that are defined as candidate genes.
Representative virtual gene array scans are shown in Fig. 1A. The cDNA arrays are spotted with human cDNAs in duplicate side by side. As shown in the Venn diagram in Fig. 1B, analysis of the gene array data with Genespring 4.0 software revealed that 87% of genes displaying H3-K4Me2 within their coding regions or open reading frames (ORFs) were not present in the H3-K9Me2 group and vice versa (Fig. 1B, left panel). About 13% of the genes had both H3-K4Me2 and H3-K9Me2. Thus, gene spots with red dye on the left panel of Fig. 1A are not red colored on the right. Previous studies evaluating one gene at a time have shown that, if the promoter of a specific gene is methylated at histone H3-K9, it is generally not methylated at histone H3-K4 and that histone H3-K4Me2 and H3-K9Me2 signals represent opposite functions. The data presented here demonstrate that this concept is applicable globally to coding regions in the 1.7K human gene arrays and is probably applicable genome-wide to all coding regions in human genes.
FIG. 1.


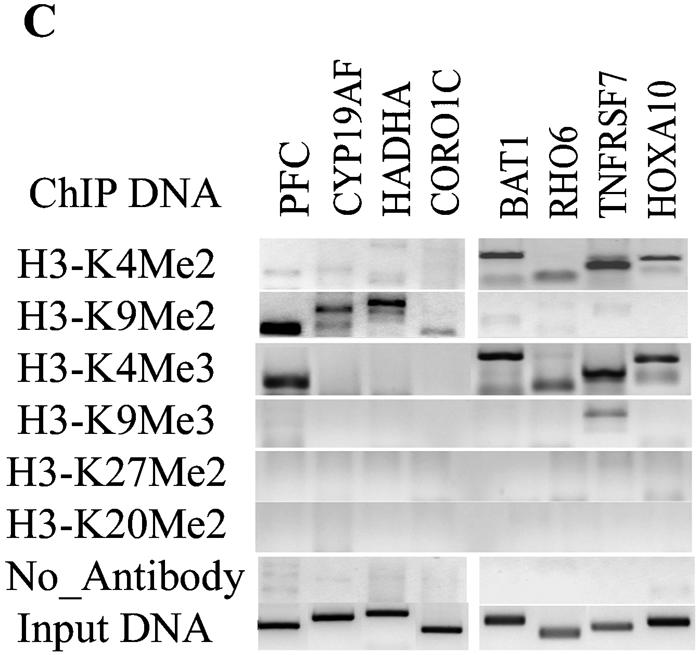
Genome-wide location analysis of histone H3-K4 and H3-K9 dimethylation (Me2) in human coding regions. (A) Virtual gene array images of histone H3-K4Me2 and H3-K9Me2 patterns. The human 1.7k cDNA arrays used contain 1,781 double-spotted well-characterized human expressed sequence tags. Mapping of H3-K4Me2 and H3-K9Me2 in human coding regions reveals their opposite distribution pattern. (B) Venn diagrams comparing candidate genes from H3-K4Me2/H3-K9 Me2 and H3-K4Me2/H3-K4Me3 data sets. The data from three experiments were averaged, and the genes were identified as methylated candidates as described in Materials and Methods. Venn diagram analyses were done by using GeneSpring. Details of all of the methylated candidates in each group are available in Table S4 in the supplemental material. (C) Conventional ChIP assays were carried out on selected methylated genes from the H3-K4Me2 and H3-K9Me2 candidate list to confirm microarray results. ChIP DNA used as a template was obtained by using antibodies to histone H3 methylated at various lysines. (D) RT-PCR analyses were performed with total RNA prepared from THP-1 cells to examine the mRNA expression of selected candidates. 18S RNA was used as an internal control.
A unique feature of histone lysine methylation is that it has three levels of methylation states. The ε-amino group of lysine can be mono-, di-, or trimethylated by distinct histone methylases. Although the biological significance of these levels of methylation is not fully known, several studies indicate that they correlate with gene expression. For example, trimethylated H3-K4 (H3-K4Me3) is exclusively present in newly active genes and therefore seems to define “the most recently” active state of gene expression (44). We carried out GWLA to profile H3-K4Me3, and the corresponding results are illustrated in Fig. 1B (right panel). As expected, H3-K4Me3 was found to show marked overlap with H3-K4Me2. Among 174 H3-K4Me3 candidate genes, 99 were shared with H3-K4Me2, thus confirming that these two K4 methylation levels closely correlate with each other in the coding regions of human genes. As suggested earlier (44), genes with H3-K4Me3 marks may represent the most recently transcribed genes.
We then performed follow-up conventional ChIPs (Fig. 1C) on a random selection of candidate genes (three to five in each group) to validate the accuracy of this method and confirm that target genes identified in the microarray screen. PCR primers were designed for the candidate genes PFC, CYP19A1, HADHA, and CORO1C chosen from the H3-K9Me2 list (primer sequences available in Table S2 in the supplemental material). The conventional ChIP results in Fig. 1C confirm that the ChIPed DNA obtained with the H3-K9Me2 antibody is indeed enriched with these genes but not with H3-K4Me2 candidates genes (second panel). Similarly, we confirmed that BAT1, RHO6, TNFRSF7 and HOXA10 genes are enriched in H3-K4Me2 and H3-K4Me3 but not H3-K9Me2 ChIPed DNA (Fig. 1C) (first and third panels). The only exception is PFC gene which was positive in the conventional H3-K4Me3 ChIP (Fig. 1C) although the microarray data indicated that PFC should not enriched in the H3-K4Me3 ChIP (see Table S3 in the supplemental material). We also performed PCRs with primers for these candidates by using histone H3-K9Me3, H3-K27Me2 and H4-K20Me2 ChIP DNA as a template (see subsequent sections). Figure 1C shows that none of these candidates genes depicted methylation at these other sites. These results validate our gene array data and analysis of target genes.
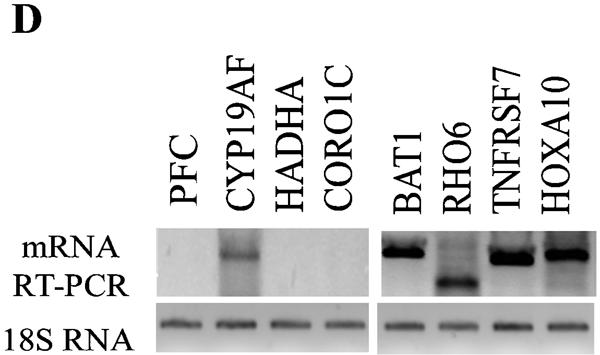
We then examined whether the specific histone methylation patterns correlate with mRNA expression (by RT-PCR). Figure 1D shows that mRNAs of four genes (BAT1, RHO6, TNFRSF7, and HOXA10) whose ORFs were H3-K4 methylated were clearly expressed. Conversely, genes whose ORFs were H3-K9 methylated (PFC, HADHA, and CORO1C) did not show any mRNA expression, whereas CYP19AF showed a weak band. Overall, the results in Fig. 1 validate the accepted notion that K9Me2 and K4Me2 have opposite functions (gene silencing versus activation) and confirm that our ChIP-cDNA array approach can profile histone modifications in a robust manner.
H3-K79Me2 is closely associated with both H3-K4Me2 and H3K36Me2, whereas the correlation between H3-K4Me2 and H3K36Me2 is low.
Next, we mapped histone H3-K79Me2 and H3-K36Me2 in THP-1 monocytes. Methylation at H3-K79, as well as at H3-K4 and H3-K36, is considered to be associated with transcriptionally active euchromatin (49). In mammals, Dot1L (10) methylases are currently implicated in K79 methylation. The GWLA with Abs to dimethylated-histone H3-K79 showed that genes with H3-K79Me2 are closely associated with H3-K4Me2 (Fig. 2A). Among the 223 H3-K4Me2 candidates and 179 H3-K79Me2 candidates, there were ca. 63 overlapping genes (Venn diagram in Fig. 2A). These new data are in agreement with the recent report that methylations at histone H3-K4 and H3-K79 are associated with active genes in Drosophila (46). Our data support the notion that H3-K4Me2/K79Me2 represents a specific methylation pattern in the coding regions of human genes.
FIG. 2.


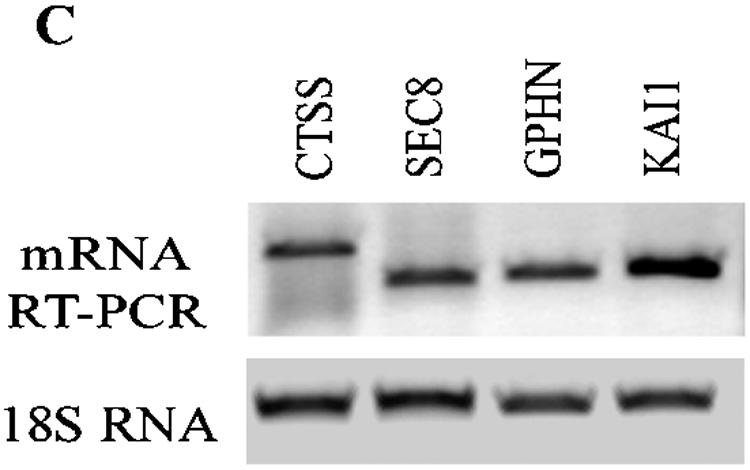

Genome-wide location analysis of histone H3-K79, H3-K36, and H3-K4 methylation in human coding regions. (A) Venn diagram comparing candidate genes from H3-K4, H3-K36, and H3-K79 dimethylation data sets. The data from three experiments were averaged, and the genes identified as methylated candidates were as described in Materials and Methods. Venn diagram analyses were performed with GeneSpring software. Details of all of the methylated candidates in each group are available in Table S4 in the supplemental material. (B) Conventional ChIP assays with selected methylated genes from the H3-K4Me2, H3-K36Me2, and H3-K79Me2 candidates list (upper panel). The histone methylation status from ChIP-array is presented in the lower panel. (C) RT-PCR analysis performed on total RNA prepared from THP-1 cell line to examine the mRNA expression of selected H3-K79Me2 and H3-K36Me2 candidate genes with 18S RNA as internal control. (D) Histone H3-K4Me2 and H3-K36Me2 ChIP analysis of multiple sections of the transcribed regions of CD37, ICAM3, KLF1, and MCAM. Conventional ChIP PCRs performed to walk over the transcribed regions of CD37, ICAM3, KLF1, and MCAM (lower panel). The upper panel shows regions on each gene that were amplified. The numbers indicate the locations of the PCR primers. The primer sequences are available in Table S2 in the supplemental material.
We also mapped histone H3-K36Me2 in THP-1 monocytes and compared this data set with other active histone methylation data sets. Interestingly, we found H3-K36Me2 is also closely associated with H3-K79Me2. Among the 134 H3-K36Me2 candidates and 179 H3-K79Me2 candidates, 108 genes showed overlap (Venn diagram in Fig. 2A), and this association represents a newly identified histone methylation pattern, namely, H3-K36Me2/K79Me2 in the active coding regions.
Similar to our validation of array data with H3-K4Me2 and H3-K9Me2 genes, we performed conventional ChIPs to verify the accuracy of the observed H3-K4Me2, H3-K36, and H3-K79 methylation candidates. Candidate genes tested in the conventional ChIP assays were chosen from those present in the paired combinations of H3-K4Me2, H3-K79Me2, and H3K36Me2 groups as shown in Fig. 2B. These include K4Me2/K36Me2/K79Me2 (VDR, S100A10), K4Me2/K79Me2 (TAP1, DR1, BAT1, and HOXA10), K4Me2 (TNFRSF7 and RHO6), and H36Me2/K79Me2 (CTSS, SEC8L1, GPHN, and KAI1). The conventional ChIP PCR results in the upper panel are to a large extent consistent with the corresponding methylation status of each gene obtained from the microarray (lower panel). We then examined mRNA expression of CTSS, SEC8L1, GPHN, and KAI1 by RT-PCR and noted that these genes are indeed expressed (Fig. 2C). Overall, these results further illustrate the power of the ChIP-array approach to map histone methylations and to distinguish genes or regions according to their methylation patterns.
Taken together, our new results in this section suggest that active lysine methylation pairs that generally occur together in the coding regions of human genes are H3-K4Me2/K79Me2 and H3-K36Me2/K79Me2. Relatively fewer numbers of genes appear to have H3-K4Me2/K36M3/K79Me2 in the coding regions.
Comparative analyses (shown in Table 1) revealed that the correlation between H3-K4Me2 and H3-K36Me2 is markedly lower than that seen for the H3-K4Me2/K79Me2 pair or the H3-K36Me2/K79Me2 pair. The Pearson correlation coefficient (r) between these two groups (0.37) is significantly lower than other active histone methylation pairs such as H3-K4/K79 (0.61) and H3-K36/K79 (0.81). The Venn diagram (Fig. 2A) reveals that, among the 223 H3-K4Me2 candidates and 134 H3-K36Me2 candidates, there were only ca. 24 overlapping genes. Interestingly, we found that among the 24 candidate genes with both H3-K4Me2 and K36Me2 marks, majority of them are also displayed H3-K79Me2 (21 of 24, Fig. 2A). It must be pointed out that in yeast, H3-K4 methylation (particularly H3-K4Me3) appears to be biased toward the 5′ ends of genes, whereas H3-K36 methylation is biased toward the 3′ end. It is quite possible that differences in K4 and K36 patterns and the low degree of overlap that we observed may reflect which part of the gene is on the array and related to the limitation of the array design. Thus, K4 and K36 methylation may show overlap in regions of genes not represented in the array.
TABLE 1.
Summary of the correlations between histone methylation and acetylation at specific lysines in the coding regions of human genesa
| Histone | No. of genes (r)
|
||||||||
|---|---|---|---|---|---|---|---|---|---|
| H3-K9/14Ac | H3-K4Me2 | H3-K4Me3 | H3-K36Me2 | H3-K79Me2 | H3-K9Me2 | H3-K9Me3 | H4-K20Me2 | H3-K27Me2 | |
| H3-K9/14Ac | 231 (1) | ||||||||
| H3-K4Me2 | 129 (0.72) | 223 (1) | |||||||
| H3-K4Me3 | 100 (0.64) | 99 (0.58) | 174 (1) | ||||||
| H3-K36Me2 | 54 (0.56) | 24 (0.37) | 12 (0.35) | 134 (1) | |||||
| H3-K79Me2 | 95 (0.72) | 63 (0.61) | 46 (0.56) | 108 (0.81) | 179 (1) | ||||
| H3-K9Me2 | 29 (0.12) | 30 (0.13) | 30 (0.09) | 9 (0.01) | 14 (0.04) | 213 (1) | |||
| H3-K9Me3 | 13 (−0.06) | 18 (−0.08) | 5 (0.03) | 3 (−0.15) | 5 (−0.1) | 10 (0.22) | 93 (1) | ||
| H4-K20Me2 | 9 (−0.21) | 22 (0.09) | 3 (−0.24) | 2 (−0.61) | 3 (−0.39) | 10 (0.03) | 52 (0.54) | 88 (1) | |
| H3-K27Me2 | 16 (−0.28) | 28 (0.001) | 8 (−0.26) | 1 (−0.69) | 4 (−0.49) | 12 (0.06) | 62 (0.48) | 83 (0.92) | 138 (1) |
The values shown represent the number of genes shared in the Venn diagram comparisons. The adjacent values in parentheses are Pearson correlation coefficients(r) that were calculated for each corresponding pair of histone modifications. Scatter plots and Pearson correlations (r values) between pairs of groups were determined and calculated by using GraphPad Prism software.
However, it should be underscored that in Saccharomyces cerevisiae, disruption of either ubiquitination or Ubp-mediated deubiquitination of H2B resulted in altered levels of gene-associated H3-K4 and K36 methylation (14). Hypo- and hyperubiquitination had opposite effects on K4 and K36 methylation. Thus, when there was low ubiquitination, there was low K4 trimethylation and high K36 dimethylation and vice versa. This is consistent with our observation, i.e., if a specific region of a gene is hypermethylated at K4, it may be hypomethylated at K36. In order to further confirm whether K4Me2 and K36Me2 candidates do indeed have low overlap, we next performed a PCR “walk” over whole transcribed regions of selected genes. We chose four genes, including two H3-K4Me2 candidates (CD37 and ICAM3) and two H3-K36M2 candidates (KLF1 and MCAM), to perform the PCR walk with H3-K4Me2 and K36Me2 ChIP DNA (primer sequences are provided in the supplemental material). The results of these extensive PCR analyses are depicted in Fig. 2D. The upper panel shows the PCR primer locations, whereas the lower panels show the PCR data using the ChIP DNA as indicated. It is seen that the PCR scan results with three of four genes in Fig. 2D support our suggestion with respect to K4 and K36 methylation. H3-K4Me2 is enriched in ICAM3, whereas H3-K36Me2 is enriched in KLF1 and MCAM. However, H3-K36Me2 is not completely excluded on ICAM3 and H3-K4Me2 is not fully excluded on KLF1 and MCAM. With respect to the fourth gene CD37, although we noted both K4 and K36 methylation in the same regions of the gene, some nonspecific bands were also present in the no-antibody control. However, we are aware that the gene transcripts we examined are relatively short (4 to 10 kb) and that histone methylation may switch from one type to another in longer transcripts. Another limitation is the number of conventional ChIPs that we have performed and also, as mentioned before, the limitations associated with the microarrays used. Hence, our results may not provide the clearest relationship between K4Me2 and K36Me2 in the coding regions. This could be resolved in the near future by the use of novel DNA tiling microarrays.
Histone H3-K9Me3, H3-K27Me2, and H4K20Me2 are associated with each other in the coding regions of human genes.
Methylation at H3-K9, H3-K27, and H4-K20 are generally related to gene silencing or repression (49). In mammals, the proteins Suv39h1/Suv39h2, Ezh2, a polycomb group (PcG) protein, and PR-Set7 have been implicated in the trimethylation of the H3-K9 and dimethylation of H3-K27 and H4-K20, respectively (20, 29, 31). In order to determine the global relationships between methylations at these positions, we next performed GWLA of H3-K9Me3, H4-K20Me2, and H3-K27Me2 in THP-1 monocytic cells using the same approach. The results (Venn diagram in Fig. 3A) reveal close correlations among histones H3-K9Me3, H3-K27Me2, and H4-K20Me2 in the coding regions. Between 88 identified H4-K20Me2 and 138 H3-K27Me2 candidates, 83 genes were shared; between 88 identified H4-K20Me2 and 93 H3-K9Me3 candidates, 52 genes were shared; between 127 identified H3-K27Me2 and 93 H3-K9Me3 candidates, 62 genes were shared; and finally, 51 gene candidates were shared among H3-K9Me3, H4-K20Me2, and H3-K27Me2. These results also suggest for the first time that a H3-K9Me3, H3-K27Me2, and H4-K20Me2 pattern occurs in the coding regions of human genes. Notably, it has been reported that H3-K9, H4-K20, and H3-K27 methylations are enriched at pericentric, centromeric, and telomere regions of chromatin and also in imprinted genes (34, 36, 45, 49). Interestingly, in our analyses, we found that some of our identified methylated candidates in the gene array are also located at these regions. For instance, SERPING1 is found around centromeric, whereas MLLT4 is found in telomeric regions.
FIG. 3.


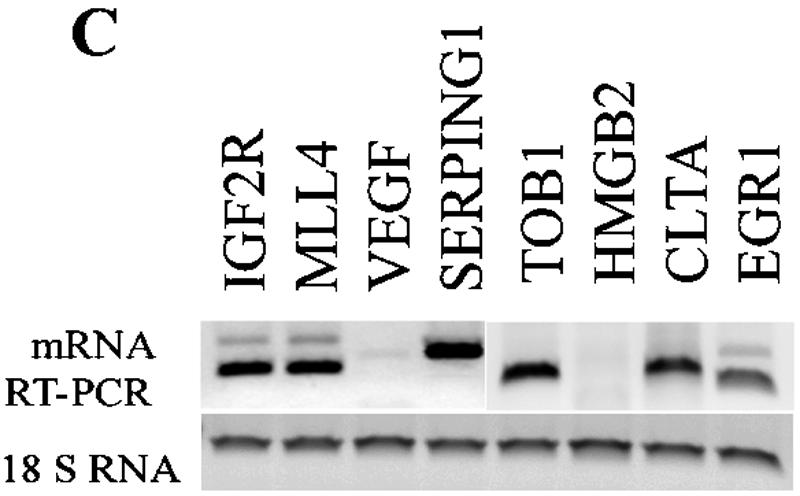
Genome-wide location analysis of histone H3-K27, H4-K20 dimethylation, and H3-K9 trimethylation in human gene coding regions. (A) Venn diagram comparing candidate genes from H3-K9Me3, H3-K27Me2, and H4-K20Me2 groups. The data from three experiments were averaged, and the genes were identified as methylated candidates were included as targets. Venn diagrams were constructed by using GeneSpring. Details of all of the methylated candidates in each group are available in Table S4 in the supplemental material. (B) Conventional ChIP assays were carried out on selected methylated genes shared among H3-K27Me2, H4-K20Me2, and H3-K9Me3 candidates to confirm ChIP-array. ChIP DNA used as templates were obtained with antibodies to histones methylated at various lysines asindicated. (C) RT-PCR analysis on total RNA from THP-1 cells to examine RNA expression with 18S RNA as internal control.
We then performed follow-up conventional ChIP assays with selected shared candidates having H3-K9Me3, H3-K27Me2, and H4-K20Me2 marks. Our results (Fig. 3B) clearly show that these candidates are almost exclusively present in H3-K9Me3, H3-K27Me2, and H4-K20Me2 ChIP DNA but not in other ChIP DNA. Interestingly, these genes did not show any H3-K9Me2 and, as seen later in Table 1, the correlation was low. Surprisingly, the mRNA expression data (by RT-PCR) in Fig. 3C demonstrate that genes with H3-K9Me3, H3-K27Me2, and H4-K20Me2 marks are not necessarily always silenced. Among the eight candidate genes we chose to test for mRNA expression, two were not expressed, whereas the other six were expressed. Thus, the consequences of H3-K9Me3, H3-K27Me2, and H4-K20Me2 appear to be different from H3-K9Me2, which is an established marker of silenced or repressed genes. We speculate that the discrepancy between the silencing function of H3-K9Me3, H3-K27Me2, and H4-K20Me2 and the RT-PCR results could be due to the heterozygosity of methylation. Certain monoallelic expressed genes possibly have H3-K9Me3, H3-K27Me2, and H4-K20Me2 only on one copy, and that copy of gene is indeed repressed/silenced, but the other copy of the gene could be active since it is not methylated at these sites. This heterozygosity may be one of the reasons for the positive gene expression of some genes that had H3-K9Me3, H3-K27Me2, and H4-K20Me2.
Correlation between histone H3 acetylation and methylations.
Histone acetylation has been genetically and biochemically linked to transcriptional activation (19, 60). Thus, it is conceivable that correlations between histone acetylation and methylation at specific lysines could reflect the potential transcriptional activity status of the methylated histone. In order to further investigate this association, we performed ChIP-cDNA arrays with an antibody to H3-K9/K14acetyl (H3-K9/14Ac) since these two sites are typical marks of histone acetylation and gene activation. We compared H3-K9/K14Ac ChIP array data sets with various histone methylation ChIP-cDNA array data sets, and these findings are summarized in Fig. 4A. It is apparent that histone H3-K4Me2, H3-K4Me3, H3-K36Me2, and H3-K79Me2 methylations closely correlate with H3-K9/14 acetylation (129/223, 100/174, 54/134, and 95/179, respectively). This is consistent with many published reports that methylation at these sites is associated with active transcription. On the other hand, those with H3-K9Me2, H3-K9Me3, H3-K27Me2, and H4-K20Me2 have poor correlation with histone H3 lysine acetylation (30/213, 13/93, 9/88, and 16/138), thus confirming their association with gene silencing. Our composite date in Fig. 4A correlates these associations in a global fashion.
FIG. 4.


Correlation between histone H3-K9/K14 acetylation and histone methylation at various lysines. (A) Venn diagram compares the extents of association between histone H3-K9/K14 acetylation candidates and H3-K4Me2, H3-K4Me3, H3-K36Me2, H3-K79Me2, H3-K9Me2, H3-K9Me3, H3-K27Me2, and H4-K20Me2. Candidate genes are defined by the criteria described for microarray data collection and statistical analyses in Materials and Methods. Venn diagram analyses were performed by using GeneSpring. Details of all of the methylated candidates in each group are available in Table S4 in the supplemental material. (B) Conventional ChIP assays on selected methylated genes from the H3-K9/14Ac, H3-K4Me2, H3-K36Me2, H3-K79Me2, and H3-K9Me2 candidates list (upper panel). The histone methylation status of each gene obtained from ChIP-array experiments is presented in the lower panel.
We then further clarified the microarray data by testing various histone methylation candidate genes shown in Fig. 1C, 2B, and 3B by conventional ChIP assays. As shown in Fig. 4B, the majority of acetylation candidates identified by the microarray (indicated below the PCR bands) are present in the H3-K9/K14Ac ChIP DNA. The corresponding methylation status of the specific genes identified from the microarray screens is also indicated below.
Table 1 summarizes the results from the present study. It reveals the correlative relationships between histone methylations and acetylation at various lysines. Apart from using SAM software and Venn diagrams to identify methylated candidates (a list of all methylated and acetylated candidate genes in each group is available in Table S4 in the supplemental material), we also calculated the Pearson correlation coefficients (r) for all pairs of histone methylations and acetylation. The resultant calculated coefficient numbers are shown in parentheses adjacent to the corresponding candidate numbers in Table 1. It is evident that the correlation coefficients (r) are consistent with the Venn diagram results. The extensive conventional ChIPs support the existence of the full spectrum of proposed correlations (Fig. 1C, 2B, 3B, and 4B). Overall, the results shown in Table 1 allow us to conclude the following regarding histone methylation patterns in the coding regions of human genes. First, high degrees of positive correlations are noted between most of the active histone marks. Notably, histone H3-K79Me2 is closely associated with H3-K4Me2 and H3-K36Me2, suggesting that H3-K4Me2/K79Me2 and H3-K36Me2/K79Me2 pairs tend to be present together. H3-K36Me2 and H3K4Me2 seem to occur together with lesser frequency. Second, there are high degrees of positive correlations between silenced histone marks such as H3-K9Me3, H3-K27Me2, and H4-K20Me2, suggesting that these three tend to occur together. Third, a poor correlation is noted for euchromatin marks (H3-K9/K14Ac, H3-K4Me2, H3-K36Me2, and H3-K79Me2) versus the heterochromatin marks (H3-K9Me2, H3-K9Me3, H3-K27Me2, and H4-K20Me2). Fourth, it is interesting that H3-K9Me2 neither associated with active (H3-K4Me2, H3-K4Me3, H3-K36Me2, and H3-K79Me2) nor with repressed histone methylation marks (H3-K9Me3, H3-K27Me2, and H4-K20Me2). Last, but not least, histone H3-K4Me2, H3-K4Me3, H3-K36Me2, and H3-K79Me2 are associated with hyperacetylation and active genes, whereas H3-K9Me2, H3-K9Me3, H3-K27Me2, and H4-K20Me2 are associated with hypoacetylation. Previous studies have shown some of these correlations and a few of them also at a genome-wide level. However, most of these data are either from yeast or Drosophila. Our results provide a more complete picture of the correlations between histone methylation and histone acetylation for the first time in the coding regions of human genes.
DISCUSSION
Based on the use of cDNA microarrays in CGH analysis (37) and the principle of GWLA (40), we have established for the first time a ChIP-cDNA array procedure to map histone methylation globally in the coding regions of human genes and have demonstrated that it is a powerful tool for mapping histone modifications and their patterns of occurrence. Although our results are generated from a 1.7K human cDNA array, it is likely that they are applicable to all human gene coding regions. In fact we have obtained similar data by mapping histone H3-K4Me2 and H3-K9Me2 with other DNA arrays such as human 19K-cDNA array and a CpG array (Universal Health Network [Canada]), as well as a human promoter array (Aviva, San Diego, CA) (F. Miao and R. Natarajan, unpublished data). Thus, similar to our data in the present study with the 1.7K cDNA array, ca. 90% spots in the promoter array displaying H3-K4Me2 were not present in the H3-K9Me2 group and vice versa, and only a fraction of the genes (ca. 10%) had both H3-K4Me2 and H3-K9Me2 marks even in the noncoding regions of the human genes. These data indicate that at least part of the conclusions from the present study, if not all, can be applied to CpG islands and promoter regions.
The results of the present study have provided several key conclusions (summarized in Results and in Table 1). We uncovered several key histone lysine methylation patterns and the relative associations between them and also noted novel new patterns in the coding regions of human genes. However, it also should be emphasized that our data only reflect the histone methylation of ca. 1,700 human genes with partial cDNA sequences. In order to obtain a more complete picture of histone modifications at the level of the whole genome, high-density genome tiling arrays would be very useful.
Histone H3-K4, H3-K36, and H3-K79 methylation, and H3-KMe patterns in euchromatin.
The “histone code” hypothesis suggests that distinct combinations of histone modifications participate in the formation of different chromatin domains (15, 50). Increasing evidence suggests that transcriptionally active euchromatin can be methylated at H3-K4, H3-K36, and H3-K79, whereas heterochromatin regions are marked by H3-K9, H3-K27, and H4-K20 methylation (49). In addition, several specific histone methylation patterns have been found in heterochromatin (34, 36, 45, 48). In the present study, we showed that in the coding regions of human genes, methylation at H3-K4, H3-K36, and H3-K79 but not at H3-K9, H3-K27, and H4-K20 correlates with histone acetylation. Our results not only reinforce this concept on a genome-wide scale but also provide details of distribution of these methylations within 1,718 human genes. Our novel data also demonstrate that dual histone methylation patterns such as H3-K4/K79Me2 and H3-36/K79Me2 mark the active coding regions in humans.
Dual histone methylation patterns such as H3-K4/K79 have been reported in Drosophila (46). Similar to the H3-K9/H4-K20 methylation index model proposed recently (45), we speculate that H3-K79 methylation might index active chromatin domains by association with H3-K4 or H3-K36 methylation. This is further supported by the following studies done in Saccharomyces cerevisiae.
Several lines of evidence indicate that key biochemical processes of transcriptional elongation mediated by RNA polymerase II are associated with the methylation of H3-K4, H3-K36, and H3-K79 through at least two mediator complexes: PAF and COMPASS (11, 13). Set2 was shown to copurify with RNA polymeraseII. Set2 can interact with many proteins, including five subunits (Leo1, Ctr9, Rtf1, Ccd73, and Paf1) of the PAF complex, and the elongation factors Soh1 and Chd1 (18). The methylation of H3-K79 by Dot1p also requires the PAF complex. Set2 and Dot1p can interact with Rtf1 and Paf1 genetically. Moreover, both H3-K36 and H3-K79 methylations are regulated by the PAF complex (17, 18). Furthermore, histone H3-K4 and H3-K79, but not H3-K36, methylation in yeast require the ubiquitination of lysine 123 of histone H2B in a process involving the ubiquitin-conjugating enzyme, Rad6 (9, 51). Together, these data showing biochemical and genetic connections between H3-K36 and H3-K79 provide strong evidence in support of our results that histone H3-K36 and H3-K79 methylations are closely related and associated with active gene transcription.
Although currently there is no biochemical evidence supporting an interaction of Dot1 and RNA polymerase II via the PAF complex, the striking similarities between the regulation of Dot1-mediated H3-K79 methylation and COMPASS mediated H3-K4 methylation suggests a similar mechanism for Dot1 recruitment to chromatin. The association between histone H3-K4 and H3-K79 methylation suggests that there could be an interaction between Dot1 and protein(s) in COMPASS or that this interaction could be mediated through the PAF complex. Since H3-K79Me is also associated with H3-K36Me, it is also possible that there is an interaction between Dot1 and NSD1 or that this interaction is mediated through the PAF complex.
The biological functions of histone methylations in the coding regions of genes still remain largely unknown despite recent studies in this area. It has been proposed that methylation of histone H3-K79 and H3-K4 marks active chromatin and limits silencing to discrete domains by preventing the promiscuous binding of Sir proteins known to maintain an epigenetic silenced state and heterochromatin formation in yeast (57, 58). Other studies reveal that methylation of histone H3-K79 is required for recruiting Sir protein (11, 13) and that histone H3-K79Me is also regulated during the cell cycle (10). However, questions such as what determines active coding regions to be regulated by H3-K4 or K36 methylations, why are they marked by specific dual methylation patterns, and what are the biological functions of various methylations in the coding regions remain unanswered.
Histone H3-K9, H3-K27, and H4-K20 methylation and gene silencing.
Methylation of histone H3 at K9 and K27 and of histone H4 at K20 exist only in higher eukaryotes but not in yeast (49). Unlike methylation of histone at H3-K4, H3-K36, and H3-K79, there is no evidence that RNA polymerase II is involved in histone H3-K9, H3-K27, and H4-K20 methylations. Several reports indicate that certain HMTs, including those acting at H3-K9, H3-K27, and H4-K20 can repress gene expression through creating a docking site for a repressor protein that recruits a core repressor complex. Histone H3-K9Me has been studied extensively. The present model of establishing and maintaining histone H3-K9Me involves the following multiple steps: (i) deacetylation of H3-K9 by specific histone deacetylases, (ii) methylation of H3-K9 by a HMT such as G9a or Suv39H1, (iii) recognition of methylated H3-K9 by the HP1 protein, and (iv) propagation of methylation through HP1-mediated recruitment of HMTs (49). However, the mechanisms involved in histone H3-K27 and H4-K20 methylation are not yet clear, although it has been suggested that H3-K27Me mechanism could be similar to H3-K9Me (49).
We have shown here that coding regions with histone H3-K9Me2, H3-K9Me3, H3-K27Me2, and H4-K20Me2 are hypoacetylated genome-wide (Fig. 4), suggesting that HDACs and related protein complexes are involved in the establishment and maintenance of methylation at these sites. This is consistent with the accepted notion that histone H3-K9, H3-K27, and H4-K20 methylation, as well as histone deacetylases, are all related to gene silencing (61). A number of studies showed that euchromatic H3-K9 dimethylation regulated by G9a is essential for early embryogenesis and is involved in the transcriptional repression of developmental genes (52). G9a is a major force in euchromatin silencing (41). Our results have uncovered a substantial number of human genes that are repressed by H3-K9Me2. This further supports the idea that H3-K9Me2 plays a major role in histone methylation-mediated transcriptional repression of genes.
Histone H3-K9 and H3-K27 methylation are involved in Hox gene silencing, X inactivation, germ line development, stem cell pluripotency, and cancer metastasis. The silencing mechanisms involved are different but all involve the EED-EZH2 complex (6), thereby suggesting that EZH2-mediated histone H3-K27 methylation plays a key role in the gene silencing. In the present study, we noted that H3-K9Me3 and H3-K27Me2 are closely associated with H4-K20Me2 in human coding regions. Furthermore, our results demonstrate that six of eight tested candidate genes with H3-K9Me3, H3-K27Me2, and H4-K20Me2 marks in the coding regions were expressed and that is not consistent with the silencing role of H3-K9, H3-K27, and H4-K20 methylation. Particularly, H3-K9Me3 is a clear silencing mark that should lead to chromatin condensation and inhibition of gene expression. It is therefore intriguing that in our study many candidate genes with these putative silencing marks were still expressed. We speculate that discrepancy could be due to heterozygosity methylation as discussed in Results. This heterozygosity may cause certain genes that appear as candidates for H3-K9Me3, H3-K27Me2, and H4-K20Me2 to also be positive for gene expression. Based on the H3-K9Me3, H3-K27Me2, and H4-K20Me2 patterns, we speculate that these candidates are regulated by the PcG/TrxG complex (6, 8, 16, 20, 29, 39, 48). This is supported by evidence that H3-K9Me3 and H3-K27Me2 are linked to PcG controlled silencing (6, 8, 39), although we are aware that other methylations, such as H3-K27Me3, are involved. We also found two H3-K9Me3 candidate genes (see Table S4 in the supplemental material), namely, Trip-Br2 and CNTFR, which are reported to be target genes of the PcG component SUZ12 (16). Since PcG complex and TrxG complexes can compete with each other at the same target genes to determine whether a gene is silenced or expressed, the final outcome will depend on the relative concentration of PcG and TrxG complexes, methylation patterns of target genes and other parameters. If the competition between PcG and TrxG reaches a balance, one copy of target gene occupied by PcG complex may maintain the histone H3-K9Me3, H3-K27Me2, and H4-K20Me2 pattern and thus lead to transcriptional silencing of this locus. The other copy of the target gene that is occupied by TrxG can still have active transcription. The following scenario is also quite possible: H3-K9Me3 and H3-K27Me2 are marks of the silenced locus, whereas H4-K20Me2 may be a mark of active gene locus since ASH1, a component of TrxG, can methylate H4-K20 and H3-K4 (2). In our study, we noted a slight overlap between H3-K4Me2 and H4-K20Me2 (Table 1). However, in this scenario, H4-K20Me2 would be an active mark. The allele-specific gene expression model has also been associated with the epigenetic phenomena of X-chromosome inactivation and genomic imprinting. By considering a participation by PcG/TrxG, we feel that the allele-specific gene expression model can explain our observations.
Interestingly, the dual methylation patterns H3-K9Me2/H3-K27Me2, H3-K9Me2/H4-K20Me2, and H3-K9Me2/H3-K9Me3 were absent in human coding regions. The results shown in Table 1 reveal that H3-K9Me2 and the H3-K9Me3/H3-K27Me2/H4-K20Me2 seem to segregate in terms of their distribution, suggesting that they may be regulated by two different repression pathways mediated separately by G9a and PcG/TrxG proteins.
In the present study we were able to detect all types of histone lysine methylations within human coding regions, but not all combinations of these marks were closely associated. This indicates that histone methylation does not distribute randomly and that specific and novel multiple histone methylation patterns, as observed by us, may have important biological significance. Heterochromatin and euchromatin have been known for a long time, but a flurry of recent findings have altered our vision of chromatin and its role in the regulation of cellular functions (59). Histone modifications are integral parts of the genetic information and elucidating the biological and functional relevance of these modifications is imperative to our understanding of the status and functions of chromatin. There is still a lot to be learned about the histone code that could be characterized by a single histone modification (marker) or by multiple histone modifications (pattern) (3). We provide here novel data suggesting that chromatin regions can be classified based on their specific histone modification patterns that define not only heterochromatin and euchromatin regions but also whether genes with specific histone methylation patterns are expressed, repressed, silenced, etc. Decoding histone methylation patterns will help us evaluate epigenetic changes to complement and extend the genetic information gained from the human genome sequence. Genome-wide mapping of histone modifications in human genes, such as that performed in the present study, offers us a systematic and accurate way to acquire these information. This could also serve as a powerful tool in basic biological studies, as well as clinical research. We expect that, with improved ChIP-array technologies (5), it is possible to develop “biological histone modification maps” of the human genome for various cell types.
Supplementary Material
Acknowledgments
These studies were supported by grants from the National Institutes of Health (RO1 DK065073) and the Juvenile Diabetes Foundation International, and in part by a General Clinical Research Center grant from the NCRR (MO1RR00043 awarded to City of Hope).
We are grateful to Jane Phan and Steve Flanagan of the City of Hope Microarray facility for help and to Arthur Riggs (Beckman Research Institute) for helpful discussions. We thank Bin Ren (UCSD) for advice in the microarray data analyses. We thank Kim Carlsberg, Yate-Chin Yuan, and David Smith for help with the GeneSpring software and microarray data analyses, Qiangjun Cai for help with cell culture, and Anand Iyer (UCLA) for the Pearson r value calculations.
Footnotes
Supplemental material for this article may be found at http://mcb.asm.org/.
REFERENCES
- 1.Bannister, A. J., R. Schneider, and T. Kouzarides. 2002. Histone methylation: dynamic or static? Cell 109:801-806. [DOI] [PubMed] [Google Scholar]
- 2.Beisel, C., A. Imhof, J. Greene, E. Kremmer, and F. Sauer. 2002. Histone methylation by the Drosophila epigenetic transcriptional regulator Ash1. Nature 419:857-862. [DOI] [PubMed] [Google Scholar]
- 3.Berger, S, L. 2002. Histone modifications in transcriptional regulation. Curr. Opin. Genet. Dev. 12:142-148. [DOI] [PubMed] [Google Scholar]
- 4.Bernstein, B. E., E. L. Humphrey, R. L. Erlich, R. Schneider, P. Bouman, J. S. Liu, T. Kouzarides, and S. L. Schreiber. 2002. Methylation of histone H3 Lys 4 in coding regions of active genes. Proc. Natl. Acad. Sci. USA 99:8695-8700. [DOI] [PMC free article] [PubMed] [Google Scholar]
- 5.Bernstein, B. E., M. Kamal, K. Lindblad-Toh, S. Bekiranov, D. K. Bailey, D. J. Huebert, S. McMahon, E. K. Karlsson, E. J. Kulbokas III, T. R. Gingeras, S. L. Schreiber, and E. S. Lander. 2005. Genomic maps and comparative analysis of histone modifications in human and mouse. Cell 120:169-181. [DOI] [PubMed] [Google Scholar]
- 6.Cao, R., L. Wang, H. Wang, L. Xia, H. Erdjument-Bromage, P. Tempst, R. S. Jones, and Y. Zhang. 2002. Role of histone H3 lysine 27 methylation in Polycomb-group silencing. Science 298:1039-1043. [DOI] [PubMed] [Google Scholar]
- 7.Colantuoni, C., G. Henry, S. Zeger, and J. Pevsner. 2002. SNOMAD (Standardization and NOrmalization of MicroArray Data): web-accessible gene expression data analysis. Bioinformatics 18:1540-1541. [DOI] [PubMed] [Google Scholar]
- 8.Czermin, B., R. Melfi, D. McCabe, V. Seitz, A. Imhof, and V. Pirrotta. 2002. Drosophila enhancer of Zeste/ESC complexes have a E2Fhistone H3 methyltransferase activity that marks chromosomal Poly-comb sites. Cell 111:185-196. [DOI] [PubMed] [Google Scholar]
- 9.Dover, J., J. Schneider, M. A. Tawiah-Boateng, A. Wood, K. Dean, M. Johnston, and A. Shilatifard. 2002. Methylation of histone H3 by COMPASS requires ubiquitination of histone H2B by Rad6. J. Biol. Chem. 277:28368-28371. [DOI] [PubMed] [Google Scholar]
- 10.Feng, Q., H. Wang, H. H. Ng, H. Erdjument-Bromage, P. Tempst, K. Struhl, and Y. Zhang. 2002. Methylation of H3-lysine 79 is mediated by a new family of HMTases without a SET domain. Curr. Biol. 12:1052-1058. [DOI] [PubMed] [Google Scholar]
- 11.Gerber, M., and A. Shilatifard. 2003. Transcriptional elongation by RNA polymerase II and histone methylation. J. Biol. Chem. 278:26303-26306. [DOI] [PubMed] [Google Scholar]
- 12.Goo, Y. H., Y. C. Sohn, D. H. Kim, S. W. Kim, M. J. Kang, D. J. Jung, E. Kwak, N. A. Barlev, S. L. Berger, V. T. Chow, R. G. Roeder, D. O. Azorsa, P. S. Meltzer, P. G. Suh, E. J. Song, K. J. Lee, Y. C. Lee, and J. W. Lee. 2003. Activating signal cointegrator 2 belongs to a novel steady-state complex that contains a subset of trithorax group proteins. Mol. Cell. Biol. 23:140-149. [DOI] [PMC free article] [PubMed] [Google Scholar]
- 13.Hampsey, M., and D. Reinberg. 2003. Tails of intrigue: phosphorylation of RNA polymerase II mediates histone methylation. Cell 113:429-432. [DOI] [PubMed] [Google Scholar]
- 14.Henry, K. W., A. Wyce, W. S. Lo, L. J. Duggan, N. C. Emre, C. F. Kao, L. Pillus, A. Shilatifard, M. A. Osley, and S. L. Berger. 2003. Transcriptional activation via sequential histone H2B ubiquitylation and deubiquitylation, mediated by SAGA-associated Ubp8. Mol. Cell. Biol. 12:4207-4218. [DOI] [PMC free article] [PubMed] [Google Scholar]
- 15.Jenuwein, T., and C. D. Allis. 2001. Translating the histone code. Science 293:1074-1080. [DOI] [PubMed] [Google Scholar]
- 16.Kirmizis, A., S. M. Bartley, A. Kuzmichev, R. Margueron, D. Reinberg, R. Green, and P. J. Farnham. 2004. Silencing of human polycomb target genes is associated with methylation of histone H3 Lys 27. Genes Dev. 18:1592-1605. [DOI] [PMC free article] [PubMed] [Google Scholar]
- 17.Krogan, N. J., M. Kim, A. Tong, A. Golshani, G. Cagney, V. Canadien, D. Richards, B. Beattie, A. Emili, et al. 2003. Methylation of histone H3 by Set2 in Saccharomyces cerevisiae is linked to transcriptional elongation by RNA polymerase II. Mol. Cell. Biol. 23:4207-4218. [DOI] [PMC free article] [PubMed] [Google Scholar]
- 18.Krogan, N. J., J. Dover, A. Wood, J. Schneider, J. Heidt, M.-A. Boateng, K. Dean, O. W. Ryan, A. Golshani, M. Johnston, J. Greenblatt, and A. Shilatifard. 2003. The Paf1 complex is required for histone H3 methylation by COMPASS and Dot1p: linking transcriptional elongation to histone methylation. Mol. Cell 11:721-729. [DOI] [PubMed] [Google Scholar]
- 19.Kuo, M. H., J. Zhou, P. Jambeck, M. E. Churchill, and C. D. Allis. 1998. Histone acetyltransferase activity of yeast Gcn5p is required for the activation of target genes in vivo. Genes Dev. 12:627-639. [DOI] [PMC free article] [PubMed] [Google Scholar]
- 20.Kuzmichev, A., K. Nishioka, H. Erdjument-Bromage, P. Tempst, and D. Reinberg. 2002. Histone methyltransferase activity associated with a human multiprotein complex containing the Enhancer of Zeste protein. Genes Dev. 16:2893-2905. [DOI] [PMC free article] [PubMed] [Google Scholar]
- 21.Lachner, M., D. O'Carroll, S. Rea, K. Mechtler, and T. Jenuwein. 2001. Methylation of histone H3 lysine 9 creates a binding site for HP1 proteins. Nature 410:116-120. [DOI] [PubMed] [Google Scholar]
- 22.Lachner, M., and T. Jenuwein. 2002. The many faces of histone lysine methylation. Curr. Opin. Cell Biol. 14:286-298. [DOI] [PubMed] [Google Scholar]
- 23.Lachner, M., R. J. O'Sullivan, and T. Jenuwein. 2003. An epigenetic road map for histone lysine methylation. J. Cell Sci. 116:2117-2124. [DOI] [PubMed] [Google Scholar]
- 24.Li, Z., S. Van Calcar, C. Qu, W. K. Cavenee, M. Q. Zhang, and B. Ren. 2003. A global transcriptional regulatory role for c-Myc in Burkitt's lymphoma cells. Proc. Natl. Acad. Sci. USA 14:8164-8169. [DOI] [PMC free article] [PubMed] [Google Scholar]
- 25.Litt, M. D., M. Simpson, M. Gaszner, C. D. Allis, and G. Felsenfeld. 2001. Correlation between histone lysine methylation and developmental changes at the chicken beta-globin locus. Science 293:2453-2455. [DOI] [PubMed] [Google Scholar]
- 26.Luger, K., A. W. Mader, R. K. Richmond, D. F. Sargent, and T. J. Richmond. 1997. Crystal structure of the nucleosome core particle at 2.8 Å resolution. Nature 389:251-260. [DOI] [PubMed] [Google Scholar]
- 27.Martone, R., G. Euskirchen, P. Bertone, S. Hartman, T. E. Royce, N. M. Luscombe, J. L. Rinn, F. K. Nelson, P. Miller, M. Gerstein, S. Weissman, and M. Snyder. 2003. Distribution of NF-κB-binding sites across human chromosome 22. Proc. Natl. Acad. Sci. USA 100:12247-12252. [DOI] [PMC free article] [PubMed] [Google Scholar]
- 28.Miao, F., I. G. Gonzalo, L. Lanting, and R. Natarajan. 2004. In vivo chromatin remodeling events leading to inflammatory gene transcription under diabetic conditions. J. Biol. Chem. 279:18091-18097. [DOI] [PubMed] [Google Scholar]
- 29.Muller, J., C. M. Hart, N. J. Francis, M. L. Vargas, A. Sengupta, B. Wild, E. L. Miller, M. B. O'Connor, R. E. Kingston, and J. A. Simon. 2002. Histone methyltransferase activity of a Drosophila Polycomb group repressor complex. Cell 111:197-208. [DOI] [PubMed] [Google Scholar]
- 30.Ng, H. H., F. Robert, R. A. Young, and K. Struhl. 2003. Targeted recruitment of Set1 histone methylase by elongating Pol II provides a localized mark and memory of recent transcriptional activity. Mol. Cell 11:709-719. [DOI] [PubMed] [Google Scholar]
- 31.Nishioka, K., J. C. Rice, K. Sarma, H. Erdjument-Bromage, J. Werner, Y. Wang, S. Chuikov, P. Valenzuela, P. Tempst, R. Steward, J. T. Lis, C. D. Allis, and D. Reinberg. 2002. PR-Set7 is a nucleosome-specific methyltransferase that modifies lysine 20 of histoneH4 and is associated with silent chromatin. Mol. Cell 9:1201-1213. [DOI] [PubMed] [Google Scholar]
- 32.Noma, K., C. D. Allis, and S. I. Grewal. 2001. Transitions in distinct histone H3 methylation patterns at the heterochromatin domain boundaries. Science 293:1150-1155. [DOI] [PubMed] [Google Scholar]
- 33.Odom, D. T., N. Zizlsperger, D. B. Gordon, G. W. Bell, N. J. Rinaldi, H. L. Murray, T. L. Volkert, et al. 2004. Control of pancreas and liver gene expression by HNF transcription factors. Science 303:1378-1381. [DOI] [PMC free article] [PubMed] [Google Scholar]
- 34.Okamoto, I., A. P., Otte, C. D. Allis, D. Reinberg, and E. Heard. 2004. Epigenetic dynamics of imprinted X inactivation during early mouse development. Science 303:644-649. [DOI] [PubMed] [Google Scholar]
- 35.Orlando, V. 2003. Polycomb, epigenomes, and control of cell identity. Cell 112:599-606. [DOI] [PubMed] [Google Scholar]
- 36.Plath, K., J. Fang, S. K. Mlynarczyk-Evans, R. Cao, K. A. Worringer, H. Wang, C. C. de la Cruz, A. P. Otte, B. Panning, and Y. Zhang. 2003. Role of histone H3 lysine 27 methylation in X inactivation. Science 300:131-135. [DOI] [PubMed] [Google Scholar]
- 37.Pollack, J. R., C. M. Perou, A. A. Alizadeh, M. B. Eisen, A. Pergamenschikov, C. F. Williams, S. S. Jeffrey, et al., 1999. Genome-wide analysis of DNA copy-number changes using cDNA microarrays. Nat. Genet. 23:41-46. [DOI] [PubMed] [Google Scholar]
- 38.Rayasam, G. V., O. Wendling, P. O. Angrand, M. Mark, K. Niederreither, L. Song, T., Lerouge, G. L., Hager, P. Chambon, and R. Losson. 2003. NSD1 is essential for early postimplantation development and has a catalytically active SET domain. EMBO J. 22:3153-3163. [DOI] [PMC free article] [PubMed] [Google Scholar]
- 39.Rea, S., F. Eisenhaber, D. O'Carroll, B. D. Strahl, Z. W. Sun, M. Schmid, S. Opravil, K. Mechtler, C. P. Ponting, C. D. Allis, and T. Jenuwein. 2000. Regulation of chromatin structure by site-specific histone H3 methyltransferases. Nature 406:593-599. [DOI] [PubMed] [Google Scholar]
- 40.Ren, B., F. Robert, J. J. Wyrick, O. Aparicio, E. G., Jennings, I. Simon, J. Zeitlinger, J. Schreiber, N. Hannett, E. Kanin, T. L. Volkert, C. J. Wilson, S. P. Bell, and R. A. Young. 2000. Genome-wide location and function of DNA-binding proteins. Science 290:2306-2309. [DOI] [PubMed] [Google Scholar]
- 41.Rice, J. C., S. D. Briggs, B. Ueberheide, C. M. Barber, J. Shabanowitz, D. F. Hunt, Y. Shinkai, and C. D. Allis. 2003. Histone methyltransferases direct different degrees of methylation to define distinct chromatin domains. Mol. Cell 12:1591-1598. [DOI] [PubMed] [Google Scholar]
- 42.Robyr, D., Y. Suka, I. Xenarios, S. K. Kurdistani, A. Wang, N., Suka, and M. Grunstein. 2002. Microarray deacetylation maps determine genome-wide functions for yeast histone deacetylases. Cell 109:437-446. [DOI] [PubMed] [Google Scholar]
- 43.Saccani, S., and G. Natoli. 2002. Dynamic changes in histone H3 Lys 9 methylation occurring at tightly regulated inducible inflammatory genes. Genes Dev. 16:2219-2224. [DOI] [PMC free article] [PubMed] [Google Scholar]
- 44.Santos-Rosa, H., R. Schneider, A. J. Bannister, J. Sherriff, B. E. Bernstein, N. C. Emre, S. L. Schreiber, J. Mellor, and T. Kouzarides. 2002. Active genes are tri-methylated at K4 of histone H3. Nature 419:407-411. [DOI] [PubMed] [Google Scholar]
- 45.Schotta, G., M. Lachner, K. Sarma, A. Ebert, R. Sengupta, G. Reuter, D. Reinberg, and T. Jenuwein. 2004. A silencing pathway to induce H3-K9 and H4-K20 trimethylation at constitutive heterochromatin. Genes Dev. 18:1251-1262. [DOI] [PMC free article] [PubMed] [Google Scholar]
- 46.Schubeler, D., D. M. MacAlpine, D. Scalzo, C. Wirbelauer, C. Kooperberg, F. van Leeuwen, D. E. Gottschling, L. P. O'Neill, B. M. Turner, J. Delrow, and M. S. P. Bell. 2004. The histone modification pattern of active genes revealed through genome-wide chromatin analysis of a higher eukaryote. Genes Dev. 18:1263-1271. [DOI] [PMC free article] [PubMed] [Google Scholar]
- 47.Shilatifard, A. 2004. Transcriptional elongation control by RNA polymerase II: a new frontier. Biochim. Biophys. Acta 1677:79-86. [DOI] [PubMed] [Google Scholar]
- 48.Silva, J., W. Mak, I. Zvetkova, R. Appanah, T. B. Nesterova, Z. Webster, A. H. Peters, T. Jenuwein, A. P. Otte, and N. Brockdorff. 2003. Establishment of histone H3 methylation on the inactive X chromosome requires transient recruitment of Eed-Enx1 polycomb group complexes. Dev. Cell 4:481-495. [DOI] [PubMed] [Google Scholar]
- 49.Sims, R. J., III, K. Nishioka, and D. Reinberg. 2003. Histone lysine methylation: a signature for chromatin function. Trends Genet. 11:629-639. [DOI] [PubMed] [Google Scholar]
- 50.Strahl, B. D., and C. D. Allis. 2000. The language of covalent histone modifications. Nature 403:41-45. [DOI] [PubMed] [Google Scholar]
- 51.Sun, Z. W., and C. D. Allis. 2002. Ubiquitination of histone H2B regulates H3 methylation and gene silencing in yeast. Nature 418:104-108. [DOI] [PubMed] [Google Scholar]
- 52.Tachibana, M., K. Sugimoto, M. Nozaki, J. Ueda, T. Ohta, M. Ohki, M. Fukuda, N. Takeda, H. Niida, H. Kato, and Y. Shinkai. 2002. G9a histone methyltransferase plays a dominant role in euchromatic histone H3 lysine 9 methylation and is essential for early embryogenesis. Genes Dev. 16:1779-1791. [DOI] [PMC free article] [PubMed] [Google Scholar]
- 53.Tamaru, H., X. Zhang, D. McMillen, P. B. Singh, J. Nakayama, S. I. Grewal, C. D. Allis, X. Cheng, and E. U. Selker. 2003. Trimethylated lysine 9 of histone H3 is a mark for DNA methylation in Neurospora crassa. Nat. Genet. 34:75-79. [DOI] [PubMed] [Google Scholar]
- 54.Turner, B. M. 2000. Histone acetylation and an epigenetic code. Bioessays 22:836-845. [DOI] [PubMed] [Google Scholar]
- 55.Turner, B. M. 2002. Cellular memory and the histone code. Cell 111:285-291. [DOI] [PubMed] [Google Scholar]
- 56.Tusher, V. G., R. Tibshirani, and G. Chu. 2001. Significance analysis of microarrays applied to the ionizing radiation response. Proc. Natl. Acad. Sci. USA 98:5116-5121. [DOI] [PMC free article] [PubMed] [Google Scholar]
- 57.van Leeuwen, F., and D. E. Gottschling. 2002. Genome-wide histone modifications: gaining specificity by preventing promiscuity. Curr. Opin. Cell Biol. 14:756-762. [DOI] [PubMed] [Google Scholar]
- 58.van Leeuwen, F., P. R., Gafken, and D. E. Gottschling. 2002. Dot1p modulates silencing in yeast by methylation of the nucleosome core. Cell 109:745-756. [DOI] [PubMed] [Google Scholar]
- 59.Wang, H., R. Cao, L. Xia, H. Erdjument-Bromage, C. Borchers, P. Tempst, and Y. Zhang. 2001. Purification and functional characterization of a histone H3-lysine 4-specific methyltransferase. Mol. Cell 8:1207-1217. [DOI] [PubMed] [Google Scholar]
- 60.Wu, J., and M. Grunstein. 2000. 25 years after the nucleosome model: chromatin modifications. Trends Biochem. Sci. 25:619-623. [DOI] [PubMed] [Google Scholar]
- 61.Zhang, Y., and D. Reinberg. 2001. Transcription regulation by histone methylation: interplay between different covalent modifications of the core histone tails. Genes Dev. 15:2343-2360. [DOI] [PubMed] [Google Scholar]
Associated Data
This section collects any data citations, data availability statements, or supplementary materials included in this article.