

Abstract
Background and Aims: The purpose of this meta-analysis was to investigate the effect of vitamin D supplementation on hemoglobin A1C (HbA1C), fasting blood sugar (FBS), low-density lipoprotein (LDL), high-density lipoprotein (HDL), systolic blood pressure (SBP), and the total vitamin D level in patients with Type 2 diabetes (T2DM).
Methods: A systematic search was conducted in databases such as PubMed (Medline), Scopus, Embase, Web of Science, Cochrane Library, and ClinicalTrials.gov using relevant keywords from January 1990 to January 2024. After screening and extracting data, a qualitative evaluation of articles was performed using the Cochrane risk-of-bias tool for randomized trials (RoB 2).
Results: The findings revealed that vitamin D supplementation significantly decreased the mean HbA1C (SMD: −0.15; 95% CI: −0.29, −0.20; Isquare: 79.76%; p value < 0.001) and mean FBS (SMD: −0.28; 95% CI: −0.40, −0.15; Isquare: 70.13%; p value < 0.001), lowered SBP (SMD: −0.06; 95% CI: −0.16, −0.05; Isquare: 39.63%; p value = 0.23), and reduced LDL (SMD: −0.11; 95% CI: −0.28, −0.05; Isquare: 73.66%; p value < 0.001). Furthermore, vitamin D supplementation increased the average HDL (SMD: 0.13; 95% CI: 0.04, 0.29; Isquare: 79.33%; p value < 0.001) and vitamin D levels (SMD: 1.78; 95% CI: 1.53, 2.04; Isquare: 91.92%; p value < 0.001) in patients with T2DM. Subgroup analyses showed that weight gain, BMI, and duration of the disease could reduce the effect of vitamin D supplementation on diabetes control in affected patients.
Conclusion: The results also indicated that taking vitamin D supplements in the amount of 50,000 IU had a significant effect on reducing the indicators related to diabetes control. Based on the combined evidence, the findings of this meta-analysis suggest that vitamin D supplementation can significantly improve glycemic control and reduce the risk of complications associated with T2DM, especially cardiovascular diseases (CVDs).
Keywords: meta-analysis, systematic review, Type 2 diabetes, vitamin D supplementation
1. Introduction
Type 2 diabetes (T2DM) is a prevalent and progressive metabolic disorder among adults worldwide, carrying high mortality and morbidity rates. In 2021, 529 million people worldwide lived with diabetes, and the age-standardized prevalence was 6.1%, with a confidence interval ranging from 5.8% to 6.5%. The highest age-standardized prevalence was observed in North Africa and the Eastern Mediterranean. In 2021, the leading risk factor for diabetes incidence was high body mass index (BMI), indicating that this risk factor contributed significantly to the attributable risk. Projections suggest that by 2050, 89 out of 204 countries worldwide will have an age-standardized prevalence exceeding 10% [1]. T2DM ranked as the seventh leading cause of disability (in terms of DALYs) and the ninth leading cause of death globally. These alarming statistics highlight the need for effective interventions to manage and prevent the complications associated with T2DM [2–4]. Approximately one-third of the US population is estimated to be at risk of developing T2DM or being in a prediabetic state. Each year, 10% of individuals with prediabetes progress to T2DM, underscoring the need for preventive measures and interventions for early detection and management of the disease [4, 5]. The mechanism of T2DM is characterized by insufficient secretion of insulin from pancreatic β-cells and an inadequate response of insulin-sensitive tissues to insulin. This can arise due to a combination of factors, such as genetic background, obesity, aging, and physical inactivity [6–8]. Classic clinical symptoms of diabetes include polyuria, polyphagia, and polydipsia, which, if undiagnosed and untreated, can lead to various complications such as retinopathy, neuropathy, nephropathy, peripheral vascular disease, and cerebrocardiovascular diseases (CVDs). Diagnostic tests used to screen for diabetes in individuals without classic hyperglycemia symptoms include fasting blood sugar (FBS), hemoglobin A1c (HbA1C), and 2-h plasma glucose concentration. According to the latest update from the American Diabetes Association, a diagnosis of diabetes requires two abnormal screening tests in cases where classic clinical symptoms of diabetes are absent [9]. Vitamin D is a prohormone of the secosteroid type, which is mostly produced in the body after sunlight exposure to the skin. After being produced in the skin, it needs to be hydroxylated twice to become the active form, or 1.25 (OH)2D, respectively, in the liver and kidneys [10, 11]. Reasons such as reducing the duration of exposure to sunlight, improper diet, accelerated losses of vitamin D, and impaired activation of vitamin D led to hypovitaminosis D and, as a result, symptoms such as muscle pain, arthralgia, fatigue and weakness, osteoporosis, and rickets [12–15]. In recent years, several studies have been conducted on the effect of vitamin D supplementation on blood sugar control and the prevention of complications due to its high level (blood sugar) in patients with T2DM. In a clinical trial conducted by López et al. in 2016 on 140 patients with T2DM, patients who received vitamin D along with a drug regimen had lower HbA1C levels after 3 months than patients who received a placebo [16]. In another clinical trial conducted by Khan et al. on 90 patients with T2DM, after 2 months, the patients who received vitamin D had a lower HbA1C level [17]. Other similar studies have been conducted that have reported the positive effect of vitamin D supplementation on the reduction of HbA1C [18–20]. Clinical trials have also been conducted on the effect of vitamin D on FBS control. For example, in two clinical trials conducted by Omidian et al. and Upreti et al. on 48 and 60 people, respectively, after 3 months of follow-up, the group that received vitamin D had a lower FBS level [21]. Although several studies have reported a positive effect of vitamin D supplementation on blood sugar control in patients with T2DM, other studies have reported conflicting findings [22, 23]. In a clinical trial conducted by El Hajj et al. in 2018 on 88 patients with T2DM, the group receiving vitamin D supplementation did not show a significant difference in the level of HbA1C compared to the group receiving placebo after the follow-up period [24]. In several studies, it is possible that vitamin D, in addition to its anti-inflammatory effect as well as its effect on intracellular enzyme pathways through blood sugar control, can reduce complications such as retinopathy and nephropathy in T2DM patients [25, 26]. Given the high incidence, prevalence, morbidity, and mortality of patients with T2DM, along with conflicting reports on the effect of vitamin D supplementation on blood sugar levels and the potential benefits of vitamin D in preventing complications associated with T2DM, this meta-analysis aims to determine the effect of vitamin D supplementation on the average indices of HbA1C, FBS, low-density lipoprotein (LDL), high-density lipoprotein (HDL), systolic blood pressure (SBP), and the overall vitamin D level in patients with T2DM. The findings of this meta-analysis have the potential to inform and update treatment and care guidelines related to T2DM.
2. Methods
This systematic review and meta-analysis was conducted in accordance with the preferred reporting items for systematic reviews and meta-analyses (PRISMA) guidelines [27]. Additionally, the protocol for this systematic review and meta-analysis was registered in the international prospective register of systematic reviews (PROSPERO) to ensure transparency and reduce the risk of bias (CRD42023401300).
The study's keywords were selected based on the research question and objectives and then combined using AND with OR operators to formulate the search strategy and syntax for each database. The main search terms included vitamin D and its synonyms (calcitriol, cholecalciferol, vitamin D, vitamin D2, and vitamin D3) and T2DM and its synonyms (diabetes, T2D, and hyperglycemia) (Table S1). Thesauruses, Emtree, and Mesh databases were used to identify additional synonyms. The databases searched included PubMed (Medline), Scopus, Embase, Web of Science, Cochrane Library, and ClinicalTrials.gov, covering the period from January 1990 to January 2024. To ensure that no relevant studies were missed, a manual search was conducted to identify additional studies by checking the references and sources cited in the selected studies. After completing the search, the retrieved studies were imported into EndNote Version 8 software and screened based on the title, abstract, and full text using the inclusion and exclusion criteria. This process was conducted by two independent reviewers (H.M.B. and M.A.), and any discrepancies were resolved through discussion or consultation with a third reviewer. To enhance the reliability of this process, the authors independently double-checked the references manually, ensuring further confidence in the results. The inclusion criteria for this systematic review and meta-analysis were based on the PICOT structure. Studies were considered if they involved patients with T2DM as the population, and the main intervention was vitamin D supplementation, with a comparison group receiving a placebo or other routine drugs. The desired outcomes included average HbA1C, FBS, LDL, HDL, SBP, and vitamin D levels in the body after taking vitamin D supplements in patients. The mean differences in serum vitamin D levels were chosen as one of the primary endpoints of the study based on the indications from the selected trials in the search results, verifying the inclusion of oral vitamin D supplements and identifying serum vitamin D levels as a key focus of the research. Only interventional studies, specifically randomized clinical trials, were considered for inclusion. The exclusion criteria included articles with repeated citations, review articles, cross-sectional studies, case-control or cohort studies, books, conference articles, and clinical trials with different primary and intervention outcomes. Additionally, clinical trials that did not consider vitamin D supplementation as an intervention, did not involve patients with T2DM, or did not report a standardized mean difference (SMD) as the measurement index were excluded from the study. The screening process was conducted by two independent reviewers (M.A. and F.M.), and any discrepancies were resolved through discussion or consultation with a third reviewer (Y.M.).
After the screening, the quality assessment of the selected studies was done using Version 2 of the Cochrane risk-of-bias tool for randomized trials (RoB 2) [28]. The RoB 2 tool evaluates the risk of bias in five domains, including the randomization process, deviations from intended interventions, missing outcome data, measurement of the outcome, and selection of the reported result. For each domain, the study was rated as low, high, or unclear risk of bias. By using the RoB 2 tool, the authors were able to assess the quality of the selected studies and ensure that the study findings were reliable and accurate.
Finally, extracting information by examining items related to studies (name of authors, year of publication, type of study, sample size, and country of study), items related to the target population (age, BMI, and duration of diabetes), the items related to the intervention (the type of intervention and how to do it) of the comparison group, and, finally, the desired outcomes (average HbA1C, FBS, LDL, HDL, SBP, and vitamin D level of the body) were performed. The three stages of selecting studies, qualitative assessment, and data extraction were done independently by two authors (M.A./H.M.B. and F.M.), and any discrepancies were resolved through discussion or consultation with a third reviewer (Y.M.).
STATA Version 17 software was used to perform the meta-analysis. The desired index for the analysis was the SMD. To calculate this index, before and after the intervention, the average and standard deviation (SD) for each outcome in each group were extracted from the selected studies, and their differences were calculated. Then, using STATA software Version 17, this index was calculated by considering the fixed effect model. Egger's test and funnel plot were used to evaluate publication bias. Also, the Isquare index and the Q Cochrane test were used to evaluate heterogeneity. Subgroup analyses were performed based on age, BMI, duration of diabetes, different doses of supplements, continent, and length of follow-up of patients (based on weeks). Metaregression analysis was also performed on the basis of patients' BMI and age to assess the effect of these two variables on the relationship between vitamin D supplementation and diabetes control. The significance level in this meta-analysis was considered below 0.05. The grading of recommendations assessment, development, and evaluation (GRADE) approach was used to assess the overall quality of evidence for each outcome listed in the summary of findings table. The GRADEpro GDT online software was used to conduct the GRADE approach and generate a summary of findings tables (Table S2).
3. Results
At the outset of this study, a total of 4098 articles were identified through a comprehensive search process. Following a rigorous screening process based on the title and abstract, 1205 and 1492 articles were excluded, respectively. Subsequently, 192 articles were subjected to full-text screening, and after careful evaluation, 131 articles were excluded due to unrelated outcome (115 articles), unrelated effect size (10 articles), and unrelated methodology (six articles). Finally, 61 clinical trials that met the inclusion criteria were selected for the meta-analysis (Figure 1). Table 1 presents a comprehensive overview of the characteristics of the included randomized controlled trials. All relevant details, such as study design, sample size, intervention, and outcome measures, have been carefully documented to facilitate a thorough understanding of the studies included in this meta-analysis.
Figure 1.

A flow diagram demonstrating the study selection process.
Table 1.
The characteristics of included randomized control trials in this meta-analysis.
| Authors (years) | Years | Country | Sample size intervention | Sample size placebo | Mean age | BMI | Disease duration | Follow-up duration | Intervention | Study population |
|---|---|---|---|---|---|---|---|---|---|---|
| Barale et al. (2021) [50] | 2021 | Italy | 14 | 16 | 71.5 | 29.8 | NR | 12 weeks; 24 weeks; 36 weeks; 48 weeks | 5000 IU/day | T2DM |
| Cojic et al. (2021) [51] | 2021 | Serbia | 65 | 65 | 60 | 30 | 4 | 12 weeks; 24 weeks | 50,000 IU/week | T2DM |
| Mozaffari et al. (2021) [52] | 2021 | Iran | 40 | 40 | NR | NR | NR | 12 weeks | 50,000 IU/week | T2DM |
| Safarpour et al. (2020) [53] | 2020 | Iran | 42 | 43 | 48.3 | 31.37 | NR | 8 weeks | 50,000 IU/week | T2DM |
| Angellotti et al. (2018) [54] | 2018 | United States | 61 | 59 | 60.2 | 30.9 | NR | 16 weeks; 24 weeks; 36 weeks; 48 weeks | 4000 IU/day | Patients with well-controlled Type 2 diabetes (metformin or lifestyle) |
| Khan et al. (2018) [17] | 2018 | Pakistan | 70 | 70 | 54.8 | NR | >10 | 12 weeks | 50,000 IU/week | Patients with Type 2 diabetes with vitamin D deficiency |
| Safarpour et al. (2018) [55] | 2018 | Iran | 42 | 43 | 50.36 | 30.43 | 5.5 | 8 weeks | 50,000 IU/week | T2DM |
| Sosale et al. (2017) [56] | 2017 | India | 29 | 31 | 53 | 25.9 | 7 | 24 weeks | 60,000 IU/week | Type 2 diabetes and dyslipidemia, had A1c below 9%, and low vitamin D levels (<30 ng/mL) |
| Upreti et al. (2018) [23] | 2018 | India | 30 | 30 | 48.3 | 24.56 | NR | 24 weeks | 60,000 IU/week | Patients with coexisting Type 2 diabetes mellitus and hypovitaminosis D |
| Angellotti et al. (2019) [57] | 2019 | United States | 66 | 61 | 60.1 | 30.7 | NR | 24 weeks; 48 weeks | 4000 IU/day | Patients with well-controlled Type 2 diabetes (metformin or lifestyle) |
| Esfandiari et al. (2018) [58] | 2018 | Iran | 25 | 25 | 39.7 | NR | NR | 8 weeks | 50,000 IU/week | T2DM |
| Omidian et al. (2019) [59] | 2019 | Iran | 32 | 34 | 49.7 | 27.3 | NR | 12 weeks | 4000 IU/day | T2DM |
| Omidian et al. (2019) [21] | 2019 | Iran | 23 | 23 | 51.3 | 26.8 | 5.8 | 12 weeks | 4000 IU/day | T2DM |
| Talari et al. (2019) [60] | 2019 | Iran | 30 | 31 | 67.3 | 29.2 | 24 weeks | 50,000 IU/week | T2DM | |
| Cojic et al. (2020) [61] | 2020 | Montenegro | 50 | 68 | 60 | 29.34 | 12 weeks; 24 weeks | 50,000 IU/week | T2DM+metformin | |
| El Hajj et al. (2020) [24] | 2020 | Lebanon | 45 | 43 | 66.9 | 22.6 | 8.7 | 24 weeks | 30,000 IU/week | T2DM |
| Mirzavandi et al. (2020) [62] | 2020 | Iran | 25 | 25 | 45.56 | 31 | 7 | 8 weeks | 200,000 IU/once | T2DM |
| Jorde and Figenschau (2009) [63] | 2009 | Norway | 16 | 16 | 56.25 | 32.1 | 24 weeks | 40,000 IU/week | T2DM | |
| Eftekhari et al. (2011) [64] | 2011 | Iran | 35 | 35 | 53.8 | 28.3 | 12 weeks; 10 weeks | 5000 IU/day | T2DM | |
| Heshmat et al. (2012) [65] | 2012 | Iran | 21 | 21 | 56.2 | 27.7 | 6.7 | 12 weeks | 300,000 IU/once | T2DM+metformin+glibenclamide |
| Nasri et al. (2014) [66] | 2014 | Iran | 30 | 30 | 55.1 | 12 weeks | 50,000 IU/week | T2DM | ||
| Jehle et al. (2014) [20] | 2014 | Switzerland | 29 | 26 | 66.9 | 28.9 | 12.7 | 12 weeks; 24,weeks | 300,000 IU/once | T2DM+metformin+sulfonylureas+pioglitazone+GLP-1 receptor signaling+insulin |
| Park et al. (2014) [67] | 2014 | Korea | 11 | 13 | 73.27 | 24.08 | 12 weeks | 1200 IU/day | T2DM | |
| Ryu et al. (2014) [68] | 2014 | Korea | 64 | 65 | 54.8 | 25 | 5.7 | 24 weeks | 1000 IU/day | T2DM+meglitinide+metformin+alpha-glucosidase inhibitor+sulfonylurea+pioglitazone |
| Rad et al. (2014) [69] | 2014 | Iran | 28 | 30 | 50.03 | 27.94 | 5.89 | 8 weeks | 4000 IU/day | T2DM+metformin+glibenclamide |
| Al-Zahrani et al. (2014) [70] | 2014 | Saudi | 91 | 92 | 56.9 | 31.3 | NR | 12 weeks | 45,000 IU/week | T2DM+metformin Insulin |
| Mohammadi et al. (2016) [71] | 2016 | Iran | 28 | 25 | 38.5 | 28.8 | NR | 12 weeks | 50,000 IU/week | T2DM |
| Forouhi et al. (2016) [72] | 2016 | United Kingdom | 114 | 112 | 53.5 | 28.9 | NR | 16 weeks | 20,000 IU/week | T2DM |
| Lo, Abushamat, and Mramba (2018) [73] | 2018 | United States | 14 | 16 | NR | NR | NR | 24 weeks | 50,000 IU/week | T2DM |
| Breslavsky et al. (2013) [74] | 2013 | Israel | 24 | 23 | 66.8 | 27.9 | NR | 48 weeks | 1000 IU/day | T2DM+metformin+sulfonilure+repaglinid+DDP-4 inhibitors |
| Dadrass et al. (2018) [75] | 2018 | Iran | 12 | 12 | 53.7 | 27.7 | NR | 12 weeks | 5000 IU/day | T2DM |
| Bhosle and Mubeen (2018) [18] | 2018 | India | 60 | 60 | NR | NR | NR | 12 weeks; 24 weeks | 60,000 IU/week | T2DM |
| Sadiya et al. (2015) [76] | 2015 | UAE | 43 | 39 | 49.8 | 37.9 | 9.5 | 24 weeks; 12 weeks | 3000 IU/day | T2DM |
| Sugden et al. (2007) [77] | 2007 | United Kingdom | 17 | 17 | 64.9 | 31.7 | 8 weeks | 100,000 IU/once | T2DM+metformin+sulfonylureas+insulin+thiazolidinedione | |
| Momeni et al. (2017) [78] | 2017 | Iran | 30 | 30 | 62.4 | 8 weeks | 50,000 IU/week | T2DM | ||
| Baziar et al. (2014) [79] | 2014 | Iran | 41 | 40 | 50.34 | 27.33 | 5.44 | 8 weeks | 50,000 IU/week | T2DM |
| Razzaghi et al. (2016) [80] | 2016 | Iran | 30 | 30 | 59.6 | 26 | 12 weeks | 50,000 IU/week | T2DM+metformin+insulin | |
| Dalan et al. (2016) [81] | 2016 | Singapore | 31 | 30 | 52.2 | 27.3 | 16 weeks | 4000 IU/day | T2DM+metformin+sulfonilure+DDP-4 inhibitors | |
| Witham et al. (2010) [82] | 2010 | United Kingdom | 19 | 22 | 65.3 | 31.1 | 8 weeks; 16 weeks | 100,000 IU/once | T2DM | |
| 200,000 IU/once | ||||||||||
| Shaseb et al. (2016) [83] | 2016 | Iran | 48 | 47 | 54.9 | 27.2 | 3.9 | 8 weeks | 300,000 IU/once | T2DM |
| Ghavamzadeh, Mobasseri, and Mahdavi (2014) [84] | 2014 | Iran | 26 | 25 | 52.26 | 28.9 | 14 weeks | 400 IU/day | T2DM+metformin+insulin | |
| Krul-Poel et al. (2016) [29] | 2016 | Netherlands | 129 | 132 | 67 | 28.7 | 6 | 24 weeks | 50,000 IU/week | T2DM+metformin+sulfonylurea |
| Barzegari et al. (2018) [85] | 2018 | Iran | 25 | 25 | 39.7 | 21.1 | 8 weeks | 50,000 IU/week | T2DM | |
| Kampmann et al. (2014) [86] | 2014 | Denmark | 7 | 8 | 61.6 | 33.8 | 5.6 | 12 weeks | 5600 IU/day | T2DM+insulin |
| Farrokhian et al. (2017) [87] | 2017 | Iran | 30 | 30 | 61.7 | 30.2 | 24 weeks | 50,000 IU/week | T2DM | |
| Shahriari, Eftekhari, and Jeddi (2018) [88] | 2018 | Iran | 28 | 29 | 57.1 | 27.6 | 6.9 | 8 weeks | 50,000 IU/week | T2DM |
| Parekh et al. (2010) [89] | 2010 | India | 14 | 13 | 42.36 | 23.54 | 4.8 | 4 weeks | 300,000 IU/once | T2DM+metformin+glibenclamide |
| Gulseth et al. (2017) [90] | 2017 | Norway | 33 | 29 | 55.5 | 31.8 | 11.9 | 24 weeks | 400,000 IU/once | T2DM+metformin, sulfonylureas, pioglitazone, exenatide, and dipeptidyl peptidase 4 inhibitors |
| Imanparast et al. (2020) [91] | 2020 | Iran | 23 | 23 | 53.63 | 28.29 | 16 weeks | 50,000 IU/week | T2DM+glibenclamide or repaglinide+metformin or only metformin | |
| Agarwal, Marwah, and Kulshrestha (2017) [92] | 2017 | India | 30 | 30 | 57.13 | 12 weeks | 60,000 IU/week | T2DM | ||
| Al-Sofiani et al. (2015) [22] | 2015 | Saudi Arabia | 10 | 10 | 54.8 | 9.3 | 12 weeks | 5000 IU/day | T2DM | |
| Barchetta et al. (2016) [93] | 2016 | Italy | 26 | 29 | 57.4 | 29.3 | 5.9 | 24 weeks | 2000 IU/day | T2DM |
| Elkassaby et al. (2014) [94] | 2014 | Australia | 26 | 24 | 12 weeks; 24 weeks | 6000 IU/day | T2DM+metformin | |||
| Ebrahimkhani, Ghavamzadeh, and Mehdizadeh (2020) [95] | 2020 | Iran | 17 | 19 | 50.53 | 30.2 | 6.5 | 12 weeks | 50,000 IU/week | T2DM |
| Fazelian et al. (2020) [96] | 2020 | Iran | 26 | 25 | 48.5 | 30.21 | 16 weeks | 50,000 IU/week | T2DM | |
| Maggi et al. (2014) [97] | 2014 | Italy | 12 | 13 | 69 | 29 | 12 weeks; 24 weeks | 300,000 IU/once | T2DM | |
| Moreira-Lucas et al. (2017) [98] | 2017 | Canada | 35 | 36 | 49.1 | 30.1 | 24 weeks | 28,000 IU/week | T2DM | |
| Mousa et al. (2017) [99] | 2017 | Australia | 28 | 26 | 30.5 | 30.5 | 16 weeks | 100,000 IU/once | T2DM | |
| Nasri et al. (2014) [66] | 2014 | Iran | 30 | 30 | 55 | 29.3 | 12 weeks | 50,000 IU/week | T2DM | |
| Qasemi et al. (2021) [100] | 2021 | Iran | 23 | 21 | 55.13 | 9.83 | 12 weeks | 2000 IU/day | T2DM+metformin+glibenclamide+glitazone | |
| Raygan et al. (2018) [101] | 2018 | Iran | 30 | 30 | 71.5 | 29 | 12 weeks | 50,000 IU/week | T2DM | |
| Shehab et al. (2015) [102] | 2015 | Kuwait | 57 | 55 | 61.8 | 8 weeks | 50,000 IU/week | T2DM |
3.1. HbA1C
The first outcome of this meta-analysis was determining the effect of vitamin D supplementation on average HbA1C. To achieve this goal, the average HbA1C before and after the intervention was reported in 45 studies out of all clinical trial studies selected in this meta-analysis. From these studies, without considering subgroup analyses, 61 effect sizes (SMD) were extracted and considered for meta-analysis. After combining these results, the SMD was equal to −0.15 (SMD: −0.15; 95% CI: −0.29, −0.20; Isquare: 79.76%; p value < 0.001) (Table 2).
Table 2.
The overall effect of vitamin D supplement on the HbA1C and FBS in patients with diabetes based on continent, age, BMI, diabetes duration, dose of intervention, and follow-up duration.
| Variables | Category | No. study | Pooled MSD (95% CI) | Heterogeneity assessment between studies | Heterogeneity assessment between subgroup | Publication bias assessments | ||||||
|---|---|---|---|---|---|---|---|---|---|---|---|---|
| I 2 | p value | Q | Q | p value | β | SE | p value | |||||
| HbA1C | Overall SMD | 45 (61) | −0.15 (−0.29, −0.2) | 79.76% | ≤0.001 | 296.37 | — | — | −1.48 | 0.806 | 0.065 | |
| Continent | Europe | 12 (22) | −0.08 (−0.17, 0.02) | 5.45% | 0.39 | 22.21 | 7.08 | 0.03 | ||||
| Asia | 30 (33) | −0.32 (−0.53, −0.11) | 84.18% | ≤0.001 | 102.27 | |||||||
| America | 3 (6) | 0.30 (−0.19, 0.79) | 88.08% | ≤0.001 | 41.94 | |||||||
| Age | <60 | 28 (30) | −0.35 (−0.56, −0.13) | 84.56% | ≤0.001 | 187.79 | 8.44 | ≤0.001 | ||||
| >60 | 13 (25) | 0.05 (−0.11, 0.22) | 66.83% | ≤0.001 | 72.36 | |||||||
| BMI | <30 | 22 (28) | −0.32 (−0.52, −0.11) | 80.92% | ≤0.001 | 141.48 | 6.63 | 0.01 | ||||
| >30 | 12 (20) | 0.06 (−0.15, 0.26) | 75.76% | ≤0.001 | 78.38 | |||||||
| Disease duration | <10 | 14 (16) | −0.18 (−0.49, −0.13) | 86.44% | ≤0.001 | 110.64 | 0.62 | 0.43 | ||||
| >10 | 3 (4) | −0.49 (−1.19, 0.21) | 88.49% | ≤0.001 | 26.07 | |||||||
| Intervention | <50,000 | 20 (29) | −0.22 (−0.46, 0.02) | 86.38% | ≤0.001 | 205.55 | 0.78 | 0.68 | ||||
| 50,000–100,000 | 22 (25) | −0.15 (−0.31, −0.02) | 72.25% | ≤0.001 | 86.50 | |||||||
| >100,000 | 5 (7) | −0.08 (−0.28, 0.12) | 0.00 | 0.84 | 2.76 | |||||||
| Follow-up duration | 8 weeks | 10 (11) | −0.38 (−0.88, 0.12) | 90.30% | ≤0.001 | 103.08 | 30.53 | ≤0.001 | ||||
| 12 weeks | 19 (19) | −0.29 (−0.51, −0.06) | 75.25% | ≤0.001 | 72.73 | |||||||
| 14 weeks | 1 (1) | −1.63 (−2.28, −1.01) | — | — | — | |||||||
| 16 weeks | 5 (7) | −0.02 (−0.17, 0.12) | 0.00% | 0.76 | 3.38 | |||||||
| 24 weeks | 18 (18) | −0.03 (−0.13, 0.07) | 0.00% | 0.68 | 13.87 | |||||||
| 36 weeks | 2 (2) | 0.62 (−1.01, 2.26) | 93.69% | ≤0.001 | 15.85 | |||||||
| 48 weeks | 3 (3) | −0.07 (−0.36, −0.21) | 3.63% | 0.35 | 2.08 | |||||||
|
| ||||||||||||
| FBS | Overall SMD | 40 (50) | −0.28 (−0.40, −0.15) | 70.13% | ≤0.001 | 164.07 | — | — | −2.50 | 0.812 | 0.002 | |
| Continent | Europe | 8 (13) | −0.19 (−0.31, −0.07) | 0.00% | 0.83 | 7.42 | 1.12 | 0.57 | ||||
| Asia | 31 (36) | −0.30 (−0.47, −0.12) | 77.56% | ≤0.001 | 155.97 | |||||||
| America | 1 (1) | −0.14 (−0.61, 0.33) | — | — | — | |||||||
| Age | <60 | 26 (29) | −0.19 (−0.34, −0.04) | 63.01% | ≤0.001 | 75.70 | 0.00 | 1.00 | ||||
| >60 | 12 (17) | −0.19 (−0.30, −0.08) | 0.00% | 0.60 | 13.96 | |||||||
| BMI | <30 | 22 (28) | −0.24 (−0.38, −0.09) | 54.51% | ≤0.001 | 59.35 | 0.96 | 0.33 | ||||
| >30 | 12 (14) | −0.14 (−0.26, −0.02) | 2.92% | 0.42 | 13.39 | |||||||
| Disease duration | <10 | 16 (18) | −0.14 (−0.34, 0.06) | 71.02% | ≤0.001 | 58.65 | 0.26 | 0.61 | ||||
| >10 | 1 (1) | 0.00 (−0.50, 0.50) | — | — | — | |||||||
| Intervention | <50,000 | 17 (24) | −0.44 (−0.69, −0.2) | 78.84% | ≤0.001 | 108.70 | 5.23 | 0.07 | ||||
| 50,000–100,000 | 19 (22) | −0.21 (−0.34, −0.08) | 45.65% | 0.01 | 38.64 | |||||||
| >100,000 | 4 (4) | 0.12 (−0.34, 0.57) | 67.71% | 0.03 | 9.29 | |||||||
| Follow-up duration | 8 weeks | 9 (9) | −0.25 (−0.58, 0.08) | 76.01% | ≤0.001 | 33.35 | 1.34 | 0.97 | ||||
| 12 weeks | 18 (19) | −0.25 (−0.43, −0.06) | 60.43% | ≤0.001 | 45.49 | |||||||
| 10 weeks | 1 (1) | −0.19 (−0.66, 0.28) | — | — | — | |||||||
| 16 weeks | 2 (2) | −0.15 (−0.57, 0.28) | 14.88% | 0.28 | 1.17 | |||||||
| 24 weeks | 16 (16) | −0.38 (−0.64, −0.12) | 81.61% | ≤0.001 | 81.58 | |||||||
| 36 weeks | 1 (1) | −0.40 (−1.12, 0.33) | — | — | — | |||||||
| 48 weeks | 2 (2) | −0.19 (−0.83, 0.45) | 47.51% | 0.17 | 1.91 | |||||||
Subgroup analyses were performed based on continent, age, BMI, duration of diabetes, different doses of vitamin D, and duration of follow-up in selected clinical trial studies. The results showed that the effect of vitamin D supplementation on reducing the average HbA1C in Asian patients was more than in European patients (SMD: −0.32; 95% CI: −0.53, −0.11; Isquare: 84.18%; p value < 0.001). But in individuals with diabetes living in America, this impression was the opposite, in the form of an increase in the average HbA1C (SMD: 0.30; 95% CI: −0.19, 0.79; Isquare: 88.08%; p value < 0.001) (Table 2). Subgroup analysis based on the age of individuals with diabetes and BMI showed that the effect of vitamin D supplementation in individuals with diabetes less than 60 years old and a BMI of less than 30 is significantly greater in reducing the average HbA1C. Also, if the duration of diabetes in patients is more than 10 years, vitamin D reduces HbA1C more (SMD: −0.49; 95% CI: −1.19, 0.21; Isquare: 88.49%; p value < 0.001), but it is not statistically significant (Table 2). Concerning the duration of follow-up in selected clinical trial studies after the intervention, subgroup analyses showed that in the case of 8-week follow-up after the intervention, the effect of vitamin D on reducing HbA1C is greater than other follow-ups such as 16, 36, or 48 weeks (SMD: −0.38; 95% CI: −0.88, 0.12; Isquare: 90.30%; p value < 0.001). After the 8th week, the follow-up up to the 12th week also showed the effect of vitamin D on the reduction of HbA1C, but after this week, it showed different effects of vitamin D on the control of HbA1C (Table 2). Subgroup analysis based on different doses of vitamin D reveals that receiving a dose less than 50,000 IU has shown a greater effect on reducing HbA1C (SMD: −0.22; 95% CI: −0.46, 0.02; Isquare: 86.44%; p value < 0.001) (Table 2).
Metaregression analysis was performed to determine the effect of age and BMI variables on the effect of vitamin D supplementation on average HbA1C, and the results showed that the effect of vitamin D on average HbA1C increases with the age of patients (β: 0.20; SE: 0.01; 95% CI: −0.09, 0.05; p: 0.185), and with the increase of BMI, this effect decreases (β: −0.49; SE: 0.04; 95% CI: −0.13, 0.03; p: 0.271). Egger's test analyses to check publication bias showed that this bias did not occur in the overall analysis of determining the effect of vitamin D on average HbA1C (β: −1.48; SE: 0.80; p: 0.06) (Figure 2).
Figure 2.

The results of publication bias based on funnel plot about effect of vitamin D supplemental on the control of diabetes.
3.2. Fasting Blood Glucose
The second objective was to assess the impact of vitamin D supplementation on mean FBS. In total, 40 studies with 50 reported effect sizes were included in the meta-analysis. Upon combining these findings, the SMD was calculated as −0.28 (SMD: −0.28; 95% CI: −0.40, −0.15; Isquare: 70.13%; p value < 0.001). This indicates a statistically significant reduction in FBS levels among individuals with diabetes (Table 2).
Subgroup analyses showed that the effect of vitamin D supplementation on the reduction of mean FBS in the Asian community (SMD: −0.30; 95% CI: −0.47, −0.12; Isquare: 77.56%; p value < 0.001) and patients with BMI less than 30 (SMD: −0.24; 95% CI: −0.38, −0.09; Isquare: 54.51%; p value < 0.001) is more (Table 2). Based on the duration of diabetes in patients, most of the included studies included patients with a duration of disease of less than 10 years. After combining these results, vitamin D supplementation reduced the average FBS to 0.14. Based on different doses of vitamin D, the dose of 50,000 IU (SMD: −0.44; 95% CI: −0.69, −0.20; Isquare: 78.84%; p value < 0.001) and follow-up for 24 weeks after the intervention (SMD: −0.38; 95% CI: −0.64, −0.12; Isquare: 81.61%; p value < 0.001) have shown a better effect of vitamin D on reducing the average FBS (Table 2).
Metaregression analysis was performed to determine the effect of age and BMI variables on the effect of vitamin D supplementation on average FBS, and the results showed that with age increasing (β: 0.02; SE: 0.00; 95% CI: −0.01, 0.03; p: 0.672) and BMI increasing (β: 0.01; SE: 0.00; 95% CI: −0.02, 0.04; p: 0.577) in patients, the effect of vitamin D on average FBS increases. Egger's test analyses for checking publication bias showed that this bias occurred in the overall analysis of determining the effect of vitamin D on average FBS (β: −2.50; SE: 0.81; p value ≤ 0.001) (Figure 2).
3.3. SBP
The next outcome in this meta-analysis was mean SBP. The reason for not reporting diastolic blood pressure (DBP) was not reporting its average in selected studies. Based on the analysis, vitamin D supplementation has reduced the mean SBP by 0.06 (SMD: −0.06; 95% CI: −0.16, −0.05; Isquare: 39.63%; p value = 0.23) (Table 3).
Table 3.
The overall effect of vitamin D supplement on the SBP in patients with diabetes based on continent, age, BMI, diabetes duration, dose of intervention, and follow-up duration.
| Variables | Category | No. study | Pooled MSD (95% CI) | Heterogeneity assessment between studies | Heterogeneity assessment between subgroup | Publication bias assessments | ||||||
|---|---|---|---|---|---|---|---|---|---|---|---|---|
| I 2 | p value | Q | Q | p value | β | SE | p value | |||||
| SBP | Overall SMD | 26 (37) | −0.06 (−0.16, 0.05) | 39.63% | 0.23 | 59.63 | −0.87 | 0.617 | 0.160 | |||
| Continent | Europe | 11 (21) | −0.06 (−0.21, 0.08) | 48.58% | 0.12 | 38.89 | 0.01 | 0.94 | ||||
| Asia | 15 (16) | −0.05 (−0.20, 0.09) | 27.65% | 0.15 | 20.73 | |||||||
| Age | <60 | 15 (17) | −0.08 (−0.21, −0.05) | 25.51% | 0.16 | 21.44 | 0.14 | 0.71 | ||||
| >60 | 11 (20) | −0.04 (−0.20, 0.12) | 49.47% | 0.01 | 37.60 | |||||||
| BMI | <30 | 15 (21) | −0.02 (−0.13, 0.00) | 21.30% | 0.19 | 25.41 | 0.21 | 0.64 | ||||
| >30 | 9 (14) | −0.07 (−0.25, −0.11) | 43.76% | 0.05 | 23.12 | |||||||
| Disease duration | <10 | 11 (13) | 0.01 (−0.15, 0.18) | 37.59% | 0.08 | 19.23 | 0.87 | 0.35 | ||||
| >10 | 1 (2) | 0.38 (−0.37, 1.13) | 74.29% | 0.05 | 3.89 | |||||||
| Intervention | <50,000 | 13 (18) | −0.06 (−0.22, 0.10) | 45.11% | 0.02 | 30.97 | 0.45 | 0.80 | ||||
| 50,000–100,000 | 11 (14) | −0.08 (−0.22, −0.06) | 31.56% | 0.12 | 18.99 | |||||||
| >100,000 | 3 (5) | 0.06 (−0.32, 0.45) | 54.13 | 0.07 | 8.72 | |||||||
| Follow-up duration | 8 weeks | 3 (4) | −0.45 (−0.94, −0.04) | 64.03% | 0.04 | 8.34 | 8.19 | 0.15 | ||||
| 12 weeks | 14 (14) | −0.05 (−0.23, 0.13) | 43.29% | 0.04 | 22.94 | |||||||
| 16 weeks | 4 (6) | −0.04 (−0.20, 0.11) | 0.00% | 0.68 | 3.10 | |||||||
| 24 weeks | 10 (10) | −0.00 (−0.16, 0.16) | 23.75% | 0.22 | 11.80 | |||||||
| 36 weeks | 1 (1) | 0.78 (0.04, 1.52) | — | — | — | |||||||
| 48 weeks | 2 (2) | −0.34 (−1.11, −0.43) | 63% | 0.10 | 2.70 | |||||||
According to the continent, this effect in individuals with diabetes living in Europe (SMD: −0.06; 95% CI: −0.21, 0.08; Isquare: 48.58%; p value = 0.12) is more than in Asians (SMD: −0.05; 95% CI: −0.20, 0.09; Isquare: 27.65%; p value = 0.15). Also, this effect if the age of individuals with diabetes is less than 60 years (SMD: −0.08; 95% CI: −0.21, −0.05; Isquare: 25.51%; p value = 0.16) and the BMI is more than 30 (SMD: −0.07; 95% CI: −0.25, −0.11; Isquare: 43.76%; p value = 0.05) is different and has a greater reducing effect on the average SBP. Based on different doses of vitamin D, a dose of 50,000–100,000 IU (SMD: −0.08; 95% CI: −0.22, −0.06; Isquare: 31.56%; p value = 0.12) and follow-up for 8 weeks after the intervention (SMD: 0.45; 95% CI: −0.94, −0.04; Isquare: 64.03%; p value = 0.04) have shown a better effect of vitamin D on reducing the average SBP (Table 3).
Metaregression analysis was performed to determine the effect of age and BMI variables on the effect of vitamin D supplementation on average SBP, and the results showed that with age increasing (β: 0.20; SE: 0.05; 95% CI: −0.06, 0.42; p: 0.705) and BMI increasing (β: 0.23; SE: 0.10; 95% CI: −0.01, 0.56; p: 0.816) in patients, the effect of vitamin D on average HbA1C increases. Egger's test analyses to check publication bias showed that this bias did not occur in the overall analysis of determining the effect of vitamin D on mean SBP (β: −0.87; SE: 0.61; p: 0.16) (Figure 2).
3.4. HDL
The effect of vitamin D on average HDL in patients with diabetes was investigated and reported in 30 selected clinical trial studies. From these studies, 38 effect sizes (SMD) were extracted and combined. The results of the meta-analysis showed that, in general, vitamin D consumption increases the average HDL by 0.13 (SMD: 0.13; 95% CI: 0.04, 0.29; Isquare: 79.33%; p value < 0.001) (Table 4).
Table 4.
The overall effect of vitamin D supplement on the HDL and LDL in patients with diabetes based on continent, age, BMI, diabetes duration, dose of intervention, and follow-up duration.
| Variables | Category | No. study | Pooled MSD (95% CI) | Heterogeneity assessment between studies | Heterogeneity assessment between subgroup | Publication bias assessments | ||||||
|---|---|---|---|---|---|---|---|---|---|---|---|---|
| I 2 | p value | Q | Q | p value | β | SE | p value | |||||
| HDL | Overall SMD | 30 (38) | 0.13 (0.04–0.29) | 79.33% | ≤0.001 | 179.01 | — | — | −0.22 | 1.084 | 0.840 | |
| Continent | Europe | 7 (13) | 0.07 (0.01–0.13) | 0.00% | 0.51 | 11.23 | 5.21 | 0.07 | ||||
| Asia | 22 (23) | 0.16 (0.11–0.42) | 84.00% | ≤0.001 | 137.51 | |||||||
| America | 1 (2) | 0.59 (0.12–1.30) | 87.39% | ≤0.001 | 7.93 | |||||||
| Age | <60 | 18 (20) | 0.10 (0.04–0.17) | 71.68% | ≤0.001 | 67.09 | 7.86 | 0.01 | ||||
| >60 | 12 (18) | 0.37 (0.12–0.61) | 78.09% | ≤0.001 | 77.58 | |||||||
| BMI | <30 | 19 (24) | 0.19 (0.02–0.41) | 77.81% | ≤0.001 | 103.64 | 0.94 | 0.33 | ||||
| >30 | 10 (13) | 0.01 (−0.30 to 0.31) | 84.06% | ≤0.001 | 75.29 | |||||||
| Disease duration | <10 | 10 (12) | 0.12 (−0.22 to 0.46) | 83.85% | ≤0.001 | 68.12 | — | — | ||||
| Intervention | <50,000 | 15 (21) | 0.15 (0.09–0.39) | 81.19% | ≤0.001 | 106.32 | 0.10 | 0.95 | ||||
| 50,000–100,000 | 14 (16) | 0.10 (0.03–0.35) | 79.28% | ≤0.001 | 72.40 | |||||||
| >100,000 | 1 (1) | 0.12 (0.06–0.44) | — | — | — | |||||||
| Follow-up duration | 8 weeks | 6 (6) | 0.10 (0.03–0.30) | 0.00% | 0.46 | 4.65 | 8.54 | 0.13 | ||||
| 12 weeks | 11 (11) | 0.11 (0.05–0.28) | 19.17% | 0.26 | 12.37 | |||||||
| 16 weeks | 5 (5) | 0.53 (0.33–1.19) | 87.65% | ≤0.001 | 32.40 | |||||||
| 24 weeks | 12 (12) | 0.31 (0.04–0.67) | 84.86% | ≤0.001 | 72.67 | |||||||
| 36 weeks | 1 (1) | 0.32 (0.40–1.04) | — | — | — | |||||||
| 48 weeks | 3 (3) | 0.43 (0.25–1.11) | 78.71% | 0.01 | 9.39 | |||||||
|
| ||||||||||||
| LDL | Overall SMD | 27 (34) | −0.11 (−0.28 to −0.05) | 73.66% | ≤0.001 | 125.15 | — | — | −2.68 | 1.015 | 0.008 | |
| Continent | Europe | 20 (21) | 0.00 (−0.20 to 0.20) | 37.04% | 0.10 | 15.88 | 1.08 | 0.58 | ||||
| Asia | 6 (11) | −0.16 (−0.38 to 0.07) | 76.85% | ≤0.001 | 86.41 | |||||||
| America | 1 (2) | 0.01 (−1.11 to 1.12) | 94.92% | ≤0.001 | 19.68 | |||||||
| Age | <60 | 16 (17) | −0.07 (−0.21 to 0.07) | 28.81% | 0.13 | 22.48 | 0.38 | 0.54 | ||||
| >60 | 11 (17) | −0.17 (−0.47 to 0.13) | 84.43% | ≤0.001 | 102.79 | |||||||
| BMI | <30 | 17 (21) | −0.16 (−0.41 to 0.09) | 77.04% | ≤0.001 | 87.11 | 0.37 | 0.54 | ||||
| >30 | 9 (12) | −0.05 (−0.28 to 0.17) | 68.88% | ≤0.001 | 35.35 | |||||||
| Disease duration | <10 | 9 (11) | −0.32 (−0.72 to 0.09) | 87.60% | ≤0.001 | 80.62 | — | — | ||||
| Intervention | <50,000 | 14 (19) | −0.23 (−0.52 to −0.06) | 82.19% | ≤0.001 | 101.09 | 2.10 | 0.15 | ||||
| 50,000–100,000 | 13 (15) | 0.01 (−0.13 to 0.15) | 30.75% | 0.12 | 20.22 | |||||||
| Follow-up duration | 8 weeks | 5 (5) | −0.02 (−0.27 to 0.24) | 32.52% | 0.20 | 5.93 | 9.48 | 0.09 | ||||
| 12 weeks | 11 (11) | −0.17 (−0.40, −0.07) | 56.46% | 0.01 | 22.97 | |||||||
| 16 weeks | 3 (3) | 0.18 (−0.13, 0.49) | 0.00% | 0.62 | 0.95 | |||||||
| 24 weeks | 11 (11) | −0.26 (−0.64, −0.13) | 86.61% | ≤0.001 | 74.67 | |||||||
| 36 weeks | 1 (1) | −0.04 (−0.76, −0.67) | — | — | — | |||||||
| 48 weeks | 3 (3) | 0.37 (0.03–0.71) | 23.83% | 0.27 | 2.63 | |||||||
Based on the continent, patients' age, and BMI, the results of subgroup analyses showed that this effect in patients with diabetes living in America (SMD: 0.59; 95% CI: 0.12, 1.30; Isquare: 87.39%; p value < 0.001), age over 60 years (SMD: 0.37; 95% CI: 0.12, 0.61; Isquare: 78.09%; p value < 0.001), and BMI less than 30 years (SMD: 0.19; 95% CI: 0.02, 0.41; Isquare: 77.81%; p value < 0.001) is more and more significant. Based on different doses of vitamin D, the results showed that the consumption of vitamin D of fewer than 50,000 IU has a more significant effect on increasing the average HDL (SMD: 0.15; 95% CI: 0.09, 0.39; Isquare: 81.19%;p value < 0.001). Also, the follow-up for 16 weeks after the intervention (SMD: 0.53; 95% CI: 0.33, 1.19; Isquare: 87.65%; p value < 0.001) has shown better the effect of vitamin D on reducing the average HDL (Table 4).
Metaregression analysis to determine the effect of age variables and BMI on the vitamin D supplementation effect on mean HDL showed that with age increasing (β: 0.08; SE: 0.02; 95% CI: 0.01, 0.13; p: <0.001), the effect of vitamin D on average HDL increases, while this effect with increasing BMI (β: −0.06; SE: 0.03; 95% CI: −0.12, −0.01; p: 0.04) decreases. Egger's test analyses for checking publication bias showed that this bias did not occur in the overall analysis of determining the effect of vitamin D on mean SBP (β: −0.22; SE: 1.08; p: 0.84) (Figure 2).
3.5. LDL
Twenty-seven clinical trial studies with 34 effect sizes (SMD) were included in the analysis related to determining the effect of vitamin D consumption on mean LDL. The results of the meta-analysis showed that the consumption of vitamin D reduces the mean LDL to 0.11 (SMD: −0.11; 95% CI: −0.28, −0.05; Isquare: 73.66%; p value < 0.001) (Table 4).
Subgroup analyses based on age, BMI, duration of diabetes, different doses of vitamin D, and duration of follow-up are shown in Table 2. Based on the different doses of vitamin D and the duration of follow-up, the results showed that a dose of fewer than 50,000 IU (SMD: −0.23; 95% CI: −0.52, −0.06; Isquare: 82.19%; p value < 0.001) and a follow-up period of 24 weeks after taking vitamin D (SMD: −0.26; 95% CI: −0.64, −0.13; Isquare: 86.61%; p value < 0.001) show the effect of this vitamin on reducing the average LDL better (Table 4).
The metaregression analysis for determining the effect of age variables and BMI on the effect of vitamin D supplementation on mean LDL showed that with age increasing (β: 0.03; SE: 0.01; 95% CI: −0.01, 0.09; p: 0.581) in patients, the effect of vitamin D on the mean LDL increases, while this effect decreases with increasing BMI (β: −0.01; SE: 0.00; 95% CI: −0.02, 0.00; p: 0.167). Egger's test analyses for checking publication bias showed that this bias occurred in the overall analysis of determining the effect of vitamin D on mean SBP (β: −2.68; SE: 1.01; p: <0.001) (Figure 2).
3.6. Vitamin D
In another part of the present meta-analysis results, the average level of vitamin D in the body of individuals with diabetes was measured and analyzed before and after taking vitamin D supplements. In this analysis, the SMD of the average level of vitamin D in the body in two groups receiving vitamin D supplements and placebo was calculated and combined. Finally, the result of the meta-analysis showed that the average level of vitamin D in the body increased by 1.78 IU (SMD: 1.78; 95% CI: 1.53, 2.04; Isquare: 91.92%; p value < 0.001) (Table 5).
Table 5.
The overall effect of vitamin D supplement on the vitamin D level in patients with diabetes based on continent, age, BMI, diabetes duration, dose of intervention, and follow-up duration.
| Variables | Category | No. study | Pooled MSD (95% CI) | Heterogeneity assessment between studies | Heterogeneity assessment between subgroup | Publication bias assessments | ||||||
|---|---|---|---|---|---|---|---|---|---|---|---|---|
| I 2 | p value | Q | Q | p value | β | SE | p value | |||||
| VIT D | Overall SMD | 48 (59) | 1.78 (1.53–2.04) | 91.92% | ≤0.001 | 718.6 | — | — | 8.12 | 0.760 | ≤0.001 | |
| Continent | Europe | 9 (16) | 1.10 (0.85–1.36) | 71.05% | ≤0.001 | 51.81 | 18.53 | ≤0.001 | ||||
| Asia | 39 (43) | 2.05 (1.70–2.40) | 93.48% | ≤0.001 | 644.13 | |||||||
| Age | <60 | 33 (35) | 1.86 (1.51–2.22) | 91.71% | ≤0.001 | 410.18 | 3.73 | 0.05 | ||||
| >60 | 13 (19) | 1.38 (1.05–1.72) | 87.23% | ≤0.001 | 140.96 | |||||||
| BMI | <30 | 25 (30) | 1.83 (1.45–2.21) | 92.35% | ≤0.001 | 379.13 | 0.54 | 0.46 | ||||
| >30 | 13 (18) | 1.62 (1.22–2.02) | 88.85% | ≤0.001 | 152.52 | |||||||
| Disease duration | <10 | 18 (20) | 2.00 (1.57–2.42) | 91.70% | ≤0.001 | 229.01 | 8.71 | ≤0.001 | ||||
| >10 | 1 (2) | 0.92 (0.35–1.50) | 52.24% | 0.15 | 2.09 | |||||||
| Intervention | <50,000 | 15 (18) | 2.36 (1.73–2.99) | 94.62% | ≤0.001 | 315.72 | 29.76 | ≤0.001 | ||||
| 50,000–100,000 | 27 (31) | 1.78 (1.46–2.09) | 91.09% | ≤0.001 | 336.73 | |||||||
| >100,000 | 7 (10) | 0.86 (0.59–1.13) | 45.26% | 0.06 | 16.44 | |||||||
| Follow-up duration | 4 weeks | 1 (1) | 2.42 (1.42–3.41) | — | — | — | 41.82 | ≤0.001 | ||||
| 8 weeks | 11 (12) | 1.48 (1.08–1.88) | 84.02% | ≤0.001 | 68.82 | |||||||
| 12 weeks | 22 (23) | 2.15 (1.64–2.67) | 94.18% | ≤0.001 | 377.92 | |||||||
| 14 weeks | 1 (1) | 3.03 (2.23–3.84) | — | — | — | |||||||
| 16 weeks | 6 (6) | 1.26 (0.53–1.99) | 87.56% | ≤0.001 | 40.19 | |||||||
| 24 weeks | 15 (15) | 1.85 (1.36–2.33) | 92.73% | ≤0.001 | 192.62 | |||||||
| 48 weeks | 1 (1) | 0.27 (−0.30 to 0.85) | — | — | — | |||||||
Based on subgroup analyses, the average vitamin D level after taking vitamin D supplements in patients with diabetes, living in Asia, less than 60 years old, BMI less than 30, and length of diabetes of less than 10 years is higher. Also, the dose of 50,000 IU of vitamin D supplement had a greater effect on increasing the vitamin D level in the body than other doses (Table 5). Metaregression analysis to determine the effect of age and BMI variables on the effect of vitamin D supplementation on average vitamin D showed that with age increasing (β: −0.04; SE: 0.02; 95% CI: −0.09, −0.01; p: <0.001) and BMI increasing (β: −0.05; SE: 0.04; 95% CI: −0.22, −0.01; p: 0.02), this effect decreases. Egger's test analyses to check publication bias showed that this bias occurred in the overall analysis of determining the effect of vitamin D on mean SBP (β: 8.12; SE: 0.76; p: <0.001) (Figure 2).
3.7. Risk of Bias
Figure 3 provides a visual representation of the results of the RoB 2 assessment conducted in this study. The figure presents a comprehensive overview of the risk of bias for each included study, including the domains of bias assessed and the corresponding judgments. Overall, the results of the RoB 2 assessment highlight the methodological quality of the included studies and provide a framework for the interpretation of the findings presented in this meta-analysis (Figure 3). Also, the results of the quality assessment based on GRADE indicate that the overall quality of results for various outcomes in this meta-analysis is at a level of moderate to high. This signifies the adequate quality of the calculated and reported results in this meta-analysis (Table S2).
Figure 3.
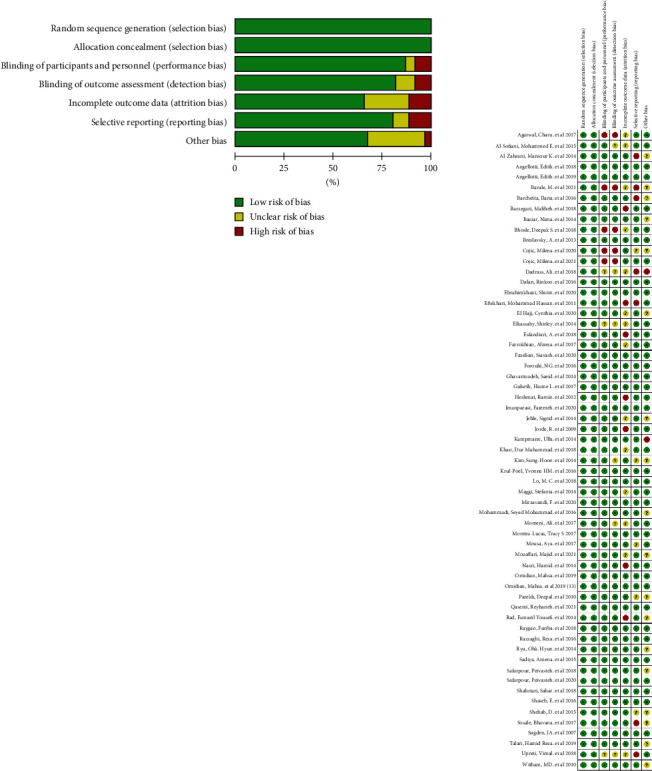
Risk of bias graph and summary (review authors' judgments about each risk of bias item presented as percentages across all included studies).
4. Discussion
The main goal of this meta-analysis was to determine the effect of vitamin D supplementation on patients with T2DM. The results showed that vitamin D supplementation has a significant effect on diabetes control and the reduction of blood pressure and blood lipid indicators in patients with T2DM. The average indices of HbA1C and FBS have decreased by 0.15 and 0.28, respectively, in patients with T2DM who take vitamin D supplements. The most common complications of individuals with diabetes are cardiovascular problems, and research results have shown the importance of vitamin D deficiency in the prevalence of CVD, and they have confirmed that this vitamin is a therapeutic or preventive factor in T2DM. Vitamin D is one of those fat-soluble vitamins that can be stored in the body, and its excessive consumption can cause complications such as calcium deposition in the kidneys, lungs, heart, and ears; bone pain; loss of appetite and nausea; increased urine volume; constipation; kidney disorders; and even poisoning [29]. Therefore, despite all the benefits of vitamin D, excessive use of this vitamin can have an adverse effect on human health. Vitamin D deficiency is associated with increased BMI, higher blood pressure, high triglycerides, and insulin resistance, all of which predispose a person to T2DM. The important point is that receiving optimal amounts of vitamin D affects the prevention or control of diabetes, and its excessive consumption is associated with serious complications [30–33]. Vitamin D receptors are present in almost every cell of the body, which indicates the important role of this vitamin in the body's chemical processes and the reduction of HbA1C and FBS indices [29, 34]. HbA1C is caused by the continuous, slow glycosylation of nonenzymatic hemoglobin caused by hyperglycemia. A prospective study of diabetes in England showed that HbA1C is a gold standard for evaluating blood sugar control in T2DM, and in addition, reducing its value by 1% can lead to a 14% reduction in the occurrence of previous vascular diseases [35, 36]. George, Pearson, and Witham conducted a meta-analysis to evaluate the effect of vitamin D on blood glucose control and insulin resistance, the results of which showed that vitamin D leads to a small improvement in fasting plasma glucose (FBG) and insulin resistance, but no beneficial effect on HbA1C was observed [37]. The results of the present meta-analysis showed that vitamin D supplementation prevents the increase of plasma HbA1C, which indicates that the effect of vitamin D is to reduce or delay the occurrence and development of diabetes complications. These conflicting results may be due to the increase in studies and the more detailed and updated analysis of the present meta-analysis. In 2019, researchers conducted a meta-analysis of intervention trials and discovered that vitamin D supplementation reduced FBG but had variable effects on insulin secretion and HbA1C [38]. Another meta-analysis discovered that vitamin D supplementation dramatically reduced HbA1C levels, potentially delaying or preventing diabetic consequences. However, the same study discovered that the positive effects of vitamin D may be confined to vitamin D–deficient people [39]. A 2023 systematic review and meta-analysis suggest that vitamin D may improve FPG, HbA1C, and homeostasis model assessment-insulin resistance (HOMA-IR) in people with T2DM. In addition, a 2021 meta-analysis showed that vitamin D supplementation improved fasting insulin levels [40, 41]. A variety of factors, including study population characteristics, vitamin D levels utilized, and evidence quality, could explain the contradictory findings on vitamin D's impact on blood glucose management and insulin resistance in T2DM and prediabetes.
In the last decade, vitamin D deficiency in T2DM and serum level of 25-hydroxyvitamin D have been considered predictors of long-term complications of diabetes such as CVD. This vitamin plays a significant role in regulating the function of pancreatic beta cells (insulin-secreting cells in the pancreas). In T2DM, the beta cells try to produce more insulin because there is resistance to insulin in other tissues of the body, and this hormone cannot have the necessary function. Among the most important factors that cause insulin resistance are overweight, lack of physical activity, high abdominal fat, and genetic background [42–45]. The results of the current meta-analysis indicate that as BMI decreases, the impact of vitamin D supplementation on reducing HbA1C and FBS indices becomes more pronounced. This finding supports the hypothesis of a negative correlation between weight gain and insulin resistance, suggesting that vitamin D supplementation or maintaining sufficient levels of vitamin D in individuals with T2DM may mitigate the development of insulin resistance. However, it is worth noting that further investigation is warranted to explore whether the effectiveness of vitamin D supplementation in reducing HbA1C and FBS indices diminishes with weight gain. Additional studies with adequate sample sizes are needed to address this hypothesis comprehensively.
Vitamin D deficiency increases the level of LDL and ultimately increases the risk of CVD in patients with T2DM. Therefore, it can be said that vitamin D deficiency can increase the complications of diabetes, especially CVD, and ultimately increase death and the direct and indirect health costs of the disease [46–49]. The results of the present meta-analysis showed that vitamin D supplementation can significantly reduce SBP and LDL levels in patients with T2DM. Therefore, it can be claimed that its consumption can be effective in preventing serious complications of T2DM such as CVD.
Several meta-analyses have been conducted to assess the effect of vitamin D in different forms, such as supplements or prescription medicines, and at different doses, on glycemic control. However, it is important to emphasize that most of these trials have focused on people with prediabetes, and few trials have been conducted in more diverse populations. These meta-analyses provide information about the potential effects of vitamin D on glycemic control and the prevention of T2DM. However, they highlight the need for more high-quality research to address the limitations and inconsistencies in the existing evidence. In the subgroup analyses, the meta-analysis results showed that the effect of vitamin D supplementation is affected by increasing age, BMI, and the duration of diabetes, and there may be a significant effect like its effect in patients with T2DM. With an age of less than 60 years, a BMI of less than 30, and the duration of diabetes not less than 10 years. The reason for this can be the increase in the body's resistance to vitamin D supplementation or the interference of judgment in old age due to the use of other drugs to prevent important and chronic diseases of old age. Another point is that in subgroup analyses, the amount of heterogeneity has decreased significantly in some subgroups.
In the present meta-analysis, the level of vitamin D in the body increased significantly after the use of vitamin D supplements in patients with T2DM. Subgroup analyses related to this analysis also showed that this average was higher in patients living in Asia, less than 60 years old, BMI of less than 30, and duration of diabetes of fewer than 10 years. Also, the dose of 50,000 IU of vitamin D supplement had a greater effect on increasing the level of vitamin D in the body than other doses. One of the strengths of this meta-analysis compared to previous meta-analyses was the calculation of the average level of vitamin D in the body after taking vitamin D supplements in patients with T2DM, which can confirm the increase in the level of vitamin D in the body after using the supplement and then reduce complications related to T2DM. Vitamin D is actually a preventative measure and chemically is considered a steroid hormone. The fact that insulin is also a hormone convinces some experts that there is a relationship between insulin and vitamin D, and it also seems that many people with low vitamin D levels also develop general immunodeficiency, which can increase their incidence of diabetes and other diseases. Other strengths of this study include the large number of studies included in the analysis and the accuracy of the reported estimates. It also performed subgroup analyses based on important variables such as vitamin D dose, duration of diabetes, and duration of follow-up after the intervention. Among the weaknesses of the present meta-analysis, we can point out the lack of analysis of other indicators related to diabetes, such as DBP, ethnicity, and HOMA-IR, which was due to the lack of full reporting of these indicators in selected studies. It is recommended that in future intervention studies regarding the impact of vitamin use on blood glucose control, race be considered as the primary variable for conducting subgroup analyses.
5. Conclusion
The findings of this meta-analysis suggest that vitamin D supplementation can significantly decrease indicators related to T2DM and, subsequently, reduce the risk of complications, particularly CVDs. Therefore, the adoption of a care program aimed at T2DM prevention and management could include supplemental vitamin D consumption, dietary intake, or other methods such as regular sun exposure. Furthermore, vitamin D could be considered as a potential addition to treatment guidelines for patients with T2DM. The combined evidence presented in this study highlights the significant potential of vitamin D as a preventive and therapeutic intervention for T2DM and its associated complications.
Acknowledgments
The authors have nothing to report.
Contributor Information
Yousef Moradi, Email: yousefmoradi211@yahoo.com.
Farhad Moradpour, Email: farhadmepid@muk.ac.ir, farhadmepid@yahoo.com.
Data Availability Statement
The datasets used during and/or analyzed during the current study are available from the corresponding authors on reasonable request.
Ethics Statement
The authors have nothing to report.
Consent
The authors have nothing to report.
Conflicts of Interest
The authors declare no conflicts of interest.
Author Contributions
Conceptualization: Y.M.. Methodology: Y.M., M.A., and F.M. Data screening: M.A., P.K., L.M., P.B., K.Z., and L.S. Data extraction: S.K., H.M.B., P.K., and F.M. Quality assessment: F.M. and Y.M. Formal analysis: Y.M. Writing—original draft preparation: F.M., B.P., S.K., M.A., and H.M.B. Writing—review and editing: all authors. Supervision: Y.M. Project administration: Y.M. All authors have read and agreed to the final version of the manuscript. M.A.: co-first author.
Funding
The authors received no specific funding for this work.
Supporting Information
Additional supporting information can be found online in the Supporting Information section. Supporting Information details the search queries used to identify relevant studies, incorporating various keywords and MeSH terms across databases. The GRADE assessment indicates moderate to high confidence in the evidence, suggesting that vitamin D supplementation may significantly improve glycemic control and cardiovascular risk factors in T2DM patients.
References
- 1.Mahmoudi-Aznaveh A., Tavoosidana G., Najmabadi H., Azizi Z., Ardestani A. The liver-derived exosomes stimulate insulin gene expression in pancreatic beta cells under condition of insulin resistance. Frontiers in Endocrinology . 2023;14, article 1303930 doi: 10.3389/fendo.2023.1303930. [DOI] [PMC free article] [PubMed] [Google Scholar]
- 2.Khan M. A. B., Hashim M. J., King J. K., Govender R. D., Mustafa H., Al K. J. Epidemiology of type 2 diabetes–global burden of disease and forecasted trends. Journal of Epidemiology and Global Health . 2020;10(1):107–111. doi: 10.2991/jegh.k.191028.001. [DOI] [PMC free article] [PubMed] [Google Scholar]
- 3.Knowler W. C., Crandall J. P. Pharmacologic randomized clinical trials in prevention of type 2 diabetes. Current Diabetes Reports . 2019;19:1–9. doi: 10.1007/s11892-019-1268-5. [DOI] [PubMed] [Google Scholar]
- 4.Galicia-Garcia U., Benito-Vicente A., Jebari S., et al. Pathophysiology of type 2 diabetes mellitus. International Journal of Molecular Sciences . 2020;21(17):p. 6275. doi: 10.3390/ijms21176275. [DOI] [PMC free article] [PubMed] [Google Scholar]
- 5.Højlund K. Metabolism and insulin signaling in common metabolic disorders and inherited insulin resistance. Danish Medical Journal . 2014;61(7):p. B4890. [PubMed] [Google Scholar]
- 6.Cade W. T. Diabetes-related microvascular and macrovascular diseases in the physical therapy setting. Physical Therapy . 2008;88(11):1322–1335. doi: 10.2522/ptj.20080008. [DOI] [PMC free article] [PubMed] [Google Scholar]
- 7.Association AD. Good to know: diabetes symptoms and tests. Clinical Diabetes . 2020;38(1):p. 108. doi: 10.2337/cd20-pe01. [DOI] [PMC free article] [PubMed] [Google Scholar]
- 8.Cavan D. Why screen for type 2 diabetes? Diabetes Research and Clinical Practice . 2016;121:215–217. doi: 10.1016/j.diabres.2016.11.004. [DOI] [PubMed] [Google Scholar]
- 9.Lawrence J., Robinson A. Screening for diabetes in general practice. Preventive Cardiology . 2003;6(2):78–84. doi: 10.1111/j.1520-037x.2003.01662.x. [DOI] [PubMed] [Google Scholar]
- 10.American Diabetes Association Professional Practice Committee. 7. Diabetes technology: standards of medical care in diabetes-2022. Diabetes Care . 2022;45(Supplement_1):S97–S112. doi: 10.2337/dc22-S007. [DOI] [PubMed] [Google Scholar]
- 11.Committee ADAPP. 2. Classification and diagnosis of Diabetes:Standards of medical care in diabetes—2022. Diabetes Care . 2022;45(Supplement_1):S17–S38. doi: 10.2337/dc22-S002. [DOI] [PubMed] [Google Scholar]
- 12.Care D. 2. Classification and Diagnosis of Diabetes:Standards of Medical Care in Diabetes—2022. Diabetes Care . 2022;45(Supplement_1):S17–S38. doi: 10.2337/dc22-S002. [DOI] [PubMed] [Google Scholar]
- 13.Ruiz-Burneo L., Merino-Rivera J. A., Bernabé-Ortiz A. Type 2 diabetes mellitus and sleep characteristics: a population-based study in Tumbes, Peru. Revista Peruana de Medicina Experimental y Salud Pública . 2022;39(1):55–64. doi: 10.17843/rpmesp.2022.391.10755. [DOI] [PMC free article] [PubMed] [Google Scholar]
- 14.Podd D. Hypovitaminosis D: a common deficiency with pervasive consequences. JAAPA . 2015;28(2):20–26. doi: 10.1097/01.JAA.0000459810.95512.14. [DOI] [PubMed] [Google Scholar]
- 15.Tort A. R., Mercado E. A. M., Cuazitl A. M., Nieto A. V. P., Pérez R. A. R. La deficiencia de vitamina D es un factor de riesgo de mortalidad en pacientes con COVID-19. Revista de Sanidad Militar . 2020;74(1):106–113. doi: 10.56443/rsm.v74i1.1. [DOI] [Google Scholar]
- 16.López D. F., Ríos-Borrás V., Rivera D. A., Hernández L. R., Ortiz M. A. Vitamina D: una estrategia profiláctica en tiempos del SARS-CoV-2. Vitamina D, SARS-CoV-2 y odontología. Acta Odontológica Colombiana . 2020;10((Supl.COVID–19)) doi: 10.15446/aoc.v10n3.87991. [DOI] [Google Scholar]
- 17.Khan D. M., Jamil A., Randhawa F. A., Butt N. F., Malik U. Efficacy of oral vitamin D on glycated haemoglobin (HbA1c) in type 2 diabetics having vitamin D deficiency-a randomized controlled trial. The Journal of the Pakistan Medical Association . 2018;68(5):694–697. [PubMed] [Google Scholar]
- 18.Bhosle D. S., Mubeen M. F. Evaluation of effect of vitamin D supplementation on glycemic control in patients of type 2 diabetes mellitus. Journal of Diabetes & Metabolism . 2018;9(806):p. 2. [Google Scholar]
- 19.Alemzadeh R., Kichler J., Babar G., Calhoun M. Hypovitaminosis D in obese children and adolescents: relationship with adiposity, insulin sensitivity, ethnicity, and season. Metabolism . 2008;57(2):183–191. doi: 10.1016/j.metabol.2007.08.023. [DOI] [PubMed] [Google Scholar]
- 20.Jehle S., Lardi A., Felix B., Hulter H. N., Stettler C., Krapf R. Effect of large doses of parenteral vitamin D on glycaemic control and calcium/phosphate metabolism in patients with stable type 2 diabetes mellitus: a randomised, placebo-controlled, prospective pilot study. Swiss Medical Weekly . 2014;144(1112) doi: 10.4414/smw.2014.13942. [DOI] [PubMed] [Google Scholar]
- 21.Omidian M., Djalali M., Javanbakht M. H., et al. Effects of vitamin D supplementation on advanced glycation end products signaling pathway in T2DM patients: a randomized, placebo-controlled, double blind clinical trial. Diabetology & Metabolic Syndrome . 2019;11(1):1–9. doi: 10.1186/s13098-019-0479-x. [DOI] [PMC free article] [PubMed] [Google Scholar]
- 22.Al-Sofiani M. E., Jammah A., Racz M., et al. Effect of vitamin D supplementation on glucose control and inflammatory response in type II diabetes: a double blind, randomized clinical trial. International Journal of Endocrinology and Metabolism . 2015;13(1, article e22604) doi: 10.5812/ijem.22604. [DOI] [PMC free article] [PubMed] [Google Scholar]
- 23.Upreti V., Maitri V., Dhull P., Handa A., Prakash M., Behl A. Effect of oral vitamin D supplementation on glycemic control in patients with type 2 diabetes mellitus with coexisting hypovitaminosis D: a parellel group placebo controlled randomized controlled pilot study. Diabetes & Metabolic Syndrome: Clinical Research & Reviews . 2018;12(4):509–512. doi: 10.1016/j.dsx.2018.03.008. [DOI] [PubMed] [Google Scholar]
- 24.El Hajj C., Walrand S., Helou M., Yammine K. Effect of vitamin D supplementation on inflammatory markers in non-obese Lebanese patients with type 2 diabetes: a randomized controlled trial. Nutrients . 2020;12(7):p. 2033. doi: 10.3390/nu12072033. [DOI] [PMC free article] [PubMed] [Google Scholar]
- 25.Payne J. F., Ray R., Watson D. G., et al. Vitamin D insufficiency in diabetic retinopathy. Endocrine Practice . 2012;18(2):185–193. doi: 10.4158/EP11147.OR. [DOI] [PMC free article] [PubMed] [Google Scholar]
- 26.Derakhshanian H., Djazayery A., Javanbakht M. H., et al. The effect of vitamin D on cellular pathways of diabetic nephropathy. Reports of Biochemistry & Molecular Biology . 2019;7(2):217–222. [PMC free article] [PubMed] [Google Scholar]
- 27.Parums D. V. Editorial: Review articles, systematic reviews, meta-analysis, and the updated preferred reporting items for systematic reviews and meta-analyses (PRISMA) 2020 guidelines. Medical Science Monitor: International Medical Journal of Experimental and Clinical Research . 2021;27, article e934475 doi: 10.12659/MSM.934475. [DOI] [PMC free article] [PubMed] [Google Scholar]
- 28.Higgins J. P., Savović J., Page M. J., Elbers R. G., Sterne J. A. Cochrane handbook for systematic reviews of interventions . Wiley; 2019. Assessing risk of bias in a randomized trial; pp. 205–228. [DOI] [Google Scholar]
- 29.Krul-Poel Y. H., Westra S., ten Boekel E., et al. Effect of vitamin D supplementation on glycemic control in patients with type 2 diabetes (SUNNY trial): a randomized placebo-controlled trial. Diabetes Care . 2015;38(8):1420–1426. doi: 10.2337/dc15-0323. [DOI] [PubMed] [Google Scholar]
- 30.Nigil Haroon N., Anton A., John J., Mittal M. Effect of vitamin D supplementation on glycemic control in patients with type 2 diabetes: a systematic review of interventional studies. Journal of Diabetes & Metabolic Disorders . 2015;14(1):1–11. doi: 10.1186/s40200-015-0130-9. [DOI] [PMC free article] [PubMed] [Google Scholar]
- 31.Wu C., Qiu S., Zhu X., Li L. Vitamin D supplementation and glycemic control in type 2 diabetes patients: a systematic review and meta-analysis. Metabolism . 2017;73:67–76. doi: 10.1016/j.metabol.2017.05.006. [DOI] [PubMed] [Google Scholar]
- 32.Lee C. J., Iyer G., Liu Y., et al. The effect of vitamin D supplementation on glucose metabolism in type 2 diabetes mellitus: a systematic review and meta-analysis of intervention studies. Journal of Diabetes and its Complications . 2017;31(7):1115–1126. doi: 10.1016/j.jdiacomp.2017.04.019. [DOI] [PMC free article] [PubMed] [Google Scholar]
- 33.Group UPDS. Effect of intensive blood-glucose control with metformin on complications in overweight patients with type 2 diabetes (UKPDS 34) The Lancet . 1998;352(9131):854–865. doi: 10.1016/S0140-6736(98)07037-8. [DOI] [PubMed] [Google Scholar]
- 34.Poolsup N., Suksomboon N., Plordplong N. Effect of vitamin D supplementation on insulin resistance and glycaemic control in prediabetes: a systematic review and meta-analysis. Diabetic Medicine . 2016;33(3):290–299. doi: 10.1111/dme.12893. [DOI] [PubMed] [Google Scholar]
- 35.Vijan S., Sussman J. B., Yudkin J. S., Hayward R. A. Effect of patients’ risks and preferences on health gains with plasma glucose level lowering in type 2 diabetes mellitus. JAMA Internal Medicine . 2014;174(8):1227–1234. doi: 10.1001/jamainternmed.2014.2894. [DOI] [PMC free article] [PubMed] [Google Scholar]
- 36.Eto T., Inoue S., Kadowaki T. Effects of once-daily teneligliptin on 24-h blood glucose control and safety in Japanese patients with type 2 diabetes mellitus: a 4-week, randomized, double-blind, placebo-controlled trial. Diabetes, Obesity & Metabolism . 2012;14(11):1040–1046. doi: 10.1111/j.1463-1326.2012.01662.x. [DOI] [PubMed] [Google Scholar]
- 37.George P., Pearson E., Witham M. Effect of vitamin D supplementation on glycaemic control and insulin resistance: a systematic review and meta-analysis. Diabetic Medicine . 2012;29(8):e142–e150. doi: 10.1111/j.1464-5491.2012.03672.x. [DOI] [PubMed] [Google Scholar]
- 38.Hu Z., Chen J., Sun X., Wang L., Wang A. Efficacy of vitamin D supplementation on glycemic control in type 2 diabetes patients: a meta-analysis of interventional studies. Medicine . 2019;98(14, article e14970) doi: 10.1097/MD.0000000000014970. [DOI] [PMC free article] [PubMed] [Google Scholar]
- 39.Musazadeh V., Kavyani Z., Mirhosseini N., Dehghan P., Vajdi M. Effect of vitamin D supplementation on type 2 diabetes biomarkers: an umbrella of interventional meta-analyses. Diabetology & Metabolic Syndrome . 2023;15(1):p. 76. doi: 10.1186/s13098-023-01010-3. [DOI] [PMC free article] [PubMed] [Google Scholar]
- 40.Kazemi A., Ryul Shim S., Jamali N., et al. Comparison of nutritional supplements for glycemic control in type 2 diabetes: A systematic review and network meta-analysis of randomized trials. Diabetes Research and Clinical Practice . 2022;191, article 110037 doi: 10.1016/j.diabres.2022.110037. [DOI] [PubMed] [Google Scholar]
- 41.Zhang Y., Xue Y., Zhang D., et al. Effect of vitamin D supplementation on glycemic control in prediabetes: a meta-analysis. Nutrients . 2021;13(12):p. 4464. doi: 10.3390/nu13124464. [DOI] [PMC free article] [PubMed] [Google Scholar]
- 42.Farahmand M. A., Daneshzad E., Fung T. T., et al. What is the impact of vitamin D supplementation on glycemic control in people with type-2 diabetes: a systematic review and meta-analysis of randomized controlled trails. BMC Endocrine Disorders . 2023;23(1):p. 15. doi: 10.1186/s12902-022-01209-x. [DOI] [PMC free article] [PubMed] [Google Scholar]
- 43.Hu Z., Zhi X., Li J., et al. Effects of long-term vitamin D supplementation on metabolic profile in middle-aged and elderly patients with type 2 diabetes. The Journal of Steroid Biochemistry and Molecular Biology . 2023;225, article 106198 doi: 10.1016/j.jsbmb.2022.106198. [DOI] [PubMed] [Google Scholar]
- 44.Asbaghi O., Nazarian B., Yousefi M., Anjom-Shoae J., Rasekhi H., Sadeghi O. Effect of vitamin E intake on glycemic control and insulin resistance in diabetic patients: an updated systematic review and meta-analysis of randomized controlled trials. Nutrition Journal . 2023;22(1):1–22. doi: 10.1186/s12937-023-00840-1. [DOI] [PMC free article] [PubMed] [Google Scholar]
- 45.Salarinia M., Azizi M., Tahmasebi W., Khalvandi H. Effect of eight weeks of vitamin D supplementation and water-based exercise on cardiometabolic profile in women with type 2 diabetes. Science & Sports . 2023;38(3):283–292. doi: 10.1016/j.scispo.2022.04.008. [DOI] [Google Scholar]
- 46.Renke G., Starling-Soares B., Baesso T., Petronio R., Aguiar D., Paes R. Effects of vitamin D on cardiovascular risk and oxidative stress. Nutrients . 2023;15(3):p. 769. doi: 10.3390/nu15030769. [DOI] [PMC free article] [PubMed] [Google Scholar]
- 47.Elmoselhi A. B., Seif Allah M., Bouzid A., et al. Circulating microRNAs as potential biomarkers of early vascular damage in vitamin D deficiency, obese, and diabetic patients. PLoS One . 2023;18(3, article e0283608) doi: 10.1371/journal.pone.0283608. [DOI] [PMC free article] [PubMed] [Google Scholar]
- 48.Pieńkowska A., Janicka J., Duda M., et al. Controversial impact of vitamin D supplementation on reducing insulin resistance and prevention of type 2 diabetes in patients with prediabetes: a systematic review. Nutrients . 2023;15(4):p. 983. doi: 10.3390/nu15040983. [DOI] [PMC free article] [PubMed] [Google Scholar]
- 49.Sabico S., Wani K., Grant W. B., Al-Daghri N. M. Improved HDL cholesterol through vitamin D status correction substantially lowers 10-year atherosclerotic cardiovascular disease risk score in vitamin D-deficient Arab adults. Nutrients . 2023;15(3):p. 551. doi: 10.3390/nu15030551. [DOI] [PMC free article] [PubMed] [Google Scholar]
- 50.Barale M., Rossetto Giaccherino R., Ghigo E., Procopio M. Effect of 1-year oral cholecalciferol on a metabolic profile and blood pressure in poor-controlled type 2 diabetes mellitus: an open-label randomized controlled pilot study. Journal of Endocrinological Investigation . 2021;44(4):791–802. doi: 10.1007/s40618-020-01373-8. [DOI] [PubMed] [Google Scholar]
- 51.Cojic M., Kocic R., Klisic A., Kocic G. The effects of vitamin D supplementation on metabolic and oxidative stress markers in patients with type 2 diabetes: a 6-month follow up randomized controlled study. Frontiers in Endocrinology . 2021;12 doi: 10.3389/fendo.2021.610893. [DOI] [PMC free article] [PubMed] [Google Scholar]
- 52.Mozaffari M., Hajmoradi H., Moravveji A., Asgarian F. S., Noory P. The effect of vitamin D therapy on glycemic control and biochemical indices in type 2 diabetic patients: a randomized, clinical trial study. Physiology and Pharmacology . 2021;25(2):125–133. doi: 10.32598/ppj.25.2.100. [DOI] [Google Scholar]
- 53.Safarpour P., Daneshi-Maskooni M., Vafa M., et al. Vitamin D supplementation improves SIRT1, Irisin, and glucose indices in overweight or obese type 2 diabetic patients: a double-blind randomized placebo-controlled clinical trial. BMC Family Practice . 2020;21(1):1–10. doi: 10.1186/s12875-020-1096-3. [DOI] [PMC free article] [PubMed] [Google Scholar]
- 54.Angellotti E., D’Alessio D., Dawson-Hughes B., et al. Vitamin D supplementation in patients with type 2 diabetes: the vitamin D for established type 2 diabetes (DDM2) study. Journal of the Endocrine Society . 2018;2(4):310–321. doi: 10.1210/js.2018-00015. [DOI] [PMC free article] [PubMed] [Google Scholar]
- 55.Safarpour P., Vafa M. R., Amiri F., et al. A double blind randomized clinical trial to investigate the effect of vitamin D supplementation on metabolic and hepato-renal markers in type 2 diabetes and obesity. Medical Journal of the Islamic Republic of Iran . 2018;32(1):201–204. doi: 10.14196/mjiri.32.34. [DOI] [PMC free article] [PubMed] [Google Scholar]
- 56.Sosale B., Chandrashekara S., Aravind S. R., Renuka P., Anupama K. Influence of cytokine status on insulin resistance and circulating endothelial progenitor cells in type 2 diabetes mellitus. Cytokine . 2017;99:179–185. doi: 10.1016/j.cyto.2017.09.012. [DOI] [PubMed] [Google Scholar]
- 57.Angellotti E., D'Alessio D., Dawson-Hughes B., et al. Effect of vitamin D supplementation on cardiovascular risk in type 2 diabetes. Clinical Nutrition . 2019;38(5):2449–2453. doi: 10.1016/j.clnu.2018.10.003. [DOI] [PMC free article] [PubMed] [Google Scholar]
- 58.Esfandiari A., Gargari B. P., Noshad H., et al. The effects of vitamin D3 supplementation on some metabolic and inflammatory markers in diabetic nephropathy patients with marginal status of vitamin D: a randomized double blind placebo controlled clinical trial. Diabetes & Metabolic Syndrome: Clinical Research & Reviews . 2019;13(1):278–283. doi: 10.1016/j.dsx.2018.09.013. [DOI] [PubMed] [Google Scholar]
- 59.Omidian M., Mahmoudi M., Abshirini M., et al. Effects of vitamin D supplementation on depressive symptoms in type 2 diabetes mellitus patients: randomized placebo-controlled double-blind clinical trial. Diabetes & Metabolic Syndrome: Clinical Research & Reviews . 2019;13(4):2375–2380. doi: 10.1016/j.dsx.2019.06.011. [DOI] [PubMed] [Google Scholar]
- 60.Talari H. R., Najafi V., Raygan F., et al. Long-term vitamin D and high-dose n-3 fatty acids’ supplementation improve markers of cardiometabolic risk in type 2 diabetic patients with CHD. British Journal of Nutrition . 2019;122(4):423–430. doi: 10.1017/S0007114519001132. [DOI] [PubMed] [Google Scholar]
- 61.Cojic M., Kocic R., Klisic A., Cvejanov-Kezunovic L., Kavaric N., Kocic G. A novel mechanism of vitamin D anti-inflammatory/antioxidative potential in type 2 diabetic patients on metformin therapy. Archives of Medical Science . 2020;16(5):1004–1012. doi: 10.5114/aoms.2020.92832. [DOI] [PMC free article] [PubMed] [Google Scholar]
- 62.Mirzavandi F., Talenezhad N., Razmpoosh E., Nadjarzadeh A., Mozaffari-Khosravi H. The effect of intramuscular megadose of vitamin D injections on E-selectin, CRP and biochemical parameters in vitamin D-deficient patients with type-2 diabetes mellitus: a randomized controlled trial. Complementary Therapies in Medicine . 2020;49, article 102346 doi: 10.1016/j.ctim.2020.102346. [DOI] [PubMed] [Google Scholar]
- 63.Jorde R., Figenschau Y. Supplementation with cholecalciferol does not improve glycaemic control in diabetic subjects with normal serum 25-hydroxyvitamin D levels. European Journal of Nutrition . 2009;48(6):349–354. doi: 10.1007/s00394-009-0020-3. [DOI] [PubMed] [Google Scholar]
- 64.Eftekhari M. H., Akbarzadeh M., Dabbaghmanesh M. H., Hassanzadeh J. The effect of calcitriol on lipid profile and oxidative stress in hyperlipidemic patients with type 2 diabetes mellitus. ARYA Atherosclerosis . 2014;10(2):82–88. [PMC free article] [PubMed] [Google Scholar]
- 65.Heshmat R., Tabatabaei-Malazy O., Abbaszadeh-Ahranjani S., et al. Effect of vitamin D on insulin resistance and anthropometric parameters in type 2 diabetes; a randomized double-blind clinical trial. DARU Journal of Pharmaceutical Sciences . 2012;20(1):1–6. doi: 10.1186/2008-2231-20-10. [DOI] [PMC free article] [PubMed] [Google Scholar]
- 66.Nasri H., Behradmanesh S., Maghsoudi A. R., Ahmadi A., Nasri P., Rafieian-Kopaei M. Efficacy of supplementary vitamin D on improvement of glycemic parameters in patients with type 2 diabetes mellitus; a randomized double blind clinical trial. Journal of Renal Injury Prevention . 2014;3(1):31–34. doi: 10.12861/jrip.2014.10. [DOI] [PMC free article] [PubMed] [Google Scholar]
- 67.Park S., Yoon H.-K., Ryu H.-M., et al. Maternal vitamin D deficiency in early pregnancy is not associated with gestational diabetes mellitus development or pregnancy outcomes in Korean pregnant women in a prospective study. Journal of Nutritional Science and Vitaminology . 2014;60(4):269–275. doi: 10.3177/jnsv.60.269. [DOI] [PubMed] [Google Scholar]
- 68.Ryu O.-H., Lee S., Yu J., Choi M.-G., Yoo H. J., Mantero F. A prospective randomized controlled trial of the effects of vitamin D supplementation on long-term glycemic control in type 2 diabetes mellitus of Korea. Endocrine Journal . 2014;61(2):167–176. doi: 10.1507/endocrj.ej13-0356. [DOI] [PubMed] [Google Scholar]
- 69.Rad E. Y., Djalali M., Koohdani F., et al. The effects of vitamin D supplementation on glucose control and insulin resistance in patients with diabetes type 2: a randomized clinical trial study. Iranian Journal of Public Health . 2014;43(12):p. 1651. [PMC free article] [PubMed] [Google Scholar]
- 70.Al-Zahrani M. K., Elnasieh A. M., Alenezi F. M., et al. A 3-month oral vitamin D supplementation marginally improves diastolic blood pressure in Saudi patients with type 2 diabetes mellitus. International Journal of Clinical and Experimental Medicine . 2014;7(12):5421–5428. [PMC free article] [PubMed] [Google Scholar]
- 71.Mohammadi S. M., Eghbali S. A., Soheilikhah S., et al. The effects of vitamin D supplementation on adiponectin level and insulin resistance in first-degree relatives of subjects with type 2 diabetes: a randomized double-blinded controlled trial. Electronic Physician . 2016;8(9):2849–2854. doi: 10.19082/2849. [DOI] [PMC free article] [PubMed] [Google Scholar]
- 72.Forouhi N., Menon R., Sharp S., et al. Effects of vitamin D2 or D3 supplementation on glycaemic control and cardiometabolic risk among people at risk of type 2 diabetes: results of a randomized double-blind placebo-controlled trial. Diabetes, Obesity and Metabolism . 2016;18(4):392–400. doi: 10.1111/dom.12625. [DOI] [PMC free article] [PubMed] [Google Scholar]
- 73.Lo M. C., Abushamat L., Mramba L. K. Effect of treating vitamin D deficiency in uncontrolled type 2 diabetes: a randomized, placebo-controlled study. American Journal of Therapeutics . 2019;26(4):e441–e451. doi: 10.1097/MJT.0000000000000738. [DOI] [PubMed] [Google Scholar]
- 74.Breslavsky A., Frand J., Matas Z., Boaz M., Barnea Z., Shargorodsky M. Effect of high doses of vitamin D on arterial properties, adiponectin, leptin and glucose homeostasis in type 2 diabetic patients. Clinical Nutrition . 2013;32(6):970–975. doi: 10.1016/j.clnu.2013.01.020. [DOI] [PubMed] [Google Scholar]
- 75.Dadrass A., Mohammadzadeh Salamat K., Hamidi K., Azizbeigi K. Effects of vitamin D supplementation and resistance training on insulin resistance, lipid profile and body fat percentage in T2D men with vitamin D deficiency. Scientific Journal of Kurdistan University of Medical Sciences . 2018;23(2):1–11. doi: 10.29252/sjku.23.2.1. [DOI] [Google Scholar]
- 76.Sadiya A., Ahmed S. M., Carlsson M., et al. Vitamin D supplementation in obese type 2 diabetes subjects in Ajman, UAE: a randomized controlled double-blinded clinical trial. European Journal of Clinical Nutrition . 2015;69(6):707–711. doi: 10.1038/ejcn.2014.251. [DOI] [PMC free article] [PubMed] [Google Scholar]
- 77.Sugden J., Davies J., Witham M., Morris A., Struthers A. Vitamin D improves endothelial function in patients with type 2 diabetes mellitus and low vitamin D levels. Diabetic Medicine . 2008;25(3):320–325. doi: 10.1111/j.1464-5491.2007.02360.x. [DOI] [PubMed] [Google Scholar]
- 78.Momeni A., Mirhosseini M., Kabiri M., Kheiri S. Effect of vitamin D on proteinuria in type 2 diabetic patients. Journal of Nephropathology . 2017;6(1):10–14. doi: 10.15171/jnp.2017.03. [DOI] [PMC free article] [PubMed] [Google Scholar]
- 79.Baziar N., DJafarian K., Shadman Z., Qorbani M., Khoshniat Nikoo M., Razi F. Effect of vitamin d supplementation on improving vitamin d levels and insulin resistance in vitamin D insufficient or defficient type2 diabetics. Iranian Journal of Diabetes and Metabolism . 2014;13(5):425–433. [Google Scholar]
- 80.Razzaghi R., Pourbagheri H., Momen-Heravi M., et al. The effects of vitamin D supplementation on wound healing and metabolic status in patients with diabetic foot ulcer: a randomized, double-blind, placebo-controlled trial. Journal of Diabetes and its Complications . 2017;31(4):766–772. doi: 10.1016/j.jdiacomp.2016.06.017. [DOI] [PubMed] [Google Scholar]
- 81.Dalan R., Liew H., Assam P. N., et al. A randomised controlled trial evaluating the impact of targeted vitamin D supplementation on endothelial function in type 2 diabetes mellitus: the DIMENSION trial. Diabetes and Vascular Disease Research . 2016;13(3):192–200. doi: 10.1177/1479164115621667. [DOI] [PMC free article] [PubMed] [Google Scholar]
- 82.Witham M., Dove F., Dryburgh M., Sugden J., Morris A., Struthers A. The effect of different doses of vitamin D(3) on markers of vascular health in patients with type 2 diabetes: a randomised controlled trial. Diabetologia . 2010;53(10):2112–2119. doi: 10.1007/s00125-010-1838-1. [DOI] [PubMed] [Google Scholar]
- 83.Shaseb E., Tohidi M., Abbasinazari M., et al. The effect of a single dose of vitamin D on glycemic status and C-reactive protein levels in type 2 diabetic patients with ischemic heart disease: a randomized clinical trial. Acta Diabetologica . 2016;53(4):575–582. doi: 10.1007/s00592-016-0843-3. [DOI] [PubMed] [Google Scholar]
- 84.Ghavamzadeh S., Mobasseri M., Mahdavi R. The effect of vitamin D supplementation on adiposity, blood glycated hemoglobin, serum leptin and tumor necrosis factor-α in type 2 diabetic patients. International Journal of Preventive Medicine . 2014;5(9):1091–1098. [PMC free article] [PubMed] [Google Scholar]
- 85.Barzegari M., Sarbakhsh P., Mobasseri M., et al. The effects of vitamin D supplementation on lipid profiles and oxidative indices among diabetic nephropathy patients with marginal vitamin D status. Diabetes & Metabolic Syndrome: Clinical Research & Reviews . 2019;13(1):542–547. doi: 10.1016/j.dsx.2018.11.008. [DOI] [PubMed] [Google Scholar]
- 86.Kampmann U., Mosekilde L., Juhl C., et al. Effects of 12 weeks high dose vitamin D3 treatment on insulin sensitivity, beta cell function, and metabolic markers in patients with type 2 diabetes and vitamin D insufficiency–a double-blind, randomized, placebo-controlled trial. Metabolism . 2014;63(9):1115–1124. doi: 10.1016/j.metabol.2014.06.008. [DOI] [PubMed] [Google Scholar]
- 87.Farrokhian A., Raygan F., Bahmani F., et al. Long-term vitamin D supplementation affects metabolic status in vitamin D-deficient type 2 diabetic patients with coronary artery disease. The Journal of Nutrition . 2017;147(3):384–389. doi: 10.3945/jn.116.242008. [DOI] [PubMed] [Google Scholar]
- 88.Shahriari S., Eftekhari M. H., Jeddi M. The effect of vitamin D supplementation in overweight or obese type 2 diabetic patients with vitamin D deficiency and dyslipidemia. International Journal of Nutrition Sciences . 2018;3(4):185–191. [Google Scholar]
- 89.Parekh D., Sarathi V., Shivane V. K., Bandgar T. R., Menon P. S., Shah N. S. Pilot study to evaluate the effect of short-term improvement in vitamin D status on glucose tolerance in patients with type 2 diabetes mellitus. Endocrine Practice . 2010;16(4):600–608. doi: 10.4158/EP09300.OR. [DOI] [PubMed] [Google Scholar]
- 90.Gulseth H. L., Wium C., Angel K., Eriksen E. F., Birkeland K. I. Effects of vitamin D supplementation on insulin sensitivity and insulin secretion in subjects with type 2 diabetes and vitamin D deficiency: a randomized controlled trial. Diabetes Care . 2017;40(7):872–878. doi: 10.2337/dc16-2302. [DOI] [PubMed] [Google Scholar]
- 91.Imanparast F., Javaheri J., Kamankesh F., et al. The effects of chromium and vitamin D(3) co-supplementation on insulin resistance and tumor necrosis factor-alpha in type 2 diabetes: a randomized placebo-controlled trial. Applied Physiology, Nutrition, and Metabolism . 2020;45(5):471–477. doi: 10.1139/apnm-2019-0113. [DOI] [PubMed] [Google Scholar]
- 92.Agarwal C., Marwah S., Kulshrestha B., Anubhuti Effect of vitamin D replacement therapy on glycaemic control in type 2 diabetic mellitus patients. Journal of Clinical & Diagnostic Research . 2017;11(12) doi: 10.7860/JCDR/2017/29371.11009. [DOI] [Google Scholar]
- 93.Barchetta I., Del Ben M., Angelico F., et al. No effects of oral vitamin D supplementation on non-alcoholic fatty liver disease in patients with type 2 diabetes: a randomized, double-blind, placebo-controlled trial. BMC Medicine . 2016;14(1):1–10. doi: 10.1186/s12916-016-0638-y. [DOI] [PMC free article] [PubMed] [Google Scholar]
- 94.Elkassaby S., Harrison L. C., Mazzitelli N., et al. A randomised controlled trial of high dose vitamin D in recent-onset type 2 diabetes. Diabetes Research and Clinical Practice . 2014;106(3):576–582. doi: 10.1016/j.diabres.2014.08.030. [DOI] [PubMed] [Google Scholar]
- 95.Ebrahimkhani S., Ghavamzadeh S., Mehdizadeh A. The effects of vitamin D and curcuminoids supplementation on anthropometric measurements and blood pressure in type 2 diabetic patients with coexisting hypovitaminosis D: a double-blind, placebo-controlled randomized clinical trial. Clinical Nutrition ESPEN . 2020;37:178–186. doi: 10.1016/j.clnesp.2020.02.017. [DOI] [PubMed] [Google Scholar]
- 96.Fazelian S., Amani R., Paknahad Z., Kheiri S., Khajehali L. Effect of vitamin D supplement on mood status and inflammation in vitamin D deficient type 2 diabetic women with anxiety: a randomized clinical trial. International Journal of Preventive Medicine . 2019;10(1):p. 17. doi: 10.4103/ijpvm.IJPVM_174_18. [DOI] [PMC free article] [PubMed] [Google Scholar]
- 97.Maggi S., Siviero P., Brocco E., Albertin M., Romanato G., Crepaldi G. Vitamin D deficiency, serum leptin and osteoprotegerin levels in older diabetic patients: an input to new research avenues. Acta Diabetologica . 2014;51(3):461–469. doi: 10.1007/s00592-013-0540-4. [DOI] [PubMed] [Google Scholar]
- 98.Moreira-Lucas T. S., Duncan A. M., Rabasa-Lhoret R., et al. Effect of vitamin D supplementation on oral glucose tolerance in individuals with low vitamin D status and increased risk for developing type 2 diabetes (EVIDENCE): a double-blind, randomized, placebo-controlled clinical trial. Diabetes, Obesity and Metabolism . 2017;19(1):133–141. doi: 10.1111/dom.12794. [DOI] [PubMed] [Google Scholar]
- 99.Mousa A., Naderpoor N., Teede H., Scragg R., de Courten B. Vitamin D supplementation for improvement of chronic low-grade inflammation in patients with type 2 diabetes: a systematic review and meta-analysis of randomized controlled trials. Nutrition Reviews . 2018;76(5):380–394. doi: 10.1093/nutrit/nux077. [DOI] [PubMed] [Google Scholar]
- 100.Qasemi R., Ghavamzadeh S., Faghfouri A. H., Valizadeh N., Mohammadi A., Sayyadi H. The effect of vitamin D supplementation on flow-mediated dilatation, oxidized LDL and intracellular adhesion molecule 1 on type 2 diabetic patients with hypertension: a randomized, placebo-controlled, double-blind trial. Diabetes & Metabolic Syndrome: Clinical Research & Reviews . 2021;15(4, article 102200) doi: 10.1016/j.dsx.2021.102200. [DOI] [PubMed] [Google Scholar]
- 101.Raygan F., Ostadmohammadi V., Bahmani F., Asemi Z. The effects of vitamin D and probiotic co-supplementation on mental health parameters and metabolic status in type 2 diabetic patients with coronary heart disease: a randomized, double-blind, placebo-controlled trial. Progress in Neuro-Psychopharmacology and Biological Psychiatry . 2018;84(Part A):50–55. doi: 10.1016/j.pnpbp.2018.02.007. [DOI] [PubMed] [Google Scholar]
- 102.Shehab D., Al-Jarallah K., Abdella N., Mojiminiyi O. A., Al M. H. Prospective evaluation of the effect of short-term oral vitamin D supplementation on peripheral neuropathy in type 2 diabetes mellitus. Medical Principles and Practice . 2015;24(3):250–256. doi: 10.1159/000375304. [DOI] [PMC free article] [PubMed] [Google Scholar]
Associated Data
This section collects any data citations, data availability statements, or supplementary materials included in this article.
Supplementary Materials
Additional supporting information can be found online in the Supporting Information section. Supporting Information details the search queries used to identify relevant studies, incorporating various keywords and MeSH terms across databases. The GRADE assessment indicates moderate to high confidence in the evidence, suggesting that vitamin D supplementation may significantly improve glycemic control and cardiovascular risk factors in T2DM patients.
Data Availability Statement
The datasets used during and/or analyzed during the current study are available from the corresponding authors on reasonable request.