Abstract
Background: Gout is closely tied to metabolism, yet there is limited evidence on how metabolites may cause or prevent the condition. Methods: This study utilized a two-sample Mendelian randomization (MR) analysis to evaluate the causal relationship between 1,400 serum metabolites and gout. We primarily employed the inverse variance-weighted (IVW) method to estimate causal effects, supplemented by MR-Egger regression, weighted median, simple mode, and weighted mode for comprehensive evaluations. Additionally, we conducted tests for pleiotropy and heterogeneity. Results: After a rigorous selection process, we identified eight known metabolites and four unknown metabolites associated with gout. Among the eight known metabolites, Glucuronide of piperine metabolite C17H21NO3 and the Phosphate to mannose ratio were positively associated with an increased risk of gout. Conversely, levels of 5 alpha-androstan-3 beta, 17 alpha-diol disulfate, Pantoate, N-carbamoylalanine, Sphingomyelin (d18:0/20:0, d16:0/22:0), Hydroxypalmitoyl sphingomyelin (d18:1/16:0(OH)), and Mannose were linked to a decreased risk of gout. Conclusion: This study identified eight metabolites from 1,400 blood samples significantly linked to gout risk. Integrating genomics and metabolomics offers valuable insights for gout screening and prevention, indicating that specific blood metabolites can help identify individuals at higher risk.
Keywords: Mendelian randomization, blood metabolites, gout, causal relationship
Introduction
Gout is a prevalent type of inflammatory arthritis that occurs when monosodium urate crystals accumulate in the joints, resulting from persistently high levels of uric acid in the blood [1]. Gout prevalence around the globe fluctuates between 1% to 6.8%, with a notably higher incidence in males than in females [2]. The growing economic development and shifts in dietary habits have led to a noticeable increase in the global prevalence of gout [3]. Beyond the debilitating pain it causes, gout can result in serious complications, including cardiovascular diseases, diabetes, and chronic kidney disease [4], which impose a considerable economic burden on individuals and society as a whole. Consequently, the early detection and prevention of gout are imperative.
Metabolites, the byproducts of biochemical processes in living organisms, play a significant role in the onset and progression of various disorders through diverse mechanisms. Recent advancements in metabolomics research have explored the intriguing connections between metabolites and gout. By identifying distinct metabolites and developing diagnostic models, researchers have uncovered numerous combinations of metabolic biomarkers with the potential to effectively identify and evaluate gout [5,6]. For instance, a lipidomic analysis employing UHPLC-Q Exactive MS successfully identified 116 unique metabolites in gout patients, including diacylglycerol, triacylglycerol (TAG), phosphatidylcholine, phosphatidylethanolamine, and phosphatidylinositol [7]. Moreover, another study highlighted that 21 metabolites, encompassing fats and proteins, exhibited significant alterations in individuals suffering from hyperuricemia or gout. The impacted metabolic pathways pertain to fat metabolism, carbohydrate processing, protein metabolism, and energy production [8]. These findings underscore an association between specific metabolites and gout; however, the precise causal relationship remains uncertain. Therefore, it is essential to further investigate the causality of interactions between gout and metabolites.
MR is an innovative epidemiological approach designed to investigate causal relationships between exposure and outcomes. Rooted in Mendelian genetic principles, it utilizes single nucleotide polymorphisms (SNPs) as instrumental variables (IVs) to draw causal inferences [9]. This method not only uncovers fundamental biological mechanisms but also reduces confounding variables, thereby improving the reliability of causal conclusions [10]. In light of the ambiguous causal effects of metabolites on gout, this study employed MR analysis leveraging genome-wide association study (GWAS) data from two cohorts to evaluate the causal association between a wide array of blood metabolites and the risk of developing gout.
Methods
Study design
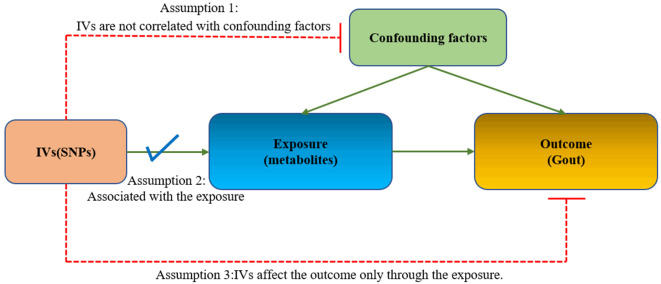
We rigorously assessed the causal links between blood metabolites and the risk of gout using a two-sample MR design. The effectiveness of MR analysis relies on three core assumptions (Figure 1): (1) IVs are not correlated with confounding factors; (2) IVs are robustly associated with exposure; (3) IVs affect the outcome only through the exposure. The framework of this MR methodology is depicted in Figure 2. Initially, we selected pertinent SNPs derived from the primary GWAS of 1,400 metabolites to serve as IVs, we then collected the pertinent SNPs identified in the outcome GWAS. By integrating SNPs from both the exposure and outcome datasets, MR analysis was conducted on the combined data to identify metabolites associated with the disease. All statistical analyses were executed utilizing the ‘Two Sample MR’ package (version 0.5.6) in RStudio (version 4.2.2).
Figure 1.
Mendelian randomization assumption plot.
Figure 2.
Flowchart of the present MR study.
Data source
We employed data from an independent GWAS of 1,400 metabolites, involving 8,299 European subjects participating in the Canadian Longitudinal Study on Aging (CLSA) [11], GWAS summary statistics for 1,091 blood metabolites and 309 metabolite ratios were obtained from the GWAS Catalog database (http://www.ebi.ac.uk/gwas/), The Catalogue ID for these 1,400 metabolites range from GCST90199621 to GCST90201020.
The GWAS data for gout were sourced from the IEU GWAS Open Project (http://gwas.mrcieu.ac.uk/). The GWAS directory login number is ieu-a-1054, in which included 69,374 Europeans, with 2,115 individuals having the gout phenotype, and a control group of 67,294 individuals. All the statistical data we utilized are freely accessible in public databases, thus eliminating the need for ethical approval.
Instruments selection
We carried out multiple steps to identify qualifying genetic variations associated with the 1,400 metabolites. Initially, Given the potentially limited quantity of SNPs reaching the genome-wide significance threshold, the parameters were adjusted by reducing the significance level to 1×10^(-5), this approach has been commonly used in earlier MR research [12,13]. Second, to guarantee independence among the chosen IVs and reduce the influence of linkage disequilibrium that could disrupt random allele assignment, we clumped SNPs by removing linkage disequilibrium (LD) using criteria of r^2 < 0.001 and kb=10,000 kb. Furthermore, to minimize bias from weak instruments, The F-value for each SNP was computed to evaluate the strength of the association, SNPs with an F-value less than 10 were deemed weak instruments and thus removed [14]. The R2 and F statistics for each SNP were calculated employing these formulas:
R2 = 2 × b2 × EAF × (1 - EAF)/(2 × b2 × EAF × (1 - EAF) + 2 × (se(b))2 × N × EAF × (1 - EAF))
F = (N - k - 1) × R2/(k × (1 - R2))
Here, b represents the magnitude of the genetic variant’s impact, EAF stands for the frequency of the effect allele, and se(b) represents the standard deviation of the magnitude of the effect, N denotes the total number of samples for the exposure, and k is the quantity of SNPs. To complete the process, we harmonized the exposure and outcome SNPs, removing those that were palindromic or allele-inconsistent. By excluding SNPs linked to the outcome with a significance level of P < 1×10⁻⁵, the third assumption was satisfied. The final MR analysis focused on metabolites linked to over two SNPs [15].
MR analysis
This study utilized different Mendelian randomization approaches to assess the causal link between metabolites and metabolite ratios with gout. The main method for MR applied was the IVW method, which estimates the causal relationship of metabolites on gout by combining the Wald ratios of each SNP to generate a combined estimate [16], when all IVs are assumed to be valid, IVW can provide unbiased estimates under balanced horizontal pleiotropy [17]. Additionally, MR Egger, weighted median, simple mode, and weighted mode methods were served as complementary analyses. The weighted median approach can deliver reliable and precise effect measurements, as long as half or more of the data is derived from credible instruments [18], the Egger regression was employed to identify and correct for pleiotropic effects [19]. A significance threshold of P < 0.05 was used to gauge statistical significance and support the presence of potential causal effects. The impact estimates were presented as odds ratios (ORs), accompanied by 95% confidence intervals (CIs). If the p values in IVW and MR-PRESSO methods were below 0.05, the associations were considered statistically significant, and the findings from the MR-Egger, weighted median, simple mode, and weighted mode methods aligned with the IVW results.
Sensitivity analyses
To ensure that heterogeneity and pleiotropy among the IVs did not introduce bias into the MR analysis, we performed a thorough series of sensitivity analyses. These analyses aimed to confirm the consistency and dependability of our notable results. First, we utilized Cochran’s Q test to assess heterogeneity across the IVs, with a p-value exceeding 0.05 suggesting the absence of significant heterogeneity [20]. Additionally, to evaluate potential horizontal pleiotropy, which happens when genetic variants impact the outcome through mechanisms independent of the exposure, we employed the MR-Egger intercept test and MR Pleiotropy Residual Sum and Outlier (MRPRESSO) global test. Evidence of pleiotropy was shown by a p-value below 0.05 in the MR-Egger intercept test [21]. To further assess the consistency and robustness of our causal estimates, we provided visual representations, including scatter plots, forest plots, funnel plots, and leave-one-out plots. These plots helped illustrate the effect of each independent variable on the overall outcomes and allowed us to identify any potential outliers or biases in the analysis.
Results
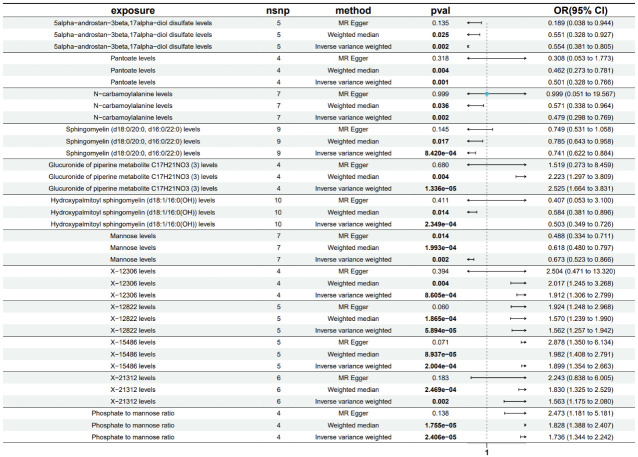
Using the IVW method as the primary assessment tool, subsequent to filtering based on False Discovery Rate (FDR < 0.2) [22], we identified 12 metabolites potentially linked to gout. This group comprised 8 identified metabolites and 4 unknown ones. Within the identified metabolites, two were associated with an elevated risk of gout: Glucuronide of piperine metabolite C17H21NO3 (3) (OR=2.525; 95% CI=1.664-3.831; P=1.336e-05) and the phosphate to mannose ratio (OR=1.736; 95% CI=1.344-2.242; P=2.406e-05). Conversely, six metabolites were linked to a decreased risk of gout: 5alpha-androstan-3beta,17alpha-diol disulfate (OR=0.554; 95% CI=0.381-0.805; P=0.002), pantoate (OR=0.501; 95% CI=0.328-0.766; P=1.34e-05), N-carbamoylalanine (OR=0.479; 95% CI=0.298-0.769; P=0.002), sphingomyelin (d18:0/20:0, d16:0/22:0) (OR=0.741; 95% CI=0.622-0.884; P=8.420e-04), hydroxypalmitoyl sphingomyelin (d18:1/16:0(OH)) (OR=0.503; 95% CI=0.349-0.726; P=2.349e-04), and mannose (OR=0.673; 95% CI=0.523-0.866; P=0.002). Further details are provided in Figure 3.
Figure 3.
Forest plot illustrating the causal effect of metabolites on gout risk, based on IVW, MR-Egger regression, and Weighted Median estimates. CI represents confidence interval, and OR denotes odds ratio.
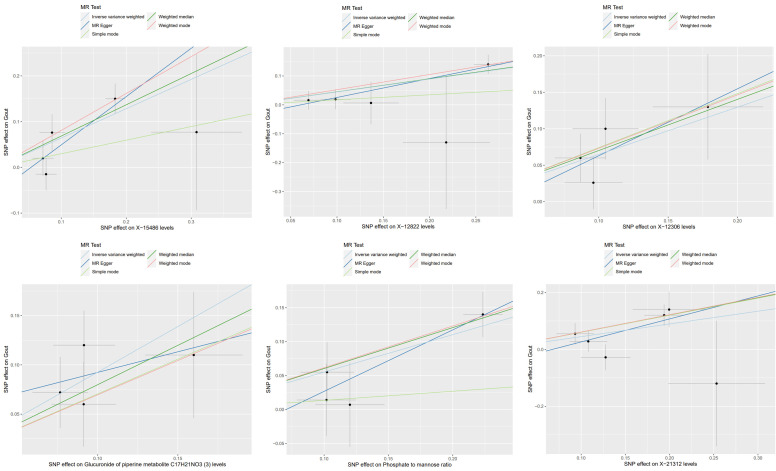
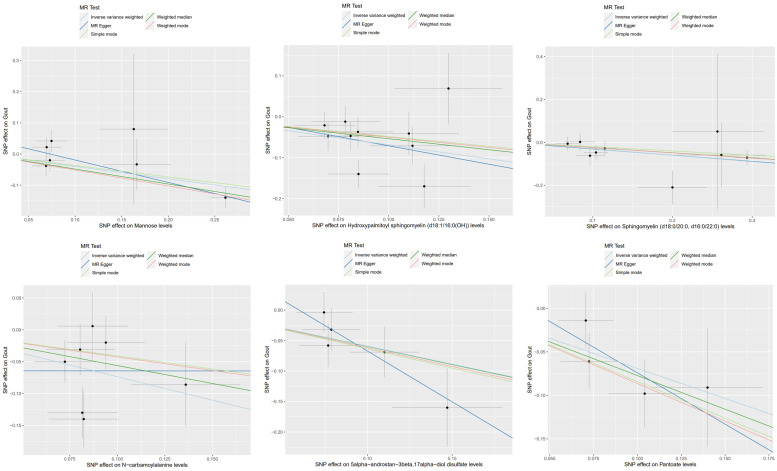
To control for potential confounding factors, in addition to the IVW analysis, a comprehensive assessment of the causality between metabolites and gout was conducted, incorporating MR-Egger regression, weighted median, simple mode, and weighted mode methods. We also applied multiple testing correction and assessed heterogeneity. The MR estimates from these five methods for the 12 metabolites consistently showed the same direction and magnitude of effect, affirming the robustness of the causal relationships (Figures 4, 5), Cochran’s Q test revealed no heterogeneity, and the MR-Egger intercept analysis showed no indication of pleiotropy (Table 1). Additionally, the leave-one-out analysis confirmed that no single SNP had a significant impact on the MR estimates, as demonstrated in Supplementary Figure 1, the funnel plots were displayed in Supplementary Figure 2.
Figure 4.
Scatter plots depicting the association of six metabolites with an increased risk of gout.
Figure 5.
Scatter plots depicting the association of six metabolites with a decreased risk of gout.
Table 1.
Sensitivity analysis assessing the causal relationship between metabolites and gout
| Metabolites | N | IVW | MR-egger | Heterogeneity | Pleiotropy | ||||
|---|---|---|---|---|---|---|---|---|---|
|
|
|
|
|
||||||
| OR (95%) | p | OR (95%) | p | Q | p | Intercept | p | ||
| 5alpha-androstan-3beta,17alpha-diol disulfate levels | 5 | 0.554 (0.381, 0.805) | 0.002 | 0.189 (0.038, 0.944) | 0.135 | 3.102 | 0.541 | 0.099 | 0.271 |
| Pantoate levels | 4 | 0.501 (0.328, 0.766) | 0.0014 | 0.308 (0.053, 1.773) | 0.318 | 1.748 | 0.626 | 0.043 | 0.630 |
| N-carbamoylalanine levels | 7 | 0.479 (0.298, 0.769) | 0.0023 | 0.999 (0.051, 19.567) | 0.999 | 10.042 | 0.123 | -0.064 | 0.644 |
| Sphingomyelin (d18:0/20:0, d16:0/22:0) levels | 9 | 0.741 (0.622, 0.884) | 0.0008 | 0.750 (0.531, 1.058) | 0.145 | 5.545 | 0.698 | -0.002 | 0.944 |
| Glucuronide of piperine metabolite C17H21NO3 levels | 4 | 2.525 (1.664, 3.831) | 1.34E-05 | 1.519 (0.273, 8.459) | 0.680 | 1.698 | 0.637 | 0.051 | 0.611 |
| Hydroxypalmitoyl sphingomyelin (d18:1/16:0(OH)) levels | 10 | 0.503 (0.349, 0.726) | 0.0002 | 0.407 (0.053, 3.100) | 0.411 | 15.051 | 0.090 | 0.019 | 0.840 |
| Mannose levels | 7 | 0.673 (0.523, 0.866) | 0.0021 | 0.488 (0.334, 0.711) | 0.014 | 8.496 | 0.204 | 0.053 | 0.099 |
| X-12306 levels | 4 | 1.912 (1.306, 2.799) | 0.0009 | 2.504 (0.471, 13.320) | 0.394 | 1.650 | 0.648 | -0.029 | 0.776 |
| X-12822 levels | 5 | 1.562 (1.257, 1.942) | 5.89E-05 | 1.924 (1.248, 2.968) | 0.060 | 2.752 | 0.600 | -0.040 | 0.355 |
| X-15486 levels | 5 | 1.899 (1.354, 2.663) | 0.0002 | 2.878 (1.350, 6.134) | 0.071 | 5.595 | 0.231 | -0.057 | 0.320 |
| X-21312 levels | 6 | 1.563 (1.175, 2.080) | 0.0021 | 2.243 (0.838, 6.005) | 0.183 | 6.630 | 0.250 | -0.055 | 0.493 |
| Phosphate to mannose ratio | 4 | 1.736 (1.344, 2.242) | 2.41E-05 | 2.473 (1.181, 5.181) | 0.138 | 1.805 | 0.614 | -0.064 | 0.422 |
Discussion
Our study reveals a causal connection between gout and a specific set of 12 metabolites. Out of these, 4 remain unidentified, while 8 have been recognized and indicate potential causal associations with gout. To explore these relationships, we employed existing GWAS data and carried out a two-sample MR analysis. We also conducted comprehensive sensitivity analyses to meticulously account for confounding factors, thereby reinforcing the validity and reliability of our conclusions.
Our findings revealed that glucuronide, a metabolite of piperine, was associated with an increased risk of gout. Piperine is a phytochemical known for its anti-inflammatory properties [23]. Interestingly, previous experimental evidence has shown that piperine can inhibit inflammation induced by sodium urate crystals, suggesting its potential as a therapeutic agent for gouty arthritis prevention and treatment [24,25]. Our research results, however, contradict these findings by suggesting that higher levels of piperine are associated with an increased risk of gout. This discrepancy warrants further exploration in future studies. Additionally, phosphate, which is essential for basic cellular functions and participates in various biochemical reactions in the body, including cell signaling and energy metabolism, plays a critical role. Excessive retention of phosphate can have toxic effects and impair the functionality of almost all organ systems [26]. Our study indicates that an elevated phosphate-to-urate ratio may impact uric acid excretion in the kidneys, leading to inflammatory responses triggered by crystal deposition [27]. These findings align with our results and suggest a potential influence of phosphate on the development of gout.
Among the metabolites associated with a reduced risk of gout, sphingomyelin (SM) is a crucial biomolecule in eukaryotes. It not only serves as a component of cell membranes but also plays a critical role in regulating cellular signal transduction and functionality [28]. Previous studies have suggested that sphingomyelin has a protective effect on dysfunctional lipid metabolism and the progression of inflammation [29]. This indicates that sphingomyelin may have a beneficial impact on preventing gout by mitigating inflammatory responses and lipid abnormalities. Mannose, a natural bioactive monosaccharide, is involved in metabolism and the synthesis of glycoproteins. It exhibits anti-inflammatory and anti-oxidative activities [30]. Mannose may exert a protective effect on the development of gout by alleviating inflammatory responses and oxidative stress. Therefore, mannose could potentially serve as a diagnostic indicator and therapeutic target for gout. One of the main strengths of our study is the inclusion of a wide range of blood metabolites. In total, we included 1400 metabolites for MR analysis, making it the most comprehensive study to date on the relationship between blood metabolites and gout. By utilizing multiple models and conducting extensive sensitivity analysis within the MR framework, we were able to assess causality and enhance the reliability of our MR results. This approach helps to mitigate issues related to reverse causality and residual confounding often encountered in traditional observational studies. However, some limitations should be acknowledged. Firstly, all the GWAS data used in our study were derived from European populations, which may limit the generalizability of our findings to other ethnic groups. Further research is needed to evaluate the applicability of our results in different populations. Secondly, some of the metabolites identified as potentially involved in the development of gout remain chemically unknown, which hinders obtaining definitive explanations for their roles.
Conclusion
In summary, our MR study demonstrated a causal link between 12 metabolites and gout risk. Notably, elevated levels of phosphate and mannose exhibited the strongest associations with gout. These results offer initial insights into how metabolite dysregulation could contribute to the onset and progression of gout. Gaining a deeper understanding of the influence of these metabolites on gout risk may inform clinical screening and preventive measures for individuals at elevated risk. Additional research is essential to confirm these findings and investigate the underlying mechanisms at play.
Acknowledgements
This work was supported by Key Disciplines in Yangpu District (No. 22YPZB03).
Disclosure of conflict of interest
The authors declare that the research was conducted in the absence of any commercial or financial relationships that could be construed as a potential conflict of interest.
Supporting Information
References
- 1.Dalbeth N, Gosling AL, Gaffo A, Abhishek A. Gout. Lancet. 2021;397:1843–1855. doi: 10.1016/S0140-6736(21)00569-9. [DOI] [PubMed] [Google Scholar]
- 2.Dehlin M, Jacobsson L, Roddy E. Global epidemiology of gout: prevalence, incidence, treatment patterns and risk factors. Nat Rev Rheumatol. 2020;16:380–390. doi: 10.1038/s41584-020-0441-1. [DOI] [PubMed] [Google Scholar]
- 3.Kuo CF, Grainge MJ, Zhang W, Doherty M. Global epidemiology of gout: prevalence, incidence and risk factors. Nat Rev Rheumatol. 2015;11:649–662. doi: 10.1038/nrrheum.2015.91. [DOI] [PubMed] [Google Scholar]
- 4.Singh JA, Gaffo A. Gout epidemiology and comorbidities. Semin Arthritis Rheum. 2020;50:S11–S16. doi: 10.1016/j.semarthrit.2020.04.008. [DOI] [PubMed] [Google Scholar]
- 5.Huang Y, Xiao M, Ou J, Lv Q, Wei Q, Chen Z, Wu J, Tu L, Jiang Y, Zhang X, Qi J, Qiu M, Cao S, Gu J. Identification of the urine and serum metabolomics signature of gout. Rheumatology (Oxford) 2020;59:2960–2969. doi: 10.1093/rheumatology/keaa018. [DOI] [PubMed] [Google Scholar]
- 6.Wang M, Li R, Qi H, Pang L, Cui L, Liu Z, Lu J, Wang R, Hu S, Liang N, Tao Y, Dalbeth N, Merriman TR, Terkeltaub R, Yin H, Li C. Metabolomics and machine learning identify metabolic differences and potential biomarkers for frequent versus infrequent gout flares. Arthritis Rheumatol. 2023;75:2252–2264. doi: 10.1002/art.42635. [DOI] [PubMed] [Google Scholar]
- 7.Liu S, Wang Y, Liu H, Xu T, Wang MJ, Lu J, Guo Y, Chen W, Ke M, Zhou G, Lu Y, Chen P, Zhou W. Serum lipidomics reveals distinct metabolic profiles for asymptomatic hyperuricemic and gout patients. Rheumatology (Oxford) 2022;61:2644–2651. doi: 10.1093/rheumatology/keab743. [DOI] [PubMed] [Google Scholar]
- 8.Zhang Y, Zhang H, Chang D, Guo F, Pan H, Yang Y. Metabolomics approach by 1H NMR spectroscopy of serum reveals progression axes for asymptomatic hyperuricemia and gout. Arthritis Res Ther. 2018;20:111. doi: 10.1186/s13075-018-1600-5. [DOI] [PMC free article] [PubMed] [Google Scholar]
- 9.Davey Smith G, Hemani G. Mendelian randomization: genetic anchors for causal inference in epidemiological studies. Hum Mol Genet. 2014;23:R89–98. doi: 10.1093/hmg/ddu328. [DOI] [PMC free article] [PubMed] [Google Scholar]
- 10.Birney E. Mendelian randomization. Cold Spring Harb Perspect Med. 2022;12:a041302. doi: 10.1101/cshperspect.a041302. [DOI] [PMC free article] [PubMed] [Google Scholar]
- 11.Chen Y, Lu T, Pettersson-Kymmer U, Stewart ID, Butler-Laporte G, Nakanishi T, Cerani A, Liang KYH, Yoshiji S, Willett JDS, Su CY, Raina P, Greenwood CMT, Farjoun Y, Forgetta V, Langenberg C, Zhou S, Ohlsson C, Richards JB. Genomic atlas of the plasma metabolome prioritizes metabolites implicated in human diseases. Nat Genet. 2023;55:44–53. doi: 10.1038/s41588-022-01270-1. [DOI] [PMC free article] [PubMed] [Google Scholar]
- 12.Ni JJ, Xu Q, Yan SS, Han BX, Zhang H, Wei XT, Feng GJ, Zhao M, Pei YF, Zhang L. Gut microbiota and psychiatric disorders: a two-sample Mendelian randomization study. Front Microbiol. 2022;12:737197. doi: 10.3389/fmicb.2021.737197. [DOI] [PMC free article] [PubMed] [Google Scholar]
- 13.Choi KW, Chen CY, Stein MB, Klimentidis YC, Wang MJ, Koenen KC, Smoller JW Major Depressive Disorder Working Group of the Psychiatric Genomics Consortium. Assessment of bidirectional relationships between physical activity and depression among adults: a 2-sample Mendelian randomization study. JAMA Psychiatry. 2019;76:399–408. doi: 10.1001/jamapsychiatry.2018.4175. [DOI] [PMC free article] [PubMed] [Google Scholar]
- 14.Palmer TM, Lawlor DA, Harbord RM, Sheehan NA, Tobias JH, Timpson NJ, Davey Smith G, Sterne JA. Using multiple genetic variants as instrumental variables for modifiable risk factors. Stat Methods Med Res. 2012;21:223–242. doi: 10.1177/0962280210394459. [DOI] [PMC free article] [PubMed] [Google Scholar]
- 15.Gill D, Brewer CF, Monori G, Trégouët DA, Franceschini N, Giambartolomei C INVENT Consortium. Tzoulaki I, Dehghan A. Effects of genetically determined iron status on risk of venous thromboembolism and carotid atherosclerotic disease: a Mendelian randomization study. J Am Heart Assoc. 2019;8:e012994. doi: 10.1161/JAHA.119.012994. [DOI] [PMC free article] [PubMed] [Google Scholar]
- 16.Pierce BL, Burgess S. Efficient design for Mendelian randomization studies: subsample and 2-sample instrumental variable estimators. Am J Epidemiol. 2013;178:1177–1184. doi: 10.1093/aje/kwt084. [DOI] [PMC free article] [PubMed] [Google Scholar]
- 17.Lin Z, Deng Y, Pan W. Combining the strengths of inverse-variance weighting and Egger regression in Mendelian randomization using a mixture of regressions model. PLoS Genet. 2021;17:e1009922. doi: 10.1371/journal.pgen.1009922. [DOI] [PMC free article] [PubMed] [Google Scholar]
- 18.Hartwig FP, Davey Smith G, Bowden J. Robust inference in summary data Mendelian randomization via the zero modal pleiotropy assumption. Int J Epidemiol. 2017;46:1985–1998. doi: 10.1093/ije/dyx102. [DOI] [PMC free article] [PubMed] [Google Scholar]
- 19.Bowden J, Davey Smith G, Burgess S. Mendelian randomization with invalid instruments: effect estimation and bias detection through Egger regression. Int J Epidemiol. 2015;44:512–525. doi: 10.1093/ije/dyv080. [DOI] [PMC free article] [PubMed] [Google Scholar]
- 20.Burgess S, Small DS, Thompson SG. A review of instrumental variable estimators for Mendelian randomization. Stat Methods Med Res. 2017;26:2333–2355. doi: 10.1177/0962280215597579. [DOI] [PMC free article] [PubMed] [Google Scholar]
- 21.Verbanck M, Chen CY, Neale B, Do R. Detection of widespread horizontal pleiotropy in causal relationships inferred from Mendelian randomization between complex traits and diseases. Nat Genet. 2018;50:693–698. doi: 10.1038/s41588-018-0099-7. [DOI] [PMC free article] [PubMed] [Google Scholar]
- 22.Benjamini Y, Hochberg Y. Controlling the false discovery rate: a practical and powerful approach to multiple testing. J R Stat Soc Series B Stat Methodol. 2018;57:289–300. [Google Scholar]
- 23.Balkrishna A, Tomer M, Joshi M, Gujral S, Kumar Mishra R, Srivastava J, Varshney A. Standardization and validation of phytometabolites by UHPLC and high-performance thin layer chromatography for rapid quality assessment of ancient ayurvedic medicine, Mahayograj Guggul. J Sep Sci. 2022;45:1616–1635. doi: 10.1002/jssc.202100935. [DOI] [PubMed] [Google Scholar]
- 24.Jati GAK, Assihhah N, Wati AA, Salasia SIO. Immunosuppression by piperine as a regulator of the NLRP3 inflammasome through MAPK/NF-κB in monosodium urate-induced rat gouty arthritis. Vet World. 2022;15:288–298. doi: 10.14202/vetworld.2022.288-298. [DOI] [PMC free article] [PubMed] [Google Scholar]
- 25.Sabina EP, Nagar S, Rasool M. A role of piperine on monosodium urate crystal-induced inflammation--an experimental model of gouty arthritis. Inflammation. 2011;34:184–192. doi: 10.1007/s10753-010-9222-3. [DOI] [PubMed] [Google Scholar]
- 26.Michigami T, Yamazaki M, Razzaque MS. Extracellular phosphate, inflammation and cytotoxicity. Adv Exp Med Biol. 2022;1362:15–25. doi: 10.1007/978-3-030-91623-7_3. [DOI] [PubMed] [Google Scholar]
- 27.Senthelal S, Li J, Ardeshirzadeh S, Thomas MA. Arthritis. In: Senthelal S, editor. Treasure Island (FL): StatPearls Publishing; 2023. pp. 3–6. [Google Scholar]
- 28.Chen Y, Cao Y. The sphingomyelin synthase family: proteins, diseases, and inhibitors. Biol Chem. 2017;398:1319–1325. doi: 10.1515/hsz-2017-0148. [DOI] [PubMed] [Google Scholar]
- 29.Norris GH, Milard M, Michalski MC, Blesso CN. Protective properties of milk sphingomyelin against dysfunctional lipid metabolism, gut dysbiosis, and inflammation. J Nutr Biochem. 2019;73:108224. doi: 10.1016/j.jnutbio.2019.108224. [DOI] [PubMed] [Google Scholar]
- 30.Dong L, Xie J, Wang Y, Jiang H, Chen K, Li D, Wang J, Liu Y, He J, Zhou J, Zhang L, Lu X, Zou X, Wang XY, Wang Q, Chen Z, Zuo D. Mannose ameliorates experimental colitis by protecting intestinal barrier integrity. Nat Commun. 2022;13:4804. doi: 10.1038/s41467-022-32505-8. [DOI] [PMC free article] [PubMed] [Google Scholar]
Associated Data
This section collects any data citations, data availability statements, or supplementary materials included in this article.


