Abstract
Objectives:
Unstructured and structured data in electronic health records (EHR) are a rich source of information for research and quality improvement studies. However, extracting accurate information from EHR is labor-intensive. Here we introduce an automated EHR phenotyping model to identify patients with Alzheimer’s Disease, related dementias (ADRD), or mild cognitive impairment (MCI).
Methods:
We assembled medical notes and associated International Classification of Diseases (ICD) codes and medication prescriptions from 3,626 outpatient adults from two hospitals seen between February 2015 and June 2022. Ground truth annotations regarding the presence vs. absence of a diagnosis of MCI or ADRD were determined through manual chart review. Indicators extracted from notes included the presence of keywords and phrases in unstructured clinical notes, prescriptions of medications associated with MCI/ADRD, and ICD codes associated with MCI/ADRD. We trained a regularized logistic regression model to predict the ground truth annotations. Model performance was evaluated using area under the receiver operating curve (AUROC), area under the precision-recall curve (AUPRC), accuracy, specificity, precision/positive predictive value, recall/sensitivity, and F1 score (harmonic mean of precision and recall).
Results:
Thirty percent of patients in the cohort carried diagnoses of MCI/ADRD based on manual review. When evaluated on a held-out test set, the best model using clinical notes, ICDs, and medications, achieved an AUROC of 0.98, an AUPRC of 0.98, an accuracy of 0.93, a sensitivity (recall) of 0.91, a specificity of 0.96, a precision of 0.96, and an F1 score of 0.93 The estimated overall accuracy for patients randomly selected from EHRs was 99.88%.
Conclusion:
Automated EHR phenotyping accurately identifies patients with MCI/ADRD based on clinical notes, ICD codes, and medication records. This approach holds potential for large-scale MCI/ADRD research utilizing EHR databases.
Keywords: electronic health records (EHR), Alzheimer’s disease, dementia, mild cognitive impairment
Introduction
Globally, 12% to 18% of people aged 60 or older are living with mild cognitive impairment (MCI) 1, and 10% to 15% of individuals living with MCI develop dementia each year 2. About one-third of people living with MCI due to Alzheimer’s disease (AD) develop dementia within five years 3. The number of people in the United States with AD dementia will increase dramatically in the next 30 years due to growth of the population over the age of 654. Observational data from Electronic Health Records (EHRs) are an increasingly important resource for research on risk factors and potential interventions for MCI and AD 5–7. A key challenge in scaling up EHR-based research is the accurate phenotyping of patients with a diagnosis of MCI and ADRD. Many studies rely on billing codes (International Classification of Diseases: ICD-9, ICD-10) 8,9; however, these are often inaccurate 10. Manual review of clinical notes is more accurate 11–15 but labor intensive and impossible to conduct at large scale 16–18.
Automated EHR phenotyping seeks to address these challenges by automatically extracting information from clinical notes and combining this with structured information (e.g., medication prescriptions and diagnostic billing codes) to infer information of interest 19. Here, we present a machine learning (ML)-based EHR phenotyping model to automate the process of chart review for MCI/ADRRD. We demonstrate that our model combining information from clinical notes, ICD codes, and medications provides an accurate MCI/ADRRD phenotyping and is thus suitable for large-scale EHR research.
Materials And Methods
study cohort
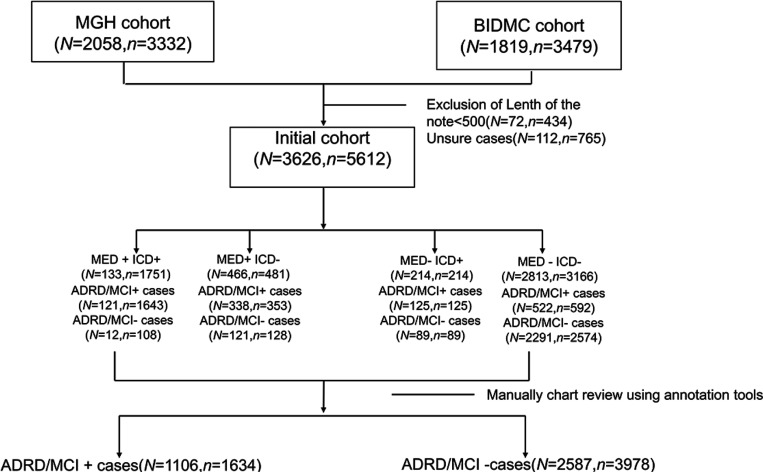
EHR data was extracted under protocols approved by the Massachusetts General Hospital (MGH) and Beth Israel Deaconess Medical Center (BIDMC) Institutional Review Boards with waivers of informed consent. A consort diagram is provided in Figure 1.
Figure 1.
CONSORT diagram. N is the number of unique patients. n is the number of visits.
Patients were selected from MGH and BIDMC EHR archives from visits that took place between January 3rd, 2012, to November 3rd, 2017. Because ADRD/MCI is an age-associated disease, only patients aged 50 years or older were included. We randomly selected patients for inclusion using a stratified sampling strategy, to ensure adequate representation of patients with low, medium, and high likelihood of having an MCI/ADRD diagnosis to facilitate subsequent model development. Specifically, we created 4 groups based on the presence or absence of computable criteria (i.e. criteria that do not depend on analysis of unstructured text data): ‘MED-ICD-’, ‘MED+ICD+’, ‘MED+ICD-’, ‘MED-ICD+’, denoting groups of patients with and without ICD codes and medications (MED) associated with MCI/ADRD. Notes for patients within each of these groups were subsequently manually reviewed to determine which patients had an MCI/ADRD diagnosis (described below).
study data
Study data included unstructured (i.e., free text) clinical notes and structured data. Structured data included International Classification of Diseases (ICD) codes 20 for MCI/ADRD, and dementia-related medications (see below). Clinical notes included office visit notes, admission notes, progress notes, discharge notes, and correspondence from all medical specialties in the MGH and BIDMC systems. Clinical notes contain a wide range of information such as chief complaint; history of present illness; physician examinations, observations, assessments, and treatment plans; active problems; and current and past medications. All patients included in the study had at least one clinical note. If a patient had any MED or ICD records, only notes recorded after the first appearance of a MED or ICD record were selected for analysis. We removed notes with fewer than 500 words as these were generally administrative notes without significant medical content.
Ground truth labels: Manual chart review
We used a web-based tool developed in house that highlights keywords within notes from a provided list. A neurologist (MBW) performed manual review of all notes in each of the ‘MED+ ICD+’, ‘MED+ ICD-’, ‘MED- ICD+’, and ‘MED-ICD-’ groups, and assigned a final yes/no label regarding MCI/ADRD status. Cases marked as ‘uncertain’ were excluded.
In the ‘MED+ICD+’ group, patients were prescribed medications typically associated with ADRD/MCI (‘MED+’) and had ADRD/MCI-related ICD codes (‘ICD+’). In the ‘MED+ICD-’ group, patients were prescribed ADRD/MCI-related medication (‘MED+’), but no ADRD/MCI-related ICD codes (‘ICD-’) were present in their medical records. In the ‘MED- ICD+’ group, patients were not prescribed ADRD/MCI-related medications (‘MED-’), yet their medical records contained ADRD/MCI-related ICD codes (‘ICD+’). ‘MED-ICD-’ cases involved neither ADRD-related medication (‘MED-’) nor ADRD-related ICD codes (‘ICD-’) in the medical records.
Predictors included in the model
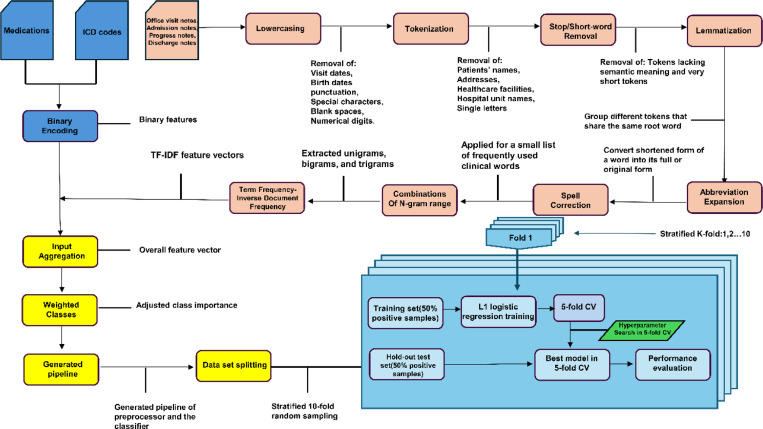
The entire method is depicted in Figure 2. Features included as input to the model included 9 groups of medications, 6 groups of ICD codes, and text features.
Figure 2.
Method flowchart.
ICD code groupings:
ICD groupings and medications were defined a priori by three neurologists (MBW, SZ, SM), including: “Alzheimer’s disease” - ICD-10 F00, G30.0, G30.1, G30.8, G30.9 and ICD-9 290.0, 290.2x, 290.3, 331.0; “Vascular Dementia” - ICD-10 F01.X and ICD-9 290.4X; “Lewy Body Dementia” -ICD-10 G31.83 and ICD-9 331.82; “Frontotemporal Dementia” - ICD-10 G31.0, G31.01, G31.09 and ICD-9 311.11, 331.19; “Unspecified Dementias” - ICD-10 F02.8x, F03.9x and ICD-9 294.1x, 294.2x; “Mild Cognitive Impairment” ICD-10 F06.7 and ICD-9 331.83. One day before and after the visit was considered for assignment of an ICD code to account for prior or delayed data entry.
Medications:
Aricept, donepezil, Exelon, rivastigmine, memantine, Namenda, Namzaric, Razadyne, and galantamine 21.
Text features:
Keywords, phrases, and word patterns were extracted from notes. We converted the text in each note to lowercase, removed stop words and special characters, and applied lemmatization. Subsequently, we extracted unique words from each note. We also extracted unique bigrams (two consecutive words) and trigrams (three consecutive words) to identify potentially discriminative features. For each note, we created a vector representation of the information within the note using Term Frequency-Inverse Document Frequency (TF-IDF) weighting 22,23. TF-IDF quantifies the importance of a word within a note, relative to its prevalence across a collection of notes. Specifically, we created vectors containing TF-IDF values for each of the candidate features identified above. TF-IDF features were assembled into a single overall vector which serves as input to the classification model.
Classification model training and testing
We trained a logistic regression model to assign a probability to each note, representing the likelihood of the clinical note indicating MCI/ADRD. To deal with imbalanced numbers of positive and negative subsamples, we used class weights inversely proportional to subsample size. LASSO regularization was employed for automated feature selection, with the relative importance of each feature assessed based on the magnitude of the resulting regression coefficients. To evaluate the performance of our model and assess generalizability, we implemented 5 -fold stratified nested cross-validation. Hyperparameter optimization was conducted using internal cross-validation. To compare the informativeness of different data types, we trained models with the following input combinations: (1) clinical notes, ICDs, and medications combined, (2) clinical notes only; (3) ICDs only; and (4) medications only. Feature importance analysis was performed to determine which variables had the most significant impact on the model’s predictions.
Model performance metrics
Model performance was evaluated using accuracy, precision, recall, specificity, F1-score, area under the AUROC, and area under the AUPRC 24. For each metric, we present micro-average performance metrics for positive and negative diagnoses of MCI/ADRD. We conducted 1000 iterations of bootstrapping to obtain the 95% confidence intervals (CI). Additionally, confusion matrices for various training and testing datasets further illustrate the model’s performance across different data splits. Error analysis was conducted to identify the primary sources of misclassification.
Generalizability experiments
To evaluate the model’s generalizability across institutions and to enhance robustness by incorporating data from both, we conducted five experiments: 1) MGH as Training Set, BIDMC as Testing Set: We trained the model exclusively with data from MGH and tested the model on data from BIDMC. 2) BIDMC as Training Set, MGH as Testing Set: We trained the model exclusively with BIDMC and tested the model on MGH data. 3) MGH+ BIDMC Training Set, MGH+ BIDMC Testing Set: Training data came from both MGH and BIDMC, as did testing data. 4) MGH+ BIDMC Training Set, MGH Testing Set: Training data came from both MGH and BIDMC, testing data from MGH only. 5) MGH+ BIDMC Training Set, BIDMC Testing Set: Training data from both MGH and BIDMC, testing data from BIDMC only.
Performance in unselected / random EHR samples
The sample utilized for training and testing is, by construction, enriched for “positive” cases, i.e. there are more MED+/ICD+, MED+/ICD-, and MED-/ICD+, and fewer MED-/ICD- cases than would be present in a random sample. Thus, although the overall error rate and other overall performance statistics calculated for our cohort are “biased”, i.e. they do not represent the performance that we would expect in a general, unselected hospital population. To obtain an unbiased estimate of model performance, we first estimated the error rates within each of the 4 groups , then combined these with estimates of the prevalences of the 4 groups in the general hospital population to obtain an estimate of the unbiased error rate. Specifically, obtained estimates of the prevalences of each group , by sampling 500 patients randomly from BIDMC and 500 from randomly from MGH, and calculated the proportions falling within each of the 4 groups. The prevalences and error rates are then combined to give an overall expected error rate using the following formula:
Results
Patient population
Figure 1 presents the CONSORT diagram illustrating the cohort selection process. The MGH cohort comprised 2,058 patients with 3,332 visits, while the BIDMC cohort included 1,819 patients with 3,479 visits. A total of 112 cases, accounting for 765 visits, were excluded due to uncertain manual annotations. After categorizing patients into four sampling groups, the final counts were as follows: 3,626 patients with 5,612 visits. Specifically, the ‘MED+ ICD+’ group had 133 patients with 1,751 visits; the ‘MED+ ICD-’ group included 466 patients with 481 visits; the ‘MED- ICD+’ group consisted of 214 patients with 214 visits; and the ‘MED- ICD-’ group contained 2,813 patients with 3,166 visits. In the subgroup analysis, the ‘MED+ ICD+’ group had 121 ADRD/MCI-positive patients with 1,643 visits and 12 patients with 353 visits and 121 MCI/ADRD-negative patients with 128 visits. The ‘MED- ICD+’ subgroup comprised 125 ADRD/MCI-positive patients with 125 visits and 89 MCI/ADRD-negative patients with 89 visits. The largest group, ‘MED- ICD-’, included 522 ADRD/MCI-positive patients with 592 visits and 2,291 MCI/ADRD-negative patients with 2,574 visits. The cohort was selected to ensure sufficient patients with MCI/ADRD diagnoses for model training. Consequently, the final MGH and BIDMC cohort included 1,106 (30.5%) MCI/ADRD-positive patients from 1,634 visits and 2,587 MCI/ADRD-negative patients from 3,978 visits.
Table 1 summarizes the baseline characteristics of the cohort. The average age was 67.6 years, with 47% of patients being male and 53% female. Racial distribution included 16.0% Black or African American, 1.5% Asian, 70.5% White, and 11.94% categorized as ‘Other’. The MCI/ADRD diagnosis rate was 30.5%. Among the four sampling groups, the ‘MED+ ICD+’ group had 10.94%, the ‘MED+ ICD-’ group had 30.56%, the ‘MED- ICD+’ group had 11.3%, and the ‘MED- ICD-’ group had 47.2%.
Table 1:
Cohort characteristics.
| Characteristic | Value(N=3,626) |
|---|---|
| Age (a) (years, mean (SD)) | 67.6 (16.7) |
| Sex, n (%) | |
| Male | 1704 (47%) |
| Female | 1922 (53%) |
| Race, n (%) | |
| Black or African American | 580 (16.0%) |
| Asian | 55 (1.5%) |
| White | 2558 (70.5%) |
| Other (b) | 433 (11.94%) |
| MCI/ADRD diagnosis, n (%) | 1106 (30.5%) |
| MED+ICD+ group | 121 (10.94%) |
| MED+ICD- group | 338 (30.56%) |
| MED-ICD+ group | 125 (11.3%) |
| MED-ICD- group | 522 (47.2%) |
Age at baseline for the first visit in the study period.
‘Other’ includes ‘unknown’, ‘declined to answer’, ‘American Indian or Alaska Native’ and ‘Native Hawaiian or other Pacific Islander’
Model performance
Performance results for predicting MCI/ADRD chart diagnoses are presented in Table 2, which varies the model inputs, and Table 3, which varies the training and testing cohorts. Table 2 presents the average performance for logistic regression models using ICD Only, Med Only, Note Only, and ICD+MED+Note inputs in the MGH+BIDMC training sets and MGH+BIDMC testing sets. The findings indicate a clear pattern in the performance of logistic regression models based on different input data types. Models that incorporate textual note data, either alone or in combination with ICD codes and medication data, consistently outperform models using only ICD codes or only medication data across all performance metrics, with an accuracy of 0.89, specificity of 0.90, AUROC of 0.95, and AUPRC of 0.95. In Table 3, the highest performance was observed when the MGH+ BIDMC training set was tested on the MGH set, achieving an AUROC of 0.98, an AUPRC of 0.98, an accuracy of 0.93, a specificity of 0.96, a precision of 0.96, an F1 score of 0.93 and a recall of 0.91.
Table 2:
Average performance and [95% confidence intervals] for logistic regression models using ICD Only, Med Only, Note Only, and ICD+MED+Note in the MGH+BIDMC training sets and MGH+BIDMC testing sets
| Model Input | Accuracy | Specificity | F1-score | Recall | Precision | AUROC | AUPRC |
|---|---|---|---|---|---|---|---|
| ICD Only | 0.54 [0.52–0.55] |
0.37 [0.35–0.38] |
0.60 [0.59–0.62] |
0.7 [0.69–0.72] |
0.53 [0.51–0.55] |
0.54 [0.52–0.55] |
0.69 [0.68–0.70] |
| Med Only | 0.56 [0.55–0.58] |
0.43 [0.41–0.45] |
0.61 [0.60–0.63] |
0.69 [0.68–0.71] |
0.55 [0.53–0.57] |
0.56 [0.55–0.58] |
0.70 [0.69–0.71] |
| Note Only | 0.88 [0.87–0.91] |
0.90 [0.89–0.93] |
0.88 [0.86–0.90] |
0.87 [0.85–0.88] |
0.88 [0.87–0.91] |
0.94 [0.93–0.95] |
0.94 [0.93–0.95] |
| ICD+MED+Note | 0.89 [0.88–0.90] |
0.90 [0.89–0.92] |
0.88 [0.87–0.90] |
0.88 [0.86–0.90] |
0.88 [0.88–0.91] |
0.95 [0.94–0.96] |
0.95 [0.94–0.96] |
AUROC: Area Under the Receiver Operating Characteristic curve, shows model’s ability to distinguish between classes.
AUPRC: Area Under the Precision-Recall Curve, summarizes the precision and recall across different thresholds.
Inputs: ICD Only: Models using only International Classification of Diseases codes. Med Only: Models using only medication data.
Note Only: Models using only textual note data. ICD+MED+Note: Models combining ICD codes, medication data, and textual note data.
Data Sets: MGH+ BIDMC: Data derived from Massachusetts General Hospital and Beth Israel Deaconess Medical Center.
Table 3:
Average performance and [95% confidence intervals] for logistic regression model using all features in the different testing sets
| Training set | Testing set | Accuracy | Specificity | F1-score | Recall | Precision | AUROC | AUPRC |
|---|---|---|---|---|---|---|---|---|
| MGH+BIDMC | BIDMC | 0.86 [0.84–0.87] |
0.86 [0.83–0.87] |
0.84 [0.82–0.86] |
0.85 [0.83–0.88] |
0.82 [0.80–0.84] |
0.92 [0.91–0.94] |
0.91 [0.90–0.93] |
| MGH | BIDMC | 0.90 [0.89–0.92] |
0.92 [0.91–0.93] |
0.83 [0.81–0.85] |
0.88 [0.86–0.90] |
0.79 [0.77–0.83] |
0.95 [0.93–0.96] |
0.90 [0.89–0.92] |
| BIDMC | MGH | 0.94 [0.94–0.95] |
0.96 [0.96–0.97] |
0.91 [0.89–0.92] |
0.90 [0.88–0.91] |
0.91 [0.91–0.93] |
0.98 [0.97–0.98] |
0.98 [0.97–0.98] |
| MGH+BIDMC | MGH | 0.93 [0.92–0.95] |
0.96 [0.95–0.98] |
0.93 [0.92–0.95] |
0.91 [0.88–0.92] |
0.96 [0.94–0.99] |
0.98 [0.97–0.99] |
0.98 [0.98–0.99] |
| MGH+BIDMC | MGH+BIDMC | 0.89 [0.88–0.90] |
0.90 [0.89–0.92] |
0.88 [0.87–0.90] |
0.88 [0.86–0.90] |
0.88 [0.88–0.91] |
0.95 [0.94–0.96] |
0.95 [0.94–0.96] |
The bootstrapping results in 95% confidence intervals are in parenthesis. ACC - accuracy, Spec - specificity, AP - average precision, AUROC - Area under the receiver operating characteristic curve, AUPRC - area under the precision-recall curve. Data Sets: MGH: Data derived from Massachusetts General Hospital. BI: Data derived from Beth Israel Deaconess Medical Center. MGH+ BIDMC: Data derived from Massachusetts General Hospital and Beth Israel Deaconess Medical Center.
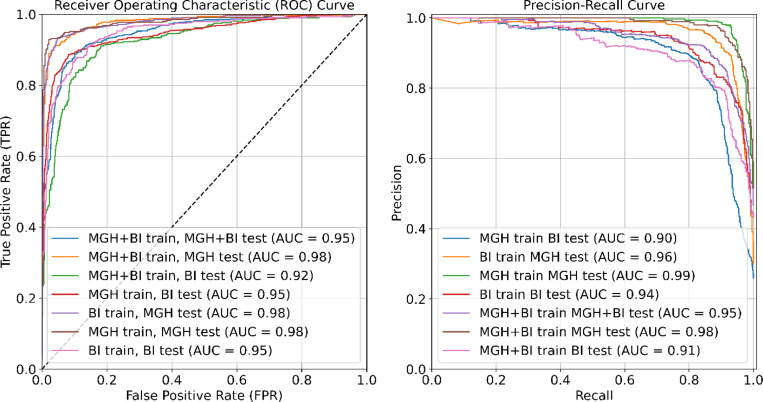
Figure 3 provides a comparative analysis of various training and testing approaches using ROC curves (left panel) and Precision-Recall (PR) curves (right panel). The highest ROC observed is 0.99 for the MGH training and MGH testing set. The Precision-Recall curves demonstrate the trade-off between precision and recall, with the highest Precision-Recall AUC being 0.98 for multiple model configurations, including MGH training tested on the MGH set and MGH+BIDMC training tested on the MGH set.
Figure 3.
Left panel: Comparative analysis of all training/testing approaches using Receiver OperatingCharacteristic (ROC) curves. Right panel: Comparative analysis of all training/testing approaches usingPrecision-Recall curves.
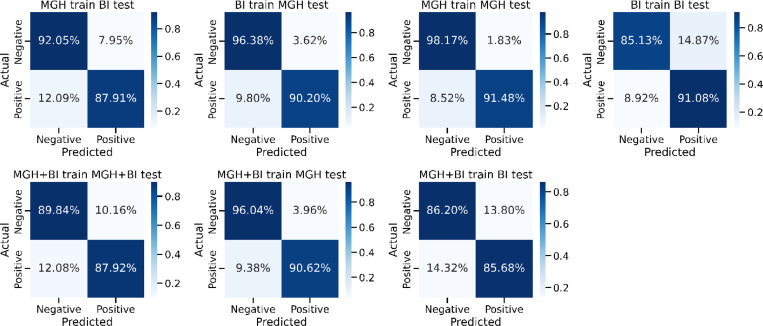
Figure 4 shows the confusion matrices representing various training/testing experiments in the context of predicting MCI/ADRD. The columns correspond to predicted MCI/ADRD status, while rows represent the ground truth classification based on chart review. The model trained and tested on MGH data shows the highest accuracy, with 98.17% for negative and 91.48% for positive predictions. Conversely, models trained on one dataset and tested on another exhibit lower performance, particularly in positive predictions. Combining both datasets for training (MGH+BI) and testing on the combined or individual datasets yields intermediate performance.
Figure 4.
Comparative analysis of all training/testing approaches using confusion matrix.
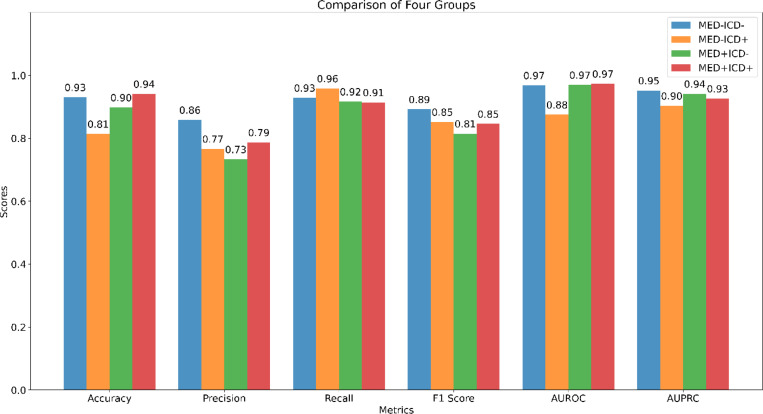
Figure 5 compares the performance of the model across the four sampling groups, ‘MED-ICD-’, ‘MED-ICD+’, ‘MED+ICD-’, and ‘MED+ICD+’. Performance is consistently higher for all metrics except recall in the patients with congruent ICD and medication information (‘MED-ICD-’, ‘MED+ICD+’ subgroups) across most metrics, and lower for patients with ‘mixed’ information (‘MED+ICD-’, ‘MED-ICD+’). In terms of accuracy, the ‘MED+ICD+’ group performed best (0.94) and ‘MED-ICD+’ performed worst (0.81). Precision was highest for ‘MED-ICD-’ (0.86) and lowest for ‘MED+ICD-’ (0.73). Recall was best for ‘MED-ICD+’ (0.96) with little difference among the other groups. The F1 Score was highest for ‘MED-ICD-’ (0.89) and lowest for ‘MED+ICD-’ (0.81). AUROC was the same for ‘MED-ICD-’, ‘MED+ICD-’, and ‘MED+ICD+’ (0.97), while ‘MED-ICD+’ was the lowest (0.88). AUPRC was highest for ‘MED-ICD-’ (0.95) and lowest for ‘MED-ICD+’ (0.90).
Figure 5.
Performance Evaluation of Different Subgroups Across Multiple Metrics.
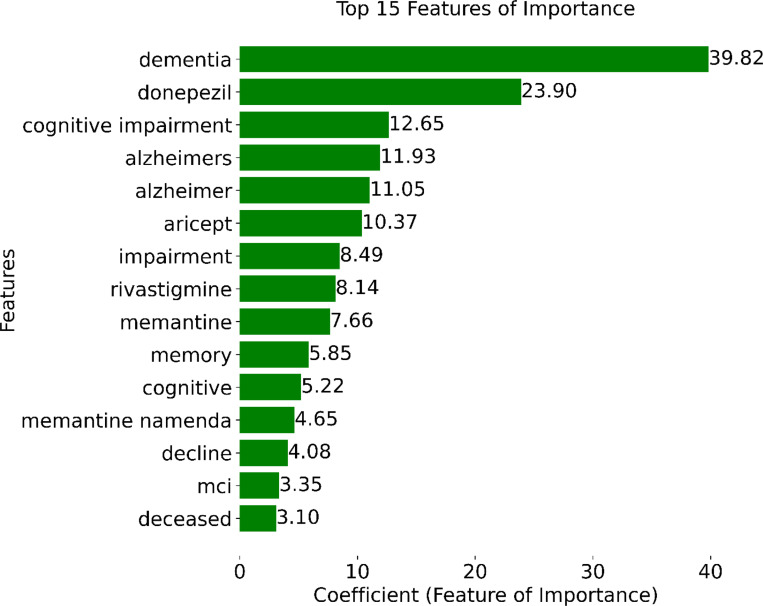
Figure 6 shows the coefficient values of the top 15 features selected during model training. Notably, the presence of the word “dementia” in a note emerged as the most informative feature, followed closely by the prescription of MCI/ADRD-related medications, including donepezil, aricept, rivastigmine, and memantine. Other top-15 MCI/ADRD-related keywords included “cognitive impairment”, “Alzheimer”, “MCI”, “memory”, “cognitive”, and “decline”.
Figure 6.
Top 15 important features based on model coefficients.
Performance in unselected / random EHR samples
We calculated the expected error rate in a general hospital population following the procedure described in the Methods section. In the random sample selected ( N= 1000, 500 from MGH, 500 from BIDMC), the proportion (and numbers) falling within each of the 4 groups were: MED+ ICD+, ; MED+ICD−, Pe+− .4% (n = 4); MED− ICD+, Pe−+ = 0.3% (n = 3); MED−ICD−, Pe−− = 0.2% (n = 2). Combining these with the error rates in each group , we obtain as an estimate of the overall (unbiased) error rate:
The overall error rate in the general hospital population is estimated to be 0.12%, i.e. accuracy of 99.88%.
Error analysis
We conducted a manual review of cases to gain qualitative insights into reasons for model errors. False positives arose primarily from clinical notes describing symptoms resembling MCI/ADRD, such as memory loss and cognitive decline attributable to alternative causes such as depression and anxiety. Conversely, false negatives arose primarily from notes from specialists seeing patients with MCI/ADRD for specialized care in other areas of medicine, such as nephrology or gynecology, who commented sparsely on issues related to the MCI/ADRD diagnosis in their notes.
Discussion
Our machine learning-based automated EHR phenotyping model accurately identifies patients diagnosed with MCI/ADRD using unstructured clinical notes, ICD codes, and MCI/ADRD medications. Models incorporating textual notes, either alone or combined with ICD codes and medication data, consistently outperformed those relying solely on ICD codes or medication data. The ICD+MED+Note model achieved the highest performance, underscoring the importance of integrating diverse data sources for enhanced accuracy and reliability. As shown in Table 2, models using only ICD codes exhibit lower specificity (i.e., higher false positive rate). In contrast, models based solely on clinical notes demonstrate superior performance, with notable differences in AUROC ( 0.94 vs. 0.54 ), AUPRC ( 0.69 vs. 0.95 ), and F1-score (0.78 vs. 0.60 ).
Our analysis revealed an important finding that the information in clinical notes leads to much better performance than using ICD codes alone 25,26. For example, the ICDs may be triggered by a broad range of cognitive symptoms that are not necessarily due to MCl or dementia. This is more likely in the older population where other disease conditions are common, including medication side effects or interactions, depression /mood difficulties 27, hypothyroidism, substance use (such as alcohol and marijuana), and sleep difficulties 28. The accurate diagnosis of MCl or dementia requires comprehensive testing 29–31, including cognitive testing, physical examination, and often neuroimaging 32. The clinical notes often contain more detailed descriptions and therefore more information about the ground truth.
The performance indicates good generalizability across sites. Nevertheless, there are notable site differences. Performance on MGH test data was better compared to performance on BIDMC test data, regardless of the source (BIDMC or MGH) of the training data, suggesting that the MGH dataset may present fewer complexities or challenges. Conversely, adding data from BIDMC to the training dataset resulted in a slight decline in performance on tests conducted at BIDMC. Specifically, the AUROC decreased from 0.98 to 0.92, and the AUPRC decreased from 0.98 to 0.91. These changes represent a minimal impact on the model’s performance. The alignment of the features identified for retention within the model with existing medical knowledge and their consistency with an established understanding of dementia and MCI/ADRD medications suggests that the model has learned a reasonable, interpretable pattern. In the future, we hope to apply this model to identify MCI/ADRD patients from electronic health records at scale, thus creating opportunities for large-scale EHR-based studies.
A strength of our approach is the use of data across two health networks (MGH and BIDMC); most published studies focus on single-site data 25,33–35. This multi-site comparison allowed for a broader validation of our model, showing consistency in performance metrics such as accuracy, specificity, and AUC across different institutional datasets. Our model achieved high AUROC (0.98), demonstrating robust discrimination across testing scenarios. We also emphasize the importance of the highly observed AUPRC, particularly as it relates to the clinical relevance in contexts where class imbalance is pronounced. The high AUPRC indicates that our model effectively identifies “rare” events, such as ADRD/MCI diagnoses, from large healthcare datasets. This strong performance in correctly identifying true positive cases is crucial for accurately diagnosing fewer common conditions with significant clinical implications.
Additionally, our study included a larger patient cohort than those typically reported 25,33–35, which enhances the generalizability of our findings. References to other studies comparing site performance are scarce, making our contributions significant for future multicentric studies. The testing performance was generally better on MGH data than on BIDMC data, regardless of the site of origin of the training data. This suggests that there may be a larger proportion of difficult or ambiguous cases in the BIDMC test set. Nevertheless, test performance was excellent for both sites, suggesting generalizability across notes written within different medical institutions.
Our study has important limitations. While our experiments included two medical centers, these are located in the same geographic region (Boston, United States), and may thus not be representative of other US and non-US populations. Thus, future studies that utilize our model across different hospitals and EHR systems should check for performance biases that might arise due to different demographics, larger sample sizes, bias in data collection, and EHR data stored formats. An additional limitation is that our model does not identify specific subtypes of ADRD and provides no information about the severity of ADRD or MCI. Incorporating large language models (LLMs) like GPT may enhance the feature extraction and interpretation of clinical notes by handling complex medical language and context-specific nuances more effectively - an approach we did not use. Overall, this study represents an important step towards unlocking the vast potential of EHR data to advance our understanding of mild cognitive impairment and dementia and enables various downstream studies.
In conclusion, our model combining the clinical notes, ICD codes, and medications from the EHR system provides accurate MCI/ADRD phenotyping. In the future, this work will enable important downstream large-scale analyses to understand various aspects of MCI/ADRD.
Acknowledgments/Funding
This work was supported by grants from the National Institutes of Health (NIH): R01NS102190, R01NS102574, R01NS107291, RF1AG064312, RF1NS120947, R01AG073410, R01HL161253, R01NS126282, R01AG073598, and National Science Foundation (NSF) :2014431.
Footnotes
Ethics approval and consent to participate
EHR data was extracted under protocols approved by the Massachusetts General Hospital (MGH) and Beth Israel Deaconess Medical Center (BIDMC) Institutional Review Boards (IRB) with waivers of informed consent.
Competing Interests
The authors declare that there are no competing interests regarding the publication of this paper.
Consent for publication
All authors have approved the manuscript for publication.
Additional Declarations: The authors declare no competing interests.
Contributor Information
Ruoqi Wei, University of Florida.
Stephanie S Buss, Beth Israel Deaconess Medical Center.
Rebecca Milde, Beth Israel Deaconess Medical Center.
Marta Fernandes, Beth Israel Deaconess Medical Center.
Daniel Sumsion, Beth Israel Deaconess Medical Center.
Elijah Davis, Beth Israel Deaconess Medical Center.
Wan-Yee Kong, Beth Israel Deaconess Medical Center.
Yiwen Xiong, Beth Israel Deaconess Medical Center.
Jet Veltink, Beth Israel Deaconess Medical Center.
Samvrit Rao, Beth Israel Deaconess Medical Center.
Tara M. Westover, Massachusetts General Hospital
Lydia Petersen, Beth Israel Deaconess Medical Center.
Niels Turley, Beth Israel Deaconess Medical Center.
Arjun Singh, Massachusetts General Hospital.
Sudeshna Das, Beth Israel Deaconess Medical Center.
Valdery Moura Junior, Beth Israel Deaconess Medical Center.
Manohar Ghanta, Beth Israel Deaconess Medical Center.
Aditya Gupta, Beth Israel Deaconess Medical Center.
Jennifer Kim, Yale School of Medicine.
Alice D. Lam, Massachusetts General Hospital
Katie L. Stone, University of California, San Francisco
Emmanuel Mignot, Stanford University.
Dennis Hwang, San Bernardino County Sleep Disorders Center.
Lynn Marie Trotti, Emory University.
Gari D. Clifford, Emory University
Umakanth Katwa, Boston Children’s Hospital.
Robert J Thomas, Beth Israel Deaconess Medical Center.
Shibani Mukerji, Beth Israel Deaconess Medical Center.
Sahar F. Zafar, Massachusetts General Hospital
M. Brandon Westover, Beth Israel Deaconess Medical Center.
Haoqi Sun, Beth Israel Deaconess Medical Center.
Data Availability
All data and computer code used to produce the figures and tables will be available at the time of publication here: (https://github.com/rockey1006/Automated_ADRD-MCI) and here (https://bdsp.io/projects/jpCoV5N1MsB9a5QsgprQ/).
References
- 1.Bai W, Chen P, Cai H, et al. Worldwide prevalence of mild cognitive impairment among community dwellers aged 50 years and older: a meta-analysis and systematic review of epidemiology studies. Age and ageing. 2022;51(8):afac173. [DOI] [PubMed] [Google Scholar]
- 2.Rajan KB, Weuve J, Barnes LL, McAninch EA, Wilson RS, Evans DA. Population estimate of people with clinical Alzheimer’s disease and mild cognitive impairment in the United States (2020–2060). Alzheimer’s & dementia. 2021;17(12):1966–1975. [DOI] [PMC free article] [PubMed] [Google Scholar]
- 3.Liss J, Seleri Assunção S, Cummings J, et al. Practical recommendations for timely, accurate diagnosis of symptomatic Alzheimer’s disease (MCI and dementia) in primary care: a review and synthesis. Journal of internal medicine. 2021;290(2):310–334. [DOI] [PMC free article] [PubMed] [Google Scholar]
- 4.Hebert LE, Weuve J, Scherr PA, Evans DA. Alzheimer disease in the United States (2010–2050) estimated using the 2010 census. Neurology. 2013;80(19):1778–1783. [DOI] [PMC free article] [PubMed] [Google Scholar]
- 5.Rothman B, Leonard JC, Vigoda MM. Future of electronic health records: implications for decision support. Mount Sinai Journal of Medicine: A Journal of Translational and Personalized Medicine. 2012;79(6):757–768. [DOI] [PubMed] [Google Scholar]
- 6.Sun J, Hu J, Luo D, et al. Combining knowledge and data driven insights for identifying risk factors using electronic health records. Paper presented at: AMIA Annual Symposium Proceedings2012. [PMC free article] [PubMed]
- 7.Hemingway H, Asselbergs FW, Danesh J, et al. Big data from electronic health records for early and late translational cardiovascular research: challenges and potential. European heart journal. 2018;39(16):1481–1495. [DOI] [PMC free article] [PubMed] [Google Scholar]
- 8.Innes KE, Sambamoorthi U. The potential contribution of chronic pain and common chronic pain conditions to subsequent cognitive decline, new onset cognitive impairment, and incident dementia: A systematic review and conceptual model for future research. Journal of Alzheimer’s Disease. 2020;78(3):1177–1195. [DOI] [PMC free article] [PubMed] [Google Scholar]
- 9.Jutkowitz E, Bynum JP, Mitchell SL, et al. Diagnosed prevalence of Alzheimer’s disease and related dementias in Medicare Advantage plans. Alzheimer’s & Dementia: Diagnosis, Assessment & Disease Monitoring. 2020;12(1):e12048. [DOI] [PMC free article] [PubMed] [Google Scholar]
- 10.Sanders TB, Bowens FM, Pierce W, Stasher-Booker B, Thompson EQ, Jones WA. The road to ICD-10-CM/PCS implementation: forecasting the transition for providers, payers, and other healthcare organizations. Perspectives in health information management/AHIMA, American Health Information Management Association. 2012;9(Winter). [PMC free article] [PubMed] [Google Scholar]
- 11.Ford E, Oswald M, Hassan L, Bozentko K, Nenadic G, Cassell J. Should free-text data in electronic medical records be shared for research? A citizens’ jury study in the UK. Journal of medical ethics. 2020;46(6):367–377. [DOI] [PMC free article] [PubMed] [Google Scholar]
- 12.Kong H-J. Managing unstructured big data in healthcare system. Healthcare informatics research. 2019;25(1):1–2. [DOI] [PMC free article] [PubMed] [Google Scholar]
- 13.Preen DB, Holman CAJ, Lawrence DM, Baynham NJ, Semmens JB. Hospital chart review provided more accurate comorbidity information than data from a general practitioner survey or an administrative database. Journal of clinical epidemiology. 2004;57(12):1295–1304. [DOI] [PubMed] [Google Scholar]
- 14.Kaur H, Sohn S, Wi C-I, et al. Automated chart review utilizing natural language processing algorithm for asthma predictive index. BMC pulmonary medicine. 2018;18(1):1–9. [DOI] [PMC free article] [PubMed] [Google Scholar]
- 15.Noori A, Magdamo C, Liu X, et al. Development and evaluation of a natural language processing annotation tool to facilitate phenotyping of cognitive status in electronic health records: diagnostic study. Journal of Medical Internet Research. 2022;24(8):e40384. [DOI] [PMC free article] [PubMed] [Google Scholar]
- 16.Ford E, Nicholson A, Koeling R, et al. Optimising the use of electronic health records to estimate the incidence of rheumatoid arthritis in primary care: what information is hidden in free text? BMC medical research methodology. 2013;13(1):1–12. [DOI] [PMC free article] [PubMed] [Google Scholar]
- 17.Price SJ, Stapley SA, Shephard E, Barraclough K, Hamilton WT. Is omission of free text records a possible source of data loss and bias in Clinical Practice Research Datalink studies? A case-control study. BMJ open. 2016;6(5). [DOI] [PMC free article] [PubMed] [Google Scholar]
- 18.Daniel Capurro M, Erik van Eaton M, Black R. Availability of Structured and Unstructured Clinical Data for Comparative Effectiveness Research and Quality Improvement: A Multi-Site Assessment. [DOI] [PMC free article] [PubMed]
- 19.Wang Y, Wang L, Rastegar-Mojarad M, et al. Clinical information extraction applications: a literature review. Journal of biomedical informatics. 2018;77:34–49. [DOI] [PMC free article] [PubMed] [Google Scholar]
- 20.Steindel SJ. International classification of diseases, clinical modification and procedure coding system: descriptive overview of the next generation HIPAA code sets. Journal of the American Medical Informatics Association. 2010;17(3):274–282. [DOI] [PMC free article] [PubMed] [Google Scholar]
- 21.Ye E, Sun H, Leone MJ, et al. Association of sleep electroencephalography-based brain age index with dementia. JAMA network open. 2020;3(9):e2017357–e2017357. [DOI] [PMC free article] [PubMed] [Google Scholar]
- 22.Rajaraman A, Ullman JD. Mining of massive datasets. Autoedicion; 2011.
- 23.Sparck Jones K. A statistical interpretation of term specificity and its application in retrieval. Journal of documentation. 1972;28(1):11–21. [Google Scholar]
- 24.Saito T, Rehmsmeier M. The precision-recall plot is more informative than the ROC plot when evaluating binary classifiers on imbalanced datasets. PloS one. 2015;10(3):e0118432. [DOI] [PMC free article] [PubMed] [Google Scholar]
- 25.Hane CA, Nori VS, Crown WH, Sanghavi DM, Bleicher P. Predicting onset of dementia using clinical notes and machine learning: case-control study. JMIR medical informatics. 2020;8(6):e17819. [DOI] [PMC free article] [PubMed] [Google Scholar]
- 26.Ford E, Carroll JA, Smith HE, Scott D, Cassell JA. Extracting information from the text of electronic medical records to improve case detection: a systematic review. Journal of the American Medical Informatics Association. 2016;23(5):1007–1015. [DOI] [PMC free article] [PubMed] [Google Scholar]
- 27.Lam RW, Kennedy SH, McIntyre RS, Khullar A. Cognitive dysfunction in major depressive disorder: effects on psychosocial functioning and implications for treatment. The Canadian Journal of Psychiatry. 2014;59(12):649–654. [DOI] [PMC free article] [PubMed] [Google Scholar]
- 28.Hamdy RC, Kinser A, Dickerson K, et al. Insomnia and mild cognitive impairment. Gerontology and Geriatric Medicine. 2018;4:2333721418778421. [DOI] [PMC free article] [PubMed] [Google Scholar]
- 29.McKhann G, Drachman D, Folstein M, Katzman R, Price D, Stadlan EM. Clinical diagnosis of Alzheimer’s disease: Report of the NINCDS-ADRDA Work Group* under the auspices of Department of Health and Human Services Task Force on Alzheimer’s Disease. Neurology. 1984;34(7):939–939. [DOI] [PubMed] [Google Scholar]
- 30.McKhann GM, Knopman DS, Chertkow H, et al. The diagnosis of dementia due to Alzheimer’s disease: Recommendations from the National Institute on Aging-Alzheimer’s Association workgroups on diagnostic guidelines for Alzheimer’s disease. Alzheimer’s & dementia. 2011;7(3):263–269. [DOI] [PMC free article] [PubMed] [Google Scholar]
- 31.Jack CR Jr, Bennett DA, Blennow K, et al. NIA-AA research framework: toward a biological definition of Alzheimer’s disease. Alzheimer’s & Dementia. 2018;14(4):535–562. [DOI] [PMC free article] [PubMed] [Google Scholar]
- 32.Jack CR Jr, Bennett DA, Blennow K, et al. A/T/N: an unbiased descriptive classification scheme for Alzheimer disease biomarkers. Neurology. 2016;87(5):539–547. [DOI] [PMC free article] [PubMed] [Google Scholar]
- 33.Reuben DB, Hackbarth AS, Wenger NS, Tan ZS, Jennings LA. An Automated Approach to Identifying Patients with Dementia Using Electronic Medical Records. Journal of the American Geriatrics Society. 2017;65(3):658–659. [DOI] [PubMed] [Google Scholar]
- 34.Wei W-Q, Teixeira PL, Mo H, Cronin RM, Warner JL, Denny JC. Combining billing codes, clinical notes, and medications from electronic health records provides superior phenotyping performance. Journal of the American Medical Informatics Association. 2016;23(e1):e20–e27. [DOI] [PMC free article] [PubMed] [Google Scholar]
- 35.Xu J, Wang F, Xu Z, et al. Data-driven discovery of probable Alzheimer’s disease and related dementia subphenotypes using electronic health records. Learning Health Systems. 2020;4(4):e10246. [DOI] [PMC free article] [PubMed] [Google Scholar]
Associated Data
This section collects any data citations, data availability statements, or supplementary materials included in this article.
Data Availability Statement
All data and computer code used to produce the figures and tables will be available at the time of publication here: (https://github.com/rockey1006/Automated_ADRD-MCI) and here (https://bdsp.io/projects/jpCoV5N1MsB9a5QsgprQ/).


