Abstract
Classical niche-assembly models propose that the composition of biotic communities in continental landscapes is determined chiefly by the autecology of species, interspecific competition, and the diversity of resources and habitats within a region. In contrast, stochastic models propose that simulation algorithms can replicate the macroecological patterns, if not the mechanisms, of community assembly. Despite fundamental differences in assumptions, both categories of models assume that species are drawn from regional source pools. We explored the implications of source pool geometry on the assembly of avian communities with an analysis of assemblage dispersion fields, which can be visualized by overlaying the geographic ranges of all species that occur in an assemblage. Contours of species richness surrounding focal quadrats illustrate the decay rate of assemblage similarity with distance and the probable geometry of assemblage source pools. We used a geographic database for 2,891 species of South American birds to characterize dispersion fields for assemblages sampled by 1° latitude-longitude quadrats (n = 1,676). We show that the median range size of dispersion fields varies by an order of magnitude across the continent. Because abundance generally correlates with geographic range size within taxonomic groups, the number of individuals per species in avifaunal source pools must also vary by an order of magnitude. Most significantly, dispersion field geometry was surprisingly asymmetrical and exhibited complex geographical patterns that were associated with the distribution of biomes. These results are broadly consistent with the predictions of niche-assembly models but offer little support for stochastic assembly models.
Keywords: assemblage dispersion fields, birds
Few subjects in ecology have garnered as much attention or evoked as much debate as the assembly of biotic communities (1–7). The principal axis of controversy concerns the role of deterministic and stochastic processes in structuring local and regional assemblages of species (4, 8, 9). The classical Gleasonian explanation holds that species are adapted to particular environments (10–12), whereas geographic range size and the composition of plant and animal communities are largely determined by the autecology of species (10), the distribution of resources and habitats, and historical factors that mold the species pool (13–15). On the other hand, competition-assembly models implicitly acknowledge the importance of habitat but argue that interspecific competition and resource exploitation (16–18) along with priority effects during colonization (19) are the primary determinates of community assembly. Because macroecological patterns generated by Gleasonian processes and those resulting from interspecific competition may be indistinguishable at coarse grain sizes in continental landscapes, these ecological mechanisms may be combined in an omnibus niche-assembly model.
At the opposite end of the theoretical continuum, the proponents of stochastic assembly models hypothesize that the statistical properties of real biotic assemblages, if not the assembly process itself, can be replicated by simulation algorithms. Stochastic assembly models can be roughly categorized as either null or neutral models. Null models generate patterns by randomizing ecological data or sampling randomly from a known or theoretical distribution (3, 20–22). By holding certain elements of the data constant, and permitting the variable of interest to fluctuate stochastically, a null model creates new assemblage patterns that are designed to simulate a pattern that would be expected in the absence of a particular ecological mechanism. The heuristic value of such models lies in their simplicity, capacity to generate statistical distributions for hypothesis testing, and ability to cast sharp distinctions between pattern and process.
Neutral models (9, 23–26) constitute a special class of null models in which all species are assumed to be ecologically and demographically equivalent and where the fundamental simulation parameters for birth, death, immigration, and speciation are permitted to vary within limits until observed patterns are matched. Neutral theory predicts that regional variation in species richness results from a balance between speciation and stochastic extinction events caused by random drift in population size. Although the equivalence assumptions are demonstrably incorrect (9, 23), neutral models have been applied successfully in relatively small, homogeneous patches of habitat to sessile organisms such as rainforest trees (25). However, their capacity to simulate complex continental patterns of species diversity in heterogeneous environments remains largely untested (27). Despite fundamental differences in the assumptions underlying stochastic assembly models and classical niche-assembly models, all assume that local assemblages of species are largely derived from external source pools.
In this article, we explore the implications of source pool geometry on the assembly of avian communities. Our database consisted of breeding range maps for 2,891 species of South American land and freshwater birds (classified in 64 avian families), compiled at the resolution of 1° × 1° quadrats (latitude-longitude) (28). Quadrats of this size typically overlap a number of distinctive habitats. The fundamental analytical unit in this article is the assemblage dispersion field, which can be visualized by overlaying the geographic ranges of all species, one at a time, that occur in a specified quadrat (n = 1,676 in South America). Contours of the cumulative species richness around a focal quadrat summarize complex patterns of avifaunal assembly. The height of the unimodal peak (z-axis) at the focal quadrat depicts the maximal species richness, whereas the contour slope along any specified vector estimates the rate of decay of assemblage similarity with distance. An assemblage dispersion field illustrates the probable geometry of the source pool for local assemblages of species sampled from smaller areas within a focal quadrat, whereas spatial patterns in the continental lattice of dispersion fields shed light on the ecological and evolutionary mechanisms underlying avifaunal assembly. An important distinction between assemblage dispersion fields and biotic source pools must be pointed out. Although the former illustrates the known geographic distributions of organisms that occur in a focal quadrat, the latter is a theoretical concept that represents the community of species that has a reasonable probability of colonizing a focal quadrat. The graphical approach embodied by assemblage dispersion fields bears similarities to the isodensity maps developed by Rapoport (29); however, proportional transformation of species richness maps to create isodensity projections removes crucial information pertinent to the discussion of biotic assembly.
Classical niche-assembly theory (10–12) makes a simple prediction about the geometry of assemblage dispersion fields in continental landscapes. If the composition of avian communities is governed deterministically by the autecology of species and the distribution of habitats, then the size and shape of assemblage dispersion fields will vary geographically in concert with spatial turnover of habitats and the distribution of biomes. In contrast, stochastic assembly models do not offer clear-cut predictions about dispersion field geometry or the spatial configuration of biotic source pools. However, if avian assemblages are randomly drawn from regional source pools according to distance decay probabilities, then the geometry of assemblage dispersion fields will be minimally influenced by the distribution of habitats and spatial configuration of biomes.
Methods
Geographic Ranges. South America supports between a quarter and a third of the living species of birds. We used an updated version (June 26, 2003) of the comprehensive geographic range database for land and freshwater species (n = 2,891) outlined in ref. 28. Maps for each species represent a conservative extent-of-occurrence extrapolation of the breeding range at a resolution of 1° × 1° quadrats (latitude-longitude), based on museum specimens (see Supporting Text, which is published as supporting information on the PNAS web site), published sight records, and spatial distribution of habitats between documented records. The worldmap computer program, version 4.19.12 (1998, P. H. Williams, Natural History Museum, London) was used to overlay the distributional data (531,553 species per quadrat records). Unless otherwise indicated, assemblage refers to the set of species occurring in a 1° quadrat.
We categorized breeding species as endemic or nonendemic depending on whether their global breeding ranges occurred entirely within the political boundaries of South America (including its land-bridge islands). We combined endemic (n = 2,248) and nonendemic species (n = 643) in analyses for three reasons: (i) South America is among the most isolated continental landmasses, excepting Antarctica; (ii) nonendemic species form an integral part of avifaunal assemblages; and (iii) the phylogenetic relationships of extralimital populations of many South American species are uncertain. We performed the analyses under the assumption that the exclusion of extralimital populations of nonendemic species had only minor influence on the observed patterns in quadrats east of the Andes Mountains.
Assemblage Dispersion Fields. We constructed an assemblage dispersion field for each 1° quadrat in South America (n = 1,676) by superimposing the geographic ranges of all species that occurred in the quadrat. The geometry of dispersion fields can be measured in many ways. In this analysis, we evaluated the spatial variation in the shape and central tendency of range-size frequency distributions (log10-transformed data) of dispersion fields with simple measures of the second (estimated by standard deviation), third (g1, skewness), and fourth (g2, kurtosis) statistical moments about mean (30). The frequency distribution of range size for any assemblage of species results ultimately from the counterbalancing processes of speciation and extinction (29, 31, 32). We did not directly address either of these processes or the dispersal abilities of species even though immigration is a key mechanistic link between regional source pools and local assemblages. Similarly, we do not discuss scalar variation in range-size frequency distributions. Instead, we focus on the statistical characteristics and environmental correlates of dispersion fields for contemporary assemblages of species occurring in 1° quadrats. Although there is little theoretical reason to expect assemblage dispersion fields to exhibit log-normal range-size frequency distributions, given the spatial complexity of ecological and evolutionary processes that govern community assembly, deviations from log normality (32–34) provide a convenient benchmark by which to evaluate continental patterns of dispersion field geometry. Negative values of g1 denote skewness to the left; a positive g1 denotes skewness to the right. Skewness coefficients were considered to be significant if the absolute value of g1, divided by the standard error of g1, was >2.0. Negative values of g2 indicate a flattened platykurtic distribution, whereas positive values of g2 indicate leptokurtosis, an excess of counts in the tails relative to a normal distribution. Kurtosis coefficients were considered to be significant if the absolute value of g2, divided by the standard error of g2, was >2.0.
Dispersion field “volume” was computed by multiplying the number of species occurring in each quadrat by the mean range size of the component species. Because local and global abundance of species are positively associated with geographic range size (35–37), this statistic provides a qualitative estimate of the relative number of ecologically equivalent individuals (JM) available for colonization in a particular quadrat under the assumptions of neutral theory (9).
Topographic relief [maximum minus minimum elevation (m) recorded in each quadrat] was derived from the Global Land One-Kilometer Base Elevation (GLOBE) Digital Elevation Model (38)(www.ngdc.noaa.gov/mgg/topo/globe.html). Habitat diversity was estimated by counting the number of distinct ecosystems in each quadrat from a recently published map of global ecosystems (39) (http://edcdaac.usgs.gov/glcc/sadoc1_2.asp), which recognized 94 ecosystem classes worldwide derived from 1-km advanced very high-resolution radiometer data spanning a 12-month period (April 1992–March 1993). Of these, 35 distinct ecosystems are represented in mainland South America. We examined the strength of relationships among range-size parameters, topography, and ecosystem diversity with Spearman rank correlation coefficients (rs). Because small correlation coefficients (rs > 0.04) were statistically significant (P < 0.05) because of the large number of quadrats (n = 1,676), we present and emphasize rs coefficients rather than P values.
Results and Discussion
Range-Size Characteristics of the Continental Species Pool. The vast majority of South American birds have small geographic ranges relative to the area of the domain, as reflected by median range size (60.5 quadrats) of the continental species pool (see Fig. 7, which is published as supporting information on the PNAS web site). Unlike most published range-size distributions (32), the observed mode (two quadrats) is not the smallest range-size class (one quadrat). Nearly 97% of species occur in more than one 1° quadrat, but just 7.2% of species (n = 120) have geographic ranges that cover at least half of South America (≥838 quadrats). Only three species (Phalacrocorax brasilianus, Cathartes aura, and Troglodytes aedon) occur in >90% of the quadrats. Frequency distributions of untransformed range size are strongly right-skewed (g1 = 2.169) and leptokurtic (g2 = 4.681) (Fig. 7a). Log10-transformed range size deviates significantly from the log normal with a platykurtic (g2 = –0.647) frequency distribution skewed to the left (g1 = –0.214) (Fig. 7b). The mild left-hand skew of log-transformed data, signifying an excess of small ranges, is a recurrent pattern of log-transformed range size for continental faunas (31, 32).
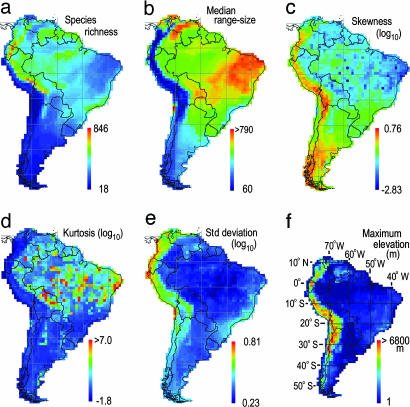
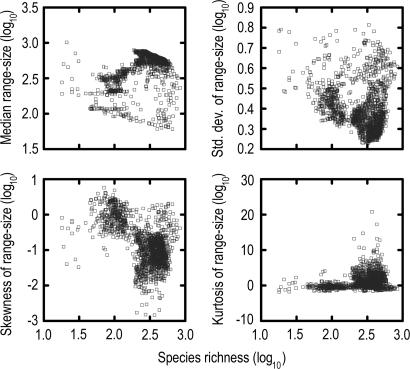
Assemblage Dispersion Field Parameters Vary with Species Richness. The species richness of avian assemblages sampled by 1° quadrats in South America varies from 18 to 846 species (median = 337). Pronounced peaks of species richness occur in humid montane regions at tropical latitudes (Fig. 1), particularly along the eastern versant of the Andes Mountains in Colombia, Ecuador, Peru, and Bolivia, where values are ≈30–250% greater than those recorded at equivalent latitudes in the Amazon basin (28, 40). The lowest species richness occurs in the Atacama Desert of coastal Chile. Species richness is correlated with topographic relief (rs = –0.19) and ecosystem diversity (rs = 0.19), the latter attributable to beta diversity within quadrats. Statistics associated with assemblage dispersion fields change systematically with regional variation in species richness (Fig. 2). Median range size (rs = 0.22) and kurtosis (rs = 0.34) are positively correlated with species richness whereas skewness (rs = –0.44) and standard deviation (rs = –0.23) are negatively correlated with species richness. However, extensive scatter in the data points (Fig. 2), especially for higher values of species richness (log10 >2.0), indicates that factors other than species richness or statistical artifacts have significant influence on the size and shape of assemblage dispersion fields.
Fig. 1.
Continental patterns of species richness, topography, and range-size frequency distribution parameters for avian assemblages sampled by 1° quadrats (n = 1,676). (a) Species richness. (b) Median range size. (c) Skewness (g1) of range size (log10). (d) Kurtosis (g2) of range size (log10). (e) Standard deviation of range size (log10). (f) Maximum elevation (m).
Fig. 2.
Relationship between species richness and statistical parameters of assemblage dispersion fields (n = 1,676 quadrats) for South American land and freshwater birds.
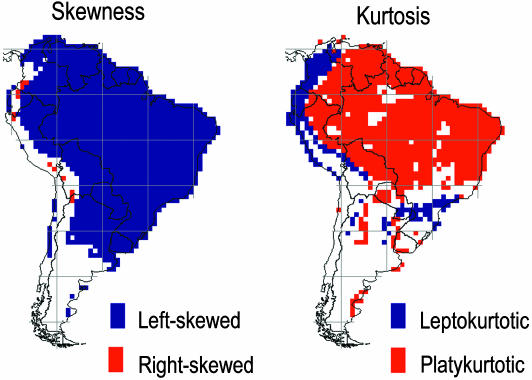
Assemblage Dispersion Fields Are Asymmetrical and Exhibit Complex Continental Patterns. A continental survey reveals that the median range size of dispersion fields (n = 1,676) varies by an order of magnitude (60.5–1,016 quadrats). Median range size correlates with the area of the biome in which the focal quadrat is embedded (Fig. 1). Avian assemblages east of the Andes Mountains are dominated by wide-ranging species, particularly in caatinga, cerrado, and associated low-precipitation biomes (totaling >3.5 million km2) in eastern and south-central Brazil and in the llanos of Venezuela and Colombia. Dispersion fields in the Andes exhibit small median range size, notwithstanding an 8-fold variation in species richness observed between the Equator and Tierra del Fuego (56° S). Dispersion fields embedded in the vast Amazonian moist forest biome (≈5 million km2) are four to seven times larger than those in the Andes at equivalent latitudes. Range-size frequency distributions are left-skewed over much of the lowland regions of the continent (Fig. 3). Significantly right-skewed distributions occur only in the Andes.
Fig. 3.
Geographic patterns of significant values for skewness (g1) and kurtosis (g2) of range-size frequency distributions of assemblage dispersion fields; 1° quadrats with nonsignificant values are depicted in white.
Range-size parameters of dispersion fields exhibit spatial autocorrelation and significant patterns of covariation that are easily visualized along longitudinal transects (see Fig. 8, which is published as supporting information on the PNAS web site). Median range size correlates negatively with standard deviation (rs =–0.68) and skewness (rs =–0.81) but correlates positively with kurtosis (rs = 0.69) (see Fig. 9, which is published as supporting information on the PNAS web site). Spatial patterns of kurtosis are complementary to measures of skewness (rs = –0.91) (Fig. 3).
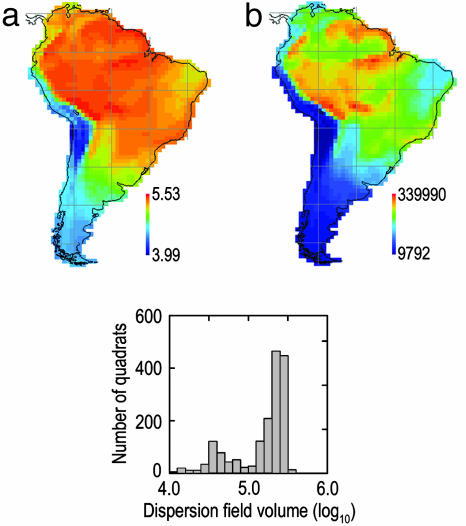
Dispersion field volume (number of species × mean range size) exhibits significant geographic variation in South America (9,792 to 339,990)(Fig. 4). If species are demographically and ecologically equivalent, the paramount assumption of neutral assembly theory, then the number of individuals available for colonization in avian communities enclosed by 1° quadrats varies spatially by an order of magnitude or more. The frequency distribution of dispersion field volume (log10) is bimodal and left-skewed (g1 = –1.308). Dispersion field volume is high over much of the Amazon basin with localized peaks in southeastern Peru–northwestern Bolivia, on the frontier between Bolivia and the Mato Grosso, and along the lower Amazon River. The lowest values occur in the high Andes from southern Peru to northwestern Chile and Argentina.
Fig. 4.
Frequency distribution and geographic variation of dispersion field volume. (a) Log10-transformed data. (b) Untransformed data.
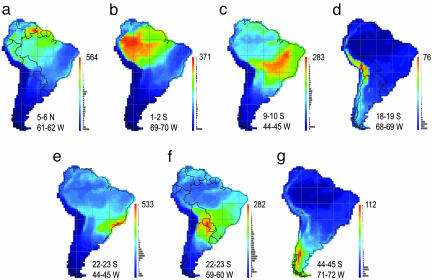
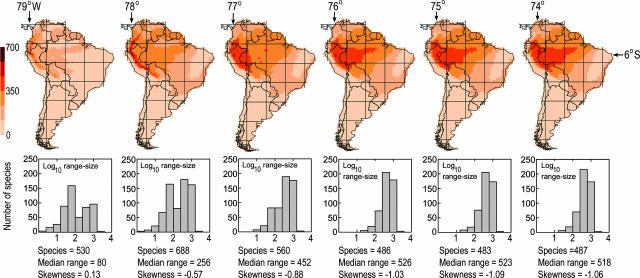
Topographic relief is significantly associated with median range size (rs = –0.42), standard deviation (rs = 0.62), skewness (rs = 0.33), and kurtosis (rs =–0.39) of assemblage dispersion fields. The influence of topography on dispersion field geometry was anticipated because of the linear geographic ranges of Andean taxa (41–44), but the pervasiveness of dispersion field asymmetry was unexpected, particularly for assemblages of species sampled from the interior of the largest lowland biomes (Fig. 5). For example, dispersion fields in Amazonia are significantly influenced by the distributions of ≈70 nonaquatic species that are restricted to riverine habitats in the Amazon-Orinoco-Guiana lowlands (45). In general, the asymmetry of dispersion fields increases from the center to the perimeter of spatially extensive biomes as a result of nonrandom sampling of the regional species pool. If assemblages were randomly drawn from regional source pools, one of the primary null hypotheses of stochastic assembly models (3), dispersion fields would closely resemble spreading dye patterns (46) with relatively uniform rates of assemblage decay radiating in all directions from the focal quadrat. The spatial transition in dispersion field geometry is particularly rapid across steep environmental gradients, reflecting species turnover and the configuration of biomes. The steepest transition zone occurs across the foothills of the Andes (Fig. 6).
Fig. 5.
Assemblage dispersion fields sampled from selected biomes. (a) Gran Sabana. (b) Amazonian humid forest. (c) Caatinga. (d) Puna. (e) Atlantic humid coastal forest. (f) Chaco. (g) Valdivian temperate rain forest. Species richness scales and spatial coordinates of quadrats, respectively, are located at the right and bottom of each panel.
Fig. 6.
Assemblage dispersion fields sampled along a longitudinal transect (bracketed by 5–6° S and 73–79° W) extending from the crest of the Andes Mountains eastward to the Amazonian lowlands.
Contrary to the predictions of Rapoport's rule (29, 47), median range size of dispersion fields decreases with latitude (rs =–0.42) and longitude (rs =–0.67) because of the substantial number of species with large geographic ranges in eastern and central Brazil (Fig. 1). The area of 1° quadrats varies from 12,308 km2 (equator) to 7,036 km2 (56°S) within South America. Owing to the shape of the continent, 70.6% of 1° quadrats occur at tropical latitudes (≤24° latitude; quadrat area ≥11,312 km2). Because of latitudinal variation in quadrat area, geographic range sizes of species restricted to tropical latitudes are underestimated relative to the range sizes of species endemic to higher latitudes. This bias strengthens one of the principal findings of our study; the size of assemblage dispersion fields from eastern and central Brazil is unusually large relative to those observed in the Andes and at higher latitudes (>35° S).
Assemblage Dispersion Fields Illustrate the Probable Geometry of Regional Source Pools. Source pool designation has a strong effect on the outcome of null assembly models (3, 48, 49). Since the concept of regional source pools was introduced >75 years ago (50–53) in the analysis of species/genus ratios in local assemblages, the biological realism, extent, and geometry of biotic source pools has been the subject of controversy (3, 48, 49, 54–56). In typical null models, real species are drawn from a biotic source pool that includes all species that are deemed to have a reasonable probability of occurring in the focal assemblage (3). Most formulations of source pools are limited to lists of species known to occur in geopolitical regions (50) or biogeographic provinces (52, 53) without reference to habitat or distance from the local assemblage (57, 58). Although some null model analyses explicitly acknowledged habitat diversity and used geometrically standardized source pools in comparative analyses (3, 48), there have been few substantive innovations in source pool construction for assembly models during the past two decades (3, 4). Nevertheless, source pool construction provides a rigorous platform for model evaluation and hypothesis testing.
In contrast, neutral assembly models randomly draw a fixed number of individuals from an imaginary source pool composed of JM individuals (the sum of the population sizes of all species in the metacommunity) with identical ecological and demographic characteristics (9, 23–25, 59). However, because the dimensions and spatial configuration of metacommunities are vague and unspecified in neutral theory, it is uncertain how the number of individuals and species in the external species pool can be objectively determined. Moreover, neutral assembly models make no assumptions about the position of the focal assemblage within a biome, local and regional patterns of environmental heterogeneity, variation in geographic range size of species, or geographic variation in source pools (60). Thus, it would appear that neutral models as envisioned by Hubbell (9) are inapplicable to the analysis of community assembly unless source pool geometry is explicitly addressed.
Assemblage dispersion fields provide explicit spatial diagrams of probable source pool geometry for local assemblages of species sampled from smaller areas within focal quadrats. Several findings in this article have far-reaching implications for assembly models. First, the range-size frequency distributions for the vast majority of assemblages in South America depart from log normality and exhibit strong regional patterns. If local and global abundances of species are generally correlated with geographic range size (35–37), then species-abundance distributions of assemblage source pools are similarly skewed. Further, because species-area relationships are correlated with species-abundance distributions (33, 34), geographic variation in dispersion fields indicates that species-area curves (61) will also exhibit remarkable regional variation in South America. Second, the median range size of assemblage dispersion fields varies by an order of magnitude. This finding indicates that the number of individuals per species as well as the total number of individuals in regional source pools varies geographically by an order of magnitude. Third, the ubiquitous asymmetry of dispersion fields indicates that avian assemblages are not randomly drawn from regional source pools on the basis of distance decay probabilities. Finally, geographic variation in dispersion field geometry correlates with the configuration and area of major biomes in which assemblages are embedded. These findings collectively suggest not only that habitat diversity may impose a ceiling on the number of individuals and species available for colonization in any given quadrat but that the relationship between local and regional species richness in continental landscapes depends on local and regional habitat diversity (8, 62).
The universal asymmetry of assemblage dispersion fields, asymmetry that is associated with the distribution of biomes, provides strong evidence that the assembly of avifaunas is governed deterministically by the autecology of species and the distribution of habitats (11, 12, 48, 63) rather than by a lottery process that draws species randomly from the surrounding region (6, 9, 20). A majority of neotropical avian species are habitat specialists (43, 45, 64–66), and habitat selection is known to play a pivotal role in avian community assembly (63). Interspecific competition may influence microhabitat selection in local avian communities (65, 67, 68) but this process is probably undetectable in presence-absence data compiled at the scale of resolution examined in this study. Although the signature of historical events and speciation is clearly manifest in the distributional patterns of species at the 1° scale of resolution (15, 41, 69) we hypothesize that the distribution of biomes, which modulates the mode and tempo of speciation and extinction (15, 41, 42, 70), and habitat specialization are the primary determinants of contemporary range size of avian species and consequently of the geometry of assemblage dispersion fields. These observations are consistent with predictions of classical niche-assembly models but provide little support for neutral theory or other stochastic assembly models (3, 9, 24, 25).
This is not to say that stochastic processes are unimportant in the macroecological assembly of avian communities. Rather, the distributional fingerprint of stochastic processes may be difficult to detect in species assemblages compiled at coarse grain sizes (e.g., 1° quadrats) in continental landscapes because habitat selection and the distribution of habitats are such powerful determinants of the community composition (63). Null models may provide appropriate null hypotheses for avifaunal assembly (2–4, 20, 22, 68); however, simulation algorithms that fail to properly couch the null hypothesis by factoring in the distribution and diversity of habitats within focal sampling quadrats and regional source pools will be biased against finding support (type-I error) for the role of stochastic processes in community assembly (3, 48).
Supplementary Material
Acknowledgments
We thank M. Bjerrum, M. O. Rasmussen, and F. Skov for geographic information systems assistance in compiling data and N. J. Gotelli, J.-A. Grytnes, B. McGill, M. Lomolino, T. Romdal, and two anonymous reviewers for critically reviewing the manuscript. P. Williams kindly provided the worldmap software used to manage the distributional data and generate figures. For sources of museum specimen data, see Supporting Text. The Smithsonian Research Opportunities Fund supported G.R.G.'s travel to Copenhagen. The Danish Natural Science Research Council (Grant J. 11-0390) supported C.R.'s travel to Washington. G.R.G. was supported by the Alexander Wetmore Fund of the Smithsonian Institution. C.R. acknowledges the Danish National Science Foundation (Grant J. 21-03-0221) for support of macroecological research.
Author contributions: G.R.G. and C.R. designed research; G.R.G. and C.R. performed research; G.R.G. contributed new reagents/analytic tools; G.R.G. analyzed data; and G.R.G. wrote the paper.
This paper was submitted directly (Track II) to the PNAS office.
References
- 1.Cody, M. L. & Diamond, J. M. (1975) Ecology and Evolution of Communities (Harvard Univ. Press, Cambridge, MA).
- 2.Strong, D. R., Simberloff, D., Abele, L. G. & Thistle, A. B. (1984) Ecological Communities: Conceptual Issues and the Evidence (Princeton Univ. Press, Princeton).
- 3.Gotelli, N. J. & Graves, G. R. (1996) Null Models in Ecology (Smithsonian Institution, Washington, DC).
- 4.Weiher, E. & Keddy, P. (1999) Ecological Assembly Rules: Perspectives, Advances, Retreats (Cambridge Univ. Press, Cambridge, U.K.).
- 5.Brown, J. H. & Maurer, B. A. (1989) Science 243, 1145–1150. [DOI] [PubMed] [Google Scholar]
- 6.MacArthur, R. H. & Wilson, E. O. (1967) The Theory of Island Biogeography (Princeton Univ. Press, Princeton).
- 7.Ricklefs, R. E. (2004) Ecol. Lett. 7, 1–15. [Google Scholar]
- 8.Ricklefs, R. E. & Schluter, D. (1993) Species Diversity in Ecological Communities (University of Chicago, Chicago).
- 9.Hubbell, S. P. (2001) The Unified Neutral Theory of Biodiversity and Biogeography (Princeton Univ. Press, Princeton).
- 10.Gleason, H. A. (1926) Bull. Torrey Botan. Club 53, 7–26. [Google Scholar]
- 11.Grinnell, J. (1917) Am. Nat. 51, 115–128. [Google Scholar]
- 12.James, F. C., Johnston, R. F., Wamer, N. G., Niemi, G. J. & Boecklen, W. J. (1984) Am. Nat. 124, 17–30. [Google Scholar]
- 13.Qian, H. & Ricklefs, R. E. (2000) Nature 407, 180–182. [DOI] [PubMed] [Google Scholar]
- 14.Pielou, E. C. (1991) After the Ice Age: The Return of Life to Glaciated North America (University of Chicago, Chicago).
- 15.Haffer, J. (1974) Avian Speciation in Tropical South America, with a Systematic Survey of the Toucans (Ramphastidae) and Jacamars (Galbulidae) (Nuttall Ornithological Club, Cambridge, MA).
- 16.MacArthur, R. H. (1972) Geographical Ecology (Harper & Row, New York).
- 17.Diamond, J. M. (1975) in Ecology and Evolution of Communities, eds. Cody, M. L. & Diamond, J. M. (Harvard Univ. Press, Cambridge, MA), pp. 342–444.
- 18.Gilpin, M. E., Carpenter, M. P. & Pomerantz, M. J. (1986) in Community Ecology, eds. Case, T. J. & Diamond, J. M. (Harper & Row, New York).
- 19.Drake, J. A. (1990) Trends Ecol. Evol. 5, 159–164. [DOI] [PubMed] [Google Scholar]
- 20.Connor, E. F. & Simberloff, D. (1979) Ecology 60, 1132–1140. [Google Scholar]
- 21.Harvey, P. H., Colwell, R. K., Silverton, J. W. & May, R. M. (1983) Annu. Rev. Ecol. System. 14, 189–211. [Google Scholar]
- 22.Colwell, R. K. & Winkler, D. W. (1984) in Ecological Communities: Conceptual Issues and the Evidence, eds. Strong, D. R., Simberloff, D., Abele, L. G. & Thistle, A. B. (Princeton Univ. Press, Princeton), pp. 344–359.
- 23.Bell, G. (2001) Science 293, 2413–2418. [DOI] [PubMed] [Google Scholar]
- 24.Hubbell, S. P. (1979) Science 203, 1299–1309. [DOI] [PubMed] [Google Scholar]
- 25.Hubbell, S. P. (1997) Coral Reefs 16, S9–S21. [Google Scholar]
- 26.Caswell, H. (1976) Ecol. Monogr. 46, 327–354. [Google Scholar]
- 27.Condit, R., Pitman, N., Leigh, E. G., Chave, J., Terborgh, J., Foster, R. B., Núñez-V., P., Aguilar, S., Valencia, R., Villa, G., et al. (2002) Science 295, 666–669. [DOI] [PubMed] [Google Scholar]
- 28.Rahbek, C. & Graves, G. R. (2001) Proc. Natl. Acad. Sci. USA 98, 4534–4539. [DOI] [PMC free article] [PubMed] [Google Scholar]
- 29.Rapoport, E. H. (1975) Areographía: Estratregias Geográficas de las Especies (Fondo de Cultura Económica, Mexico City).
- 30.Sokal, R. R. & Rohlf, F. J. (1981) Biometry: The Principles and Practice of Statistics in Biological Research (Freeman, San Francisco).
- 31.Brown, J. H., Stevens, G. C. & Kaufman, D. M. (1996) Annu. Rev. Ecol. System 27, 597–623. [Google Scholar]
- 32.Gaston, K. J. (1998) Philos. Trans. R. Soc. London B 353, 219–230. [Google Scholar]
- 33.May, R. M. (1975) in Ecology and Evolution of Communities, eds. Cody, M. L. & Diamond, J. M. (Harvard Univ. Press, Cambridge, MA), pp. 81–120.
- 34.Preston, F. W. (1962) Ecology 43, 185–215. [Google Scholar]
- 35.Hanski, I. (1982) Oikos 38, 210–221. [Google Scholar]
- 36.Bock, C. E. & Ricklefs, R. E. (1983) Am. Nat. 122, 295–299. [Google Scholar]
- 37.Brown, J. H. (1984) Am. Nat. 124, 255–279. [Google Scholar]
- 38.Hastings, D. A., Dunbar, P. K., Elphingstone, G. M., Bootz, M., Murakami, H., Maruyama, H., Masaharu, H., Holland, P., Payne, J., Bryant, N. A., et al. (1999) Global Land One-Kilometer Base Elevation (GLOBE) Digital Elevation Model (National Oceanic and Atmospheric Administration, National Geophysical Data Center, Boulder, CO).
- 39.Olsen, J. S. (1994) Global Ecosystem Framework-Definitions, U.S. Geological Society Earth Resources Observation Satellite Data Center Internal Report (U.S. Geological Society Earth Resources Observation Satellite Data Center, Sioux Falls, IA).
- 40.Rahbek, C. & Graves, G. R. (2000) Proc. R. Soc. London Ser. B 267, 2259–2265. [DOI] [PMC free article] [PubMed] [Google Scholar]
- 41.Graves, G. R. (1985) Auk 102, 556–579. [Google Scholar]
- 42.Graves, G. R. (1988) Auk 105, 47–52. [Google Scholar]
- 43.Fjeldså, J. & Krabbe, N. (1990) Birds of the High Andes (Zoological Museum, University of Copenhagen, Copenhagen).
- 44.Ruggiero, A. (2001) J. Biogeogr. 28, 1281–1294. [Google Scholar]
- 45.Remsen, J. V. & Parker, T. A. (1983) Biotropica 15, 223–231. [Google Scholar]
- 46.Jetz, W. & Rahbek, C. (2002) Science 297, 1548–1551. [DOI] [PubMed] [Google Scholar]
- 47.Stevens, G. C. (1989) Am. Nat. 133, 240–256. [Google Scholar]
- 48.Graves, G. R. & Gotelli, N. J. (1983) Oikos 41, 322–333. [Google Scholar]
- 49.Schoener, T. W. (1988) Evol. Ecol. 2, 1–26. [Google Scholar]
- 50.Palmgren, A. (1925) Acta Botan. Fennica 1, 1–143. [Google Scholar]
- 51.Maillefer, A. (1929) Mémoires Soc. Vaudoise Sci. Nat. 3, 113–183. [Google Scholar]
- 52.Elton, C. (1946) J. Anim. Ecol. 15, 54–68. [Google Scholar]
- 53.Williams, C. B. (1947) J. Anim. Ecol. 16, 11–18. [Google Scholar]
- 54.Grant, P. R. (1966) Am. Nat. 100, 451–462. [Google Scholar]
- 55.Simberloff, D. (1970) Evolution 24, 23–47. [DOI] [PubMed] [Google Scholar]
- 56.Strong, D. R., Szyska, L. A. & Simberloff, D. (1979) Evolution 33, 897–913. [DOI] [PubMed] [Google Scholar]
- 57.Faaborg, J. (1979) J. Appl. Ecol. 16, 99–107. [Google Scholar]
- 58.Gotelli, N. J. & Abele, L. G. (1982) J. Biogeogr. 9, 421–435. [Google Scholar]
- 59.Hubbell, S. P. (2003) Oikos 100, 193–199. [Google Scholar]
- 60.Maurer, B. A. (1999) Untangling Ecological Complexity (University of Chicago, Chicago).
- 61.Connor, E. F. & McCoy, E. D. (1979) Am. Nat. 113, 791–833. [Google Scholar]
- 62.Ricklefs, R. E. (1987) Science 235, 167–171. [DOI] [PubMed] [Google Scholar]
- 63.Wiens, J. A. (1989) The Ecology of Bird Communities (Cambridge Univ. Press, Cambridge, MA).
- 64.Parker, T. A., Stotz, D. F. & Fitzpatrick, J. W. (1996) in Neotropical Birds: Ecology and Conservation, eds. Stotz, D. F., Fitzpatrick, J. W., Parker, T. A. & Moskovits, D. K. (University of Chicago, Chicago), pp. 132–291.
- 65.Robinson, S. K. & Terborgh, J. (1995) J. Anim. Ecol. 64, 1–11. [Google Scholar]
- 66.Rosenberg, K. V. (1997) in Studies in Neotropical Ornithology Honoring Ted Parker, ed. Remsen, J. V. (American Ornithologists Union, Washington, DC), pp. 673–699.
- 67.Terborgh, J. & Weske, J. S. (1975) Ecology 56, 562–576. [Google Scholar]
- 68.Graves, G. R. & Gotelli, N. J. (1993) Proc. Natl. Acad. Sci. USA 90, 1388–1391. [DOI] [PMC free article] [PubMed] [Google Scholar]
- 69.Vuilleumier, F. & Simberloff, D. (1980) in Evolutionary Biology, eds. Hecht, M. K., Steere, W. C. & Wallace, B. (Plenum, New York), Vol. 12, pp. 235–379. [Google Scholar]
- 70.Mayr, E. (1963) Animal Species and Evolution (Harvard Univ. Press, Cambridge, MA).
Associated Data
This section collects any data citations, data availability statements, or supplementary materials included in this article.


