

Abstract
Uncertainty about the demographic history of populations can hamper genome-wide scans for selection based on population genetic models. To obtain a portrait of the effects of demographic history on genome variability patterns in Drosophila melanogaster populations, we surveyed noncoding DNA polymorphism at 10 X-linked loci in large samples from three African and two non-African populations. All five populations show significant departures from expectations under the standard neutral model. We detect weak but significant differentiation between East (Kenya and Zimbabwe) and West/Central sub-Saharan (Gabon) African populations. A skew toward high-frequency-derived polymorphisms, elevated levels of linkage disequilibrium (LD) and significant heterogeneity in levels of polymorphism and divergence in the Gabon sample suggest that this population is further from mutation-drift equilibrium than the two Eastern African populations. Both non-African populations harbor significantly higher levels of LD, a large excess of high-frequency-derived mutations and extreme heterogeneity among loci in levels of polymorphism and divergence. Rejections of the neutral model in D. melanogaster populations using these and similar features have been interpreted as evidence for an important role for natural selection in shaping genome variability patterns. Based on simulations, we conclude that simple bottleneck models are sufficient to account for most, if not all, polymorphism features of both African and non-African populations. In contrast, we show that a steady-state recurrent hitchhiking model fails to account for several aspects of the data. Demographic departures from equilibrium expectations in both ancestral and derived populations thus represent a serious challenge to detecting positive selection in genome-wide scans using current methodologies.
Understanding the forces that shape patterns of variability within and between populations and species is a major goal of evolutionary genetics. Since the first survey of sequence-level variation in Drosophila melanogaster (Kreitman 1983), there has been a rapid development of approaches that relate nucleotide data from real populations to existing theoretical population models. These approaches include a number of statistical tests of “neutral” models, as well as methods for estimating selection parameters from patterns of nucleotide polymorphism and divergence and the spatial patterning of this variation across the genome (e.g., Hudson et al. 1987; Tajima 1989; McDonald and Kreitman 1991; Fay and Wu 2000; Kim and Stephan 2002; Przeworski 2003). These approaches hold promise for detecting specific targets of natural selection in the genome and, more generally, in estimating the frequency, timing, and intensity of selection in natural populations.
A serious difficulty in interpreting these model-based approaches is that they depend on the assumption that populations are historically of constant size and are essentially panmictic (i.e., there is extensive gene flow between populations). However, most species probably violate these assumptions. Demographic history, the trajectory of populations over time, can have a profound impact on genome-wide patterns of variability (Maruyama and Fuerst 1985a,b; Tajima 1989). The result is that inferences of parameters under selection models, and even the interpretation of statistical tests of neutrality, are only as reliable as our knowledge of the demographic history of populations.
D. melanogaster has historically served as an important model system both in molecular and evolutionary genetics. This species is thought to have originated in tropical sub-Saharan Africa and only recently colonized temperate habitats (Lachaise et al. 1988). D. melanogaster populations show evidence for considerable differentiation at the nucleotide level. In particular, African populations generally have higher nucleotide diversity than non-African populations (Begun and Aquadro 1993; Andolfatto 2001). This is largely in agreement with the hypothesis that only a subset of African lineages founded non-African populations. The relative importance of selection and purely demographic factors in D. melanogaster populations is currently the subject of considerable debate (Begun and Whitley 2000; Andolfatto 2001; Kauer et al. 2002; Wall et al. 2002; Glinka et al. 2003; Orengo and Aguadé 2004). Much of the recent literature has explicitly assumed, or concluded by other means, that departures from the neutral model observed in non-African populations (e.g., Harr et al. 2002; Glinka et al. 2003; Kauer et al. 2003; Orengo and Aguadé 2004) and some African populations (Andolfatto and Przeworski 2001; Baines et al. 2002; Mousset et al. 2003) are best explained by natural selection and not by demographic history.
However, the demographic history of these species is still far from well understood. For example, the timing of dispersal from Africa (proposed to be 5000 to 10,000 years ago for populations in Europe and Asia, to several hundred years ago for American populations) is uncertain, and largely based on anecdotal evidence (David and Capy 1988; Lachaise et al. 1988). In addition, it is unclear to what extent there is population differentiation at randomly chosen loci within African and among non-African populations. Both of these details will be crucial to inferring how changes in population size associated with range expansion will have influenced genome-wide patterns of variability.
Though preliminary studies have suggested an important role for demographic history (Andolfatto and Przeworski 2000; Przeworski et al. 2001; Wall et al. 2002), these studies generally lacked consistently sampled multilocus data from multiple African and non-African populations. In this study, we present a survey of population-level nucleotide variation that attempts to maximize the number of alleles and populations sampled. Here we document patterns of nucleotide diversity for a mean sample size of 21 alleles per population at ten X-linked noncoding loci in three African (Zimbabwe, Kenya, and Gabon) and two non-African populations (The Netherlands and Pennsylvania, USA). We combine our data with previous published data at 105 additional loci in a geographically more limited survey to address the following questions: (1) Is there evidence for population structure within Africa and among non-African populations? (2) Are all African populations closer to mutation-drift equilibrium than non-African populations? (3) Are changes in population size associated with dispersal from Africa sufficient to account for patterns of polymorphism and divergence? (4) Can simple positive selection models explain nucleotide variability patterns in these populations?
Results
Levels of variability and population structure
Sequence data was collected across ten loci for an average of 21 alleles per population for three African (Zimbabwe, Kenya, and Gabon) and two non-African populations (The Netherlands and Pennsylvania, USA) of D. melanogaster. Summaries of variation for each locus by population are listed in the Supplemental Results. Overall levels of variability were similar across the three African populations, although somewhat lower in Gabon (Fig. 1A). However, both non-African populations show substantial reductions in nucleotide variability relative to African populations and almost all non-African polymorphisms are a subset of those found in Africa. These findings are consistent with the hypothesis that the expansion of D. melanogaster from Africa was accompanied by a reduction in population size and/or selection for adaptation to new environments (Begun and Aquadro 1993; Andolfatto 2001).
Figure 1.

Approximate Bayesian posterior distributions of (A) θ, (B) ρ, and (C) ρ/θ by population based on the 10 loci surveyed. ρ and θ were estimated jointly. N: Netherlands, P: Pennsylvania, G: Gabon, K: Kenya, and Z: Zimbabwe. The modes and 95% confidence intervals are listed in Table 2.
Table 1 shows pairwise values and probabilities of Hudson's nearest neighbor statistic, Snn and the average  (an analog of Fst, see Methods). Significant levels of differentiation, and the highest
  , were found in all comparisons between African and non-African populations. A large contributor to this differentiation is the large difference in levels of diversity; non-African populations have about one-half the diversity of African populations (see Fig. 1A and Table 2). A less obvious result is the significant differentiation between the Central/West African population (Gabon) and both East African populations (Zimbabwe and Kenya), though there is no detectable differentiation between the latter two. In general,
  between the African populations is very low and no fixed differences between populations were observed. This suggests that significant differentiation between the East African populations and the West/Central Africa population is probably not due to long-term population structure.
Table 1.
Pairwise measures of population differentiation. Snn values are presented above the diagonal with P-values in parentheses. K*st values are given below the diagonal
| Zimbabwe | Kenya | Gabon | Netherlands | Pennsylvania | |
|---|---|---|---|---|---|
| Zimbabwe | 0.41 (0.778) | 0.74 (0.007) | 0.87 (<0.001) | 0.84 (<0.001) | |
| Kenya | −0.001 | 0.72 (0.009) | 0.94 (<0.001) | 0.95 (<0.001) | |
| Gabon | 0.011 | 0.011 | 0.89 (<0.001) | 0.89 (<0.001) | |
| Netherlands | 0.076 | 0.083 | 0.076 | 0.64 (0.052) | |
| Pennsylvania | 0.056 | 0.065 | 0.056 | 0.006 |
Table 2.
Mode and 95% confidence intervals for multilocus estimates of ρ and θ by population
| θ (%)
|
ρ (%)
|
ρ/θ
|
||||
|---|---|---|---|---|---|---|
| Population | Mode | 95% CI | Mode | 95% CI | Mode | 95% CI |
| Zimbabwe | 1.2 | 1.0-1.5 | 8.4 | 6.1-12.1 | 6.8 | 4.8-10.1 |
| Kenya | 1.2 | 0.96-1.4 | 8.9 | 6.3-13.0 | 7.6 | 5.2-11.5 |
| Gabon | 0.98 | 0.81-1.2 | 4.7 | 3.2-7.2 | 4.6 | 3.0-7.5 |
| Netherlands | 0.28 | 0.21-0.40 | 1.1 | 0.47-3.1 | 3.4 | 1.5-11.6 |
| Pennsylvania | 0.38 | 0.27-0.53 | 0.2 | 0.03-1.0 | 0.4 | 0.1-2.9 |
An analysis using the program Structure (Pritchard et al. 2000) produced similar findings. Figure 2 shows a representation of how the populations cluster in relation to each other. The two non-African populations cluster together and are distinct from all the African populations, supporting the hypothesis that these two populations either share a unique origin (see also Baudry et al. 2004) or that levels of migration are high among non-African populations. Within Africa, Gabon appears to be distinct from the two East African populations, though Kenya and Zimbabwe are indistinguishable. We found that likelihoods for the number of populations increased up to six populations, though they begin to plateau at around three to four populations (results not shown). This seems to agree well with the results of the Snn analysis.
Figure 2.

Structure analysis of five populations based on the 10 loci surveyed.
Linkage disequilibrium
We investigated relative levels of linkage disequilibrium (LD) in each population by estimating the population recombination parameter, ρ = 4Ner (see Methods for details). Since considerable noise is associated with estimates of ρ for individual loci, we generated posterior distributions of ρ over all loci (Fig. 1B). The modes and 95% confidence intervals of these distributions are listed in Table 2. As is apparent in Figure 1B (and Table 2), The Netherlands and Pennsylvania populations have significantly greater levels of LD than each of the three African populations. Zimbabwe and Kenya have similar levels of LD and have the lowest levels of LD overall. Interestingly, Gabon (a West/Central African population) has somewhat higher levels of LD than the two Eastern African populations. Though the 95% CIs on ρ estimates overlap, the most likely estimate of ρ for Gabon (mode = 0.047 per site) is clearly outside the 95% CIs for both Zimbabwe and Kenya (Table 2).
Since ρ is inversely proportional to expected levels of LD in a population, a large equilibrium population will have lower levels of LD than a smaller one. In line with this prediction, the relative ranking of average levels of LD (Fig. 1B) mimics the relative ranking of levels of diversity (Fig. 1A) rather well. However, are differences in levels of LD among populations solely the result of differences in population size? To address this question, we scale our estimates of ρ by estimates of θ. The rationale for this approach is that ρ/θ estimates should be the same for two equilibrium populations of different sizes. As a result, ρ/θ is a measure of the extent to which LD levels in a population conform to the predictions of the standard neutral model (Hudson 1987; Andolfatto and Przeworski 2000; Wall et al. 2002; Andolfatto and Wall 2003). Differences among populations in this ratio can indicate the influence of nonequilibrium population processes, such as recent population bottlenecks (Wall et al. 2002), population structure or other violations of standard neutral model assumptions (Andolfatto and Przeworski 2000).
Posterior distributions for ρ/θ by population over all loci are shown in Figure 1C (and Table 2; for per locus estimates of ρ/θ see the Supplemental Results). Estimates of ρ/θ are expected to be about 15 for all of the loci surveyed here (based on independent estimates of mutation and recombination rates in D. melanogaster, see Andolfatto and Wall 2003) and equal among populations if they all conform to the standard neutral model. Contrary to this expectation, striking differences among populations are apparent (Fig. 1C). Estimates of ρ/θ for Zimbabwe and Kenya are not distinguishable and appear to be closest to the expectations of the standard neutral model. However, shifts away from the standard neutral model prediction are apparent in Pennsylvania, The Netherlands, and even Gabon. While estimates of ρ/θ in The Netherlands are comparable to those in Gabon, the mode of the distribution of ρ/θ for Pennsylvania is an order of magnitude smaller (4.6, 3.4, and 0.43, for Gabon, The Netherlands and Pennsylvania, respectively). The mode of ρ/θ for Gabon (4.6) is lower than the lower 2.5% confidence bound for both East African populations, suggesting that the most likely value of ρ/θ for Gabon is not compatible with that of the East African populations. A similar conclusion is reached in locus-by-locus comparisons (see Supplemental Results). Thus, by several criteria including levels of diversity and patterns of LD, The Netherlands, Pennsylvania, and Gabon populations appear to be further from equilibrium than the two East African populations.
Multilocus tests of neutrality
Evidence for population differentiation and differences in LD among populations suggest the influence of nonequilibrium demography or selection. We thus applied three multilocus tests of the standard neutral model to each population (see Methods). Several interesting findings emerge from these analyses (Table 3). First, all populations have a significantly negative mean Tajima's D across loci. This finding has been reported before for Zimbabwe populations (Glinka et al. 2003), and here we show that this pattern is apparent in all three African populations sampled. Second, despite similarities in Tajima's D among all populations, Fay and Wu's H (a second summary of the frequency distribution of mutations) shows a different pattern. In particular, there is a significant excess of high-frequency-derived polymorphisms in the two non-African populations, as indicated by a strongly negative mean H (Table 3). Like the two non-African populations, the Gabon population also shows an excess of high-frequency-derived mutations, though this was not statistically significant. Finally, the HKA test indicates that there is significant heterogeneity in levels of polymorphism and divergence in the two non-African populations as well as in the Gabon population (Table 3). These tests indicate that non-African populations appear to be far from neutral model expectations. Interestingly, by these same measures, the West/Central African Gabon population appears to exhibit patterns more akin to non-African populations than East African ones. These results agree well with our findings above based on LD patterns.
Table 3.
Tests of the standard neutral model by population for the 10 loci surveyed in this study
| Population | HKA χ2 | Mean Tajima's D | Mean Fay & Wu's H |
|---|---|---|---|
| Zimbabwe | 1.96 (0.732)a | −0.38 (0.012)c | 0.78 (0.881) |
| Kenya | 5.43 (0.124) | −0.48 (0.003) | 0.15 (0.679) |
| Gabon | 8.86 (0.010) | −0.75 (<10−4)b | −0.96 (0.205) |
| Netherlandsd | 14.30 (0.009)b | −0.80 (<10−3)b | −3.38 (<10−4)bc |
| Pennsylvania | 11.03 (0.032)b | −0.65 (<10−3)bc | −3.53 (<10−4)bc |
P-values of the observed summary under the standard neutral model with recombination are given in parentheses. ρ/θ in simulations were sampled according to their posterior probability estimated for the Zimbabwe population (see Fig. 1C).
Significant with no recombination.
Significantly more variance in the summary than expected (P < 0.05).
The probability of observing the one invariant locus (out of 10) in the Netherlands population is P = 0.038.
Discussion
Population structure in D. melanogaster
Little is known about the origin and historical structure of D. melanogaster populations. Previous reports of large differences in levels of variation between African and non-African populations mainly relied on data from a single African population (i.e., Zimbabwe; Begun and Aquadro 1993) or on mixed samples without knowledge of how African and non-African populations are structured (Andolfatto 2001). Here we ask to what extent there is differentiation both within and outside Africa at randomly chosen X-linked loci.
The high levels of differentiation between African and non-African samples have been interpreted in the context of recent range expansion (for review, see Andolfatto 2001 and Discussion below). But what is the cause of differentiation between East and West/Central African populations? The low average pairwise  values (Table 1) and the absence of fixed differences between African populations argue against long-term population structure. Since differentiation measures like
  (and Fst) are sensitive to levels of variability within populations (Charlesworth 1998), both the mean and variance can be affected by nonequilibrium population processes. Thus, the significant differentiation between African populations could merely reflect recent changes in population size rather than equilibrium population structure. Indeed, the Gabon population shows several features which indicate this population's history may be more similar to that of non-African than East African populations.
Higher levels of diversity and the closer fit of patterns in Zimbabwe and Kenya to an equilibrium model suggest that D. melanogaster probably had an East African origin and may have colonized Central/West and other African locations more recently. In support of this scenario, Baudry et al. (2004) showed that two other West African populations (Niger and Ivory Coast) also show somewhat reduced levels of variability at four X-linked loci relative to Zimbabwe and Kenya. This model of population history is contrary to the ideas of Lachaise et al. (1988), who suggested that D. melanogaster probably had a West African origin. If West/Central African populations were relatively recently founded by a small number of individuals (i.e., a recent bottleneck), caution should be exercised when inferring selection parameters from African populations, particularly those that are sampled far from East Africa (e.g., Mousset et al. 2003).
The demographic history of East African populations
It is apparent that even East African populations are not quite at mutation-drift equilibrium themselves. The most striking departure from neutral-equilibrium expectations in Zimbabwe and Kenya is a sharply negative mean Tajima's D (Tables 3 and 4). What is the cause of this departure? Based on a data set of 105 loci from a Zimbabwe D. melanogaster population, Glinka et al. (2003) concluded that there is no significant heterogeneity in levels of polymorphism and divergence and that the negative average Tajima's D in this population suggests recent population growth.
Table 4.
An evaluation of alternative models for the Zimbabwe populationa
| Mean πb | Mean HKA χ2 | Mean D | Mean He | |
|---|---|---|---|---|
| Observedc | 4.82 | 80.3 | −0.56 | −0.44 |
| Model | ||||
| SNMd | 5.42 | 43.6 (<10−4) | −0.01 (<10−4) | 0.00 (0.012) |
| G1d | 4.78 | 43.3 (<10−4) | −0.35 (0.003) | 0.39 (<10−4) |
| G2d | 4.78 | 40.4 (<10−4) | −0.59 (0.766) | 0.93 (<10−4) |
| HH1d | 4.78 | n.d. | −0.62 (0.854) | 0.49 (<10−3) |
| HH2d | 4.86 | n.d. | −0.62 (0.830) | 0.50 (<10−3) |
| BNd | 4.82 | 75.07 (0.286) | −0.48 (0.148) | −0.23 (0.172) |
Combining the 10 loci surveyed here and 105 loci surveyed in Glinka et al. (2003).
Average π per locus across loci, the average number of sites surveyed is 477 base pairs.
The mean of the observed values.
The mean simulated values are given for π and HKA χ2; the mean of mean simulated values are given for Tajima's D and Fay and Wu's H. P-values of the observed means under the model simulated are given in parentheses. See Methods for descriptions of the models. SNM: the standard neutral model, mean θ = 5.43. G1: exponential growth started 0.023Ne generations ago (∼50,000 years ago; rate of growth = 100; growth factor = 10; mean θ = 43.5). G2: exponential growth started 0.161Ne generations ago (∼150,000 years ago; rate of growth = 10; growth factor = 5; mean θ = 18.5). BN: a bottleneck started 0.5Ne generations ago (about 200,000 years ago; duration = 0.00002Ne generations; f = 0.00001; mean θ = 9.5). See Methods for assumptions underlying estimates of timing in years. HH1: recurrent hitchhiking (Ne = 5 million; s = 0.005; λ = 0.000045; mean θ = 10.85). HH2: recurrent hitchhiking (Ne = 5 million; s = 0.01; λ = 0.000023; mean θ = 10.85). P-values are based on 1000 replicates for models HH1 and HH2 and 10,000 replicates for the models SNM, G1, G2, and BN. ρ/θ = 7 for all models. (n.d.): the HKA test was not performed for the hitchhiking models.
These P-values are based on infinite-sites simulations. We also implemented a correction for finite-sites (see Supplemental Results). Under the finite-sites model, the mean H under model SNM was −0.14 (P = 0.065). P-values under G and HH models were ≤10−3. The P-value under the BN model was 0.405. Thus, the conclusion that the mean H is incompatible with growth or hitchhiking is robust to the infinite-sites assumption.
To re-examine these conclusions, we combined our Zimbabwe data with those collected by Glinka et al. (2003) (see Methods). In our analyses, we account for recombination since ignoring it can be overly conservative and lead to spurious conclusions (Przeworski et al. 2001). In addition to a significantly negative average Tajima's D, the Zimbabwe population is also characterized by a marked skew toward high-frequency-derived variants (measured as a negative mean value of Fay and Wu's H) and significantly too much variation in levels of polymorphism and divergence among loci (measured as a large HKA χ2, see Table 4 and Supplemental Results). We performed coalescent simulations to investigate the behavior of these statistics under different demographic and selection models. While population growth generally does result in a negative mean Tajima's D, this skew will be caused by low-frequency-derived variants (Fu 1997). As a result, population growth will always result in a positive skew in H on average (e.g., models G1 and G2 in Table 4). Under growth, average HKA χ2 are comparable to an equilibrium population of the same size (Table 4 and results not shown). Based on these results, we conclude that population growth models are incompatible with the observed negative value of H and large HKA χ2 in the Zimbabwe population.
While we can exclude population growth, other simple demographic models may account for the Zimbabwe data. For example, positing a short extreme bottleneck occurring 0.5Ne generations ago (about 200,000 years ago making various assumptions, see Methods) can easily account for all of the unusual features of the Zimbabwe data (Table 4). For bottlenecks of intermediate age (as modeled here), the signs of D and H can both be negative, and thus they constitute a plausible explanation for the observed data.
Can simple selection models account equally well for patterns of variation observed in the Zimbabwe population? While the recurrent hitchhiking model (Braverman et al. 1995; Gillespie 2000; Przeworski 2002) can account for the negative values of Tajima's D observed, this model also results in a positive average Fay and Wu's H (Przeworski 2002), rather than the negative one observed in the data (models HH1 and HH2, Table 4). Negative (or purifying) selection could also have a large impact on patterns of genome-wide variability in D. melanogaster (Charlesworth 1996; Akashi 1999). Like hitchhiking, models of weak negative selection predict an excess of low-frequency-derived mutations on average (Fu 1997; Akashi 1999; Gordo et al. 2002). This is contrary to what is observed in the Zimbabwe data (Table 4) and suggests that we can reject purifying selection as an explanation.
In summary, our results suggest that departures from the standard neutral model observed in the Zimbabwe data are unlikely to be explained by either simple population growth, purifying selection, or steady-state hitchhiking due to the recurrent fixation of newly arising beneficial mutations. In contrast, a relatively simple bottleneck model appears to be sufficient to account for most features of multilocus variability in East African D. melanogaster populations.
The demographic and selection history of non-African populations
It has been proposed that the expansion of D. melanogaster from Africa was recent (Lachaise et al. 1988) and may have been accompanied by bottlenecks, adaptation to temperate habitats, or both (David and Capy 1988; Andolfatto 2001; Kauer et al. 2002). The two non-African populations surveyed here are characterized by reduced levels of nucleotide diversity, an excess of high-frequency-derived polymorphisms and elevated levels of LD relative to African populations. All of these features of the data have been cited as evidence for selection (e.g. Harr et al. 2002). However, it is often less appreciated that each of these features are also expected in relatively simple demographic models; a reasonable candidate is a bottleneck associated with colonization.
To address the question of whether a bottleneck associated with colonization could be sufficient to account for polymorphism patterns observed in non-African populations, or whether selection is a more likely cause, we considered the combined 115 locus data set surveyed in Zimbabwe and The Netherlands (the 10 loci surveyed here in addition to 105 more from Glinka et al. 2003). In Table 5, we show how likely these various features of The Netherlands data are under three bottleneck models that differ in their timing and intensity but result in the same average reduction in variability.
Table 5.
An evaluation of alternative models for the the Netherlands populationa
| Mean πb | Mean HKA χ2 | Mean D | Mean Var(D) | Mean H | Mean Var(H) | Mean #IL | |
|---|---|---|---|---|---|---|---|
| Observedc | 2.00 | 192.87 | −0.06 | 1.55 | −1.58 | 6.46 | 14 |
| Model | |||||||
| SNMd | 1.97 | 75.9 (<10−4) | −0.02 (0.250) | 0.66 (<10−4) | −0.00 (<10−4) | 1.49 (<10−4) | 2.7 (<10−4) |
| BN1d | 2.08 | 157.7 (0.029) | 0.39 (0.000) | 1.41 (0.163) | −1.26 (0.071) | 4.73 (0.101) | 13 (0.470) |
| BN2d | 2.09 | 135.6 (<10−3) | −0.01 (0.315) | 1.25 (0.007) | −0.96 (0.002) | 4.03 (0.030) | 7.6 (0.015) |
| BN3d | 2.01 | 165.4 (0.078) | 0.08 (0.125) | 1.63 (0.700) | −1.20 (0.050)e | 5.08 (0.157) | 14 (0.549) |
| HHd | 2.06 | (n.d.) | −0.60 (<10−3) | 0.57 (<10−3) | 0.24 (<10−3) | 2.24 (<10−3) | 6.6 (0.006) |
Combining the 10 loci surveyed here and 106 loci surveyed in Glinka et al. (2003).
Average π per locus across loci, the average number of sites surveyed is 477 base pairs.
Mean of the observed values. Var(D): the variance of D; Var(H): the variance of H; #IL: the number of invariant loci out of 115 surveyed.
Mean simulated values are given for π, HKA χ2 and #IL; the mean of mean simulated values are given for Tajima's D, Var(D), and Fay and Wu's H, and Var(H). P-values of the observed means under the model simulated are given in parentheses. See Methods for descriptions of the models. SNM: the standard neutral model, mean Θ = 5.43. BN1: a bottleneck started 0.12Ne generations ago (duration = 0.106Ne generations, between ∼4000 and 30,000 years ago; f = 0.05; mean Θ = 5.43); BN2: a bottleneck started 0.192Ne generations ago (duration = 0.112Ne generations, between ∼20,000 and 50,000 years ago; f = 0.05; mean Θ = 5.43); BN3: a bottleneck started 0.06Ne generations ago (duration = 0.000021Ne generations, about 16,000 years ago; f = 0.00001; mean Θ = 5.43); HH: recurrent hitchhiking (Ne = 2.5 million; s = 0.005; λ = 0.000052; mean Θ = 5.43). P-values are based on 1000 replicates for models HH and 10,000 replicates for the models SNM, BN1, BN2, and BN3. p/Θ = 7 for all models. (n.d.): the HKA test was not performed for the hitchhiking model.
P = 0.060 under a finite-sites model (see Supplemental Results).
As noted above, the effect of a bottleneck on the frequency distribution of mutations can be complex. In general, very recent bottlenecks result in a skew toward high-frequency-derived variants on average (i.e., a negative mean H), a positive Tajima's D and increased variance for each of the summary statistics considered here. For older bottlenecks, Tajima's D will become more negative whereas Fay and Wu's H will become more positive, reflecting the appearance of new mutations.
It has been proposed that the expansion of D. melanogaster from Africa probably occurred between 5000 and 10,000 years ago (Lachaise et al. 1988). Our simulations suggest that a recent bottleneck (e.g., BN1, occurring between ∼4000 and 30,000 years ago, see Methods for assumptions made in estimating time in years) can account for many of the features of The Netherlands population, including the observed number of invariant loci, the mean H, and the large variances in both D and H (Table 5). An obvious problem with BN1 is that the observed mean D in The Netherlands data is too close to zero to be compatible with the mean positive value of Tajima's D expected under this model. On the other hand, positing an older bottleneck (BN2, occurring between ∼20,000 and 50,000 years ago) could account for the mean D∼0, but not several other features of the data. Some of these features of simple bottleneck models caused Glinka et al. (2003) to reject a simple bottleneck as sufficient to explain The Netherlands data. However, we show that positing a shorter and more severe bottleneck (about 16,000 years ago) can just about account for each of the features of The Netherlands data (BN3 in Table 5). While evidence for structure between African and between non-African populations (Table 2) may justify invoking an even more complicated demographic model, it is apparent that this very simple bottleneck model is sufficient to account for each of the summaries we have considered for The Netherlands population.
What about positive selection models? Steady-state hitchhiking models (e.g., Braverman et al. 1995; Gillespie 2000; Przeworski 2002) that reduce variation by the same amount in The Netherlands data relative to the Zimbabwe population are not likely to account for many of these features of the data (Table 5). In particular, recurrent hitchhiking models predict a negative mean D but a positive mean H at randomly chosen loci (Przeworski 2002). The latter is contrary to the pattern observed in The Netherlands and Pennsylvania, which both show a strongly negative mean H (Tables 3 and 5). In the larger Netherlands data set (Table 5), both the mean D and the mean H are incompatible with this model. In addition, there is a low probability of observing as many invariant loci as observed in The Netherlands data (14) under this hitchhiking model (Table 5). Our results imply that highly reduced variation observed at some loci in genome-wide scans (i.e., Harr et al. 2002; Glinka et al. 2003; Kauer et al. 2003) might be more easily explained by a bottleneck in the history of European populations than by recurrent selective sweeps.
What about other evidence for positive selection in non-African populations? The observation of high-frequency-derived variants at some loci in non-African populations that are at low frequency in Africa has been proposed as a distinct signature of adaptation (Harr et al. 2002; Glinka et al. 2003; and see Harris and Hey 1999 for an example from humans). Rare polymorphisms segregating in an ancestral population are expected to be disproportionately lost during a population bottleneck (Maruyama and Fuerst 1985a). Thus, variants that are fixed or at high frequency in a derived population but at very low frequency in an ancestral population suggest that selection may have had a role in causing their fixation.
Following this intuition, Glinka et al. (2003) observed that the subset of genome regions with the largest reductions in variability in The Netherlands (π ≤ 0.0011 per site) had an excess of fixed derived variants that were at low frequency in Zimbabwe compared to other genomic regions (Fig. 3A). However, here we show that a simple bottleneck model can produce a very similar pattern. The distributions of ancestral population frequencies of fixed derived variants expected for high (π > 0.0011 per site) and low (π ≤ 0.0011 per site) variability fragments simulated under BN3 in Table 5 (Fig. 3B) are not significantly different from what is observed in The Netherlands data (Fig. 3A, low variability fragments: χ2 = 5.78; P = 0.886; high variability fragments: χ2 = 2.08; P = 0.998). Thus, a simple bottleneck is sufficient to produce the excess of high-frequency-derived variants in genome regions with reduced variability in The Netherlands population.
Figure 3.

The ancestral frequencies of fixed variants in a derived population. (A) The observed data from The Netherlands population based on the 105 loci surveyed by Glinka et al. (2003). (B) Simulated data from 10,000 replicates of bottleneck model BN3 from Table 5. The x-axis plots the ancestral frequency of variants (out of a sample size of 12 individuals) that are fixed in the derived population. The light gray bars represent fragments for which estimates of θ ≤ 0.0011 per site. The dark gray bars represent fragments for which estimates of θ > 0.0011 per site. A χ2 test suggests that there is no difference between distributions of the observed and simulated data for both classes of fragments.
Another striking feature of non-African populations is elevated levels of LD relative to African populations (see Fig. 1C). Our estimate of ρ/θ for the 115 locus data set is 0.8 for The Netherlands population (95% CI 0.4-2.0) compared to 11.1 (8.9-12.9) for the Zimbabwe population. Increased LD (or haplotype structure) has been noted as a signature of recent selective sweeps (Hudson et al. 1994; Kim and Stephan 2002; Przeworski 2002, 2003). However, it has also been shown that steady-state hitchhiking models do relatively little to increase levels of LD at randomly chosen loci relative to a neutral population with the same level of diversity (Przeworski 2002; Wall et al. 2002). In Figure 4A, we show the posterior distributions of ρ/θ for 100 replicate data sets consisting of 10 independent loci simulated under a steady-state hitchhiking model (in red). For comparison, we show estimates for similar data from an equilibrium population (in black). These simulations demonstrate that directional selection is unlikely to be the cause of increased levels of LD (i.e., smaller estimates of ρ/θ) observed in both The Netherlands and the Pennsylvania populations (Fig. 1C and Table 2).
Figure 4.
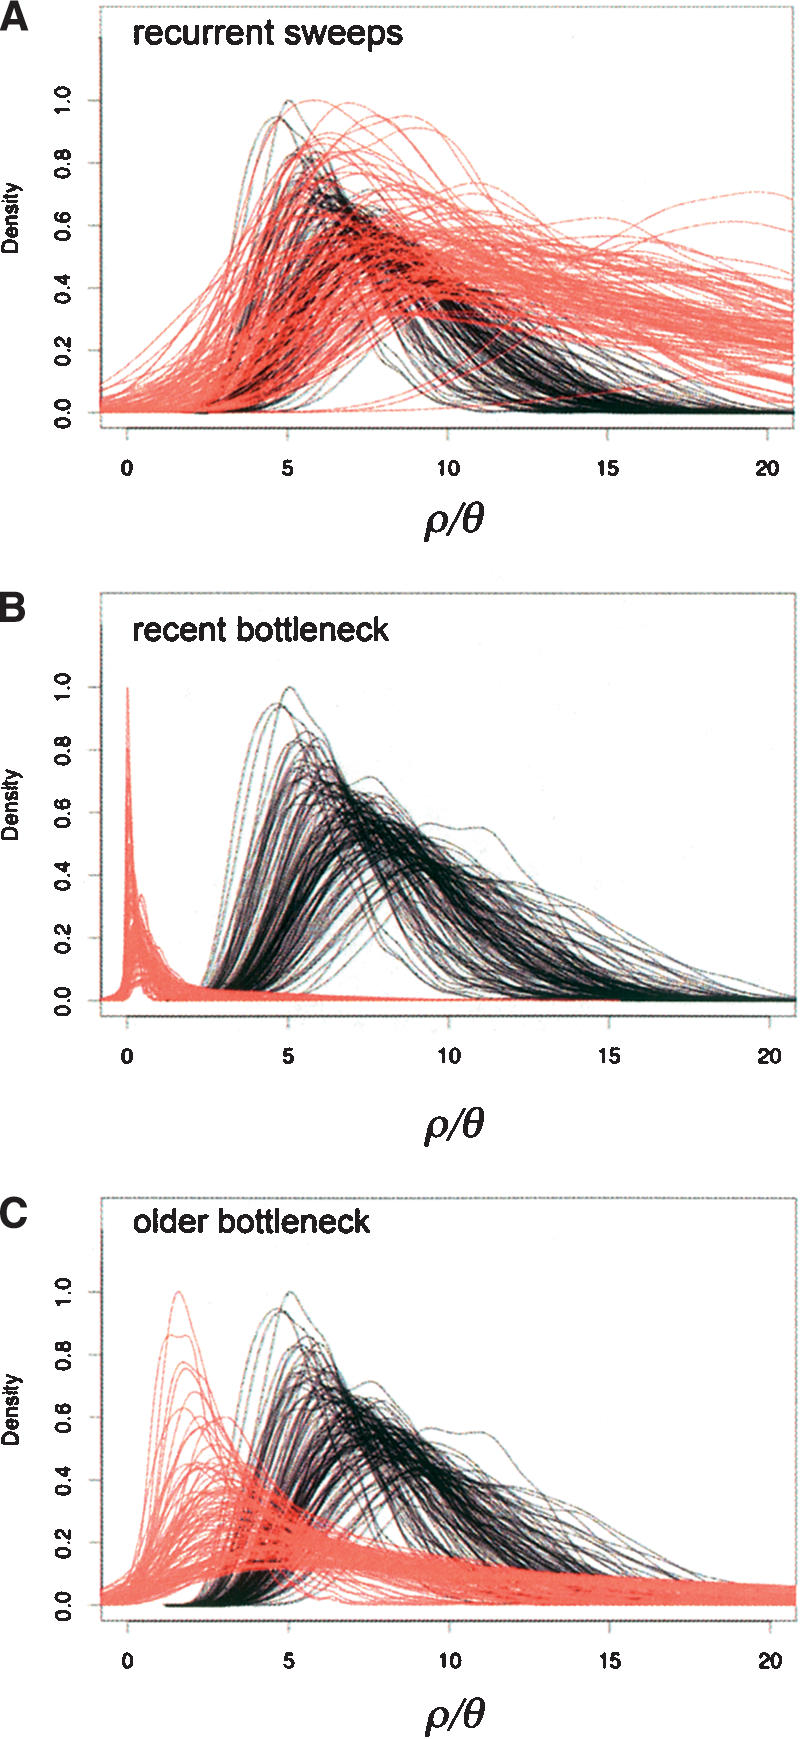
The effect of (A) recurrent hitchhiking, (B) a very recent bottleneck, and (C) a less recent bottleneck on multilocus estimates of ρ/θ. Each curve represents one of 100 simulated replicates of 10 independent loci. In red are 100 replicate distributions of ρ/θ for data simulated under sweeps or a bottleneck. In black are 100 replicate distributions of ρ/θ for the ancestral population. For the hitchhiking model (A), the relevant parameters used are the strength of selection, s = 0.005, the effective population size, Ne = 2.5 million, and the expected number of sweeps in 4Ne generations, λ = 0.00004. In bottleneck (B), the population size is reduced by a factor f = 0.05 between 0.014Ne and 0.12Ne generations ago. In bottleneck (C), we model the same reduction in Ne between 0.12Ne to 0.24Ne generations ago. For all models, the average reduction in variability (π) was set to ∼0.4 of the ancestral population θ.
In contrast, recent bottlenecks increase levels of LD (i.e., decrease estimates of ρ) more strongly than they reduce levels of variability (Wall et al. 2002). As a result, recent bottlenecks can result in smaller estimates of ρ/θ than expected under the standard neutral model. Figure 4B,C shows posterior distributions of ρ/θ for 10 loci simulated under a very recent and a somewhat older bottleneck (recovering in size 0.014Ne and 0.12Ne generations ago, respectively, see Methods). For comparison, estimates of ρ/θ for an equilibrium population of the same size are shown in black. In contrast to the recurrent hitchhiking model, these results mimic empirical observations in The Netherlands and Pennsylvania (Fig. 1C) rather well.
In summary, our simulations illustrate that simple bottleneck models can adequately account for many of the features of polymorphism on the X chromosome of non-African D. melanogaster populations, including a significant number of invariant loci, overall patterns of linkage disequilibrium, skews in the frequency spectrum of mutations, the large variance among loci in patterns of variation and the distribution of ancestral frequencies of fixed derived variants. On the other hand, a steady-state hitchhiking model alone fails to account for many of these features of the data. Based on the summaries we have considered, we have thus far failed to find a feature of the data that requires us to invoke selection.
Conclusions
While we have reason to believe that recent directional selection may be common in the histories of many species, we are usually uncertain of where and when in the genome this selection has occurred and what its overall impact on genome variability may be. Thus, there has been considerable interest in using population genetic approaches to map the location of genes experiencing recent selection in various organisms (e.g., Harr et al. 2002; Kauer et al. 2003; Kayser et al. 2003; Akey et al. 2004; Orengo and Aguadé 2004; Storz et al. 2004; Tenaillon et al. 2004; Stajich and Hahn 2005). While historically rejections of the standard neutral model have been interpreted in the context of selection models, more recent studies are acknowledging potential problems associated with uncertainty about demographic factors in reliably identifying selection. However, many arguments in favor of positive selection have been verbal and not quantitative.
Here we have shown that a recent bottleneck in Drosophila is likely to have resulted in many signatures in the genome that resemble the effects of selection using current methods. Given the strong impact demographic factors have in shaping genome-wide variability, it is clearly necessary to incorporate demographic details into null models. Recent progress has been made in testing the robustness of inferences of selection by identifying outliers under likely demographic parameters (e.g., Akey et al. 2004; Tenaillon et al. 2004). An alternative to approaches that identify outliers under a null model may be to determine whether a given pattern is more likely when selection is incorporated into the model. Thus, it may be useful to investigate models that incorporate the effects of both demography and selection, rather than relying on demographic models alone. Our study, like those of Akey et al. (2004) and Tenaillon et al. (2004), illustrates the utility of considering multiple summaries of the data in distinguishing among models. This provides hope that using multiple features of the data may aid in finding signatures that are unique to selection.
Methods
Data collection
We used samples from five D. melanogaster populations: Victoria Falls, Zimbabwe (collected by B. Ballard, 2002); Nairobi, Kenya (collected by B. Ballard, 2002); N'Toum, Gabon (40 km from Libreville, collected by B. Ballard and S. Charlat, 2002); Leiden, The Netherlands (collected by A. Davis, 2000) and State College, Pennsylvania (collected by A. Clark, 1998). For each population, a single male was sampled from each of 24 isofemale lines and genomic DNA was extracted (Gentra Systems). A single male was also sampled from an inbred line of D. simulans from Aswan, Egypt (line A08, collected by P. Andolfatto, 2001) for divergence estimates.
The ten loci chosen are distributed evenly across the X-chromosome from cytological map positions 4A-12F (Fas2, map position 4B1-4B3, 531 bp; sqh, map position 5E1, 549 bp; CG32732, map position 6E3-6E4, 503 bp; ct, map position 7B4-7B5, 489 bp; lz, map position 8D12, 536 bp; Hk, map position 9B5, 548 bp; v, map position 9F11, 565 bp; dy, map position 10E2, 531 bp; lic, map position 11D10, 546 bp and rut, map position 12F4, 505 bp). Loci were chosen along this interval because this represents the most highly recombining portion of the X; there is no compelling evidence for recombination rate variation along this interval (see Charlesworth 1996). Nine of the ten loci encode intronic DNA: the exception is the vermilion sequence which is located upstream of the 5' UTR region of the gene. Aligned sequences have been submitted to GenBank under accession nos. AY925214-AY926258.
Sequences were amplified using asymmetric PCR and directly sequenced on both strands using a BigDye (version 3) sequencing kit and run on an ABI 3730 Genetic Analyser (Applied Biosystems), following the protocol described in Miller et al. (2003). Sequence trace files were proofread and aligned by eye using Sequencher (Gene Codes Corporation).
Population structure
Unless otherwise stated, all analyses were carried out using custom software based on a common library (Libsequence, http://www.molpopgen.org; Thornton 2003). These programs were used to estimate various basic population parameters, including three measures of nucleotide diversity; π, based on the mean number of pairwise differences in a sample (Tajima 1983), θW, based on the number of segregating mutations in a sample (Watterson 1975), and θH, which weights polymorphisms by the square of their frequencies (Fay and Wu 2000). All three measures are unbiased estimators of the population parameter 4Neμ, where Ne is the species effective population size and μ is the neutral mutation rate. As a measure of divergence, we calculate the average pairwise divergence (Dxy) between all D. melanogaster alleles and the D. simulans sequence. All summary statistics of the polymorphism data, and divergence to D. simulans were calculated after the exclusion of sites with more than two states in the complete alignment (i.e., all populations and one D. simulans sequence) and mutations overlapping alignment gaps.
Population differentiation was investigated using two different methods. Firstly, we investigated pairwise values and probabilities of Hudson's (2000) nearest-neighbor statistic (Snn) using a program kindly provided by R. Hudson (http://home.uchicago.edu/~rhudson1/). For this test we concatenated the ten loci surveyed. We also report average values of  (an analog of Fst; Hudson et al. 1992) among loci for comparison to earlier studies. Secondly, we used the program Structure (Pritchard et al. 2000) to examine clustering within and between different population samples (http://pritch.bsd.uchicago.edu/). We also make use of information on map distances between markers and thus take into account linkage within and between the loci surveyed (Falush et al. 2003). A maximum likelihood value of the inferred number of demes (IND) was estimated by running the model under various different parameter combinations (IND =1-6).
Linkage disequilibrium
We investigated levels of linkage disequilibrium (LD) by estimating the population recombination parameter ρ = 4Ner, where r is the recombination rate per generation (Hudson 1987; Andolfatto and Przeworski 2000). We estimated the parameter ρ using two methods. First, we use Hudson's (2001) estimator (ρH01) which is an approximate likelihood method based on pairwise linkage disequilibrium between sites. Second, we employ a new multi-locus estimator of ρ (K.R. Thornton, unpubl.) that is similar in spirit to the summary likelihood estimator described by Wall (2000). Here, posterior distributions of ρ and θ were jointly estimated by an approximate Bayesian method based on summary statistics of the data (sample size, alignment length, diversity, π, number of segregating sites, S, the number of haplotypes, K, and the minimum number of recombination events in the sample, Rm) and rejection sampling (cf., Pritchard et al. 1999 and Algorithm D of Marjoram et al. 2003). Details of the algorithm can be found in the Supplemental Methods.
Both selection and demography can affect patterns of LD in the genome. To investigate the effects of selection and bottlenecks on estimates of ρ/θ, we conducted coalescent simulations. First, we modeled the effects of recurrent selective sweeps using a program described in Przeworski (2002; see below). Parameters were as follows: the strength of selection, s = 0.005, Ne = 2.5 million, and the expected number of sweeps in 4Ne generations, λ = 0.00004. The mean reduction in variability (π) relative to the ancestral population was set to ∼0.4 for each of these models to mimic the mean observed reduction in variability in The Netherlands population relative to Zimbabwe.
We also modeled the effects of two different bottleneck models on LD patterns using the neutral coalescent program ms (Hudson 2002; see below). Two bottleneck models of equal severity were simulated, but their timing differed. We simulated a recent bottleneck where Ne is reduced by a factor f = 0.05 between 0.014Ne and 0.12Ne generations ago (corresponding to ∼4000 and ∼30,000 years ago, respectively). We simulated an older bottleneck model with the same reduction in Ne between 0.12Ne to 0.24Ne generations ago (corresponding to ∼30,000 and ∼60,000 years ago, respectively). All estimates of timing in terms of years assume that average π per site in the Zimbabwe population is an estimate of 4fNeμ, where f = 0.75 for the X chromosome, μ is 1.5 X 10⁻⁸ per year and there are 10 generations per year (Andolfatto and Przeworski 2000).
For both hitchhiking and bottleneck models, we generated 100 replicate data sets of 10 independent loci of sample size 10, with θ = 10, ρ = 70, and 1000 base pairs per locus. For each simulated replicate of 10 loci, the estimate the joint posterior distribution of ρ and θ were obtained as above. For comparison, we also estimated ρ/θ for a neutral equilibrium population. To partially alleviate the computational time required, a more liberal ε was used. This leads to larger confidence intervals than one would obtain in practice, meaning that the differences between the models in terms of ρ/θ are underestimated. As above, all estimates of timing in terms of years assume μ = 1.5 X 10⁻⁸ per year and there are 10 generations per year.
Statistical tests of neutrality
Both nonequilibrium demography and selection can be detected by several proposed statistical tests of the standard neutral model. Since many of these tests are highly correlated with one another, we chose three tests which we view as the easiest to interpret and the least redundant: The HKA test (Hudson et al. 1987) which is a test of heterogeneity in levels of polymorphism (based on the number of segregating sites) relative to divergence; Tajima's D test which measures the standardized difference between π and θW (Tajima 1989); and Fay and Wu's H, which measures the difference between π and θH (Fay and Wu 2000). Both D and H are expected to be close to zero under the standard neutral model. In the case of H, the ancestral state was inferred using a single D. simulans sequence as an outgroup and standard parsimony criteria. We also checked the robustness of our conclusions to the infinite-sites assumption by implementing a correction for multiple hits (following Fay and Wu 2000; see Supplemental Results). All tests were carried out both with and without recombination, using the program ms of Hudson (Hudson 2002) and various auxiliary programs written in C and Perl (available on request to P.A.).
In simulations of the neutral model, we assume either that there is no recombination (which is likely to be overly conservative) or we sample ρ/θ according to their posterior probability estimated for the Zimbabwe population (Fig. 1C). Previous studies have shown that recent bottlenecks can decrease estimates of ρ/θ (Wall et al. 2002). Thus, despite the fact that estimates of ρ/θ in The Netherlands, Pennsylvania, and Gabon are lower than that of Zimbabwe, it makes sense to use the level of recombination estimated for populations that are closer to the predictions of the standard neutral model. These simulations also incorporate the sample size, alignment length in base pairs (excluding all gaps) and a θ parameter for each locus. Parameters θ (for each locus) and T, the species divergence time, were estimated from the observed data using the HKA framework (Hudson et al. 1987) based on the number of segregating sites and divergence to a single D. simulans sequence. P-values for test statistics are based on 10,000 replicates of the neutral coalescent.
Previously published data and the evaluation of alternative models
We further extended our analysis to include data collected by Glinka et al. (2003). This data consists of polymorphism data for 105 noncoding (63 intron and 42 intergenic) regions collected in samples of 9-12 alleles from a Zimbabwe and a Netherlands population. Since the samples used were so similar to our samples (see Supplemental Materials), we combined these two data sets to produce a single 115 locus data set. We use this larger data set to address issues of the demographic and selective history of these two populations.
We evaluate three types of alternative models: an exponential growth model, a bottleneck model, and a recurrent hitchhiking model. The models and parameters used are described in detail in the Supplemental Methods. In each case, simulation parameters were scaled to mimic the observed data (i.e., levels of variability, π, and average pairwise divergence, Dxy) as closely as possible. In simulations with recombination, we assume ρ/θ =7 which is close to the lower 95% confidence bound for the 115 locus Zimbabwe data set. P-values are based on 10,000 coalescent replicates.
Acknowledgments
The authors thank B. Ballard, A. Clark, and A. Davis for providing fly samples and D. Bachtrog, A. Clark, D. Halligan, R. Nielsen, and M. Przeworski for helpful advice and discussions. D. Bachtrog and A. Putnam gave critical comments on the manuscript. This work was funded in part by a Biotechnology and Biological Sciences Research Council Grant (to P.A. and B.C.). K.T. is supported by an A.P. Sloan Postdoctoral Fellowship. P.A. is supported by an A.P. Sloan Fellowship in Molecular and Computational Biology.
Footnotes
[Supplemental material is available online at www.genome.org. The sequence data from this study have been submitted to GenBank under accession nos. AY925214-AY926258. The following individuals kindly provided reagents, samples, or unpublished information as indicated in the paper: B. Ballard, A. Clark, and A. Davis.]
Article and publication are at http://www.genome.org/cgi/doi/10.1101/gr.3541005.
References
- Akashi, H. 1999. Inferring the fitness effects of DNA mutations from polymorphism and divergence data: Statistical power to detect directional selection under stationarity and free recombination. Genetics 151: 221-238. [DOI] [PMC free article] [PubMed] [Google Scholar]
- Akey, J., Eberle, M., Rieder, M., Carlson, C., Shriver, M., Nickerson, D., and Kruglyak, L. 2004. Population history and natural selection shape patterns of genetic variation in 132 genes. PLoS Biol. 2: e286. [DOI] [PMC free article] [PubMed] [Google Scholar]
- Andolfatto, P. 2001. Contrasting patterns of X-linked and autosomal nucleotide variation in African and non-African populations of Drosophila melanogaster and D. simulans. Mol. Biol. Evol. 18: 279-290. [DOI] [PubMed] [Google Scholar]
- Andolfatto, P. and Przeworski, M. 2000. A genome wide departure from the standard neutral model in natural populations of Drosophila. Genetics 156: 257-268. [DOI] [PMC free article] [PubMed] [Google Scholar]
- ____. 2001. Regions of lower crossing over harbor more rare variants in African populations of Drosophila melanogaster. Genetics 158: 657-665. [DOI] [PMC free article] [PubMed] [Google Scholar]
- Andolfatto, P. and Wall, J.D. 2003. Linkage disequilibrium patterns across a recombination gradient in African Drosophila melanogaster. Genetics 165: 1289-1305. [DOI] [PMC free article] [PubMed] [Google Scholar]
- Baines, J.F., Chen, Y., Das, A., and Stephan, W. 2002. DNA sequence variation at a duplicated gene: Excess of replacement polymorphism and extensive haplotype structure in the Drosophila melanogaster bicoid region. Mol. Biol. Evol. 19: 989-998. [DOI] [PubMed] [Google Scholar]
- Baudry, E., Viginier, B., and Veuille, M. 2004. Non-African populations of Drosophila melanogaster have a unique origin. Mol. Biol. Evol. 21: 1482-1491. [DOI] [PubMed] [Google Scholar]
- Begun, D.J. and Aquadro, C.F. 1993. African and North American populations of Drosophila melanogaster are very different at the DNA level. Nature 365: 548-550. [DOI] [PubMed] [Google Scholar]
- Begun, D.J. and Whitley, P. 2000. Reduced X-linked nucleotide polymorphism in Drosophila simulans. Proc. Natl. Acad. Sci. 97: 5960-5965. [DOI] [PMC free article] [PubMed] [Google Scholar]
- Braverman, J.M., Hudson, R.R., Kaplan, N.L., Langley, C.H., and Stephan, W. 1995. The hitchiking effect on the site frequency spectrum of DNA polymorphism. Genetics 140: 783-796. [DOI] [PMC free article] [PubMed] [Google Scholar]
- Charlesworth, B. 1996. Background selection and patterns of genetic diversity in Drosophila melanogaster. Genet. Res. 68: 131-150. [DOI] [PubMed] [Google Scholar]
- ____. 1998. Measures of divergence between populations and the effect of forces that reduce variability. Mol. Biol. Evol. 15: 538-543. [DOI] [PubMed] [Google Scholar]
- David, J.R. and Capy, P. 1988. Genetic variation of Drosophila melanogaster natural populations. Trends Genet. 4: 106-111. [DOI] [PubMed] [Google Scholar]
- Falush, D., Stephens, M., and Pritchard, J.K. 2003. Inference of population structure using multi-locus data: Linked loci and correlated allele frequencies. Genetics 164: 1567-1587. [DOI] [PMC free article] [PubMed] [Google Scholar]
- Fay, J.C. and Wu, C.I. 2000. Hitchhiking under positive Darwinian selection. Genetics 155: 1405-1413. [DOI] [PMC free article] [PubMed] [Google Scholar]
- Fu, Y.X. 1997. Statistical tests of neutrality of mutations against population growth, hitchhiking and background selection. Genetics 147: 915-925. [DOI] [PMC free article] [PubMed] [Google Scholar]
- Gillespie, J.H. 2000. Genetic drift in an infinite population: The pseudohitchiking model. Genetics 155: 909-919. [DOI] [PMC free article] [PubMed] [Google Scholar]
- Glinka, S., Ometto, L., Mousset, S., Stephan, W., and De Lorenzo, D. 2003. Demography and natural selection have shaped genetic variation in Drosophila melanogaster: A multi-locus approach. Genetics 165: 1269-1278. [DOI] [PMC free article] [PubMed] [Google Scholar]
- Gordo, I., Navarro, A., and Charlesworth, B. 2002. Muller's ratchet and the pattern of variation at a neutral locus. Genetics 161: 835-848. [DOI] [PMC free article] [PubMed] [Google Scholar]
- Harr, B., Kauer, M., and Schlötterer, C. 2002. Hitchhiking mapping: A population-based fine-mapping strategy for adaptive mutations in Drosophila melanogaster. Proc. Natl. Acad. Sci. 99: 12949-12954. [DOI] [PMC free article] [PubMed] [Google Scholar]
- Harris, E.E. and Hey, J. 1999. X chromosome evidence for ancient human histories. Proc. Natl. Acad. Sci. 96: 3320-3324. [DOI] [PMC free article] [PubMed] [Google Scholar]
- Hudson, R.R. 1987. Estimating the recombination parameter of a finite population without selection. Genet. Res. 50: 245-250. [DOI] [PubMed] [Google Scholar]
- ____. 2000. A new statistic for detecting differentiation. Genetics 155: 2011-2014. [DOI] [PMC free article] [PubMed] [Google Scholar]
- ____. 2001. Two-locus sampling distributions and their application. Genetics 159: 1805-1817. [DOI] [PMC free article] [PubMed] [Google Scholar]
- ____. 2002. Generating samples under a Wright-Fisher neutral model of genetic variation. Bioinformatics 18: 337-338. [DOI] [PubMed] [Google Scholar]
- Hudson, R.R., Kreitman, M., and Aguadé, M. 1987. A test of molecular evolution based on nucleotide data. Genetics 116: 153-159. [DOI] [PMC free article] [PubMed] [Google Scholar]
- Hudson, R.R., Boos, D.D., and Kaplan, N.L. 1992. A statistical test for detecting geographic subdivision. Mol. Biol. Evol. 9: 138-151. [DOI] [PubMed] [Google Scholar]
- Hudson, R.R., Bailey, K., Skarecky, D., Kwiatowski, J., and Ayala, F.J. 1994. Evidence for positive selection in the superoxide dismutase (Sod) region of Drosophila melanogaster. Genetics 136: 1329-1340. [DOI] [PMC free article] [PubMed] [Google Scholar]
- Kauer, M., Zangerl, B., Dieringer, D., and Schlötterer, C. 2002. Chromosomal patterns of microsatellite variability contrast sharply in African and Non-African populations of Drosophila melanogaster. Genetics 160: 247-256. [DOI] [PMC free article] [PubMed] [Google Scholar]
- Kauer, M.O., Dieringer, D., and Schlötterer, C. 2003. A microsatellite variability screen for positive selection associated with the “out of Africa” habitat expansion of Drosophila melanogaster. Genetics 165: 1137-1148. [DOI] [PMC free article] [PubMed] [Google Scholar]
- Kayser, M., Brauer, S., and Stoneking, M. 2003. A genome scan to detect candidate regions influenced by local natural selection in human populations. Mol. Biol. Evol. 20: 893-900. [DOI] [PubMed] [Google Scholar]
- Kim, Y. and Stephan, W. 2002. Detecting a local signature of genetic hitchhiking along a recombining chromosome. Genetics 160: 765-777. [DOI] [PMC free article] [PubMed] [Google Scholar]
- Kreitman, M. 1983. Nucleotide polymorphism at the alcohol dehydrogenase locus of Drosophila melanogaster. Nature 304: 412-417. [DOI] [PubMed] [Google Scholar]
- Lachaise, D., Cariou, M.L., David, J.R., Lemeunier, F., Tsacas, L., and Ashburner, M. 1988. Historical biogeography of the Drosophila melanogaster species subgroup. Evol. Biol. 22: 159-225. [Google Scholar]
- Marjoram, P., Molitor, V., Plagnol, V., and Tavare, S. 2003. Markov chain Monte Carlo without likelihoods. Proc. Natl. Acad. Sci. 100: 15324-15328. [DOI] [PMC free article] [PubMed] [Google Scholar]
- Maruyama, T. and Fuerst, P.A. 1985a. Population bottlenecks and non-equilibrium models in population genetics. II. Number of alleles in a small population that was formed by a recent bottleneck. Genetics 111: 675-689. [DOI] [PMC free article] [PubMed] [Google Scholar]
- ____. 1985b. Population bottlenecks and non-equilibrium models in population genetics. III. Genic homozygosity in populations which experience periodic bottlenecks. Genetics 111: 691-703. [DOI] [PMC free article] [PubMed] [Google Scholar]
- McDonald, J.H. and Kreitman, M. 1991. Adaptive protein evolution at the Adh locus in Drosophila. Nature 351: 652-654. [DOI] [PubMed] [Google Scholar]
- Miller, R.D., Duan, S., Lovins, E.G., Kloss, E.F., and Kwok, P.Y. 2003. Efficient high-throughput resequencing of genomic DNA. Genome Res. 13: 717-720. [DOI] [PMC free article] [PubMed] [Google Scholar]
- Mousset, S., Brazier, L., Cariou, M.L., Chartois, F., Depaulis, F., and Veuille, M. 2003. Evidence of a high rate of selective sweeps in African Drosophila melanogaster. Genetics 163: 599-609. [DOI] [PMC free article] [PubMed] [Google Scholar]
- Orengo, D.J. and Aguadé, M. 2004. Detecting the footprint of positive selection in a European population of Drosophila melanogaster: Multi-locus pattern of variation and distance to coding regions. Genetics 167: 1759-1766. [DOI] [PMC free article] [PubMed] [Google Scholar]
- Pritchard, J.K., Seielstad, M.T., Perez-Lezaun, A., and Feldman, M.W. 1999. Population growth of human Y chromosomes: A study of Y chromosome microsatellites. Mol. Biol. Evol. 16: 1791-1798. [DOI] [PubMed] [Google Scholar]
- Pritchard, J.K., Stephens, M., and Donnelly, P. 2000. Inference of population structure using multi-locus data. Genetics 155: 945-959. [DOI] [PMC free article] [PubMed] [Google Scholar]
- Przeworski, M. 2002. The signature of positive selection at randomly chosen loci. Genetics 160: 1179-1189. [DOI] [PMC free article] [PubMed] [Google Scholar]
- ____. 2003. Estimating the time since the fixation of a beneficial allele. Genetics 164: 1667-1676. [DOI] [PMC free article] [PubMed] [Google Scholar]
- Przeworski, M., Wall, J.D., and Andolfatto, P. 2001. Recombination and the frequency spectrum in Drosophila melanogaster and Drosophila simulans. Mol. Biol. Evol. 18: 291-298. [DOI] [PubMed] [Google Scholar]
- Stajich, J.E. and Hahn, M.W. 2005. Disentangling the effects of demography and selection in human history. Mol. Biol. Evol. 22: 63-73. [DOI] [PubMed] [Google Scholar]
- Storz, J., Payseur, B.A., and Nachman, M.W. 2004. Genome scans of DNA variability in humans reveal evidence for selective sweeps outside of Africa. Mol. Biol. Evol. 21: 1800-1811. [DOI] [PubMed] [Google Scholar]
- Tajima, F. 1983. Evolutionary relationship of DNA sequences in finite populations. Genetics 105: 437-460. [DOI] [PMC free article] [PubMed] [Google Scholar]
- ____. 1989. Statistical method for testing the neutral mutation hypothesis. Genetics 123: 585-595. [DOI] [PMC free article] [PubMed] [Google Scholar]
- Tenaillon, M., U'Ren, J., Tenaillon, O., and Gaut, B. 2004. Selection versus demography: A multilocus investigation of the domestication process in maize. Mol. Biol. Evol. 21: 1214. [DOI] [PubMed] [Google Scholar]
- Thornton, K. 2003. Libsequence: A C++ class library for evolutionary genetic analysis. Bioinformatics 19: 2325-2327. [DOI] [PubMed] [Google Scholar]
- Wall, J.D. 2000. A comparison of estimators of the population recombination rate. Mol. Biol. Evol. 17: 156-163. [DOI] [PubMed] [Google Scholar]
- Wall, J.D., Andolfatto, P., and Przeworski, M. 2002. Testing models of selection and demography in Drosophila simulans. Genetics 162: 203-216. [DOI] [PMC free article] [PubMed] [Google Scholar]
- Watterson, G.A. 1975. On the number of segregating sites in genetical models without recombination. Theor. Pop. Biol. 7: 256-276. [DOI] [PubMed] [Google Scholar]
WEB SITE REFERENCES
- http://home.uchicago.edu/~rhudson1/; ms coalescent program/population subdivision tests.
- http://pritch.bsd.uchicago.edu/; Structure.
- http://www.molpopgen.org; Libsequence.