

Abstract
Background
Dance therapy or dance movement therapy (DMT) is defined as 'the psychotherapeutic use of movement as a process which furthers the emotional, social, cognitive, and physical integration of the individual'. It may be of value for people with developmental, medical, social, physical or psychological impairments. Dance therapy can be practiced in mental health rehabilitation units, nursing homes, day care centres and incorporated into disease prevention and health promotion programmes.
Objectives
To evaluate the effects of dance therapy for people with schizophrenia or schizophrenia‐like illnesses compared with standard care and other interventions.
Search methods
We updated the original July 2007 search of the Cochrane Schizophrenia Group' register in July 2012. We also searched Chinese main medical databases.
Selection criteria
We included one randomised controlled trial (RCT) comparing dance therapy and related approaches with standard care or other psychosocial interventions for people with schizophrenia.
Data collection and analysis
We reliably selected, quality assessed and extracted data. For continuous outcomes, we calculated a mean difference (MD); for binary outcomes we calculated a fixed‐effect risk ratio (RR) and their 95% confidence intervals (CI). We created a 'Summary of findings' table using the GRADE approach.
Main results
We included one single blind study (total n = 45) of reasonable quality. It compared dance therapy plus routine care with routine care alone. Most people tolerated the treatment package but nearly 40% were lost in both groups by four months (1 RCT n = 45, RR 0.68 95% CI 0.31 to 1.51, low quality evidence). The Positive and Negative Syndrome Scale (PANSS) average endpoint total scores were similar in both groups (1 RCT n = 43, MD ‐0.50 95% CI ‐11.80 to 10.80, moderate quality evidence) as were the positive sub‐scores (1 RCT n = 43, MD 2.50 CI ‐0.67 to 5.67, moderate quality evidence). At the end of treatment, significantly more people in the dance therapy group had a greater than 20% reduction in PANSS negative symptom score (1 RCT n = 45, RR 0.62 CI 0.39 to 0.97, moderate quality evidence), and overall, average negative endpoint scores were lower (1 RCT n = 43, MD ‐4.40 CI ‐8.15 to ‐0.65, moderate quality evidence). There was no difference in satisfaction score (average Client's Assessment of Treatment Scale (CAT) score, 1 RCT n = 42, MD 0.40 CI ‐0.78 to 1.58, moderate quality evidence) and quality of life data were also equivocal (average Manchester Short Assessment of Quality of life (MANSA) score, 1 RCT n = 39, MD 0.00 CI ‐0.48 to 0.48, moderate quality evidence).
Authors' conclusions
Based on predominantly moderate quality data, there is no evidence to support ‐ or refute ‐ the use of dance therapy in this group of people. This therapy remains unproven and those with schizophrenia, their carers, trialists and funders of research may wish to encourage future work to increase high quality evidence in this area.
Keywords: Humans, Dance Therapy, Dance Therapy/methods, Randomized Controlled Trials as Topic, Schizophrenia, Schizophrenia/therapy
Plain language summary
Dance therapy for schizophrenia
For previous PLS see Appendix 1.
The first line of treatment of schizophrenia is usually antipsychotic drugs. Usually, these drugs are more effective in treating the 'positive symptoms' than 'negative symptoms' of schizophrenia. Moreover, antipsychotic drugs have debilitating side‐effects such as weight gain, shaking, tremors and muscle stiffness.
Dance therapy (also known as dance movement therapy, DMT) uses movement and dance to explore a person’s emotions in a non‐verbal way (without language or words). The therapist helps the individual to interpret their dance and movement and link them with people’s personal feelings. Dance has been used as a healing ritual since earliest human history, but the establishment of dance therapy as a profession is quite recent. Dance therapy can be used with people of all ages, races and genders. It can be effective in the treatment of people with medical, social, developmental, physical and psychological impairments. The review included one study with 45 participants. The aim was to compare dance therapy with standard care or other interventions. The one included study compared dance therapy plus routine care with routine care alone. In the main, there was no difference between those who engaged in dance therapy versus those who did not (for outcomes such as satisfaction with care, mental state, leaving the study early, quality of life). However, those who engaged in dance therapy showed significant improvement in negative symptoms.
Overall, because of the small number of participants, the findings are limited. There is little evidence to support or refute the use of dance therapy. Larger studies and trials are needed that focus on important outcomes (such as rates of relapse, quality of life, admission to hospital, leaving the study early, cost of care and satisfaction with treatment). Further research would help clarify whether dance therapy is an effective and holistic treatment for people with schizophrenia, especially in terms of helping people cope with negative symptoms that do not respond so well to antipsychotic drugs.
This summary was written by a consumer Ben Gray (Benjamin Gray, Service User and Service User Expert Rethink Mental Illness, Email: ben.gray@rethink.org).
Summary of findings
Summary of findings for the main comparison. DANCE THERAPY compared with STANDARD CARE for schizophrenia.
| DANCE THERAPY compared to STANDARD CARE for schizophrenia | ||||||
| Patient or population: patients with schizophrenia Settings: Intervention: DANCE THERAPY Comparison: STANDARD CARE | ||||||
| Outcomes | Illustrative comparative risks* (95% CI) | Relative effect (95% CI) | No of Participants (studies) | Quality of the evidence (GRADE) | Comments | |
| Assumed risk | Corresponding risk | |||||
| STANDARD CARE | DANCE THERAPY | |||||
| Service utilisation‐days in hospital | No data available | No data available | ||||
| Clinical global response‐leaving the study early (short term) Follow‐up: 4 months | 95 per 1000 | 42 per 1000 (4 to 428) | RR 0.44 (0.04 to 4.49) | 45 (1 study) | ⊕⊕⊕⊝ moderate1,2 | |
| Clinical global response‐leaving the study early (long term) Follow‐up: 4 months | 429 per 1000 | 291 per 1000 (133 to 647) | RR 0.68 (0.31 to 1.51) | 45 (1 study) | ⊕⊕⊝⊝ low1,2,3 | |
| Mental state: 2a. Negative symptoms ‐ average score (PANSS negative endpoint, high = poor) Follow‐up: 4 months | The mean mental state: 2a. negative symptoms ‐ average score (PANSS negative endpoint, high = poor) in the control groups was 23.3 | The mean mental state: 2a. negative symptoms ‐ average score (PANSS negative endpoint, high = poor) in the intervention groups was 4.4 lower (8.15 to 0.65 lower) | 43 (1 study) | ⊕⊕⊕⊝ moderate1,2 | ||
| Mental state: 2b. Negative symptoms ‐ not improved (PANSS negative symptom reduction less than 20‐40%) Follow‐up: 4 months | 810 per 1000 | 502 per 1000 (316 to 785) | RR 0.62 (0.39 to 0.97) | 45 (1 study) | ⊕⊕⊕⊝ moderate1,2 | |
| Satisfaction with care: Average endpoint score (CAT, high = good) Follow‐up: 4 months | The mean satisfaction with care: average endpoint score (CAT, high = good) in the control groups was 6.4 | The mean satisfaction with care: average endpoint score (CAT, high = good) in the intervention groups was 0.4 higher (0.78 lower to 1.58 higher) | 42 (1 study) | ⊕⊕⊕⊝ moderate1,2 | ||
| Quality of life Manchester Short Assessment (MANSA, high = good) Follow‐up: 4 months | The mean quality of life Manchester short assessment (MANSA, high = good) in the control groups was 4.1 | The mean quality of life Manchester short assessment (MANSA, high = good) in the intervention groups was 0 higher (0.48 lower to 0.48 higher) |
39 (1 study) | ⊕⊕⊕⊝ moderate1,2 | ||
| *The basis for the assumed risk (e.g. the median control group risk across studies) is provided in footnotes. The corresponding risk (and its 95% confidence interval) is based on the assumed risk in the comparison group and the relative effect of the intervention (and its 95% CI). CI: Confidence interval; RR: Risk ratio; | ||||||
| GRADE Working Group grades of evidence High quality: Further research is very unlikely to change our confidence in the estimate of effect. Moderate quality: Further research is likely to have an important impact on our confidence in the estimate of effect and may change the estimate. Low quality: Further research is very likely to have an important impact on our confidence in the estimate of effect and is likely to change the estimate. Very low quality: We are very uncertain about the estimate. | ||||||
1 Risk of bias: rated‐'serious': Randomised in blocks, no details reported. 2 Risk of bias: rated‐'serious': Single blind, but not tested. 3 Risk of bias: rated‐'serious': Over 40% of the participants were lost to follow‐up in control group
Background
Description of the condition
Schizophrenia is a chronic, severe and disabling illness which affects approximately 1% of the population. It is a worldwide illness that crosses all cultures and socioeconomic groups (Fortinash 2000). The severe and long‐lasting symptoms of schizophrenia cause considerable disability.
Description of the intervention
Dance has been used as a healing ritual since earliest human history, but the establishment of dance therapy as a profession is relatively recent (Chodorow 1991). Dance therapy is also sometimes referred to as dance movement therapy (DMT) (Payne 2006). It is informed by contemporary psychological and psychotherapeutic theories, body psychotherapy and multicultural trends in dance (Payne 2006). According to the American Dance Therapy Association (ADTA), dance therapy can be used with people of all ages, race or ethnic background in the form of individual or group therapy (Figure 1). It is said to be effective in the treatment of people with developmental, medical, social, physical and psychological impairments. It can be practiced in various settings, such as mental health rehabilitation, medical, educational, forensic, nursing homes, day care, disease prevention and health promotion programs.
1.

Dance therapy
There is, however, no special therapeutic dance. Dance only becomes therapeutic in the hands of a specialist or therapist (Exiner 1994). Therapeutic dance in any situation or with any population involves thinking, feeling and willing. The treatment approach is individualised, for example, duration of treatment sessions can vary from 20 minutes to 90 minutes depending on the individual client's frustration and tolerance levels. According to Exiner 1994, the model of a dance therapy session commonly involves the following phases: entry, exploration, core action, review and conclusion. Participants tune up at entry stage and prepare their body for action. Then the movements that arise during the entry phase are experimented with in the exploration phase. Some of the physically beneficial and emotionally significant movements are then selected to be taken through to the core action phase and become themes. Movements are refined at core action phase and close attention is paid to its psycho‐physical contents. Recognition of further therapeutic steps is also developed through this process. Before concluding the sessions, a review of the material is usually arranged. The therapist decides with participants what would be valuable for them to take away.
How the intervention might work
The American Dance Therapy Association (ADTA) defines dance therapy as "the psychotherapeutic use of movement as a process which furthers the emotional, social, cognitive, and physical integration of the individual". Payne 2006 notes that the principle of dance therapy is based on the assumption that motion and emotion are in reciprocal interaction. Through this relationship as a channel, one can embody a deeper connection with oneself. From a therapeutic point of view, there are a number of factors that make dance therapy particularly appropriate for use as therapeutic tool. Firstly, through body movement dance stimulates and releases feelings. Secondly, dance enables the person to release communications and contact non‐verbally. Thirdly, the non‐critical therapeutic setting often leads to reduction of anxiety. Fourthly, free movements with rhythm together create joy, both physically and emotionally. Finally, humans' natural responses to rhythm promote both individual movement and participatory behaviour of a group (Espenak 1981). From a technical point of view, the foundation of dance therapy is 'the physical phenomena that provokes the occurrence of the emotion'. The therapist learns to interpret the client's motor expression and to relate their personal movements to personal feelings, and then reach the feeling through opportunities for experience in movement.
Why it is important to do this review
Dance therapy has been offered in a range of different settings for people with schizophrenia. Its efficacy as a therapy for this group of people, however, has yet to be determined.
Objectives
To evaluate the effects of dance therapy for people with schizophrenia or schizophrenia‐like illnesses compared with standard care and other interventions.
Methods
Criteria for considering studies for this review
Types of studies
All relevant randomised controlled trials. We excluded quasi‐randomised studies, such as those where allocation is undertaken on surname. If a trial was described as double blind, but it was implied it had been randomised, we planned to include it in a sensitivity analysis.
We intended that if there was no substantive difference within primary outcomes (see 'Types of outcome measures') when implied randomised trials were added, then we would include these trials in the final analysis. If there was a substantial difference, we would only analyse clearly randomised trials and describe the results of the sensitivity analysis in the text.
Randomised cross‐over studies were eligible for inclusion but only data up to the point of first cross‐over would have been used because of the instability of the problem behaviours and the likely carry‐over effects of all treatments.
Types of participants
People with schizophrenia or where the majority (80%) of people in the study were likely to suffer from schizophrenia. In studies where non‐specific labels were used, such as "chronic serious mental illness" we would have assumed that most people suffered from schizophrenia. We would not have been concerned how the diagnosis was made and we planned to include trials diagnosing people by any criteria, irrespective of gender, age or nationality.
Types of interventions
1. Dance Therapy
Dance therapy (in groups or individually), for any length of time, as an adjunctive treatment for schizophrenia or schizophrenia‐like disorders, regardless of any other biological, psychological or social intervention being used.
We employed The American Dance Therapy Association's (ADTA) definition of dance therapy ‐ "the psychotherapeutic use of movement as a process which furthers the emotional, social, cognitive, and physical integration of the individual"‐ as a standard for inclusion, however, we did not need the therapy to be formally stated as dance therapy, for example, it may be stated as body‐oriented psychological therapy (BPT). We considered any intervention using dance or movement as a therapeutic tool.
2. Standard/routine care
The care that a person with schizophrenia would normally receive had they not been included in the research trial. We considered 'waiting list control groups' as standard care.
3. Other treatments
These include any other biological, psychological or social treatments such as medication, problem‐solving therapy, psycho‐education programmes, social skills training, cognitive‐behavioural therapy, family therapy or psychodynamic psychotherapy.
4. Non intervention
Untreated control groups.
Types of outcome measures
We divided outcomes into short term (less than one month) medium term (one month ‐ three months) and long term (more than three months).
Primary outcomes
1. Service utilisation
1.1 Days in hospital ‐ medium term
2. Clinical global response
2.1 Relapse ‐ medium term
Secondary outcomes
1. Service utilisation
1.1 Hospital admission 1.2 Days in hospital ‐ other than medium term
2. Clinical global response
2.1 Global state ‐ not improved 2.2 Relapse ‐ other than medium term 2.3 Average change or endpoint score in global state 2.4 Leaving the study early 2.5 Compliance with medication
3. Mental state
3.1 Positive symptoms (delusions, hallucinations, disordered thinking) 3.2 Negative symptoms (avolition, poor self‐care, blunted affect) 3.3 No clinically important change in specific symptoms 3.4 Average change or endpoint score
4. Social functioning
4.1 Average change or endpoint scores 4.2 Social impairment 4.3 Employment status (employed/unemployed) 4.4 Work‐related activities 4.5 Unable to live independently
5. Quality of life
5.1 No clinically important change in quality of life 5.2 Not any change in quality of life 5.3 Average change or endpoint scores 5.4 No clinically important change in specific aspects of quality of life 5.5 Not any change in specific aspects of quality of life 5.6 Average change or endpoint scores
6. Family outcome
6.1 Average score/change in family burden 6.2 Patient and family coping abilities 6.3 Understanding of the family member with schizophrenia 6.4 Family care and maltreatment of the person with schizophrenia 6.5 Expressed emotion 6.6 Quality of life/satisfaction with care for either recipients of care or their carers 6.7 Economic outcomes 6.8 Cost of care
7. Satisfaction with treatment
7.1 Recipient of treatment not satisfied with therapy 7.2 Recipient of treatment average satisfaction score 7.3 Recipient of treatment average change in satisfaction scores 7.4 Carer not satisfied with treatment 7.5 Carer average satisfaction score 7.6 Carer average change in satisfaction score
8. Adverse effects/events
8.1 No clinically important general adverse effects 8.2 Not any general adverse effects 8.3 Average change or endpoint general adverse effect scores 8.4 No clinically important change in specific adverse effect 8.5 Not any change in specific adverse effects 8.6 Average change or endpoint specific adverse effects 8.7 Suicide and all causes of mortality
9. 'Summary of findings' table
We used the GRADE approach to interpret findings (Schünemann 2008) and used the GRADE profiler to import data from Review Manager (RevMan) to create 'Summary of findings' tables. These tables provide outcome‐specific information concerning the overall quality of evidence from each included study in the comparison, the magnitude of effect of the interventions examined, and the sum of available data on all outcomes we rated as important to patient‐care and decision making. We selected the following main outcomes for inclusion in the Table 1.
1. Service utilisation
1.1 days in hospital ‐ medium term
2. Clinical global response
2.1 relapse ‐ medium term 2.2 leaving the study early ‐ short term and long term
3. Mental state
3.1 no clinically important change in specific symptoms 3.2 positive symptoms and negative symptoms endpoint score
4. Satisfaction with treatment
5. Quality of life
Search methods for identification of studies
For previous search strategy please see Appendix 2.
Electronic searches
Updated search(2012)
1. Cochrane Schizophrenia Group Trials Register (July 2012)
The Trials Search Co‐ordinator searched the Cochrane Schizophrenia Group’s Trials Register (10th July 2012)
The ‘Intervention’ field was searched using the phrase:
*danc*
The Cochrane Schizophrenia Group’s Trials Register is compiled by systematic searches of major databases, handsearches of journals and conference proceedings (see Group Module). Incoming trials are screened by the Trial Search Co‐ordinator and assigned to relevant existing or new review titles.
2. Chinese main medical databases (1 January 2007 to 17 September 2012)
2.1 Chongqing VIP Database (VIP)
(R=随机+对照+对比+比较+盲法)*(R=分裂症+精神病+分裂样+精神分裂)*(R=(舞蹈+跳舞+运动+动作)) (note: R abstract, '+' OR, '*' and)
2.2 WANFANG Database
((abstract:随机) or (abstract:对照) or (abstract:对比) or (abstract:比较) or (abstract:盲法)) ((abstract:分裂症) or (abstract:精神分裂) or (abstract:精神病)or(abstract:分裂样)) ((abstract:舞蹈) or (abstract:跳舞) or (abstract:动作) or (abstract:运动))
2.3 China National Knowledge Infrastructure (CNKI)
(AB=随机+对照+对比+比较+盲法) and (AB=分裂症+精神分裂+分裂样+精神病) and (AB=跳舞+舞蹈+运动+动作) (note: AB abstract, '+' OR )
2.4 Chinese biomedicine Database (CBM‐disk)
((abstract:随机 or abstract:对照 or abstract:对比 or abstract:比较 or abstract:盲法) and (abstract:分裂症 or abstract:精神分裂 or abstract:精神病 or abstract:分裂样)) and (abstract:舞蹈 or abstract:跳舞 or abstract:运动 or abstract:动作)
Searching other resources
We inspected references of all identified studies (included and excluded) for further relevant trials. We also contacted the first authors of the one included study for information regarding unpublished trials and, if necessary, extra data on the published trial.
Data collection and analysis
For previous data collection and analyses please see Appendix 3.
Selection of studies
Review authors (JR and JX) independently inspected citations identified in the search. After identifying potentially relevant abstracts we ordered full papers. JX re‐inspected a random 10% to ensure reliable selection. Once the full papers had been obtained JR and JX decided if they met the review inclusion criteria. We resolved disputes over whether studies met the inclusion criteria by discussion, but if we had been unable to reach agreement, we planned to addthese trials to Studies awaiting classification until further information became available.
Data extraction and management
1. Extraction
For this update, JR and JX extracted data from the included study. We extracted data presented only in graphs and figures where possible. When further information was necessary, we contacted the authors of the study in order to obtain missing data or for clarification. If we had identified studies that were multicentre, where possible, we planned to extract the data relevant to each component centre separately.
2. Management
2.1 Forms
We extracted data onto standard, simple forms.
2.2 Scale‐derived data
We included continuous data from rating scales only if: a. the psychometric properties of the measuring instrument have been described in a peer‐reviewed journal (Marshall 2000); and b. the measuring instrument has not been written or modified by one of the trialists for that particular trial.
Ideally, the measuring instrument should either be i. a self‐report or ii. completed by an independent rater or relative (not the therapist). We realise that this is not often reported clearly; we have noted whether or not this is the case in Description of studies.
2.3 Endpoint versus change data
There are advantages of both endpoint and change data. Change data can remove a component of between‐person variability from the analysis. On the other hand, calculation of change needs two assessments (baseline and endpoint), which can be difficult in unstable and difficult to measure conditions such as schizophrenia. We decided primarily to use endpoint data, and only use change data if the former were not available. Only one trial was included, therefore, we were unable to combine data. If in future updates of this review, we identify more trials, we will combine endpoint and change data in the analysis using mean differences (MD) rather than standardised mean differences throughout (Higgins 2011, Chapter 9.4.5.2).
2.4 Skewed data
Continuous data on clinical and social outcomes are often not normally distributed. To avoid the pitfall of applying parametric tests to non‐parametric data, we aimed to apply the following standards to all data before inclusion:
a) standard deviations (SDs) and means are reported in the paper or obtainable from the authors;
b) when a scale starts from the finite number zero, the SD, when multiplied by two, is less than the mean (as otherwise the mean is unlikely to be an appropriate measure of the centre of the distribution (Altman 1996));
c) if a scale started from a positive value (such as the Positive and Negative Syndrome Scale (PANSS, Kay 1986), which can have values from 30 to 210), we modified the calculation described above to take the scale starting point into account. In these cases skew is present if 2 SD > (S‐S min), where S is the mean score and S min is the minimum score.
Endpoint scores on scales often have a finite start and end point and these rules can be applied. We entered skewed endpoint data from studies of fewer than 200 participants as 'other data' within the data and analyses rather than into a statistical analysis. Skewed data pose less of a problem when looking at the mean if the sample size is large; we would have entered such endpoint data into syntheses.
When continuous data are presented on a scale that includes a possibility of negative values (such as change data), it is difficult to tell whether data are skewed or not, we entered skewed change data into analyses regardless of size of study.
2.5 Common measure
To facilitate comparison between trials, we intended to convert variables that can be reported in different metrics, such as days in hospital (mean days per year, per week or per month) to a common metric (e.g. mean days per month).
2.6 Conversion of continuous to binary
Where possible, we made efforts to convert outcome measures to dichotomous data. This can be done by identifying cut‐off points on rating scales and dividing participants accordingly into 'clinically improved' or 'not clinically improved'. It is generally assumed that if there is a 50% reduction in a scale‐derived score such as the Brief Psychiatric Rating Scale (BPRS, Overall 1962) or PANSS (Kay 1986), this could be considered as a clinically significant response (Leucht 2005; Leucht 2005a). If data based on these thresholds were not available, we used the primary cut‐off presented by the original authors.
2.7 Direction of graphs
Where possible, we entered data in such a way that the area to the left of the line of no effect indicated a favourable outcome for dance therapy. If we had to report data where the left of the line indicates an unfavourable outcome, this was noted in the relevant graphs.
Assessment of risk of bias in included studies
For this update, JR and JX worked independently using criteria described in the Cochrane Handbook for Systematic Reviews of Interventions (Higgins 2011) to assess trial quality. This new set of criteria is based on evidence of associations between overestimate of effect and high risk of bias of the article such as sequence generation, allocation concealment, blinding, incomplete outcome data and selective reporting.
Where inadequate details of randomisation and other characteristics of the included trial were provided, we contacted the authors of the study in order to obtain additional information.
We have noted the level of risk of bias in both the text of the review and in the Table 1.
Measures of treatment effect
1. Binary data
For binary outcomes we calculated a standard estimation of the risk ratio (RR) and its 95% confidence interval (CI). It has been shown that RR is more intuitive (Boissel 1999) than odds ratios and that odds ratios tend to be interpreted as RR by clinicians (Deeks 2000). The Number Needed to Treat/Harm (NNT/H) statistic with its confidence intervals is intuitively attractive to clinicians but is problematic both in its accurate calculation in meta‐analyses and interpretation (Hutton 2009). For binary data presented in the 'Summary of findings' table, where possible, we calculated illustrative comparative risks.
2. Continuous data
For continuous outcomes we estimated mean difference (MD) between groups. We would prefer not to calculate effect size measures (standardised mean difference (SMD)). However, if scales of very considerable similarity had been used, we would have presumed there was a small difference in measurement, and we would have calculated effect size and transformed the effect back to the units of one or more of the specific instruments.
Unit of analysis issues
1. Cluster trials
Studies increasingly employ 'cluster randomisation' (such as randomisation by clinician or practice), but analysis and pooling of clustered data poses problems. Authors often fail to account for intra‐class correlation in clustered studies, leading to a 'unit of analysis' error (Divine 1992) whereby P values are spuriously low, confidence intervals (CIs) unduly narrow and statistical significance overestimated. This causes type I errors (Bland 1997; Gulliford 1999).
If clustering had not been accounted for in primary studies, we planned to present data in a table, with a (*) symbol to indicate the presence of a probable unit of analysis error. In subsequent versions of this review, if we include cluster randomised trials, we will seek to contact first authors of such studies to obtain intra‐class correlation coefficients (ICCs) for their clustered data and to adjust for this by using accepted methods (Gulliford 1999). Where clustering has been incorporated into the analysis of primary studies, we will present these data as if from a non‐cluster randomised study, but adjust for the clustering effect.
We have sought statistical advice and have been advised that the binary data as presented in a report should be divided by a 'design effect'. This is calculated using the mean number of participants per cluster (m) and the ICC [Design effect = 1+(m‐1)*ICC] (Donner 2002). If the ICC is not reported it will be assumed to be 0.1 (Ukoumunne 1999).
If cluster studies have been appropriately analysed taking into account ICCs and relevant data documented in the report, synthesis with other studies would be possible using the generic inverse variance technique.
2. Cross‐over trials
A major concern of cross‐over trials is the carry‐over effect. It occurs if an effect (e.g. pharmacological, physiological or psychological) of the treatment in the first phase is carried over to the second phase. As a consequence, on entry to the second phase the participants can differ systematically from their initial state despite a wash‐out phase. For the same reason cross‐over trials are not appropriate if the condition of interest is unstable (Elbourne 2002). As both effects are very likely in severe mental illness, if we had included cross‐over trials, we intended only to use the data of the first phase of cross‐over studies.
3. Studies with multiple treatment groups
No studies with multiple treatment groups were included.
In future updates of this review, if an included study involves more than two treatment arms, if relevant, we will present the additional treatment arms in comparisons. If data are binary, we will simply add and combine them within the two‐by‐two table. If data are continuous, we will combine data following the formula in section 7.7.3.8 (Combining groups) of the Cochrane Handbook for Systemic reviews of Interventions (Higgins 2011). Where the additional treatment arms are not relevant, we will not reproduce these data.
Dealing with missing data
1. Overall loss of credibility
At some degree of loss of follow‐up, data must lose credibility (Xia 2009). We chose that, for any particular outcome, should more than 40% of data be unaccounted for, we would not reproduce these data or use them within analyses. If, however, more than 40% of those in one arm of a study were lost, but the total loss was less than 40%, we addressed this within the 'Summary of findings' table by down‐rating quality. Finally, we also downgraded quality within the 'Summary of findings' table for losses of 25% to 40% in total.
2. Binary
In the case where attrition for a binary outcome was between 0% and 40% and where these data were not clearly described, we presented data on a 'once‐randomised‐always‐analyse' basis (an intention‐to‐treat analysis). Those leaving the study early were all assumed to have the same rates of negative outcome as those who completed, with the exception of the outcome of death and adverse effects. For these outcomes the rate of those who stayed in the study ‐ in that particular arm of the trial ‐ were used for those who did not. We undertook a sensitivity analysis to test how prone the primary outcomes were to change when 'completer' data only were compared to the intention‐to‐treat analysis using the above assumptions.
3. Continuous
3.1 Attrition
In the case where attrition for a continuous outcome is between 0% and 40% and completer‐only data were reported, we reproduced these.
3.2 Standard deviations
If standard deviations (SDs) were not reported, we first tried to obtain the missing values from the authors. If not available, where there were missing measures of variance for continuous data, but an exact standard error (SE) and confidence intervals (CIs) available for group means, and either the P value or T value available for differences in mean, we can calculate them according to the rules described in the Handbook (Higgins 2011): When only the SE is reported, SDs are calculated by the formula SD = SE * square root (n). Chapters 7.7.3 and 16.1.3 of the Handbook (Higgins 2011) present detailed formulae for estimating SDs from P values, T or F values, CIs, ranges or other statistics. If these formulae do not apply, we can calculate the SDs according to a validated imputation method which is based on the SDs of the other included studies (Furukawa 2006). Although some of these imputation strategies can introduce error, the alternative would be to exclude a given study’s outcome and thus to lose information. We nevertheless examined the validity of the imputations in a sensitivity analysis excluding imputed values.
3.3 Last observation carried forward
We anticipated that in some studies the method of last observation carried forward (LOCF) would be employed within the study report. As with all methods of imputation to deal with missing data, LOCF introduces uncertainty about the reliability of the results (Leucht 2007). If LOCF data had been used in the trial and less than 40% of the data had been assumed, we planned to reproduce these data and indicate that they were the product of LOCF assumptions.
Assessment of heterogeneity
We only included one study in this version of the review. In future updates of this review, if we include more studies, we will use the following methods to assess heterogeneity.
1. Clinical heterogeneity
We will consider all included studies initially, without seeing comparison data, to judge clinical heterogeneity. We will simply inspect all studies for clearly outlying people or situations which we had not predicted would arise. When such situations or participant groups arise, we will discuss these fully.
2. Methodological heterogeneity
We will consider all included studies initially, without seeing comparison data, to judge methodological heterogeneity. We will simply inspect all studies for clearly outlying methods which we had not predicted would arise. When such methodological outliers arise, we will discuss these fully.
3. Statistical heterogeneity
3.1 Visual inspection
We will visually inspect graphs to investigate the possibility of statistical heterogeneity.
3.2 Employing the I2 statistic
We will investigate heterogeneity between studies by considering the I2 method alongside the Chi2 P value. The I2 provides an estimate of the percentage of inconsistency thought to be due to chance (Higgins 2003). The importance of the observed value of I2 depends on i. magnitude and direction of effects and ii. strength of evidence for heterogeneity (e.g. P value from Chi2 test, or a confidence interval for I2). An I2 estimate greater than or equal to around 50% accompanied by a statistically significant Chi2 statistic will be interpreted as evidence of substantial levels of heterogeneity (Higgins 2011). If substantial levels of heterogeneity are found in the primary outcome, we will explore reasons for the heterogeneity (Subgroup analysis and investigation of heterogeneity).
Assessment of reporting biases
Reporting biases arise when the dissemination of research findings is influenced by the nature and direction of results (Egger 1997). These are described in Section 10 of the Handbook (Higgins 2011). We are aware that funnel plots may be useful in investigating reporting biases but are of limited power to detect small‐study effects. We were unable to use funnel plots for outcomes as there was only one included study. In future updates of this review, we will not use funnel plots for outcomes where there are 10 or fewer studies, or where all studies are of similar sizes. In other cases, where funnel plots are possible, we will seek statistical advice in their interpretation.
Data synthesis
We understand that there is no closed argument for preference for use of fixed‐effect or random‐effects models. The random‐effects method incorporates an assumption that the different studies are estimating different, yet related, intervention effects. This often seems to be true to us and the random‐effects model takes into account differences between studies even if there is no statistically significant heterogeneity. There is, however, a disadvantage to the random‐effects model: it puts added weight onto small studies which often are the most biased ones. Depending on the direction of effect, these studies can either inflate or deflate the effect size. In this version of the review we were unable to combine data. In future updates, if there are more trials, we will use the fixed‐effect model for all analyses. The reader will, however, able to choose to inspect the data using the random‐effects model.
Subgroup analysis and investigation of heterogeneity
1. Subgroup analyses ‐ only primary outcomes
1.1 Clinical state, stage or problem
We proposed to undertake this review and provide an overview of the effects of dance therapy for people with schizophrenia in general. In addition, however, we tried to report data on subgroups of people in the same clinical state, stage and with similar problems.
2. Investigation of heterogeneity
There is only one included study.
In future updates, if we include more studies, if inconsistency is high, we will report this. First, we will investigate whether data had been entered correctly. Second, if data are correct, we will visually inspect the graph and successively remove outlyingstudies to see if homogeneity is restored. For this review, we have decided that should this occur with data contributing to the summary finding of no more than around 10% of the total weighting, we will present data. If not, then we will not pool data and we will discuss these issues. We know of no supporting research for this 10% cut‐off, but we use prediction intervals as an alternative to this unsatisfactory state.
When unanticipated clinical or methodological heterogeneity is obvious we will simply state hypotheses regarding these for future reviews or versions of this review. We do not anticipate undertaking analyses relating to these.
Sensitivity analysis
We would have applied all sensitivity analyses to the primary outcomes of this review.
1. Implication of randomisation
We aimed to include trials in a sensitivity analysis if they were described in some way so as to imply randomisation. For the primary outcomes, we would have included these studies and if there was no substantive difference when the implied randomised studies were added to those with better description of randomisation, then we would have entered all data from these studies.
2. Assumptions for lost binary data
Where assumptions had to be made regarding people lost to follow‐up (see Dealing with missing data), we compared the findings of the primary outcomes when we use our assumption/s and when we used data only from people who completed the study to that point. If there was a substantial difference, we reported results and discussed them but continued to employ our assumption.
If assumptions had to be made regarding missing SDs data (see Dealing with missing data), we planned to compare the findings of the primary outcomes when we used our assumption/s and when we used data only from people who completed the study to that point. A sensitivity analysis would have been undertaken to test how prone results were to change when completer‐only data only were compared to the imputed data using the above assumption. If there had been a substantial difference, we would have reported results and discussed them but we would have continued to employ our assumption
3. Risk of bias
We planned to analyse the effects of excluding trials that were judged to be at high risk of bias across one or more of the domains of randomisation (implied as randomised with no further details available): allocation concealment, blinding and outcome reporting for the meta‐analysis of the primary outcome. If the exclusion of trials at high risk of bias did not substantially alter the direction of effect or the precision of the effect estimates, then we would have included data from these trials in the analysis.
4. Imputed values
We also intended to undertake a sensitivity analysis to assess the effects of including data from trials if we used imputed values for ICC in calculating the design effect in cluster randomised trials.
If we had noted substantial differences in the direction or precision of effect estimates in any of the sensitivity analyses listed above, we would not have pooled data from the excluded trials with the other trials contributing to the outcome, but presented them separately.
5. Fixed‐effect and random‐effects
We used a fixed‐effect model to calculate data from the one included study.
Results
Description of studies
For more detailed description of each studies, please refer to the Characteristics of included studies and Characteristics of excluded studies tables.
Results of the search
1. 2007 search
We found six studies in the 2007 search. After obtaining the full articles, five were excluded, leaving only one possible to include.
2. 2012 search
We identified 1020 citations (1019 from the main Chinese database and one from the Cochrane Schizophrenia Group Trials register) from the initial search strategy.
In total, 1026 citations (six from 2007 search and 1020 from 2012 search) were screened. After removing duplicate and irrelevant references, 12 references were considered as potentially relevant and they were retrieved for further assessment; 11 were excluded (four not randomised, four not dance therapy, two no usable data, one an ongoing study, Characteristics of ongoing studies), leaving only one to include in this review. Please also see Figure 2.
2.
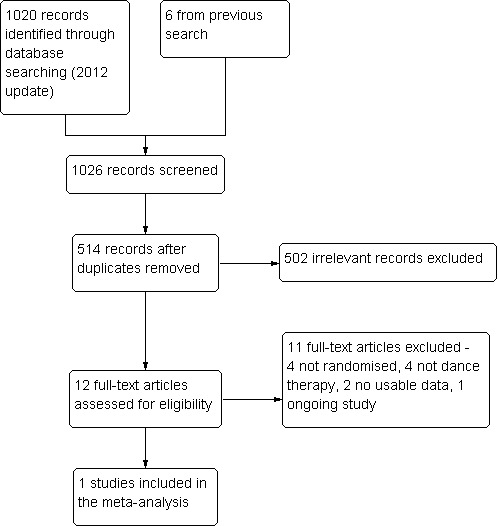
Study flow diagram to show trial selection
Included studies
No new trials were added from the new search in 2012.
One study, Rohricht 2006 is included in this review. This randomised, single blind study used sealed envelopes to conceal allocation.
1. Length of trial
The treatment period of Rohricht 2006 lasted for 10 weeks with a follow‐up four months.
2. Participants
All participants were diagnosed with schizophrenia (Diagnostic Statistical Manual, version 4 (DSM‐IV)). Participants were adult male and female out‐patients between 20 to 55 years of age. People with organic brain disease, severe/chronic physical illness or substance misuse were excluded.
3. Setting
This trial took place in the community.
4. Study size
Study size was small with only 45 people randomised.
5. Intervention
5.1 Intervention group
All participants in the intervention group maintained their standard care and in addition received dance therapy. The dance therapy used had five stages: a) opening circle, to describe feelings and energy level; b) warm‐up section, standing in a circle and warm‐up using different body parts and movements; c) structured task section, mirroring each other's movement, creating body image sculpture in partners; d) creative movement section, group mirroring, creating group sculptures. reflecting on how this feels; e) closing circle, reflecting on group experience, re‐focusing on self with body‐oriented exercises such as self‐touch, verbal integration.
5.2 Control group
The control group received standard care plus supportive counselling. For the supportive counselling, the therapist facilitated a safe and supportive atmosphere and gave the participants opportunity to talk about specific difficulties. The group then engaged in discussing their experience and trying to identify the contributing factors to the problems.
6. Outcomes
A number of outcomes were reported. Positive and Negative Syndrome Scale (PANSS) negative, positive and total scores were measured at the end of treatment and at four‐month follow‐up. We were, however, unable to use assessment data at the four‐month follow‐up, as over 40% of the participants were lost to follow‐up at this stage. Participant satisfaction with treatment was reported using Client's Assessment of Treatment Scale (CAT) and Manchester Short Assessment of Quality of Life (MANSA) scales. Leaving the study early and losses to follow‐up were also reported. Extrapyramidal symptom scale scores were reported. These data were skewed (please refer to 'other data' table). However, the service utilisation and relapse data were not reported in the included study.
6.1 Mental state
Positive and Negative Syndrome Scale ‐ PANSS (Kay 1986)
This schizophrenia scale has 30 items, each of which can be defined on a seven‐point scoring system varying from one (absent) to seven (extreme). This scale can be divided into three sub‐scales for measuring the severity of general psychopathology, positive symptoms, and negative symptoms. A low score indicates lesser severity.
6.2 Satisfaction with care
Client's Assessment of Treatment Scale ‐ CAT (Priebe 1995) This is a Likert scale that measures seven aspects of treatment. Each aspect was rated on an 11‐point rating scale ranging form zero (extreme negative) to 10 (extreme positive). High score equals positive outcome.
6.3 Adverse effects (skewed data)
Extrapyramidal Symptom Scale ‐ EPS (Simpson 1970) This 10‐item scale, with a scoring system of zero to four for each item, measures drug‐induced Parkinsonism, a short‐term drug‐induced movement disorder. A low score indicates low levels of Parkinsonism.
6.4 Quality of life
Manchester Short Assessment of Quality of Life ‐ MANSA (Priebe 1999) A 16‐item scale (four objective, 12 subjective questions), measures satisfaction with life, job, financial situation, number and quality of friends, leisure activities, accommodation, personal safety, sex life, relationship with family, physical and mental health etc. Each item is rated on a seven‐point scale, from one (could not be worse) to seven (could not be better). Higher score indicates a better quality of life.
Excluded studies
For more detailed description of each study, please refer to the Characteristics of excluded studies table.
We have now excluded 11 studies from this review, six of which we excluded after the 2012 search (Qu 2007; Tan 2010; Tang 2011; Yao 2008; Zhou 2009; ISRCTN 2012), and five of which we excluded after the 2007 search (Apter 1978; Killaspy 1997; Su 1999; Wu 2003; Yang 2005). Four of the excluded studies were not randomised (Tang 2011; Wu 2003; Yao 2008; Zhou 2009).Two trials have no useable data (Apter 1978; Su 1999). All data were reported and there are no mean or variances reported. Killaspy 1997, Yang 2005, Qu 2007 and Tan 2010 were randomised trials but their interventions were not dance therapy (art therapy, group psychoeducation and music therapy plus dance therapy). One study was ongoing(ISRCTN 2012).
Studies awaiting assessment
No studies are awaiting assessment.
Ongoing studies
We are aware of one ongoing study (See Characteristics of ongoing studies).
Risk of bias in included studies
For summary of risk of bias across included studies please see Figure 3 and Figure 4.
3.
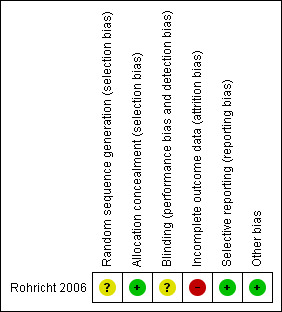
Methodological quality summary: review authors' judgements about each methodological quality item for the included study.
4.
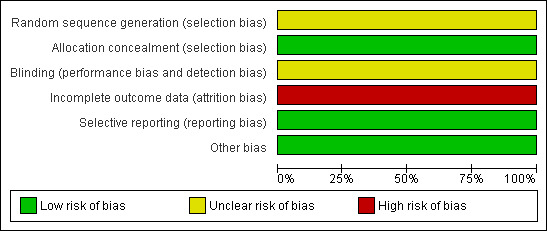
Risk of bias graph: review authors' judgements about each risk of bias item presented as percentages across all included studies.
Allocation
Although Rohricht 2006 did not fully describe how they randomised participants, they did state sealed envelopes were used for allocation concealment.
Blinding
Rohricht 2006 was single blind (assessor blind).
Incomplete outcome data
Loss to follow‐up was high in the control group with over 40% loss to follow‐up. We are not sure if people would have left each group for different reasons. The study does not reassure us on this point.
Selective reporting
There is no selective reporting. All measurements as stated in the 'methods' section of the paper are reported.
Other potential sources of bias
For Rohricht 2006, data reporting was good. It would have helped to have more detail on why people left early.
Effects of interventions
See: Table 1
1. Primary outcome
The only included study did not report the outcomes about service utilisation and relapse and no data were provided for them.
2. Secondary outcome
2.1 Mental state
Short‐term mental state data from the PANSS were presented.
2.1.1 Total scores
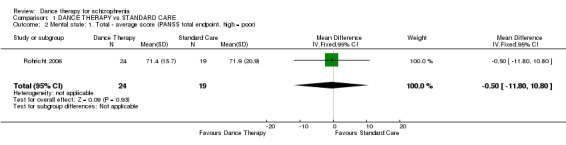
The average total endpoint scores were equivocal (1 randomised controlled trial (RCT), n = 43, mean difference (MD) ‐0.50 95% confidence interval (CI) ‐11.80 to 10.80)
2.1.2 Positive symptoms
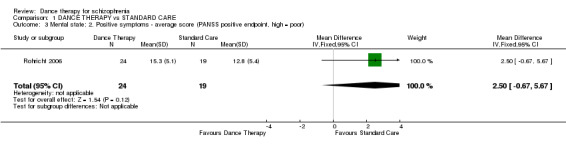
Again, no significant differences in positive scores were found between groups (1 RCT, n = 43, MD 2.50 95% CI ‐0.67 to 5.67).
2.1.3 Negative symptoms
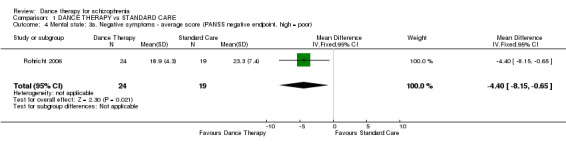
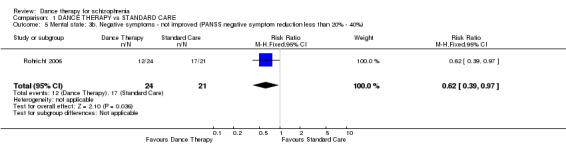
Here significant differences, favouring dance therapy were found. Those in the dance therapy group had significantly lower average endpoint scores (1 RCT, n = 43, MD ‐4.40 95% CI ‐8.15 to ‐0.65) and the numbers with a greater than 20% reduction in score were also just significantly higher in the dance therapy group (1 RCT, n = 45, risk ratio (RR) 0.62 95% CI 0.39 to 0.97).
2.2 Clinical global response‐leaving the study early
2.2.1 Short term
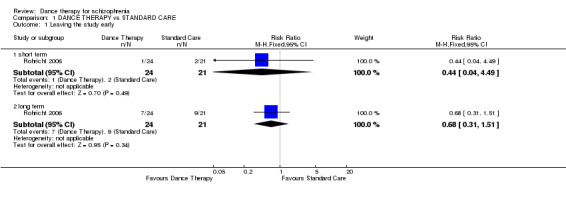
At the end of treatment there was no significant difference between groups in the number of people leaving the study early (1 RCT, n = 45, RR 0.44 95% CI 0.04 to 4.49).
2.2.2 Long term
Again, at the four‐month follow‐up, there was no significant difference between groups in the number of people leaving the study early (1 RCT, n = 45, RR 0.68 95% CI 0.31 to 1.51).
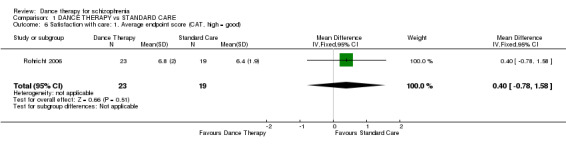
2.3. Satisfaction with care
The CAT scale was used to present short‐term data for satisfaction with care. At the end of therapy there was no significant difference in effect between groups (1 RCT, n = 42, MD 0.40 95% CI ‐0.78 to 1.58)
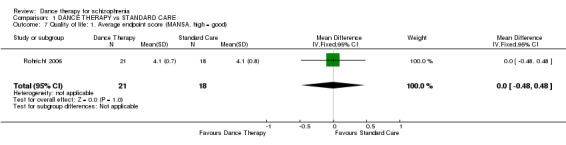
2.4. Quality of life
Short‐term data from the MANSA scale were presented and again, at the end of therapy in this trial, there were no significant differences in quality of life between groups (1 RCT, n = 39, MD 0.00 95% CI ‐0.48 to 0.48).
Discussion
Summary of main results
COMPARISON: DANCE THERAPY versus STANDARD CARE
1. Service utilisation
It is unfortunate that no data are available for service utilisation.
2. Clinical global response
There was a higher attrition rate in the control group than the experimental group. However, we did not find a significant difference between groups in the number of people leaving the study early at the end of treatment and at the four‐month follow‐up. The better adherence of patients to body‐oriented psychological therapy (BPT) shows a relatively good acceptance of the experimental treatment, which may be considered as a positive effect of BPT itself and facilitate its use in practice. No data on relapse were reported.
3. Mental state
Pooled data found a significant difference between treatment groups on the PANSS endpoint negative score and PANSS negative symptoms reduction. At the end of treatment, significantly more people in the dance therapy group had a greater than 20% reduction in PANSS negative symptom score (1 RCT, n = 45, RR 0.62 CI 0.39 to 0.97), and overall, average negative endpoint scores were lower (1 RCT, n = 43, MD ‐4.40 CI ‐8.15 to ‐0.65). It is hard to gauge what these data mean in everyday life. A 20% reduction may not be that important to some people; a difference in score of four points may be negligible to many. At the same time, a 20% reduction in PANSS negative symptom score just where it is needed for others may be a considerable improvement. This remains one small trial with one interesting result.
4. Satisfaction with treatment
Patients' assessment of treatment was broadly positive: the mean CAT score did not differ between groups after treatment. Equally, patients' ratings of the therapeutic relationship was generally appreciative and did not differ between groups after treatment.
5. Quality of life
Limited data from this one included study found no significant difference between groups after treatment.
6. Adverse effects
Adverse effects were reported using the extrapyramidal symptoms (EPS) scale scores but data from this scale were skewed. The only one included study found than dosages of antipsychotic medication as well as EPS scores did not differ significant between the two groups.
Overall completeness and applicability of evidence
1. Completeness
Evidence from the included study is certainly relevant to the review question, but it is not sufficient to address all of the objectives of this review. We do not really have any good data on service utilisation or other crude but useful outcomes such as global response.
2. Applicability
As stated in the paper, "A single therapist administered [the therapy], and it remains unclear whether the effect can be replicated across different therapists and in other samples and settings" (Rohricht 2006).
Quality of the evidence
Overall, evidence in this review is weak, as we were only able to include one small trial but the quality of this trial is good (Figure 3). Randomisation was undertaken by a project co‐ordinator, who had no involvement in data collection and assessment, opening a sealed envelope. Allocation concealment and single blind assessment were used to ensure the quality of outcomes.
Potential biases in the review process
The process of searching for studies was thorough. We followed strictly the review protocol in the process of study selection, data extraction and analysis. However, usable data from two studies (Apter 1978; Su 1999) could not be obtained, which led to the exclusion of potentially valuable data. Review author JX contacted the authors of these two papers for unpublished data in 2007, but has not received any reply to date. Exclusion of these data could increase the likelihood of bias. In this update, we could detect no other source of bias such as biased source of funding to authors.
Agreements and disagreements with other studies or reviews
As far as we are aware, this is the only systematic review on dance therapy for schizophrenia.
Authors' conclusions
Implications for practice.
1. For those with schizophrenia
The data in this review are inconclusive. There is no evidence to support ‐ or refute ‐ the use of dance therapy. Those with schizophrenia may wish to be involved in future research to help to resolve this lack of evidence.
2. For clinicians
Based on evidence in the current review, there is no reason for clinicians to either encourage or discourage the use of dance therapy. More future research is needed in order to reach a conclusion.
3. For policy makers/managers
Until there are more data, there is no evidence in this review to support change in policy.
Implications for research.
1. General
Two trials were excluded from this review, due to the poor quality of data reporting, diminishing the already small evidence‐base (Apter 1978; Su 1999). Following CONSORT guidance more closely would have made data from Rohricht 2006 more valuable and may have helped considerably increased the power of this review by allowing us to include Apter 1978 and Su 1999.
2. Specific
2.1 Reviews
Excluded studies, nearly meeting the inclusion criteria for this review suggest updates or new reviews are indicated to keep the broader area of 'arts' therapies for schizophrenia complete (Table 2).
1. Reviews in which excluded studies may be included.
| Title | References | Exsiting related review |
| Art therapy for schizophrenia | Killaspy 1997 | Ruddy 2005 |
| Cognitive remediation therapy for schizophrenia | Tan 2010 | McGrath 2000 |
| Information and communication technology‐based cognitive remediation for supporting treatment compliance for people with serious mental illness | Tan 2010 | Välimäki 2012 |
| Music therapy plus dance therapy for schizophrenia | Qu 2007; Tang 2011; Tan 2010 | Mössler 2011 |
| Psychoeducation for schizophrenia | Yang 2005 | Xia 2011 |
2.2 Trials
Larger trials with simple, straight forward design should be encouraged for future research. Clear description of randomisation, allocation concealment and blinding would have reassured us that bias had been minimised. Reporting of more clinically meaningful outcomes such as relapse, admission to hospital, quality of life, cost of care, satisfaction with care, leaving the study early should be encouraged. Continuous data should be reported with mean, standard deviations and number of participants. Endpoint score should always be used when reporting data derived from scales. We have not the experience, nor have we invested the effort of thought or commitment of those who have undertaken trials in this difficult area. There are, however, some gains from producing an overview in this way and we suggest an outline design for future trials (Table 3).
2. Suggested design for a trial of dance therapy.
| Methods | Allocation: centralised sequence generation with table of random numbers or computer‐generated code, stratified by severity of illness, sequence concealed till interventions assigned. Blinding: those recruiting and assigning participants, those assessing outcomes, all blind to allocated group, blinding tested. Duration: minimum of 52 weeks. |
| Participants | Diagnosis: schizophrenia, if operational criteria used these should be in the context of routine care. N = 300*. Age: adults. Sex: men and women. Setting: anywhere dance therapy is available for this group. |
| Interventions | 1. Dance therapy: the nature and frequency of this approach should be clearly described. N = 150. 2. Routine therapy. N = 150. This also should be clearly described. |
| Outcomes | Quality of life: healthy days,** SF‐36***. Service outcomes: days in hospital, time attending psychiatric outpatient clinic. Satisfaction with care: patients/carers. Global state: CGI.*** Mental state: CGI. Social functioning: to include occupational status. Adverse effects: including mortality. Economic data. |
| Notes | * size of study to detect a 10% difference in improvement with 80% certainty. ** Primary outcome. *** If scales are used to measure outcome then there should be binary cut off points, defined before study starts, of clinically important improvement. |
CGI: Clinical Global Impression
What's new
| Date | Event | Description |
|---|---|---|
| 2 October 2013 | New citation required but conclusions have not changed | Update completed: no new included studies, conclusions not changed. |
| 18 June 2013 | New search has been performed | Results from update searching added to review, no new included studies. |
History
Protocol first published: Issue 4, 2007 Review first published: Issue 1, 2009
| Date | Event | Description |
|---|---|---|
| 10 July 2012 | Amended | Update search of Cochrane Schizophrenia Group's Trial Register (see Search methods for identification of studies), one study added to awaiting classification. |
| 5 October 2011 | Amended | Contact details updated. |
| 19 January 2011 | Amended | Contact details updated. |
| 10 November 2010 | Amended | Contact details updated. |
| 11 November 2009 | Amended | Contact details updated. |
| 20 July 2009 | Amended | Plain Language Summary added |
Acknowledgements
The authors would like to thank Judy Wright for running the trials search and Clive Adams for editorial input and Chunbo Li for his help in the preparation of this updating manuscript and editing.
We would also like to acknowledge and thank our consumer contributors, Janey Antoniou and Ben Gray of RETHINK, UK www.rethink.org, who have written Plain language summaries (PLS) of this review, Jane wrote the original PLS and Ben has written the current version for this update.
Samantha Roberts, the Trials Search Co‐ordinator of the Cochrane Schizophrenia Group ran the 2012 search.
Finally, we would like to acknowledge Tessa Grant for her help in trial selection for the previous version of this review.
Appendices
Appendix 1. Previous plain language summary
Dance therapy for schizophrenia
Schizophrenia can be a long‐term disabling illness. The most common treatments for people with this condition are medication (antipsychotics) and talking therapies, especially cognitive behavioural therapy and family therapy. These treatments work well for people with 'positive' symptoms (hearing voices and other alterations of the senses) and delusions (distortions in the way the world is seen). However people experiencing 'negative' symptoms (such as flattening of mood, poverty of speech, lack of drive, loss of feeling, social withdrawal and decreased spontaneous movement) do not respond as well. Dance therapy (also called dance movement therapy) uses dance and movement to explore a person’s emotions in a non‐verbal way. The therapist will help the individual to interpret their movement as a link to personal feelings. This review aims to assess how successful this therapy is as a treatment for schizophrenia, when compared to standard care or other interventions. Six studies were identified but five were excluded because there were no reliable data, because they were for a therapy other than dance or because they were not properly randomised. The included study compared 10 weeks of group dance therapy plus standard care, to group supportive counselling plus standard care for the same length of time. It was a community‐based project involving 45 people and both groups were followed up after four months. Of the outcomes measured (mental state, satisfaction with care, leaving the study early, quality of life and adverse effects) the majority showed no difference between the two groups. However, when negative symptoms were specifically measured after 10 weeks of treatment, there was a significant improvement in the mental state of the dance therapy group. At the four month follow‐up more than 40% of the participants had been lost from both groups, making it impossible to draw any valid conclusions from the outcomes measured. Overall, because of the relatively small number of people, the data from this trial were inconclusive. However a larger randomised trial measuring outcomes such as relapse, admission to hospital, quality of life, leaving the study early, cost of care and satisfaction with treatment would help clarify whether dance therapy is an effective treatment for schizophrenia; especially for negative symptoms that don't respond so well to medication and talking therapies.(Plain language summary prepared for this review by Janey Antoniou of RETHINK, UK www.rethink.org).
Appendix 2. Previous search strategy
1. Cochrane Schizophrenia Group Trials Register (July 2007)
We searched the Cochrane Schizophrenia Group Trials Register (July 2007) using the phrase:
[(* danc* in title, abstract, index terms of REFERENCE) or (danc* in interventions of STUDY)]
This register is compiled by systematic searches of major databases, hand searches and conference proceedings (see Group Module).
Appendix 3. Previous data collection and analyses
1. Extraction JX and TG independently extracted data from included studies. JX carried out a separate re‐extraction of data to ensure reliability. Again, when disputes arose, we attempted to resolve these by discussion and where further clarification was needed we contacted the authors of trials to provide us with the missing data. While waiting for further information, trials were added to the list of those awaiting assessment.
Where possible, we entered data in such a way that the area to the left of the line of no effect indicated a favourable outcome for dance therapy.
2. Management Data were extracted onto standard, simple forms.
3. Scale‐derived data We included continuous data from rating scales only if the measuring instrument had been described in a peer‐reviewed journal (Marshall 2000) and the instrument is either a self‐report or completed by an independent rater or relative (not the therapist).
Assessment of risk of bias in included studies
Again working independently, JX and TG assessed risk of bias using the tool described in The Cochrane Collaboration Handbook (Higgins 2005). This tool encourages consideration of how the sequence was generated, how allocation was concealed, the integrity of blinding at outcome, the completeness of outcome data, selective reporting and other biases. We would not have included studies where sequence generation was at high risk of bias or where allocation was clearly not concealed.
If disputes arose as to which category a trial has to be allocated, again resolution was made by discussion between the authors.
Measures of treatment effect
1. Binary data For binary outcomes we calculated a standard estimation of the fixed‐effect risk ratio (RR) and its 95% confidence interval (CI). For statistically significant results we calculated the number needed to treat/harm statistic (NNT/H), and its 95% confidence interval (CI) using Visual Rx taking account of the event rate in the control group.
2. Continuous data 2.1 Summary statistic For continuous outcomes we estimated a fixed‐effect weighted mean difference (WMD) between groups. We did not calculate effect size measures.
2.2 Endpoint versus change data We preferred to use scale endpoint data, which typically cannot have negative values and is easier to interpret from a clinical point of view. Change data are often not ordinal and are very problematic to interpret. If endpoint data were unavailable, we used change data.
2.3 Skewed data Continuous data on clinical and social outcomes are often not normally distributed. To avoid the pitfall of applying parametric tests to non‐parametric data, we aimed to apply the following standards to all data before inclusion: (a) standard deviations and means are reported in the paper or obtainable from the authors; (b) when a scale starts from the finite number zero, the standard deviation, when multiplied by two, is less than the mean (as otherwise the mean is unlikely to be an appropriate measure of the centre of the distribution, (Altman 1996); (c) if a scale starts from a positive value (such as PANSS which can have values from 30 to 210), the calculation described above will be modified to take the scale starting point into account. In these cases skew is present if 2SD>(S‐S min), where S is the mean score and S min is the minimum score. Endpoint scores on scales often have a finite start and end point and these rules can be applied. When continuous data are presented on a scale which includes a possibility of negative values (such as change data), it is difficult to tell whether data are skewed or not. Skewed data from studies of less than 200 participants were entered as 'other data' rather than into an analysis. Skewed data pose less of a problem when looking at means if the sample size is large and were entered into syntheses.
Unit of analysis issues
1. Cluster trials Studies increasingly employ 'cluster randomisation' (such as randomisation by clinician or practice) but analysis and pooling of clustered data poses problems. Firstly, authors often fail to account for intraclass correlation in clustered studies, leading to a 'unit of analysis' error (Divine 1992) whereby P values are spuriously low, confidence intervals unduly narrow and statistical significance overestimated. This causes type I errors (Bland 1997; Gulliford 1999).
Where clustering was not accounted for in primary studies, we planned to present data in a table, with a (*) symbol to indicate the presence of a probable unit of analysis error. In subsequent versions of this review we will seek to contact first authors of studies to obtain the intraclass correlation coefficient (ICC) of their clustered data and to adjust for this by using accepted methods (Gulliford 1999). If clustering had been incorporated into the analysis of primary studies, we planned to present these data as if from a non‐cluster randomised study, but adjusted for the clustering effect.
We have sought statistical advice and have been advised that the binary data as presented in a report should be divided by a 'design effect'. This is calculated using the mean number of participants per cluster (m) and the ICC [Design effect = 1+(m‐1)*ICC] (Donner 2002). If the ICC had not been reported, we would have assumed it to be 0.1 (Ukoumunne 1999).
If we had included cluster studies and they had been appropriately analysed taking into account the ICC and relevant data documented in the report, synthesis with other studies would have been possible using the generic inverse variance technique.
2. Cross‐over trials A major concern of cross‐over trials is the carry‐over effect. It occurs if an effect (e.g. pharmacological, physiological or psychological) of the treatment in the first phase is carried over to the second phase. As a consequence on entry to the second phase the participants can differ systematically from their initial state despite a wash‐out phase. For the same reason cross‐over trials are not appropriate if the condition of interest is unstable (Elbourne 2002). As both effects are very likely in schizophrenia, if we had included cross‐over trials, we planned to useonly data of the first phase of cross‐over studies.
3. Studies with multiple treatment groups Where a study involved more than two treatment arms, if relevant, the additional treatment arms were presented in comparisons. Where the additional treatment arms were not relevant, these data would nott have been reproduced.
Dealing with missing data
1. Overall loss of credibility At some degree of loss of follow‐up, data must lose credibility. We are forced to make a judgment where this is for the very short‐term trials likely to be included in this review. Should more than 30% of data be unaccounted for by 24 hours we did not reproduce these data or use them within analyses.
2. Binary In the case where attrition for a binary outcome is between 0% and 30% and outcomes of these people are described, we included these data as reported. Where these data were not clearly described, we assumed the worst primary outcome, and rates of adverse effects similar to those who did continue to have their data recorded.
3. Continuous In the case where attrition for a continuous outcome is between 0% and 30% and completer‐only data were reported, we have reproduced these.
Assessment of heterogeneity
As only one study was included we could not examine heterogeneity.
1. Clinical heterogeneity We planned to consider all included studies without any comparison to judge clinical heterogeneity.
2. Statistical 2.1 Visual inspection We planned to visually inspect graphs to investigate the possibility of statistical heterogeneity.
2.2 Employing the I‐squared statistic This provides an estimate of the percentage of inconsistency thought to be due to chance. An I‐squared estimate greater than or equal to 40% would have been interpreted as evidence of high levels of heterogeneity (Higgins 2003).
Assessment of reporting biases
Reporting biases arise when the dissemination of research findings is influenced by the nature and direction of results (Egger 1997). These are described in section 10.1 of the Cochrane Handbook (Higgins 2005). We are aware that funnel plots may be useful in investigating reporting biases but are of limited power to detect small‐study effects. As we only included one study, we did not use funnel plots to investigate the likelihood of overt publication bias.
Data synthesis
Where possible we employed a fixed‐effect model for analyses. We understand that there is no closed argument for preference for use of fixed‐ or random‐effects models. The random‐effects method incorporates an assumption that the different studies are estimating different, yet related, intervention effects. This does seem true to us, however, random‐effects does put added weight onto the smaller of the studies ‐ those trials that are most vulnerable to bias. For this reason we favour using fixed‐effect models employing random‐effects only when investigating heterogeneity.
Subgroup analysis and investigation of heterogeneity
There were no subgroup analyses planned.
Sensitivity analysis
Again, had there been more trials we would have analysed the effect of excluding studies with high attrition rates in a sensitivity analysis. We would have compared primary outcomes for trials where randomisation was implied, rather than described, with those where allocation was clearly at random.
Data and analyses
Comparison 1. DANCE THERAPY vs STANDARD CARE.
| Outcome or subgroup title | No. of studies | No. of participants | Statistical method | Effect size |
|---|---|---|---|---|
| 1 Leaving the study early | 1 | Risk Ratio (M‐H, Fixed, 95% CI) | Subtotals only | |
| 1.1 short term | 1 | 45 | Risk Ratio (M‐H, Fixed, 95% CI) | 0.44 [0.04, 4.49] |
| 1.2 long term | 1 | 45 | Risk Ratio (M‐H, Fixed, 95% CI) | 0.68 [0.31, 1.51] |
| 2 Mental state: 1. Total ‐ average score (PANSS total endpoint, high = poor) | 1 | 43 | Mean Difference (IV, Fixed, 95% CI) | ‐0.5 [‐11.80, 10.80] |
| 3 Mental state: 2. Positive symptoms ‐ average score (PANSS positive endpoint, high = poor) | 1 | 43 | Mean Difference (IV, Fixed, 95% CI) | 2.5 [‐0.67, 5.67] |
| 4 Mental state: 3a. Negative symptoms ‐ average score (PANSS negative endpoint, high = poor) | 1 | 43 | Mean Difference (IV, Fixed, 95% CI) | ‐4.40 [‐8.15, ‐0.65] |
| 5 Mental state: 3b. Negative symptoms ‐ not improved (PANSS negative symptom reduction less than 20% ‐ 40%) | 1 | 45 | Risk Ratio (M‐H, Fixed, 95% CI) | 0.62 [0.39, 0.97] |
| 6 Satisfaction with care: 1. Average endpoint score (CAT, high = good) | 1 | 42 | Mean Difference (IV, Fixed, 95% CI) | 0.40 [‐0.78, 1.58] |
| 7 Quality of life: 1. Average endpoint score (MANSA, high = good) | 1 | 39 | Mean Difference (IV, Fixed, 95% CI) | 0.0 [‐0.48, 0.48] |
| 8 Adverse effects: 1. Average endpoint score (EPS, high = poor, skewed data) | Other data | No numeric data |
1.1. Analysis.
Comparison 1 DANCE THERAPY vs STANDARD CARE, Outcome 1 Leaving the study early.
1.2. Analysis.
Comparison 1 DANCE THERAPY vs STANDARD CARE, Outcome 2 Mental state: 1. Total ‐ average score (PANSS total endpoint, high = poor).
1.3. Analysis.
Comparison 1 DANCE THERAPY vs STANDARD CARE, Outcome 3 Mental state: 2. Positive symptoms ‐ average score (PANSS positive endpoint, high = poor).
1.4. Analysis.
Comparison 1 DANCE THERAPY vs STANDARD CARE, Outcome 4 Mental state: 3a. Negative symptoms ‐ average score (PANSS negative endpoint, high = poor).
1.5. Analysis.
Comparison 1 DANCE THERAPY vs STANDARD CARE, Outcome 5 Mental state: 3b. Negative symptoms ‐ not improved (PANSS negative symptom reduction less than 20% ‐ 40%).
1.6. Analysis.
Comparison 1 DANCE THERAPY vs STANDARD CARE, Outcome 6 Satisfaction with care: 1. Average endpoint score (CAT, high = good).
1.7. Analysis.
Comparison 1 DANCE THERAPY vs STANDARD CARE, Outcome 7 Quality of life: 1. Average endpoint score (MANSA, high = good).
1.8. Analysis.
Comparison 1 DANCE THERAPY vs STANDARD CARE, Outcome 8 Adverse effects: 1. Average endpoint score (EPS, high = poor, skewed data).
| Adverse effects: 1. Average endpoint score (EPS, high = poor, skewed data) | ||||
|---|---|---|---|---|
| Study | Intervention | Mean | SD | N |
| Rohricht 2006 | Dance therapy | 1.3 | 1.6 | 24 |
| Rohricht 2006 | Control group | 1.6 | 2.2 | 19 |
Characteristics of studies
Characteristics of included studies [ordered by study ID]
Rohricht 2006.
| Methods | Allocation: randomised, opening sealed envelope by a blinded person. Blinding: single (assessor). Duration:10 weeks treatment + 4 months follow‐up. Setting: community, London. | |
| Participants | Diagnosis: schizophrenia (DSM‐IV). Age: 20‐55 years. N = 45. Sex: male = 12 and female = 12 (BPT group); male = 10 and female = 11(SC group). Length of illness: 12.1 ± 10.5 years (BPT group); 10.8 ± 7.3 years (SC group). Exclusion criteria: evidence of organic brain disease, severe/chronic physical illness, substance misuse. | |
| Interventions | 1. Body‐oriented psychological therapy (BPT) + routine care: including 5 stages: a) opening circle, describe feelings and energy level; b) warm‐up section, standing in a circle and warm‐up using different body parts and movements; c) structured task section, mirroring each other's movement, creating body image sculpture in partners; d) creative movement section, group mirroring, creating group sculptures. reflecting on how this feels; e) closing circle, reflecting on group experience, re‐focusing on self with body‐oriented exercises such as self‐touch, verbal integration. Frequency: 60‐90 minutes/session, 20 sessions over 10 weeks. N = 24. 2. Supportive counselling (SC) + routine care: therapist facilitated a safe and supportive atmosphere and gave the participants opportunity to talk about specific difficulties. The group then engaged in discussing their experience and trying to identify the contributing factors to the problems. Main strategy used is problem solving strategy. Frequency: 60‐90 minutes/session, 20 sessions over 10 weeks. N = 21. |
|
| Outcomes | Leaving the study early. Mental state: PANSS, PANSS symptom reduction rate. Satisfaction with treatment: CAT, MANSA. Adverse events: EPS. | |
| Notes | ||
| Risk of bias | ||
| Bias | Authors' judgement | Support for judgement |
| Random sequence generation (selection bias) | Unclear risk | Randomised in blocks, no details reported. |
| Allocation concealment (selection bias) | Low risk | Sealed envelope. |
| Blinding (performance bias and detection bias) All outcomes | Unclear risk | Single, but not tested. |
| Incomplete outcome data (attrition bias) All outcomes | High risk | 40% participants lost at follow‐up, not addressed. |
| Selective reporting (reporting bias) | Low risk | No selective reporting. |
| Other bias | Low risk | Study supported by East London & The City Mental Health Trust and an unconditional grant by Pfizer and Wyeth. |
DSM‐IV: Diagnostic Statistical Manual, version 4 PANSS: Positive and Negative Syndrome Scale CAT: Client's Assessment of Treatment Scale EPS: Extrapyramidal Symptom Rating Scale MANSA: Manchester Short Assessment of Quality of life
Characteristics of excluded studies [ordered by study ID]
| Study | Reason for exclusion |
|---|---|
| Apter 1978 | Allocation: randomised. Participants: people with schizophrenia. Interventions: individual dance therapy vs group dance therapy vs control. Outcomes: no useable data‐ no mean or SD reported. |
| ISRCTN 2012a | Allocation: randomised
Participants: people with schizophrenia. Interventions:body‐oriented psychological therapy (BPT) vs physical activities (PA) Outcomes: ongoing study, no data reported. |
| Killaspy 1997 | Allocation: randomised. Participants: people with schizophrenia aged over 18 years. Interventions: art therapy plus standard care vs activity group plus standard care vs standard care alone. |
| Qu 2007 | Allocation: randomised (random number table). Participants: people with schizophrenia. Interventions: cognitive remediation therapy vs music therapy plus dance therapy. Outcomes: no individual useable data for dance therapy. |
| Su 1999 | Allocation: randomised. Participants: people with schizophrenia. Interventions: dance therapy. Outcomes: no useable data‐ no mean or SD reported. |
| Tan 2010 | Allocation: randomised (random number table). Participants:chronic inpatients with schizophrenia. Intervention: cognitive remediation therapy vs computerised cognitive remediation therapy vs work and amusement therapy (music therapy and dance therapy). Outcomes: no individual useable data for dance therapy. |
| Tang 2011 | Allocation: not randomised. |
| Wu 2003 | Allocation: not randomised. |
| Yang 2005 | Allocation: randomised. Participants: people with schizophrenia. Interventions: psycho‐education vs standard care (not dance therapy). |
| Yao 2008 | Allocation: not randomised. |
| Zhou 2009 | Allocation: not randomised. |
SD: standard deviation vs: versus
Characteristics of ongoing studies [ordered by study ID]
ISRCTN 2012.
| Trial name or title | Effectiveness and cost‐effectiveness of body psychotherapy in the treatment of negative symptoms of schizophrenia: a multicentre randomised controlled trial |
| Methods | Allocation: randomised Duration:10 weeks treatment + 6 months follow‐up. Setting: community, London, UK. |
| Participants | Diagnosis: schizophrenia (DSM‐IV). Age: 18‐65 years. Sex: male and female. Exclusion criteria: severe physical disability, insufficient command of English, a physical condition that makes participation in either body psychotherapy or the physical activities impossible or potentially harmful. |
| Interventions | 1. Body‐oriented psychological therapy (BPT): a) Overcoming communication barriers through non‐verbal techniques, b) Re‐focussing cognitive and emotional awareness towards the body (physical reality, coordination and orientation, c) Stimulating activity and emotional responsiveness, d) Exploring physical potentials, e) Focussing on strength and experiencing the body as a source of creativity, reliability, pleasure and self‐expression, f) Modifying dysfunctional self‐perception and addressing body‐related psychopathological features such as boundary loss, somatic depersonalisation, and body schema disturbances. Frequency: 90 minutes/session, 20 sessions over 10 weeks. 2. Physical activities(PA): PA will be described to patients as a fitness and physical health intervention and consist of pilates exercises and follow the established guidelines for such groups. Frequency: 90 minutes/session, 20 sessions over 10 weeks. 3. Target number of participants: 256 |
| Outcomes | Primary outcome: level of negative symptoms as assessed on the Positive and Negative Symptom Scale of Schizophrenia (PANSS). All outcomes will be measured at pre‐treatment baseline, at the end of treatment and again 6 months after treatment. Secondary outcome: 1. Levels of general psychopathology and positive symptoms (PANSS) 2. Subjective quality of life (Manchester Short Assessment of Quality of Life) 3. Extrapyramidal symptoms (Simpson‐Angus Scale) 4. Treatment satisfaction (Client Satisfaction Questionnaire) 5. Objective social situation (SIX), which combines objective indicators of independent accommodation, employment and having a partner/friend 6. Instrumental Activities of Daily Living Scale (IADL) |
| Starting date | 01/09/2010 |
| Contact information | Professor Stefan Priebe, Unit for Social and Community Psychiatry Newham Centre for Mental Health Glen Road, London, UK. s.priebe@qmul.ac.uk |
| Notes |
DSM‐IV: Diagnostic Statistical Manual, version 4
Differences between protocol and review
There are no differences between protocol and review.
Contributions of authors
JR ‐ study selection, data extraction, input and analysis, writing up the review in 2012 update.
JX ‐ developing the protocol, study selection, data extraction, input and analysis, writing up the review in previous version.
Sources of support
Internal sources
University of Leeds, UK.
University of Nottingham, UK.
External sources
No external support received, Not specified.
Declarations of interest
Juanjuan Ren ‐ no known conflict for interest.
Jun Xia ‐ no known conflict of interest.
Tessa Grant ‐ no known conflict of interest (2009 version of the review).
New search for studies and content updated (no change to conclusions)
References
References to studies included in this review
Rohricht 2006 {published data only}
- Rohricht F, Priebe S. Effect of body‐oriented psychological therapy on negative symptoms in schizophrenia: a randomized controlled trial. Psychological Medicine 2006;36(5):669‐78. [EMBASE: 171807; MEDLINE: ] [DOI] [PubMed] [Google Scholar]
References to studies excluded from this review
Apter 1978 {published data only}
- Apter A, Sharir I, Tyano S, Wijsenbeek H. Movement therapy with psychotic adolescents. British Journal of Medical Psychology 1978;51(2):155‐9. [DOI] [PubMed] [Google Scholar]
ISRCTN 2012a {unpublished data only}
- Effectiveness and cost‐effectiveness of body psychotherapy in the treatment of negative symptoms of schizophrenia. http://www.controlled‐trials.com/ISRCTN84216587 2010.
Killaspy 1997 {published data only}
- Killaspy H. Interactive group art therapy as an adjunctive treatment for people with schizophrenia. National Research Register 1997. [ISRCTN46150447]
Qu 2007 {published data only}
- Qu Y, Xiao G, Ma Y. Effect of congnitive remediation therapy on improving clinical symtoms and social functions in patients with chronic schizophrenia [认知矫正治疗对慢性精神分裂症患者临床症状和社会功能的影响]. Journal of Clinical Rehabilitative Tissue Engineering Research 2007;11(52):10553‐6. [Google Scholar]
Su 1999 {published data only}
- Su L, Fan Z, Qu Y. The effect of dance therapy for chronic schizophrenic patients . Chinese Journal of Psychiatry 1999;32(3):167‐9. [MEDI19911] [Google Scholar]
Tan 2010 {published data only}
- Tan S, Zhou Y, Wang J. Effect of cognitive remediation therapy and computerized congnitive remediation therapy on cognitive defiicits in patients with schizophrenia: a randomized controlled study. Chinese Journal of Psychiatry 2010;43(3):140‐5. [Google Scholar]
Tang 2011 {published data only}
- Tang Z, Peng L, Tian F. The clinical observation of dance therapy for chronic schizophrenia [舞蹈疗法对慢性精神分裂症的临床观察]. Sichun Mental Health 2011;24(3):182‐4. [Google Scholar]
Wu 2003 {published data only}
- Wu Y, Zhao F. Effect of music and dance on recovery of schizophrenia. Health Psychology Journal 2003;11(3):207‐8. [MEDI0308] [Google Scholar]
Yang 2005 {published data only}
- Yang R, Lv H, Lou F. The rehabilitation effect of group psychotherapy on chronic schizophrenic patient. Occupation and Health 2005;21(6):936. [CAJ: MEDI0507S1] [Google Scholar]
Yao 2008 {published data only}
- Yao Y. Rehabilitation of music and dance therapy for patients with schizophrenia [音乐舞蹈治疗对精神分裂症患者的康复作用]. Chinese Medicine Research and Clinical 2008;6(2):13‐5. [Google Scholar]
Zhou 2009 {published data only}
- Zhou C, Dai F, Pan D. Act on of dance therapy improved the maladjustment in hospital patient with psychosis [舞蹈疗法对改善住院精神病患者适应不良的作用研究]. Medical Journal of Chinese People's Health 2009;21(23):3048‐9. [Google Scholar]
References to ongoing studies
ISRCTN 2012 {unpublished data only}
- Effectiveness and cost‐effectiveness of body psychotherapy in the treatment of negative symptoms of schizophrenia: a multicentre randomised controlled trial. Ongoing study 01/09/2010. [DOI] [PMC free article] [PubMed]
Additional references
Altman 1996
- Altman DG, Bland JM. Detecting skewness from summary information. BMJ 1996;313:1200. [FI020600] [DOI] [PMC free article] [PubMed] [Google Scholar]
Bland 1997
- Bland JM. Statistics notes. Trials randomised in clusters. BMJ 1997;315:600. [DOI] [PMC free article] [PubMed] [Google Scholar]
Boissel 1999
- Boissel JP, Cucherat M, Li W, Chatellier G, Gueyffier F, Buyse M, et al. The problem of therapeutic efficacy indices. 3. Comparison of the indices and their use [Apercu sur la problematique des indices d'efficacite therapeutique, 3: comparaison des indices et utilisation. Groupe d'Etude des Indices D'efficacite]. Therapie 1999;54(4):405‐11. [PUBMED: 10667106] [PubMed] [Google Scholar]
Chodorow 1991
- Chodorow J. Dance Therapy and Depth Psychology: the Moving Imagination. London: Routledge, 1991. [ISBN 0‐415‐05301‐3] [Google Scholar]
Deeks 2000
- Deeks J. Issues in the selection for meta‐analyses of binary data. Proceedings of the 8th International Cochrane Colloquium; 2000 Oct 25‐28; Cape Town. Cape Town: The Cochrane Collaboration, 2000.
Divine 1992
- Divine GW, Brown JT, Frazier LM. The unit of analysis error in studies about physicians' patient care behavior. Journal of General Internal Medicine 1992;7(6):623‐9. [DOI] [PubMed] [Google Scholar]
Donner 2002
- Donner A, Klar N. Issues in the meta‐analysis of cluster randomized trials. Statistics in Medicine 2002;21:2971‐80. [DOI] [PubMed] [Google Scholar]
Egger 1997
- Egger M, Davey‐Smith G, Schneider M, Minder CSO. Bias in meta‐analysis detected by a simple, graphical test. BMJ 1997;13:629‐34. [DOI] [PMC free article] [PubMed] [Google Scholar]
Elbourne 2002
- Elbourne D, Altman DG, Higgins JPT, Curtina F, Worthingtond HV, Vaile A. Meta‐analyses involving cross‐over trials: methodological issues. International Journal of Epidemiology 2002;31(1):140‐9. [DOI] [PubMed] [Google Scholar]
Espenak 1981
- Espenak L, Adler A, Lowen A. Dance Therapy ‐ Theory and Application. Springfield, IL: Charles C Thomas, 1981. [Google Scholar]
Exiner 1994
- Exiner J, Kelynack D. Dance Therapy Redefined ‐ a Body Approach to Therapeutic Dance. Springfield, IL: Charles C Thomas, 1994. [ISBN 0‐398‐05913‐6] [Google Scholar]
Fortinash 2000
- Fortinash KM, Holoday‐Worret PA. Psychiatric Mental Health Nursing. London: Mosby, 2000. [Google Scholar]
Furukawa 2006
- Furukawa TA, Barbui C, Cipriani A, Brambilla P, Watanabe N. Imputing missing standard deviations in meta‐analyses can provide accurate results. Journal of Clinical Epidemiology 2006;59(7):7‐10. [DOI] [PubMed] [Google Scholar]
Gulliford 1999
- Gulliford MC. Components of variance and intraclass correlations for the design of community‐based surveys and intervention studies: data from the Health Survey for England 1994. American Journal of Epidemiology 1999;149:876‐83. [DOI] [PubMed] [Google Scholar]
Higgins 2003
- Higgins JP, Thompson SG, Deeks JJ, Altman DG. Measuring inconsistency in meta‐analyses. BMJ 2003;327:557‐60. [DOI] [PMC free article] [PubMed] [Google Scholar]
Higgins 2005
- Higgins JPT, Green S, editors. Cochrane Handbook for Systematic Reviews of Interventions 4.2.5 [updated May 2005]. www.cochrane.org/resources/handbook/hbook.htm (accessed 04 February 2006).
Higgins 2011
- Higgins JPT, Green S (editors). Cochrane Handbook for Systematic Reviews of Interventions Version 5.0.2 [updated September 2011]. The Cochrane Collaboration, 2011. Available from www.cochrane‐handbook.org..
Hutton 2009
- Hutton JL. Number needed to treat and number needed to harm are not the best way to report and assess the results of randomised clinical trials. British Journal of Haematology 2009;146(1):27‐30. [DOI] [PubMed] [Google Scholar]
Kay 1986
- Kay SR, Opler LA, Fiszbein A. Positive and Negative Syndrome Scale (PANSS) Manual. North Tonawanda, NY: Multi‐Health Systems, 1986. [Google Scholar]
Leucht 2005
- Leucht S, Kane JM, Kissling W, Hamann J, Etschel E, Engel RR. What does the PANSS mean?. Schizophrenia Research 2005;79(2‐3):231‐8. [PUBMED: 15982856] [DOI] [PubMed] [Google Scholar]
Leucht 2005a
- Leucht S, Kane JM, Kissling W, Hamann J, Etschel E, Engel R. Clinical implications of brief psychiatric rating scale scores. British Journal of Psychiatry 2005;187:366‐71. [PUBMED: 16199797] [DOI] [PubMed] [Google Scholar]
Leucht 2007
- Leucht S, Engel RR, Bauml J, Davis JM. Is the superior efficacy of new generation antipsychotics an artifact of LOCF?. Schizophrenia Bulletin 2007;33(1):183‐91. [PUBMED: 16905632] [DOI] [PMC free article] [PubMed] [Google Scholar]
Marshall 2000
- Marshall M, Lockwood A, Bradley C, Adams C, Joy C, Fenton M. Unpublished rating scales: a major source of bias in randomised controlled trials of treatments for schizophrenia. British Journal of Psychiatry 2000;176:249‐52. [DOI] [PubMed] [Google Scholar]
McGrath 2000
- McGrath J, Hayes Robyn L. Cognitive rehabilitation for people with schizophrenia and related conditions. Cochrane Database of Systematic Reviews 2000, Issue 3. [DOI: 10.1002/14651858.CD000968; CD000968] [DOI] [PMC free article] [PubMed] [Google Scholar]
Mössler 2011
- Mössler K, Chen X, Heldal TO, Gold C. Music therapy for people with schizophrenia and schizophrenia‐like disorders. Cochrane Database of Systematic Reviews 2011, Issue 12. [DOI: 10.1002/14651858.CD004025.pub3; CD004025] [DOI] [PubMed] [Google Scholar]
Overall 1962
- Overall JE, Gorham DR. The brief psychiatric rating scale. Psychological Reports 1962;10:799‐812. [Google Scholar]
Payne 2006
- Payne H. Dance Movement Therapy ‐ Theory, Research and Practice. 2nd Edition. Sussex: Routledge, 2006. [Google Scholar]
Priebe 1995
- Priebe S, Gruyters T, Heinze M, Hoffmann C, Jakel A. Subjective criteria in psychiatric care ‐ methods of assessment for research and routine care. Psychiatrische Praxis 1995;22:140‐4. [PubMed] [Google Scholar]
Priebe 1999
- Priebe S, Huxley P, Knight S, Evans S. Application and results of the Manchester Short Assessment of Quality of Life. International Journal of Social Psychiatry 1999;45:7‐12. [DOI] [PubMed] [Google Scholar]
Ruddy 2005
- Ruddy R, Milnes D. Art therapy for schizophrenia or schizophrenia‐like illnesses. Cochrane Database of Systematic Reviews 2005, Issue 4. [DOI: 10.1002/14651858.CD003728.pub2; PUBMED: 16235338] [DOI] [PubMed] [Google Scholar]
Schünemann 2008
- Schünemann HJ, Oxman AD, Vist GE, Higgins JPT, Deeks JJ, Glasziou P, et al. Chapter 12: Interpreting results and drawing conclusions. In: Higgins JPT, Green S editor(s). Cochrane Handbook for Systematic Reviews of Interventions. The Cochrane Collaboration, 2008:359‐83. [Google Scholar]
Simpson 1970
- Simpson GM, Angus JW. A rating scale for extrapyramidal side effects. Acta Psychiatrica Scandinavica Supplementum 1970;212:11‐9. [DOI] [PubMed] [Google Scholar]
Ukoumunne 1999
- Ukoumunne OC, Gulliford MC, Chinn S, Sterne JAC, Burney PGJ. Methods for evaluating area‐wide and organisation‐based intervention in health and health care: a systematic review. Health Technology Assessment 1999;3(5):1‐75. [PubMed] [Google Scholar]
Välimäki 2012
- Välimäki M, Hätönen H, Adams CE, Arifulla D, Kostiainen J, Kostamo P. Information and communication technology‐based cognitive remediation for supporting treatment compliance for people with serious mental illness. Cochrane Database of Systematic Reviews 2012, Issue 5. [DOI: 10.1002/14651858.CD009766; CD009766] [DOI] [Google Scholar]
Xia 2009
- Xia J, Adams CE, Bhagat N, Bhagat V, Bhoopathi P, El‐Sayeh H, et al. Loss to outcomes stakeholder survey: the LOSS study. Psychiatric Bulletin 2009;33(7):254‐7. [Google Scholar]
Xia 2011
- Xia J, Merinder LB, Belgamwar Madhvi R. Psychoeducation for schizophrenia. Cochrane Database of Systematic Reviews 2011, Issue 6. [DOI: 10.1002/14651858.CD002831.pub2; CD002831] [DOI] [PMC free article] [PubMed] [Google Scholar]
References to other published versions of this review
Xia 2009a
- Xia J, Grant TJ. Dance therapy for schizophrenia. Cochrane Database of Systematic Reviews 2009, Issue 1. [DOI: 10.1002/14651858.CD006868.pub2] [DOI] [PubMed] [Google Scholar]