Abstract
Background:
The detection of tissue reactive oxygen species (ROS) using endogenous MRI methods has great potential applications in research and the clinic. We recently demonstrated that ROS produce a significant T1-shortening effect. However, T1 or T1-weighted contrast is not specific, as there are many other factors that alter tissue T1.
Purpose:
To investigate whether the presence of ROS alters tissue environmental conditions such as the proton exchange rate to improve the detection specificity of endogenous ROS MRI.
Study Type:
Prospective.
Subjects/Phantom:
The ROS-producing phantoms consisted of fresh egg white treated with H2O2 and healthy mice injected with pro-oxidative rotenone.
Field Strength/Sequence:
T1 mapping was performed based on fast spin-echo sequence and was evaluated using chemical exchange saturation transfer (CEST) MRI with varied saturation power (QUESP) on a 9.4 T animal scanner.
Assessment:
Phantom experiments were conducted to evaluate the overall of CEST-expressing metabolites in fresh egg white treated with H2O2 of various concentrations (0, 0.025, 0.05, 0.1, and 0.25 v/v%). The egg white phantom continuously produced ROS for more than 3 hours. Various experiments were performed to rule out potential contributing factors to the observed changes. In addition, in vivo MRI study was conducted with a well-established rotenone-exposed mouse model.
Statistical Tests:
Student’s t-test.
Results:
Egg white phantoms treated with H2O2 of various concentrations showed a 26–85% increase in compared with controls. In addition, the of egg white is negligibly affected by other potential confounding factors, including paramagnetic contrast agents (<11%), oxygen (2.3%), and iron oxidation (<10%). Changes in temperature (<1°C) and pH (ΔpH <0.1) in H2O2-treated egg white were also negligible. Results from the in vivo rotenone study were consistent with the phantom studies by showing reduced T1 relaxation time (6%) and increased (9%) in rotenone-treated mice.
Data Conclusion:
We demonstrate that the specificity of endogenous ROS MRI can be improved with the aid of proton exchange rate mapping.
Level of Evidence:
2
Technical Efficacy Stage:
2
OXIDATIVE STRESS occurs when there is an imbalance between the production of free radicals and/or reactive oxygen species (ROS) and the antioxidant capacity of the body to counteract or detoxify their harmful effects.1 ROS such as hydrogen peroxide (H2O2), superoxide (O2−), and hydroxyl radicals are byproducts of oxygen metabolism and are therefore continuously formed in living organisms.1 ROS possess strong oxidizing capabilities and can damage DNA, proteins, and lipids. As one of the most aggressive oxygen radicals,2 hydroxyl radicals are believed to be the primary cause of oxidative tissue damage, despite having a very short lifetime.1 Hydroxyl radicals as well as other ROS have been implicated in the aging process as well as in the development of many diseases, including Alzheimer’s disease, stroke, cardiac arrest, cancer, and diabetes.3
There is an ongoing interest in the development of imaging techniques for studying tissue ROS. Current techniques include biochemical analyses,4 optical redox scanning,5 and magnetic-based methods such as electron paramagnetic resonance (EPR)6 and Overhauser-enhanced magnetic resonance imaging (MRI) (OMRI).7 Although these methods have advanced our understanding of ROS in many pathophysiological conditions, they are either invasive or require exogenous contrast agents that react with or trap radicals in the tissue, thereby changing the tissue ROS concentration under study. In addition, exogenous contrast-based approaches have limited applications for repeat or dynamic studies.
Recently, Berkowitz et al utilized a quench-assisted MRI method to study the T1 relaxation properties of the outer retinal layer in mice under excessive ROS production conditions.8 Using an exogenous contrast agent (or an antioxidant), they observed that the overproduction of ROS produces a T1 shortening effect, suggesting that ROS are detectable by MRI. With the aim of developing an endogenous contrast-based ROS MRI technique, we studied the T1 relaxivity of hydroxyl radicals using a biological phantom of fresh egg white treated with H2O2; this phantom continuously generates hydroxyl radicals for hours.9 We confirmed that the hydroxyl ROS generated in this phantom were paramagnetic, with a T1-relaxivity much higher than that of Gd-DTPA, enabling an in vitro detection sensitivity of hydroxyl ROS in the pM range.9
Despite this success, however, T1 relaxation time can be affected by many other factors, including dipole–dipole interactions, chemical shift anisotropy, molecular translation (such as flow and diffusion), chemical exchange, and scalar (J-coupling) and electric-quadrupole coupling.10-13 Therefore, the use of T1-weighted MRI contrast as an endogenous imaging biomarker for detecting ROS is relatively unspecific, prompting our investigation of other endogenous MR properties of ROS that may help to improve the detection specificity of ROS MRI.
Chemical exchange saturation transfer (CEST) is an emerging metabolic MRI technique that produces endogenous image contrast from exchangeable labile protons of metabolites or compounds containing amine (−NH2), amide (−NH), hydroxyl (−OH), or sulfidril (−SH) groups.14-16 In brief, CEST MRI excites the exchangeable protons by a presaturation RF pulse and the saturated magnetization is then transferred chemically to the bulk water, resulting in an attenuated water signal detected by MRI. In this study we investigated the proton exchange rate during CEST MRI as an additional property of ROS that could be used to improve the specificity of endogenous ROS MRI.
Materials and Methods
We performed CEST MRI on egg white treated with H2O2 to produce hydroxyl radicals.9 We also measured two endogenous MRI properties (T1-shortening and the exchange rate enhancing), and determined whether ROS MRI specificity was affected by various potential confounding factors, including paramagnetic contrast agents, oxygen, temperature, pH, iron oxidation, protein oxidation and denaturing, and metabolite concentration changes (Fig. 1). Finally, in vivo detection of ROS using the proposed approach was demonstrated in mice receiving rotenone, a proven mitochondrial complex I inhibitor and a well-known pro-oxidant.17-19
FIGURE 1:
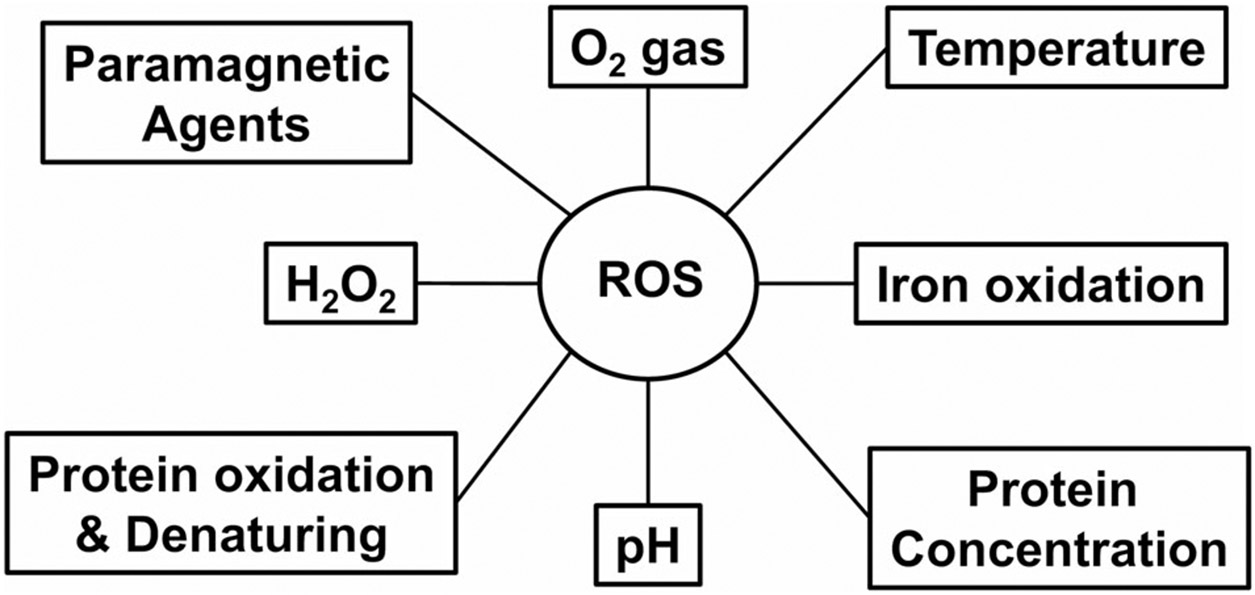
Potential factors that contribute to endogenous ROS MRI.
ROS-Producing Imaging Phantoms
The ROS-producing phantom consisted of fresh egg white mixed with H2O2 as previously described.9 Note that even though H2O2 was added to phantoms, we aimed to detect endogenous MRI contrasts specifically from hydroxyl radicals or hydroxyl ROS [·OH]. In brief, egg white was manually extracted from fresh hen eggs and was gently stirred for 2–3 minutes. Samples were then placed into test tubes and were treated with a bolus of H2O2 solution at a volume ratio of 1 (H2O2 solution) to 11 (pure egg white). The H2O2 solution was proportionally diluted from 30% hydrogen peroxide with a density 1.1 kg/L (Fisher Scientific, Hampton, NH) to have final concentrations of H2O2 in egg white at 0, 0.025, 0.05, 0.1, and 0.25 v/v% equivalent to 0, 8.1, 16.2, 32.4, and 80.9 mM (n = 3, Fig. 2a).
FIGURE 2:
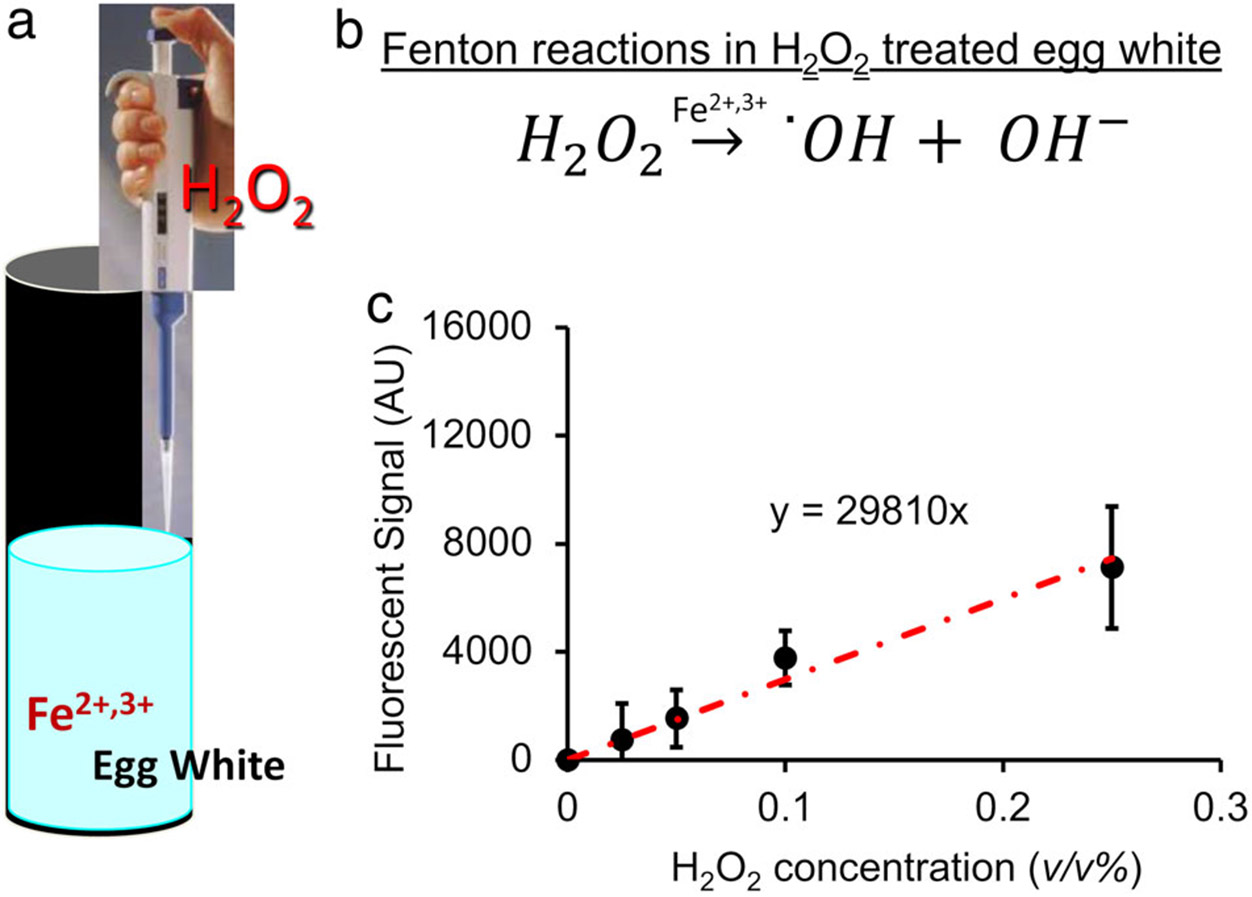
An imaging phantom was created by adding H2O2 to egg white samples, which continuously produce ROS for several hours (a) due to Fenton reactions (b) catalyzed by ferrous and ferric ions. (c) The production of hydroxyl ROS was confirmed using a radical-activated fluorescent dye, which showed that the ROS produced by the egg white samples is linearly proportional to the H2O2 treatment concentration.
Since H2O2 solutions were added to the egg white, hydroxyl ROS was produced through Fenton reactions (Fig. 2b). The production of hydroxyl ROS was detected using a radical-activatable fluorescent reporter dye, 3’-(p-hydroxyphenyl) fluorescein (HPF, Sigma-Aldrich, St. Louis, MO),4 with emission and excitation wavelengths of 528 and 485 nm, respectively. HPF has shown high specificity for hydroxyl radicals, with reactivity hundreds of times higher than for H2O2 and superoxide.20 Five μM HPF was added into 2 mL of untreated and H2O2-treated egg white samples (n = 3) in a 24-well plate. Fluorescent signals from the samples were measured with a Synergy HT multiwall plate reader (BioTek Instruments, Winooski, VT). The background fluorescent signal from the untreated samples was subtracted from the signals of the treated samples.
The tissue proton exchange rate was quantified in five independent sets of egg white samples untreated or treated with the five different concentrations of H2O2 for 1 hour (0, 8.1, 16.2, 32.4, and 80.9 mM). The dynamic changes in over time was studied in another three independent sets of egg white samples treated with 0.25 v/v% H2O2 for various durations up to 3 hours. These samples were prepared outside of the scanner and stored in seven different nuclear magnetic resonance (NMR) tubes. They were then scanned together. By the time of imaging, the H2O2 had been added to the samples for 0, 0.5, 1, 1.5, 2, 2.5, 3 hours. The samples treated for 0 hour were controls that received no H2O2.
MRI and Image Processing
All samples were scanned with a 9.4 T horizontal bore MRI scanner (Agilent, Santa Clara, CA) with a 39-mm quadrature proton RF coil at room temperature (~21°C). For T1 mapping; a fast spin echo sequence with variable inversion times (TI = 0.1, 0.25, 0.5, 0.75, 1, 1.25, 1.5, 1.75, 2, and 5 sec) was used.9 Other parameters included echo time / repetition time (TE/TR) = 5 msec/10 sec, echo train length = 8, field of view (FOV) = 25 × 25 mm2, and matrix size = 64 × 64.
CEST MRI was acquired using a customized FLASH sequence21 preceded by a 4-second long saturation pulse at various saturation amplitudes: B1 from 50 Hz (or 1.2 μT) up to 350 Hz (or 8.2 μT) at a step size of 50 Hz (or 1.2 μT), with saturation offsets of ±3.25, ±3.75, and + 100 ppm. Note that for proton MRI, 1 μT = 42.6 Hz. CEST data were linearly interpolated and B0-corrected in order to derive the signal at +3.5 ppm, the resonance for amide proton transfer,22 as described in previous studies.14,21 Percentage CEST contrast was calculated as the magnetization transfer ratio (MTR) asymmetry according to Eq. 1.
| (1) |
where and represent the signal intensity measured with saturation at ±3.5 and + 100 ppm, respectively.
QUantifying Exchange using Saturation Power (QUESP) dependence has been used for measuring the exchange rate of CEST-expressing metabolites.23,24 This approach acquires CEST data under various saturation powers (B1) and the optimal RF power producing the maximum CEST contrast has been shown to correlate with the exchange rate, both in simulations25 and in phantom imaging studies.24,26 in this study was assessed by fitting the CEST contrast dependency on saturation power, the QUESP data,27 to the Bloch–McConnell equations modified for chemical exchange. Fitting was performed by minimizing the difference between the experimental and the model data using the MatLab routine “fmincon” (v. R2012b, MathWorks, Natick, MA). Bulk water T1 was derived from experimental measurements as previously described.9 The default values for the exchangeable protons were: offset frequency = +3.5 ppm, agent concentration = 0.5 M, water T1 = 2.0 sec, T2 = 1 μs. The was initially set at 100 Hz and fitted with loose constraints between 1 Hz and 10 kHz. Based on our experience, to reach optimum fitting, T2 of the exchangeable protons needs to be estimated simultaneously with constraints between 0.1 μs to 0.5 msec, even though the fitted values were highly consistent under different treatment conditions (0.169 ± 0.002 msec). In addition, to remove the nuclear Overhauser effect (NOE) from the CEST asymmetrical analysis, an exchange-relayed NOE proton pool28 was included in the model with the following parameters14: offset frequency = −3.5 ppm, T1 = 1.0 sec, T2 = 0.3 msec, and proton concentration = 0.5 M. The mechanism for the NOE effect in the Z-spectrum is still under investigation by the researchers in the field and studying NOE and quantifying NOE proton properties are still hot research topics in the field.28,29 The NOE parameters were heuristically determined in order to reach the best fit of the curves during the initial tentative fitting experiments.
Image processing and data analyses were performed using home-built programs developed in MatLab.
Specificity Studies
To differentiate paramagnetic ROS from other paramagnetic agents, we tested the effect of a representative paramagnetic agent (Gd-DTPA) on the tissue . QUESP MRI data were collected on fresh egg white samples (n = 3) mixed with various concentrations of Gd-DTPA (Sigma-Aldrich) (0, 0.095, 0.19, and 0.38 mM) and was estimated for each phantom as previously described.
pH and temperature are well-known factors that affect the tissue .15 To exclude their contribution to the measurements by MRI CEST in the H2O2-treated egg white phantoms, we monitored pH and temperature variations in the treated egg white phantoms for up to 3 hours using a Hanna Instruments pH-meter (model HI 2211, Woonsocket, RI).
The impact of other confounding factors such as H2O2 itself, molecular oxygen, and iron oxidation were also evaluated in pure bovine serum albumin (BSA) protein samples. BSA was selected due to its lack of transition metals that are the necessary catalysts for ROS-producing Fenton reactions in the egg white phantoms. Thus, H2O2 treatment of BSA will not trigger Fenton reactions and will not produce ROS. The contribution from H2O2 on T1 relaxation properties and proton exchange was studied by adding H2O2 into 20 w/w% BSA. The effects from molecular oxygen were studied using BSA solutions bubbled with 100% oxygen gas (for 1 hour, 0.1 L/min) compared with samples without oxygen bubbling. Finally, the effects of adding 1 mM FeCl2 or FeCl3 (Sigma-Aldrich) into 20 w/w% BSA (Sigma-Aldrich) were determined to rule out the contribution from iron oxidation.
Demonstration of In Vivo ROS MRI
An in vivo MRI study was conducted with the approval of the Institutional Animal Care Committee and with a well-established rotenone-exposed rodent model.19 Rotenone selectively inhibits mitochondrial function at complex I, resulting in an increase in ROS production.17-19 Similar to the previous studies,19 rotenone dissolved in chloroform (>99%, Sigma-Aldrich) was mixed with 4% of carboxymethylcellulose (Sigma-Aldrich) to render a final concentration of 1.25 mg/mL. Healthy mice (CD-1, male, 12 weeks old) injected with rotenone (intraperitoneal injection [IP], 20 mg/kg body weight, n = 6) were MRI scanned at baseline and 1.5 hours postinjection. Healthy mice received saline when serving as vehicle controls (IP 20 mg/kg body weight, n = 4). Mice body temperature was maintained at 37° C using an MRI-compatible heating system (SA Instruments, Stony Brook, NY). The imaging parameters as well as the data analysis were the same as the previously described phantom studies.
Statistical Analysis
Imaging signals or contrasts were averaged within manually drawn regions of interests (ROIs). One-tailed Student’s t-test were performed to compared different groups with statistical significance prescribed when P < 0.05.
Results
As assessed by HPF fluorescence, hydroxyl ROS production in egg white treated with H2O2 increased linearly with increasing H2O2 concentrations (R2 = 0.98) (Fig. 2c).
Sweeping the saturation power B1 revealed modulation of CEST contrast in egg white samples with and without H2O2 treatment (Fig. 3a). The CEST contrast initially increased with RF saturation power, followed by a decrease at high RF power, thus identifying the optimal B1 value at which CEST MRI contrast was maximized. Treatment with higher H2O2 concentrations led to increased optimal RF saturation power, indicating higher (Fig. 3a).23,25 Fitting of QUESP data for quantification (R2 = 0.93 ± 0.01) showed that increased 26–85% compared with baseline in the untreated samples (Fig. 3b). Differences from baseline were statistically significant (P < 0.05) for samples treated with 0.05, 0.1, or 0.25 v/v% H2O2. A representative map is shown in Fig. 3c. correlated linearly with HPF fluorescence signals corresponding to hydroxyl radical concentrations (R2 = 0.90). In contrast, optimal RF saturation power and were not affected by treatment of egg whites with various concentrations of paramagnetic Gd-DTPA (<11%, Fig. 4a-c).
FIGURE 3:

(a) QUESP data, or the CEST contrast as a function of RF saturation power B1 (1 μT = 42.6 Hz), under different H2O2 concentrations (treated for 1 hour) were fitted to determine the proton exchange rate . (b) derived from QUESP data fitting increases with H2O2 treatment concentration. (c) Representative maps from egg white samples untreated or treated with different H2O2 concentrations. *P < 0.05.
FIGURE 4:
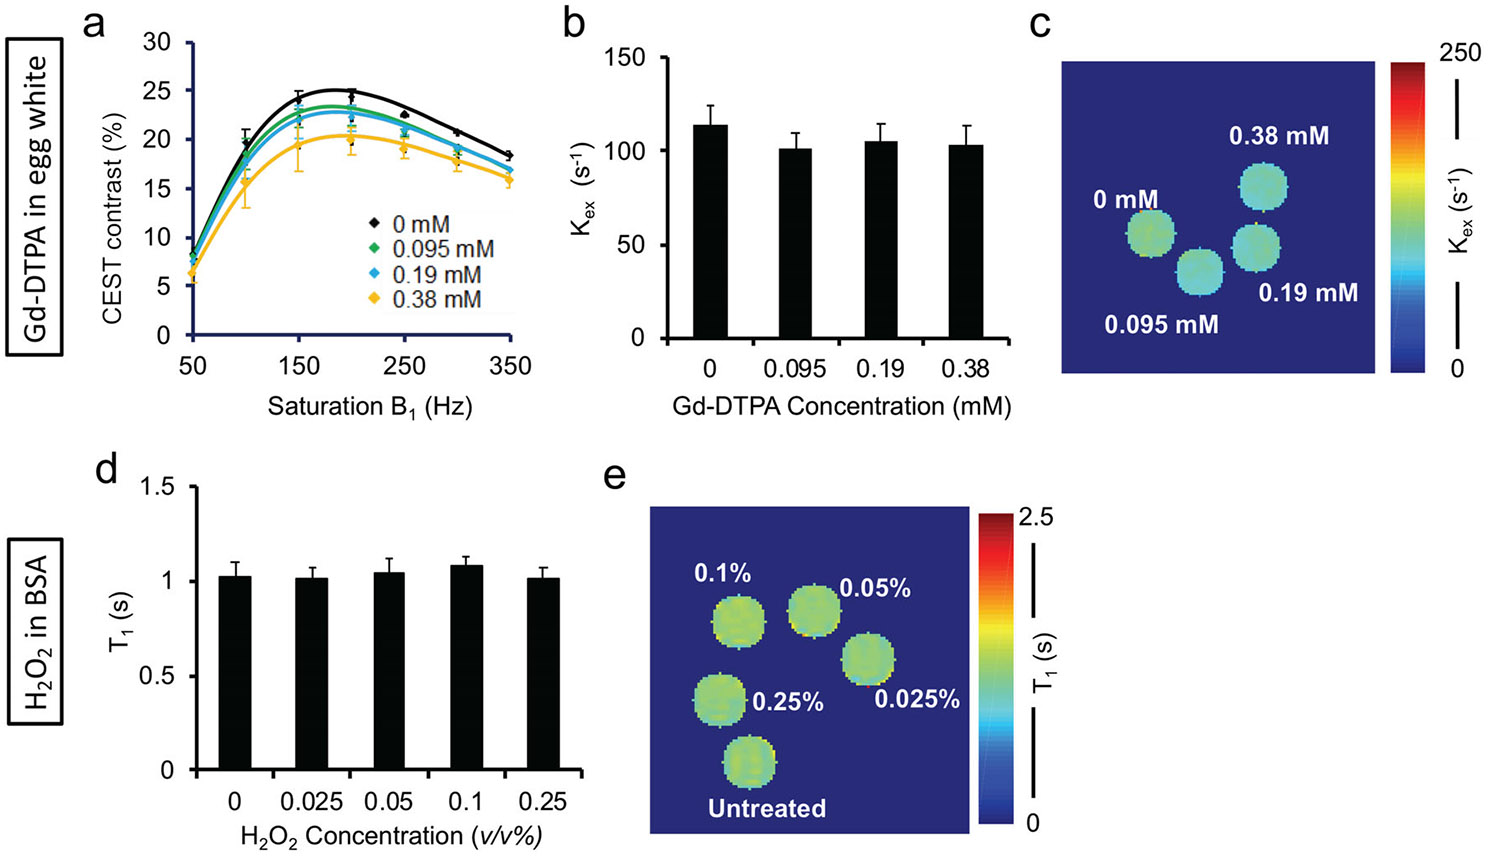
Unlike hydroxyl ROS, paramagnetic Gd-DTPA and H2O2 itself do not affect the proton exchange rate . (a) QUESP data fitted for from egg white samples treated with different concentrations of Gd-DTPA. (b) does not significantly change at different Gd-DTPA concentrations. (c) A representative rate map of egg white samples treated with different concentrations of Gd-DTPA. (d) A representative T1 map from BSA phantoms treated with different concentrations of H2O2; (e) T1 values from BSA phantoms treated with different concentrations of H2O2 are similar.
As a potential confounding factor, H2O2 itself did not produce any significant changes in T1 in treated BSA vs. untreated BSA solutions (P > 0.05), consistent with our previous study (Fig. 4d,e).9 H2O2 itself also did not increase, and instead slightly reduced the (data not shown). We also ruled out metabolite concentration changes as a confounding factor, as the numerical simulation of QUESP data with different metabolite concentrations showed an increase in of only 6.2% with a 10-fold increment in metabolite concentration.
In egg white treated with 0.25 v/v% H2O2 for increasing lengths of time, posttreatment CEST contrast initially decreased and then progressively recovered toward the baseline value (Fig. 5a). Conversely, the saturation power for maximal CEST contrast, an index of exchange rate, increased initially, followed by a gradual recovery towards the baseline value (Fig. 5b,c). That CEST contrast and recovered back to baseline levels once Fenton reactions were complete suggested that protein oxidation and denaturation are negligible and make only minor contributions to the observed MRI contrast.
FIGURE 5:

Longitudinal MRI study of egg white samples treated with 0.25 v/v% H2O2 for different durations (0, 0.5, 1, 1.5, 2, 2.5, 3 hours). (a) QUESP data. (b) Representative exchange rate map. (c) increases immediately after H2O2 treatment and then decreases towards the baseline level over time. Longitudinal experimental data were fitted with first-order reaction kinetics (red dotted line), which allows us to estimate the produced hydroxyl ROS concentration over time (as labeled).
As described in the Fenton reactions, one molecule H2O2 produces one hydroxyl radical (·OH) on average. Hence, the overall hydroxyl ROS production over time is equal to the total initial H2O2. The produced hydroxyl ROS concentration over time can be modeled with the pseudo-first-order reaction kinetics (Fig. 5c) as we reported previously.9 Fitting of the experimental data allows us to estimate the concentrations of hydroxyl ROS produced over time. As labeled in Fig. 5c, the produced ROS concentrations are all in the pM range, even though the initiate H2O2 (0.25 v/v% or 80.9 mM) is high.
Effects of other potential factors on CEST MRI contrast were also relatively small. Only minor fluctuations were found in pH (ΔpH <0.1) and temperature (<1°C) after treatment of egg whites with various concentrations of H2O2 (Fig. 6). Molecular oxygen and iron oxidation also showed only minor contributions on CEST contrast and presented negligible impact on the in BSA solutions. Specifically, in oxygen-saturated BSA solutions, T1 was reduced by 14% compared with controls (P = 0.06) (Fig. 7a,c). However, oxygen did not significantly enhance , producing a change of only 2% on average (P = 0.43) (Fig. 7b,d). The BSA solutions mixed with 1 mM of either FeCl2 or FeCl3 also showed negligible differences in T1 (P = 0.30) and (P = 0.29) (<10%, Fig. 8).
FIGURE 6:
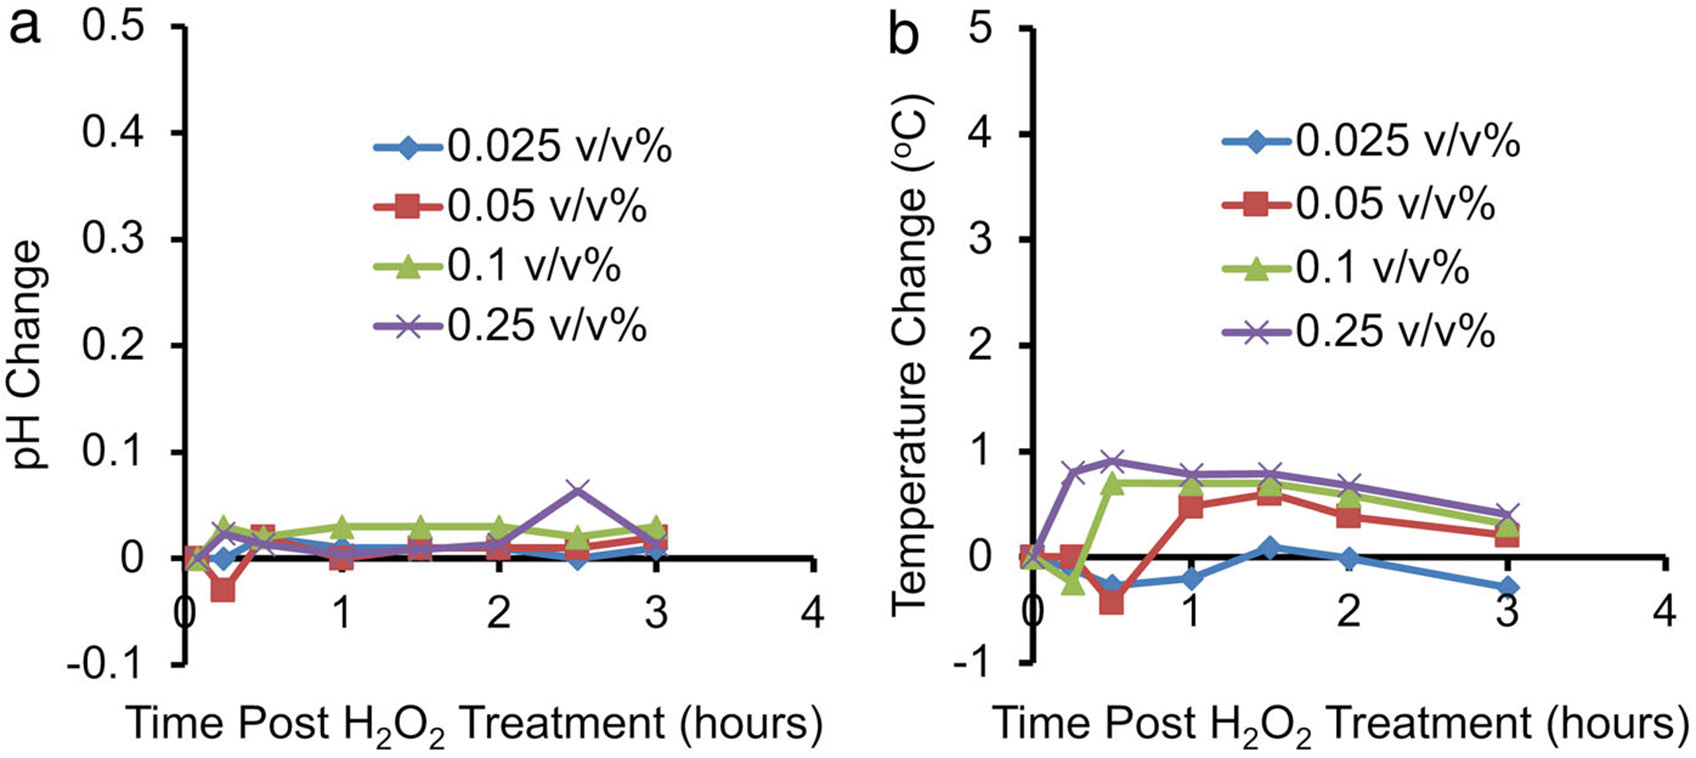
Temperature and pH changes in egg white phantom with H2O2 treatment. (a) Egg white phantoms treated with different concentrations of H2O2 showed no change in pH larger than 0.1 for up to 3 hours after treatment. (b) Temperature changes in the egg white phantoms did not exceed 1 °C for the same treatment duration.
FIGURE 7:
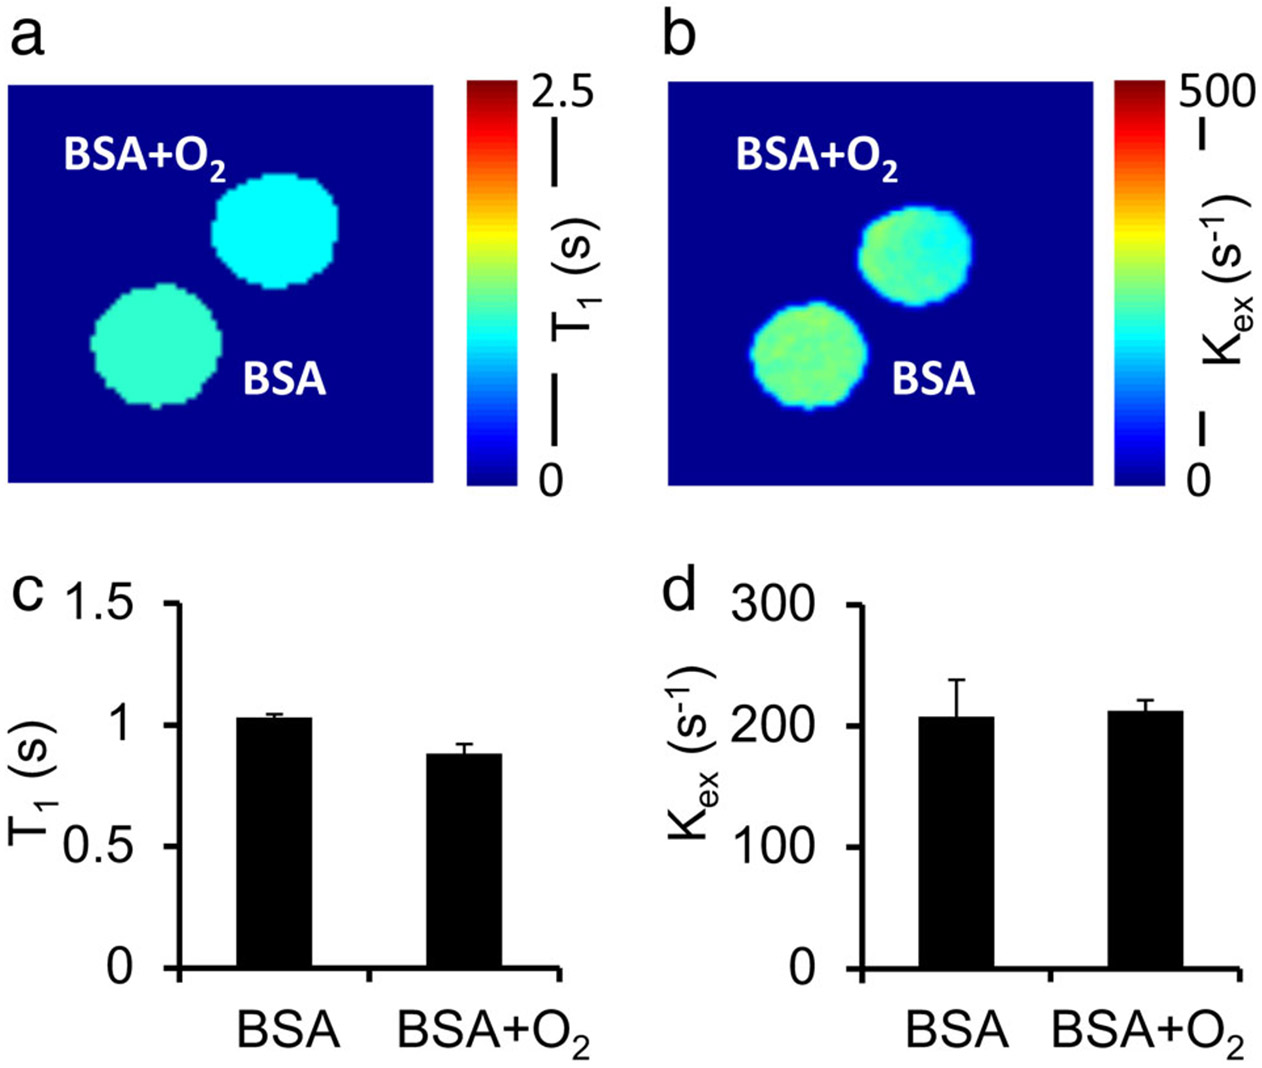
BSA phantoms bubbled with 100% oxygen gas for ~1 hour compared with untreated BSA phantoms. Oxygenated BSA shows a slightly reduced T1 compared with untreated controls (0.89 sec vs. 1.04 sec) (a,c). Proton exchange rate of oxygenated BSA samples is negligibly different from that of the control samples (b,d).
FIGURE 8:
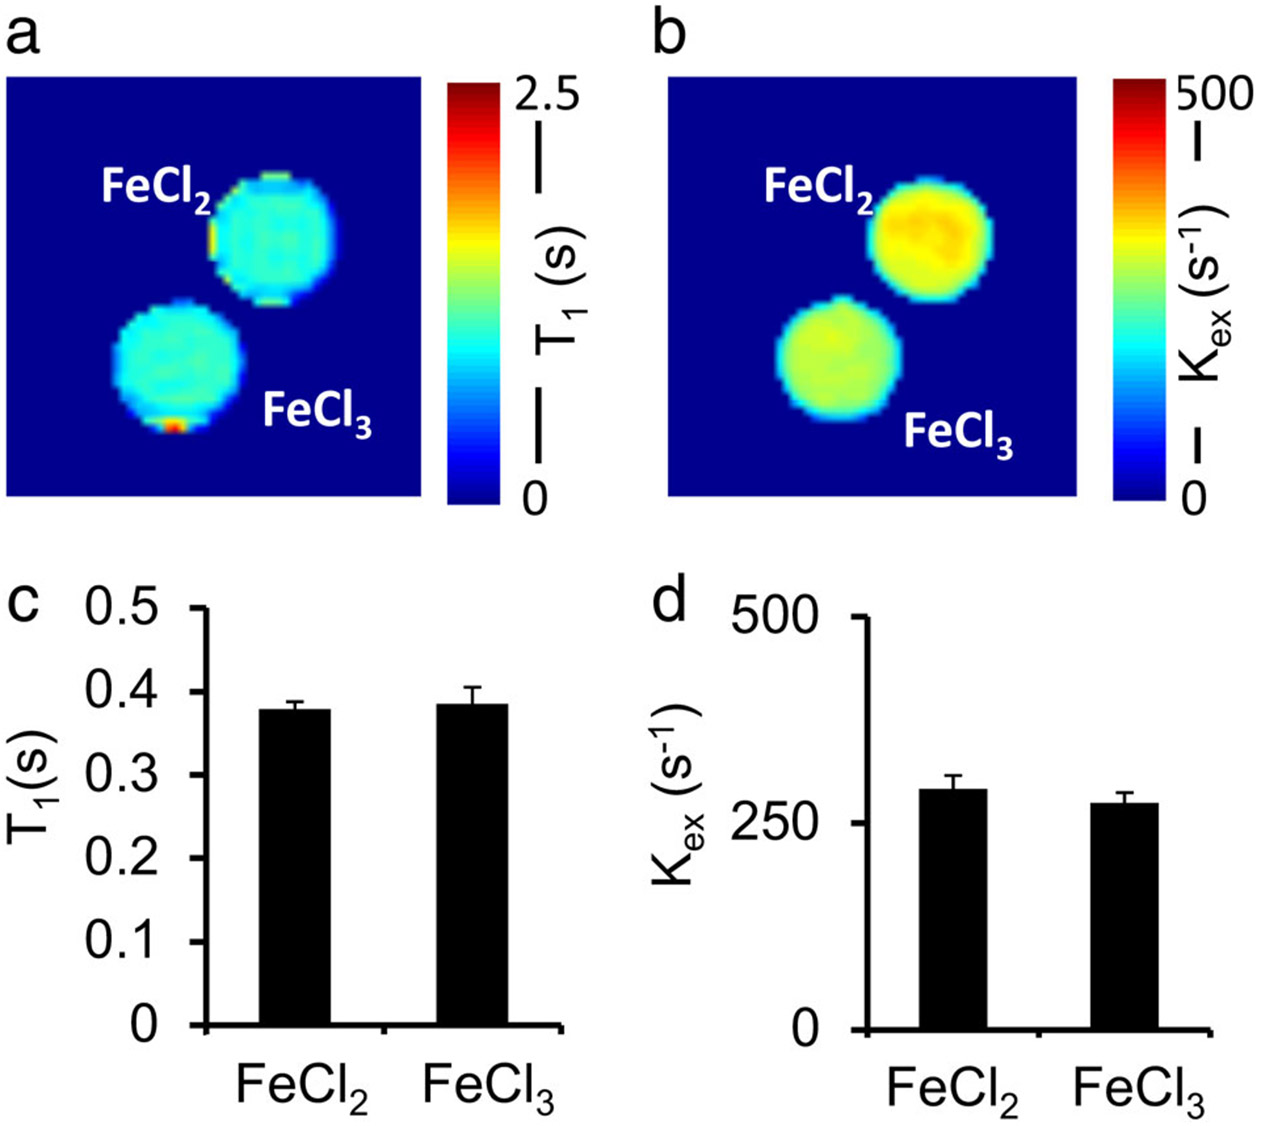
The oxidation of ferrous chloride to ferric chloride has a negligible contribution to T1 (a,c) and (b,d).
Results from the in vivo rotenone study were consistent with the phantom studies in showing reduced T1 relaxation time (6.4 ± 1.6%)9 and increased (9.2 ± 3.7%) in mice treated with rotenone (P < 0.05) (Fig. 9a). In comparison, control mice showed no changes in MRI contrasts (data not shown). Representative maps of brain before (Fig. 9b) and after (Fig. 9c) rotenone treatment were also shown.
FIGURE 9:

In vivo MRI of mouse brain before and after pro-oxidant rotenone treatment. Rotenone-induced ROS overproduction in brain leads to an increase in (a) (P < 0.05). Representative maps of mouse brain before (b) and after (c) rotenone are also shown.
To understand the mechanism underlying the fact that hydroxyl ROS promotes , we compared it with the mechanism on how pH affects . It is well known that pH modulates the proton exchange through a base-catalyzed mechanism (Fig. 10). The increase in hydroxide ions (OH−) stimulates the transformation of metabolites from R-XH to R-X− when exchangeable protons (−XH) dissociate from R-XH and react with additional [OH−] to form H2O. We hypothesize that hydroxyl ROS promote proton dissociation and exchange with water protons in a similar fashion through an oxidation catalyzed mechanism. In other words, free radicals or ROS stimulate hydrogen abstraction from metabolites to form water as an end product, hence promoting proton exchange between metabolites and water.
FIGURE 10:
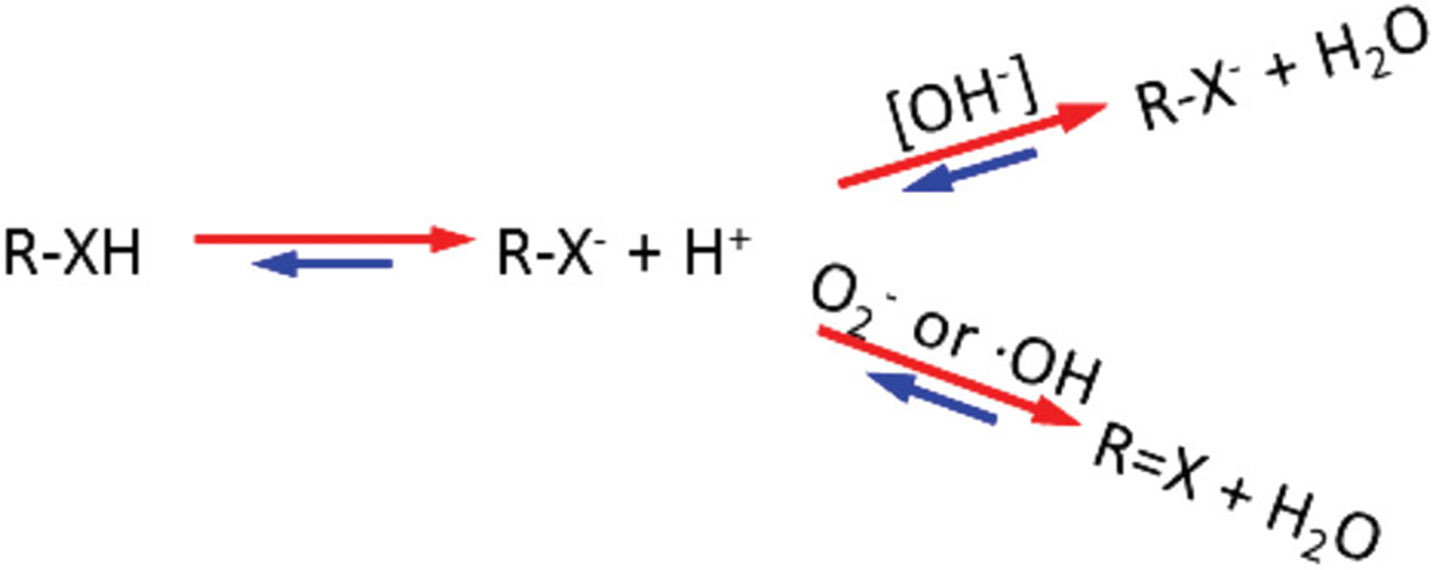
Hypothesis that free radicals or ROS promote proton exchange through an oxidation-catalyzed mechanism. Free radicals may stimulate hydrogen abstraction and promote proton exchange between metabolites and water, producing water as an end product. R: the generic group; X represent O, N, or S, etc.
Discussion
With the goal of developing an endogenous MRI method for specific ROS imaging, this study demonstrates, for the first time to our knowledge, that hydroxyl radicals possess a unique MRI property of enhancing the proton exchange rate . This property provides ROS with a distinctive MRI signature that makes it possible to differentiate endogenous ROS from other conventional paramagnetic contrast agents like Gd-DTPA, the most widely used paramagnetic MR contrast agent in clinics. We found that the detection specificity of MRI for endogenous ROS can be greatly enhanced by combining both its paramagnetic effect and proton exchange rate data. Given that T1-weighted contrast is intrinsically unspecific in vivo, it is not a useful quantitative marker on its own for detecting paramagnetic ROS. Addition of proton exchange rate information would improve the ROS detection specificity of endogenous MRI. Furthermore, T1-shortening may confirm ROS overproduction when proton exchange rate enhancement is observed. Finally, in vivo feasibility studies provide clear promise for preclinical and clinical translations.
CEST contrast is highly dependent on the RF saturation power. In fact, it has been suggested that the optimal RF for obtaining the maximal CEST effect reflects the proton exchange rate.23,24 Our egg white phantom studies showed that with weak RF, the CEST contrast was lower in H2O2-treated samples compared with untreated samples. In addition, the optimal RF power was higher in the treated samples vs. the untreated ones. Both of these results suggest that the proton exchange rate in the treated egg white phantoms was higher compared with the untreated samples. Fitting of the QUESP MRI data to Bloch–McConnell equations further confirmed and quantified the proton exchange rate enhancement due to the presence of ROS in the samples.
Imaging egg white samples treated with H2O2 for different lengths of time also confirmed the influence of ROS on the proton exchange rate. significantly increased immediately after the addition of H2O2 due to a large amount of ROS produced at the beginning of the treatment. then decreased progressively toward the baseline level as the Fenton reactions neared completion, indicating that the change in is reversible. It is important to note that significant coagulation, gelation, modification, and denaturation of egg white protein occurs when the H2O2 concentration exceeds 1 v/v%,30 which is far higher than the concentrations used in this study. The fact that the CEST contrast and the proton exchange rate in egg white samples recovered towards the baseline level 3 hours after H2O2 treatment indicated that protein oxidation or denaturation plays an insignificant role in this study.
It is also notable that H2O2 triggers Fenton reactions in egg white that lasts for hours, during which the H2O2 is converted gradually to hydroxyl ROS at a 1:1 ratio. ROS production at any given time is estimated to be at the pM level, which is consistent with our previous study9 and is well within physiological or pathological levels. CEST can be used to detect pH changes with a sensitivity of 0.1 unit,31 corresponding to nM changes in OH−. Hydroxyl ROS with very high reactivity could more efficiently affect proton exchange, likely through the oxidation catalyzed mechanism.
Although in this study we picked +3.5 ppm as the resonance under study, we did not specifically point to amide proton exchange given that amide, amine, and other exchangeable protons from varied metabolites are largely overlapped due to their broad width (typically >2 ppm).21 ROS promotes proton exchange through an oxidation-catalyzed mechanism that should apply to other exchangeable protons. In addition, QUESP-based measurement utilizes signals acquired under multiple saturation B1 amplitudes, likely exciting varied exchangeable protons with slow to fast exchange rates. The obtained exchange rate is therefore an averaged value for all exchangeable protons.
In our H2O2-treated egg white studies, pH fluctuation was very small (<0.1), and its effect on the observed proton exchange was considered negligible. Temperature fluctuation due to the reactions was also small (<1°C) and was also considered to have little impact on the observed changes in . Taken together, our findings suggest that ROS modulate the proton exchange rate independent of pH and temperature. A more detailed mechanism of how this occurs requires further investigation.
The combination of the paramagnetic effect and the proton exchange rate enhancement effect of hydroxyl ROS helped rule out contributions of other factors such as H2O2 itself, molecular oxygen, iron oxidation, and metabolite concentration changes. Our results demonstrated that the influence of H2O2 itself on relaxation time T1 was minimal. Molecular oxygen moderately reduced T1 but not the proton exchange rate. We believe that as a stable molecule, molecular oxygen’s reactivity may not be high enough to stimulate the dissociation of metabolites’ exchangeable protons in order to raise the proton exchange rate. It is important to note that molecular oxygen produced from H2O2-treated egg white samples may become trapped within the viscous egg white and create susceptibility artifacts32 and signal variations, as can be seen in some of the presented images. In addition, oxidation of iron, the transition metal that catalyzes Fenton reactions, led to minor changes in T1 and proton exchange rate, indicating that iron oxidation due to the addition of H2O2 or the produced hydroxyl ROS is not a contributing factor to the observed MRI contrasts. Although it is well known that iron oxides can influence MRI relaxation times greatly,33 in this case we are studying the transition of iron ions with different charges while maintaining iron concentration the same. Finally, simulations with Bloch–McConnell equations modified for CEST experiments21,23,34 showed that changing the CEST-expressing metabolite concentration by 10 times led to a <10% change in the observed proton exchange rate. This is particularly important since metabolite changes are seen in many pathological conditions. An increase in the proton exchange rate may thus serve as a specific marker for ROS independent of other metabolite changes.
The feasibility of in vivo detection was demonstrated in a mouse model treated with rotenone. Rotenone as a mitochondrial complex I inhibitor can raise ROS production and therefore the rotenone-treated mouse model serves for the validation of the proposed endogenous ROS MRI. Consistent changes in T1 and of the whole brain confirmed that ROS overproduction due to this pro-oxidant stimulus can be specifically detected with the novel endogenous ROS MRI. Although this preliminary experiment demonstrated T1 and changes due to the overproduction of ROS in vivo, more thorough and systematic studies are needed to investigate the spatial distribution and the treatment dose dependency.
This study has a few limitations. In terms of terminology, ROS includes all oxygen radicals (such as hydroxyl radical, superoxide, hydroperoxyl, etc.) and nonradicals, such as molecular O2, H2O2, etc.20 Of these species, the hydroxyl radical is the most reactive and destructive ROS in biological tissues.2 This study only targeted the imaging of hydroxyl radical, and endogenous MRI applied to other ROS species remains to be studied. Regarding the H2O2-treated egg white phantom, the decomposition of H2O2 may not be limited to Fenton reactions. Catalytic decomposition of H2O2 due to natural enzymes, such as catalase, can also catalyze the direct decomposition of H2O2.35 Its influence on the observed MRI contrasts and the contrast dynamics could be complicated and deserve systematic studies. We believe that the presence of catalytic enzymes may have contributed to accelerating the reaction rate. However, the nature of the reaction and the production rate of transient ROS should remain the same or similar. On the other hand, there may be a small amount of hydroxyl radicals produced in H2O2-treated BSA samples due to impurity. However, the production appears to be negligible and cannot be reliably detected, as we have shown in the T1 measurements of BSA treated with different concentrations of H2O2.
Precise quantification of remains an unsolved challenge. was derived from saturation power-dependent CEST contrast at +3.5 ppm, but this contrast may be subject to contamination from the NOE and the RF spillover or direct saturation effects.26 For instance, ROS may also affect the NOE effect or NOE properties that may influence the results on contaminating factors. However, the net effect due to ROS is still much higher than what were observed due to other confounding factors. In addition, the choice of the fitting algorithm and the initial values of some parameters that are not experimentally measurable (eg, T1, T2, and concentrations of exchangeable protons) may lead to slightly different results for the fitted . Nevertheless, a recent study showed that even with a saturation frequency close to water, QUESP analysis of from CEST data provides reliable measurements.25
In conclusion, we demonstrated that hydroxyl radical ROS possesses a unique MRI property of enhancing the proton exchange rate. Combining the T1-shortening and proton exchange rate enhancing effects of ROS, the specificity of endogenous MRI for detecting ROS can be greatly enhanced by ruling out various potential contaminating factors. Considering that the detection sensitivity of ROS using endogenous MRI was found to be well below reported physiological concentrations,9 the findings from this study help to pave the path toward development of in vivo endogenous ROS MRI. The increased production of ROS correlates with many important cellular events including proliferation, differentiation, apoptosis, and senescence.36 The development of such endogenous MRI methods for ROS detection may have a tremendous impact on in vitro and in vivo biomedical research and clinical practice.
Acknowledgments
Contract grant sponsor: National Institutes of Health (NIH); Contract grant number: R21 EB023516 (to K.C.).
We acknowledge the valuable discussions with X. Joe Zhou from the Center for MR Research at the University of Illinois at Chicago and Dr. A. Dean Sherry from the Advanced Imaging Research Center at the University of Texas at Southwestern.
References
- 1.Zorov DB, Juhaszova M, Sollott SJ. Mitochondrial reactive oxygen species (ROS) and ROS-induced ROS release. Physiol Rev 2014;94:909–950. [DOI] [PMC free article] [PubMed] [Google Scholar]
- 2.Buettner GR. The pecking order of free radicals and antioxidants: Lipid peroxidation, alpha-tocopherol, and ascorbate. Arch Biochem Biophys 1993;300:535–543. [DOI] [PubMed] [Google Scholar]
- 3.Barnham KJ, Masters CL, Bush AI. Neurodegenerative diseases and oxidative stress. Nat Rev Drug Discov 2004;3:205–214. [DOI] [PubMed] [Google Scholar]
- 4.Setsukinai K-i, Urano Y, Kakinuma K, Majima HJ, Nagano T. Development of novel fluorescence probes that can reliably detect reactive oxygen species and distinguish specific species. J Biol Chem 2003;278:3170–3175. [DOI] [PubMed] [Google Scholar]
- 5.Xu HN, Nioka S, Glickson JD, Chance B, Li LZ. Quantitative mitochondrial redox imaging of breast cancer metastatic potential. J Biomed Opt 2010;15:036010. [DOI] [PMC free article] [PubMed] [Google Scholar]
- 6.Emoto MC, Yamato M, Sato-Akaba H, Yamada K, Matsuoka Y, Fujii HG. Brain imaging in methamphetamine-treated mice using a nitroxide contrast agent for EPR imaging of the redox status and a gadolinium contrast agent for MRI observation of blood-brain barrier function. Free Radic Res 2015;49:1038–1047. [DOI] [PubMed] [Google Scholar]
- 7.Utsumi H, Yamada K-i, Ichikawa K, et al. Simultaneous molecular imaging of redox reactions monitored by Overhauser-enhanced MRI with 14N- and 15N-labeled nitroxyl radicals. Proc Natl Acad Sci U S A 2006;103:1463–1468. [DOI] [PMC free article] [PubMed] [Google Scholar]
- 8.Berkowitz BA, Lewin AS, Biswal MR, Bredell BX, Davis C, Roberts R. MRI of retinal free radical production with laminar resolution in vivo. Invest Ophthalmol Vis Sci 2016;57:577–585. [DOI] [PMC free article] [PubMed] [Google Scholar]
- 9.Tain RW, Scotti AM, Li W, Zhou XJ, Cai K. Imaging short-lived reactive oxygen species (ROS) with endogenous contrast MRI. J Magn Reson Imaging 2018;47:222–229. [DOI] [PMC free article] [PubMed] [Google Scholar]
- 10.Bloembergen N, Purcell EM, Pound RV. Relaxation effects in nuclear magnetic resonance absorption. Phys Rev 1948;73:679–712. [Google Scholar]
- 11.Hahn EL. Spin echoes. Phys Rev 1950;80:580–594. [Google Scholar]
- 12.Carr HY, Purcell EM. Effects of diffusion on free precession in nuclear magnetic resonance experiments. Phys Rev 1954;94:630–638. [Google Scholar]
- 13.Torrey HC. Bloch equations with diffusion terms. Phys Rev 1956;104:563–565. [Google Scholar]
- 14.Cai K, Singh A, Poptani H, et al. CEST signal at 2 ppm (CEST@2ppm) from Z-spectral fitting correlates with creatine distribution in brain tumor. NMR Biomed 2015;28:1–8. [DOI] [PMC free article] [PubMed] [Google Scholar]
- 15.van Zijl PCM, Yadav NN. Chemical exchange saturation transfer (CEST): What is in a name and what isn’t? Magn Reson Med 2011;65:927–948. [DOI] [PMC free article] [PubMed] [Google Scholar]
- 16.Zhou J, Wilson DA, Sun PZ, Klaus JA, Van Zijl PC. Quantitative description of proton exchange processes between water and endogenous and exogenous agents for WEX, CEST, and APT experiments. Magn Reson Med 2004;51:945–952. [DOI] [PubMed] [Google Scholar]
- 17.Forkink M, Smeitink JA, Brock R, Willems PH, Koopman WJ. Detection and manipulation of mitochondrial reactive oxygen species in mammalian cells. Biochim Biophys Acta 2010;1797:1034–1044. [DOI] [PubMed] [Google Scholar]
- 18.Li N, Ragheb K, Lawler G, et al. Mitochondrial complex I inhibitor rotenone induces apoptosis through enhancing mitochondrial reactive oxygen species production. J Biol Chem 2003;278:8516–8525. [DOI] [PubMed] [Google Scholar]
- 19.Pan-Montojo F, Anichtchik O, Dening Y, et al. Progression of Parkinson’s disease pathology is reproduced by intragastric administration of rotenone in mice. PLoS One 2010;5:e8762. [DOI] [PMC free article] [PubMed] [Google Scholar]
- 20.Halliwell B, Gutteridge JMC. Free radicals in biology and medicine. Oxford, UK: Oxford University Press; 2015. [Google Scholar]
- 21.Cai K, Haris M, Singh A, et al. Magnetic resonance imaging of glutamate. Nat Med 2012;18:302–306. [DOI] [PMC free article] [PubMed] [Google Scholar]
- 22.Zhou J, Payen J-F, Wilson DA, Traystman RJ, van Zijl PCM. Using the amide proton signals of intracellular proteins and peptides to detect pH effects in MRI. Nat Med 2003;9:1085–1090. [DOI] [PubMed] [Google Scholar]
- 23.Woessner DE, Zhang S, Merritt ME, Sherry AD. Numerical solution of the Bloch equations provides insights into the optimum design of PARACEST agents for MRI. Magn Reson Med 2005;53:790–799. [DOI] [PubMed] [Google Scholar]
- 24.Sun PZ, Wang Y, Xiao G, Wu R. Simultaneous experimental determination of labile proton fraction ratio and exchange rate with irradiation radio frequency power-dependent quantitative CEST MRI analysis. Contrast Media Mol Imaging 2013;8:246–251. [DOI] [PMC free article] [PubMed] [Google Scholar]
- 25.Sun PZ. Simultaneous determination of labile proton concentration and exchange rate utilizing optimal RF power: Radio frequency power (RFP) dependence of chemical exchange saturation transfer (CEST) MRI. J Magn Reson 2010;202:155–161. [DOI] [PMC free article] [PubMed] [Google Scholar]
- 26.Sun PZ, Wang Y, Dai Z, Xiao G, Wu R. Quantitative chemical exchange saturation transfer (qCEST) MRI—RF spillover effect-corrected omega plot for simultaneous determination of labile proton fraction ratio and exchange rate. Contrast Media Mol Imaging 2014;9:268–275. [DOI] [PMC free article] [PubMed] [Google Scholar]
- 27.McMahon MT, Gilad AA, Zhou J, Sun PZ, Bulte JWM, van Zijl PCM. Quantifying exchange rates in chemical exchange saturation transfer agents using the saturation time and saturation power dependencies of the magnetization transfer effect on the magnetic resonance imaging signal (QUEST and QUESP): pH calibration for poly-L-lysine and a starburst dendrimer. Magn Reson Med 2006;55:836–847. [DOI] [PMC free article] [PubMed] [Google Scholar]
- 28.Jones CK, Huang A, Xu J, et al. Nuclear Overhauser enhancement (NOE) imaging in the human brain at 7T. Neuroimage 2013;77:114–124. [DOI] [PMC free article] [PubMed] [Google Scholar]
- 29.Lu J, Zhou J, Cai C, Cai S, Chen Z. Observation of true and pseudo NOE signals using CEST-MRI and CEST-MRS sequences with and without lipid suppression. Magn Reson Med 2015;73:1615–1622. [DOI] [PMC free article] [PubMed] [Google Scholar]
- 30.Snider DW, Cotterill OJ. Hydrogen peroxide oxidation and coagulation of egg white. J Food Sci 1972;37:558–561. [Google Scholar]
- 31.Zaiss M, Xu J, Goerke S, et al. Inverse Z-spectrum analysis for spillover-, MT-, and T1-corrected steady-state pulsed CEST-MRI — application to pH-weighted MRI of acute stroke. NMR Biomed 2014;27:240–252. [DOI] [PMC free article] [PubMed] [Google Scholar]
- 32.Wong Kelvin K, Huang I, Kim Young R, et al. In vivo study of microbubbles as an MR susceptibility contrast agent. Magn Reson Med 2004;52:445–452. [DOI] [PubMed] [Google Scholar]
- 33.Bao Y, Sherwood JA, Sun Z. Magnetic iron oxide nanoparticles as T1 contrast agents for magnetic resonance imaging. J Mater Chem C 2018;6:1280–1290. [Google Scholar]
- 34.McConnell HM. Reaction rates by nuclear magnetic resonance. J Chem Phys 1958;28:430–431. [Google Scholar]
- 35.Zheng Y, Liu Y, Ge J, et al. Resveratrol protects human lens epithelial cells against H(2)O(2)-induced oxidative stress by increasing catalase, SOD-1, and HO-1 expression. Mol Vis 2010;16:1467–1474. [PMC free article] [PubMed] [Google Scholar]
- 36.Do Quyen N, Ratnakar James S, Kovács Z, Sherry AD. Redox- and hypoxia-responsive MRI contrast agents. ChemMedChem 2014;9:1116–1129. [DOI] [PMC free article] [PubMed] [Google Scholar]


