

ABSTRACT
Aims/Introduction
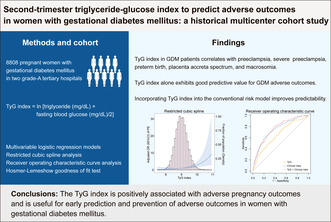
Women with gestational diabetes mellitus are at high risk for adverse maternal and neonatal outcomes. The study aimed to evaluate the performance of the triglyceride‐glucose index in predicting the risk of developing adverse outcomes in women with gestational diabetes mellitus.
Materials and Methods
This retrospective multicenter cohort study included 8,808 pregnant women with gestational diabetes mellitus in two grade‐A tertiary hospitals in China during 2018–2022. The triglyceride‐glucose index was defined as ln [triglyceride (mg/dL) × fasting blood glucose (mg/dL)/2]. Significant adverse gestational diabetes mellitus outcomes were chosen by generalized linear models as the main outcomes. Multivariable logistic regression models evaluated their association with the triglyceride‐glucose index. Areas under the receiver operating characteristic curves predicted adverse pregnancy outcomes. The prediction efficiency was validated in the sensitivity analysis dataset and validation cohort.
Results
The triglyceride‐glucose index was associated with preeclampsia, severe preeclampsia, preterm birth, placenta accreta spectrum, and macrosomia before and after adjusting for confounding factors (P < 0.05). The predictive performance of the triglyceride‐glucose index was relatively moderate. Incorporating the triglyceride‐glucose index into the baseline clinical risk model improved the area under curves for the diagnosis of preeclampsia (0.749 [0.714–0.784] vs 0.766 [0.734–0.798], P = 0.033) and macrosomia (0.664 [0.644–0.685] vs 0.676 [0.656–0.697], P = 0.002). These predictive models exhibited good calibration and robustness.
Conclusions
The triglyceride‐glucose index is positively associated with preeclampsia, severe preeclampsia, preterm birth, placenta accreta spectrum, and macrosomia and is useful for the early prediction and prevention of adverse outcomes in women with gestational diabetes mellitus.
Keywords: Gestational diabetes mellitus, Pregnancy outcome, Triglyceride‐glucose index
Women with gestational diabetes mellitus are at high risk for adverse maternal and neonatal outcomes. The triglyceride‐glucose index alone and when incorporated into the conventional risk model exhibit good predictive value for GDM adverse outcomes, enabling early identification prevention for high‐risk women.
INTRODUCTION
Gestational diabetes mellitus (GDM), affecting approximately 14% of all global pregnancies, is a common metabolic complication 1 , 2 , 3 . GDM is associated with increased risks of adverse pregnancy outcomes for both mothers and offspring 4 . Women with GDM are at an increased risk of preterm delivery, gestational hypertension or preeclampsia, cesarean section, postpartum hemorrhage, type 2 diabetes, cardiovascular disease, and many other complications 4 , 5 . Offspring born to mothers with GDM face an elevated likelihood of perinatal morbidity, macrosomia, hyperinsulinemia, hypoglycemia, hyperbilirubinemia, neonatal respiratory distress syndrome, and metabolic perturbations in their childhood and early adulthood 5 , 6 . Despite improvements in GDM outcomes following the advances in living standards and medical care, the incidence rates are high, and GDM remains a significant public health concern. Therefore, GDM and its associated adverse outcomes should be detected in apparently healthy populations using potential biomarkers for early management and preventive measures.
The triglyceride‐glucose (TyG) index, calculated using fasting plasma glucose (FPG) and triglyceride (TG), was initially identified as strongly linked to insulin resistance (IR), acting as a reliable and accessible index for assessing IR and type 2 diabetes 7 , 8 , 9 , 10 . Lipid and glucose dysregulation both contribute to the progression of GDM and subsequent type 2 diabetes post‐delivery 5 , 11 . Increasing evidence suggests that the TyG index, a biomarker associated with lipid and glucose metabolism, also shows considerable value in predicting the onset of GDM 12 , 13 , 14 . A Korean cohort study revealed a positive association between pre‐pregnancy TyG index and GDM risk 13 . Li et al. demonstrated a significant relationship between the first‐trimester TyG index and the incidence of GDM in a cohort of 11,387 women 15 . Moreover, the TyG index screening exhibited a good GDM diagnostic performance during 24–28 weeks of gestation 16 . However, few studies have focused on the association between the TyG index and adverse maternal and perinatal outcomes in women with GDM.
We hypothesized that the maternal TyG index could predict GDM‐related complications in late pregnancy and early infant life. We aimed to examine the association between the second‐trimester TyG index and adverse maternal and neonatal outcomes and to explore the TyG index's ability to predict these complications. If confirmed as a valuable predictor, the TyG index could help to develop and implement preventive measures in high‐risk women for a better pregnancy outcome.
MATERIALS AND METHODS
Study population
This retrospective observational cohort study included women with gestational diabetes mellitus treated at Nanjing Women and Children's Healthcare Hospital (Center 1) from January 2018 to January 2020 and Changzhou Maternal and Child Health Care Hospital (Center 2) from January 2018 to August 2022. The inclusion criteria were as follows: (1) age ≥18 years; (2) diagnosed with GDM using a 75 g oral glucose tolerance test (OGTT); (3) delivered at one of the participating centers. The exclusion criteria included: (1) multiple pregnancies; (2) fetal dysplasia or stillbirth; (3) assisted reproduction conception; (4) diagnosed with pregestational diabetes mellitus or chronic hypertension; (5) missing FPG and TG data (Figure 1). Finally, 8,808 women were included, 8,096 from Center 1 (training cohort) and 712 from Center 2 (external validation cohort). The study was approved by the Medical Ethics Committee of Nanjing Women and Children's Healthcare Hospital (approval number 2022KY‐165‐01), and it conforms to the provisions of the Declaration of Helsinki (as revised in Fortaleza, Brazil, October 2013). Due to the retrospective nature of this study, informed consent was waived. All details that could reveal the patient's identity were removed.
Figure 1.
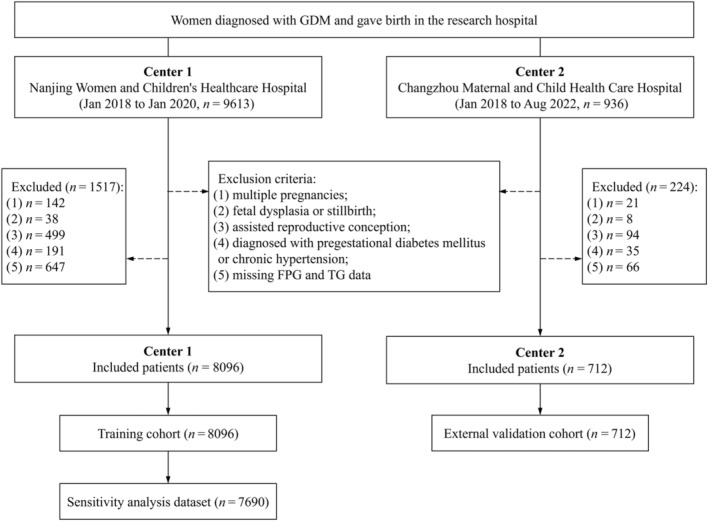
Flow chart of the study population. FPG, fasting plasma glucose; GDM, gestational diabetes mellitus; TG, triglyceride.
Data collection, definitions, and measurements
During a prenatal visit in the second trimester (about 24 weeks gestation), anthropometric and biochemical measurements were assessed. Maternal age, pre‐pregnancy body mass index (BMI), parity, delivery gestations, and insulin therapy were recorded. Pre‐pregnancy BMI was calculated as the pre‐pregnancy weight (kilograms) divided by the height (meters) squared. The FPG, TG, total cholesterol (TC), and glycated hemoglobin (HbA1c) levels were measured after fasting for more than 8 h. The TyG index was calculated as ln [TG (mg/dL) × FPG (mg/dL)/2] 8 .
In China, a standardized 75 g 2 h OGTT is used as a one‐step approach to GDM screening in women at 24–28 weeks of gestation. A diagnosis of GDM is made following the International Association of the Diabetes and Pregnancy Study Group (IADPSG) when meeting the following conditions: FPG ≥5.1 mmol/L, 1 h plasma glucose ≥10.0 mmol/L, 2 h plasma glucose ≥8.5 mmol/L 17 . GDM was defined based on code O24.4 or O24.9 in the International Classification of Diseases (ICD)‐10. Information regarding maternal and neonatal outcomes was collected after delivery. Maternal outcomes included preeclampsia (PE), severe PE, oligohydramnios, polyhydramnios, intrahepatic cholestasis of pregnancy, thrombopenia, preterm birth, fetal distress, placenta accreta spectrum (PAS), and postpartum hemorrhage. Fetal or neonatal outcomes included transient tachypnea of the newborn, neonatal respiratory distress syndrome, asphyxia of the newborn, neonatal hypoglycemia, neonatal hyperbilirubinemia, macrosomia, low birthweight, and low 1 min and 5 min Apgar score. A low 1 (5) min Apgar score was defined as <7 18 . The remaining outcomes were defined using the corresponding ICD‐10 codes in the medical reports.
Statistical analyses
The baseline characteristics of the study population were described using the TyG index quartiles (Q1–Q4). Continuous variables are summarized as means (standard deviations) and were compared using a one‐way analysis of variance when normally distributed. Categorical variables are summarized as counts (proportions) and were compared using the χ2 or Fisher's exact test.
Generalized linear models were used to calculate the P values for the GDM‐related adverse pregnancy outcomes, selecting those with a P for trend < 0.05 as the main adverse pregnancy outcomes for further analysis. Univariate and multivariable‐adjusted logistic regression analyses estimated the odd ratios (ORs) and 95% confidence intervals (CIs) for pregnancy outcomes by the TyG index. Three models were developed: Model 1 used the crude data; Model 2 was Model 1 adjusted for age, pre‐pregnancy BMI, and parity; Model 3 was Model 2 adjusted for TC, OGTT‐FPG, OGTT‐1 h, OGTT‐2 h, and HbA1c. The TyG index was included in the models as a continuous or categorical variable to assess independent risk variables for pregnancy outcomes in each model. To further assess the linearity of the relationship between the TyG index and risk factors for adverse pregnancy outcomes, restricted cubic spline analysis was performed after adjusting for the variables in Model 3, using four TyG index distribution knots (25th, 50th, 75th, and 95th percentiles).
Receiver operating characteristic (ROC) curve analysis was used to evaluate the discriminatory ability and performance of the TyG index in predicting adverse maternal and neonatal outcomes. The area under the ROC curve (AUC) was calculated and compared using DeLong's test to evaluate the predictive value after introducing the TyG index into the baseline clinical risk model. The baseline clinical risk factors included age, pre‐pregnancy BMI, parity, OGTT‐FPG, OGTT‐1 h, OGTT‐2 h, HbA1c, and TC. The Hosmer‐Lemeshow goodness of fit test assessed whether the models were correctly specified.
Subgroup analysis was conducted after stratifying the participants by age (<35 or ≥35 years), parity (1 or ≥2), and pre‐pregnancy BMI (<24 or ≥24 kg/m2) to identify the impact of these variables. Interactions across subgroups were tested using the likelihood ratio test. In the sensitivity analysis, the robustness of the results was tested after excluding women who underwent insulin therapy. Statistical analysis was conducted using R software (version 4.2.0). Two‐sided statistical significance was set at P < 0.05.
RESULTS
Baseline characteristics
The training cohort included 8,096 eligible women from Center 1 (Figure 1). The baseline characteristics of the women, divided into TyG index quartiles, are presented in Table 1. Individuals in the high TyG index quartile groups (Q3 and Q4) were more likely to be older, multiparous, have higher BMI, OGTT‐FPG, OGTT‐1 h, HbA1c, and TC levels, lower delivery gestation age, and heavier birthweight. All TyG index quartiles had similar OGTT‐2 h levels and insulin treatment. The independent external validation cohort included 712 women from Center 2 (Figure 1, Table S1). The characteristics in this cohort were similar to those in the training cohort, except for the lack of differences in age, parity, and delivery gestation age.
Table 1.
Baseline characteristics of participants according to quartiles of the TyG index
| Characteristics | TyG index quartiles | P value | |||
|---|---|---|---|---|---|
| Q1 (n = 2025) | Q2 (n = 2024) | Q3 (n = 2024) | Q4 (n = 2023) | ||
| Maternal characteristics | |||||
| Age, years (SD) | 30.16 (3.93) | 30.65 (4.14) | 30.97 (4.08) | 31.26 (4.31) | <0.001 |
| Pre‐pregnancy BMI, kg/m2 (SD) | 22.62 (2.07) | 23.09 (2.23) | 23.50 (2.27) | 23.95 (2.31) | <0.001 |
| Parity, n (%) | <0.001 | ||||
| 1 | 1,428 (70.52%) | 1,323 (65.37%) | 1,256 (62.06%) | 1,196 (59.12%) | |
| ≥2 | 597 (29.48%) | 701 (34.63%) | 768 (37.94%) | 827 (40.88%) | |
| OGTT‐FPG, mmol/L (SD) | 4.62 (0.43) | 4.74 (0.43) | 4.83 (0.42) | 4.95 (0.47) | <0.001 |
| OGTT‐1h, mmol/L (SD) | 8.89 (1.63) | 8.96 (1.55) | 9.00 (1.57) | 9.15 (1.59) | <0.001 |
| OGTT‐2h, mmol/L (SD) | 7.86 (1.50) | 7.85 (1.47) | 7.79 (1.43) | 7.79 (1.45) | 0.280 |
| HbA1c, % (SD) | 4.99 (0.30) | 5.07 (0.29) | 5.12 (0.32) | 5.20 (0.33) | <0.001 |
| HbA1c, mmol/mol (SD) | 31.04 (3.33) | 31.91 (3.17) | 32.46 (3.45) | 33.34 (3.62) | <0.001 |
| TC, mmol/L (SD) | 5.68 (0.87) | 5.83 (0.92) | 5.93 (1.02) | 5.83 (1.03) | <0.001 |
| TyG index (SD) | 8.53 (0.18) | 8.87 (0.07) | 9.11 (0.07) | 9.49 (0.23) | <0.001 |
| Insulin therapy n (%) | 91 (4.49%) | 97 (4.79%) | 94 (4.64%) | 124 (6.13%) | 0.065 |
| Neonatal characteristics | |||||
| Gestational age, weeks (SD) | 39.48 (1.20) | 39.38 (1.23) | 39.24 (1.39) | 39.15 (1.65) | <0.001 |
| Birthweight, g (SD) | 3364.26 (412.11) | 3394.95 (431.18) | 3410.51 (466.33) | 3455.50 (494.59) | <0.001 |
| 1‐min Apgar score (SD) | 9.96 (0.28) | 9.96 (0.34) | 9.94 (0.41) | 9.94 (0.43) | 0.095 |
| 5‐min Apgar score (SD) | 9.99 (0.14) | 9.99 (0.11) | 9.99 (0.13) | 9.98 (0.22) | 0.272 |
Data are presented as mean ± standard deviation or as n (%). The bold P value indicates statistical significance. BMI, body mass index; FPG, fasting plasma glucose; HbA1c, glycated hemoglobin; OGTT, oral glucose tolerance test; Q, quartiles; TC, total cholesterol; TyG index, triglyceride‐glucose index.
Risk of GDM‐related adverse maternal and neonatal outcomes by TyG index quartiles
The prevalence of GDM‐related adverse maternal and neonatal outcomes according to the TyG index quartiles is shown in Table S2. The PE, severe PE, preterm birth, PAS, and macrosomia rates in the Q2, Q3, and Q4 groups were higher than in the Q1 group (P for trend ≤ 0.001), while the groups did not differ in the incidence of the other outcomes. Therefore, we chose these as the five main adverse pregnancy outcomes for further analysis.
Logistic regression analysis results of the risk of the five main outcomes according to the TyG index are shown in Table 2. When the TyG index was used as a continuous variable, it was positively associated with the risk of all five main outcomes in Model 1 (unadjusted), Model 2 (adjusted for age, pre‐pregnancy BMI, and parity), and Model 3 (Model 2 adjusted for TC, OGTT‐FPG, OGTT‐1 h, OGTT‐2 h, and HbA1c).
Table 2.
Associations of the TyG index with maternal and neonatal outcomes in GDM population
| Continuous | TyG index quartiles | P for trend | ||||
|---|---|---|---|---|---|---|
| Q1 | Q2 | Q3 | Q4 | |||
| Preeclampsia | ||||||
| Model 1 | 3.91 (2.75, 5.54) | Ref. | 2.34 (1.32, 4.33) | 3.25 (1.89, 5.89) | 5.37 (3.22, 9.54) | <0.001 |
| Model 2 | 3.14 (2.14, 4.58) | Ref. | 2.05 (1.15, 3.81) | 2.54 (1.47, 4.65) | 3.84 (2.28, 6.89) | <0.001 |
| Model 3 | 2.61 (1.74, 3.89) | Ref. | 1.94 (1.09, 3.62) | 2.25 (1.28, 4.14) | 3.14 (1.83, 5.71) | <0.001 |
| Severe preeclampsia | ||||||
| Model 1 | 5.74 (3.26, 9.95) | Ref. | 1.60 (0.53, 5.31) | 4.03 (1.63, 12.14) | 6.49 (2.76, 19.03) | <0.001 |
| Model 2 | 4.81 (2.60, 8.73) | Ref. | 1.41 (0.47, 4.67) | 3.12 (1.24, 9.46) | 4.61 (1.92, 13.64) | <0.001 |
| Model 3 | 4.08 (2.13, 7.68) | Ref. | 1.36 (0.45, 4.52) | 2.80 (1.10, 8.58) | 3.81 (1.55, 11.50) | 0.001 |
| Preterm birth | ||||||
| Model 1 | 2.15 (1.64, 2.79) | Ref. | 1.07 (0.75, 1.53) | 2.05 (1.50, 2.82) | 2.07 (1.51, 2.85) | <0.001 |
| Model 2 | 2.12 (1.61, 2.78) | Ref. | 1.06 (0.74, 1.52) | 2.03 (1.48, 2.81) | 2.04 (1.48, 2.84) | <0.001 |
| Model 3 | 1.73 (1.30, 2.31) | Ref. | 1.00 (0.70, 1.43) | 1.82 (1.32, 2.54) | 1.67 (1.19, 2.35) | <0.001 |
| Placenta accreta spectrum | ||||||
| Model 1 | 2.20 (1.54, 3.11) | Ref. | 1.08 (0.69, 1.69) | 1.41 (0.93, 2.16) | 1.79 (1.20, 2.70) | 0.002 |
| Model 2 | 1.85 (1.28, 2.67) | Ref. | 0.99 (0.63, 1.55) | 1.23 (0.81, 1.90) | 1.47 (0.97, 2.24) | 0.034 |
| Model 3 | 1.79 (1.21, 2.62) | Ref. | 0.96 (0.61, 1.51) | 1.17 (0.76, 1.82) | 1.37 (0.90, 2.13) | 0.083 |
| Macrosomia | ||||||
| Model 1 | 2.38 (1.96, 2.89) | Ref. | 1.26 (0.98, 1.62) | 1.64 (1.30, 2.09) | 2.37 (1.90, 2.98) | <0.001 |
| Model 2 | 1.86 (1.52, 2.28) | Ref. | 1.13 (0.88, 1.45) | 1.35 (1.06, 1.73) | 1.79 (1.42, 2.26) | <0.001 |
| Model 3 | 1.66 (1.34, 2.06) | Ref. | 1.08 (0.84, 1.39) | 1.25 (0.98, 1.60) | 1.58 (1.25, 2.02) | <0.001 |
Model 1 was unadjusted. Model 2 was Model 1 adjusted for age, pre‐pregnancy BMI, and parity. Model 3 was Model 2 adjusted for TC, OGTT‐FPG, OGTT‐1h, OGTT‐2h, and HbA1c. The bold P value indicates statistical significance. GDM, gestational diabetes mellitus; Q, quartiles; TyG index, triglyceride‐glucose index.
Compared with women in Q1, those in Q4 had a higher risk of developing PE (OR, 5.37; 95% CI, 3.22–9.54; P for trend < 0.001), severe PE (OR, 6.49; 95% CI, 2.76–19.03; P for trend < 0.001), preterm birth (OR, 2.07; 95% CI, 1.51–2.85; P for trend < 0.001), PAS (OR, 1.79; 95% CI, 1.20–2.70; P for trend = 0.002), and macrosomia (OR, 2.37; 95% CI, 1.90–2.98; P for trend < 0.001) in Model 1. The prevalence of the five outcomes increased substantially with the TyG index in Model 2 (PE: OR, 3.84; 95% CI, 2.28–6.89; P for trend < 0.001; severe PE: OR, 4.61; 95% CI, 1.92–13.64; P for trend < 0.001; preterm birth: OR, 2.04; 95% CI, 1.48–2.84; P for trend < 0.001; PAS: OR, 1.47; 95% CI, 0.97–2.24; P for trend = 0.034; macrosomia: OR, 1.79; 95% CI, 1.42–2.26; P for trend < 0.001).
When compared when Q1 in Model 3, women in Q4 had a significantly higher risk of developing PE (OR, 3.14; 95% CI, 1.83–5.71; P for trend < 0.001), severe PE (OR, 3.81; 95% CI, 1.55–11.50; P for trend = 0.001), preterm birth (OR, 1.67; 95% CI, 1.19–2.35; P for trend < 0.001), and macrosomia (OR, 1.58; 95% CI, 1.25–2.02; P for trend < 0.001), but the association for PAS became insignificant (OR, 1.37; 95% CI, 0.90–2.13; P for trend = 0.083).
Restricted cubic spline analysis showed a dose–response relationship between the TyG index and the five main adverse pregnancy outcomes after adjusting for multiple covariates (all P values for non‐linearity >0.05; P for overall <0.05; Figure 2).
Figure 2.
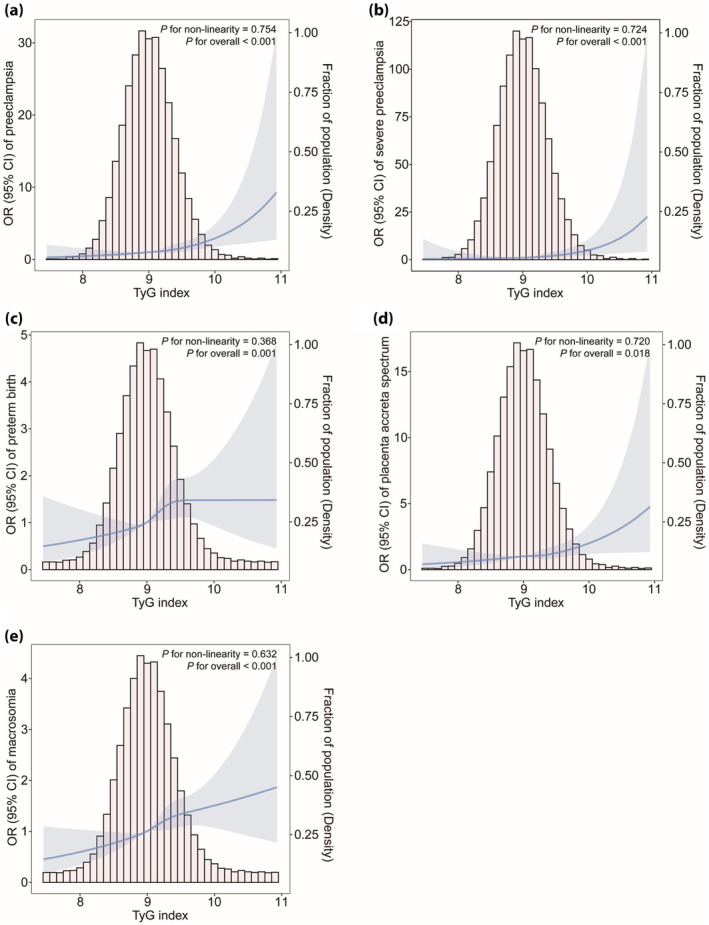
Multivariable‐adjusted odd ratios for maternal and neonatal adverse outcomes based on restricted cubic spline analysis. (a) Preeclampsia, (b) severe preeclampsia, (c) preterm birth, (d) placenta accreta spectrum, (e) macrosomia. The restricted cubic spline analysis used four knots (25th, 50th, 75th, and 95th percentiles) of changes in the TyG index. Adjustment factors are the same as for Model 3 (age, pre‐pregnancy BMI, parity, OGTT‐FPG, OGTT‐1h, OGTT‐2h, HbA1c, and TC). BMI, body mass index; GDM, gestational diabetes mellitus; HbA1c, glycated hemoglobin; OGTT, oral glucose tolerance test; TC, total cholesterol; TyG index, triglyceride‐glucose index.
ROC curve analysis and calibration degree of the TyG index to predict adverse GDM outcomes
The ROC curves were used to assess the predictive performance of the TyG index and to compare its ability with TG, FPG, and baseline clinical risk variables to predict adverse pregnancy outcomes (Table 3, Figure 3). The TyG index achieved superior performance compared with TG and FPG (Table 3). The AUC of the TyG index for predicting PE was 0.655 (95% CI, 0.615–0.694). Notably, incorporating the TyG index into the clinical risk model significantly increased the model's AUC from 0.749 (95% CI, 0.714–0.784) to 0.766 (95% CI, 0.734–0.798) (P = 0.033; Figure 3a). For macrosomia, the TyG index also significantly improved the predictability when added to the clinical risk model (AUC, 0.664 [95% CI, 0.644–0.685] vs AUC, 0.676 [95% CI, 0.656–0.697]; P = 0.002; Figure 3e). A similar improvement was noted for severe PE (AUC, 0.796; 95% CI, 0.744–0.848; P = 0.095; Figure 3b), preterm birth (AUC, 0.655; 95% CI, 0.627–0.684; P = 0.099; Figure 3c), and PAS (AUC, 0.699; 95% CI, 0.663–0.725; P = 0.217; Figure 3d), although it did not reach statistical significance.
Table 3.
Receiver operating characteristic curve analysis of TG, FPG, and TyG index for detecting GDM‐related maternal and neonatal outcomes
| TG AUC (95% CI) | FPG AUC (95% CI) | TyG AUC (95% CI) | P value † | P value ‡ | |
|---|---|---|---|---|---|
| Preeclampsia | 0.630 (0.589–0.671) | 0.632 (0.591–0.672) | 0.655 (0.615–0.694) | <0.001 | 0.349 |
| Severe preeclampsia | 0.661 (0.594–0.728) | 0.676 (0.611–0.742) | 0.695 (0.629–0.761) | 0.001 | 0.590 |
| Preterm birth | 0.575 (0.546–0.605) | 0.566 (0.535–0.598) | 0.592 (0.562–0.622) | <0.001 | 0.126 |
| Placenta accreta spectrum | 0.573 (0.532–0.613) | 0.542 (0.501–0.583) | 0.581 (0.540–0.621) | 0.146 | 0.109 |
| Macrosomia | 0.583 (0.562–0.605) | 0.576 (0.554–0.597) | 0.599 (0.577–0.620) | <0.001 | 0.068 |
The bold P value indicates statistical significance.
The P value indicates differences of AUC between TG and TyG.
The P value indicates differences of AUC between FPG and TyG.
AUC, area under the curve; GDM, gestational diabetes mellitus; TyG index, triglyceride‐glucose index.
Figure 3.
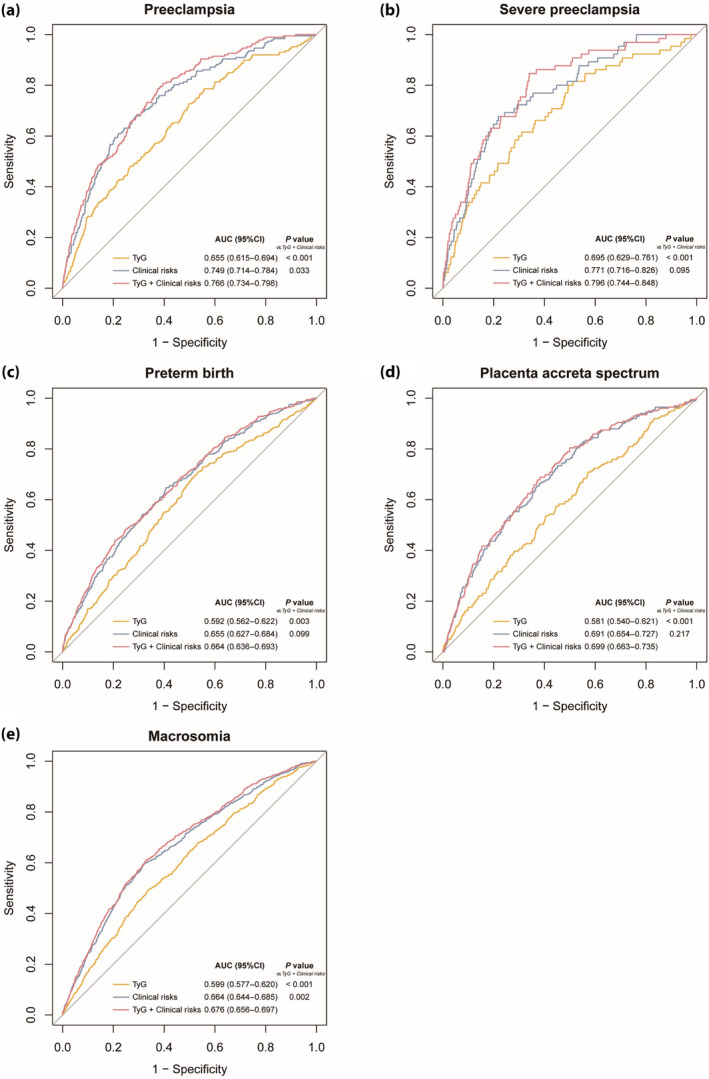
Receiver operating characteristic curves of the TyG index to predict GDM‐related adverse maternal and neonatal outcomes. (a) preeclampsia, (b) severe preeclampsia, (c) preterm birth, (d) placenta accreta spectrum, (e) macrosomia. Clinical risk variables included age, pre‐pregnancy BMI, parity, OGTT‐FPG, OGTT‐1h, OGTT‐2h, HbA1c and TC. BMI, body mass index; GDM, gestational diabetes mellitus; HbA1c, glycated hemoglobin; OGTT, oral glucose tolerance test; TC, total cholesterol; TyG index, triglyceride‐glucose index.
The Hosmer‐Lemeshow test was employed to calibrate the predictive models for adverse pregnancy outcomes. The results indicated that all models were well calibrated (all P > 0.05; Table S3).
Subgroup analysis
To better explore the associations between the TyG index and the prevalence of the five main adverse outcomes, we performed subgroup analysis stratified by age, parity, and pre‐pregnancy BMI (Figure S1, Table S4). The associations of the continuous TyG index and its quartiles with the risk of PE, severe PE, preterm birth, PAS, and macrosomia were consistent across subgroups. No interaction was found between the subgroup variables (age, parity, and pre‐pregnancy BMI) and the association of the TyG index with the risk of the five adverse outcomes after adjusting for confounders in Model 3 (P for interaction >0.05), except for a more prominent association between women with BMI < 24 kg/m2 and the prevalence of PE (P for interaction = 0.033).
Sensitivity analysis
The associations between the TyG index and the five main adverse pregnancy outcomes were not attenuated after excluding women using insulin therapy (Tables S5 and S6). The TyG index showed higher predictive power than TG and FPG for the outcomes, especially for PE, severe PE, preterm birth, and macrosomia (Table S7). The model combining the TyG index and the clinical risk variables showed a significantly higher predictive power (AUC, 0.673; 95% CI, 0.652–0.694) than that using only the clinical variables (AUC, 0.661; 95% CI, 0.640–0.683; P = 0.002) for predicting macrosomia. The AUCs of the combined model were larger than those of the TyG index alone for PE, severe PE, preterm birth, and macrosomia (all P < 0.001; Table S7). The Hosmer‐Lemeshow test showed that the TyG index + clinical risks models were correctly specified (Table S3), suggesting the associations and predictive abilities were not influenced by potentially unmeasured confounding factors in this study.
External validation cohort analysis
The participants in the validation cohort showed a similar association between the adverse outcomes and the TyG index (Table S8). The TyG index also exhibited better predictive performance than TG and FPG (Table S9). The AUCs using the combined TyG index and clinical risk factors model were 0.753 (95% CI, 0.695–0.811; P = 0.026) for predicting PE and 0.772 (95% CI, 0.729–0.816; P < 0.001) for predicting macrosomia, showing a significantly higher predictive power than the baseline clinical risk model (Table S9). The Hosmer‐Lemeshow test showed that the predicted probabilities were consistent in the validation set (Table S3).
DISCUSSION
In the present study, we examined the association between the TyG index and the risk of adverse maternal and neonatal outcomes in women with gestational diabetes mellitus. The TyG index was significantly and linearly linked with the risks of PE, severe PE, preterm birth, PAS, and macrosomia, and these associations persisted even after adjusting for established covariant risk factors. ROC analysis and the Hosmer‐Lemeshow test showed that the TyG index can better predict these adverse outcomes when incorporated into the baseline clinical risk models, especially for PE and macrosomia. Sensitivity analysis and a validation cohort further validated the predictive efficiency. These findings suggest that TyG index assessment is a simple method to predict and evaluate adverse outcomes in women with gestational diabetes mellitus.
The prevalence of obesity worldwide has reached epidemic levels, leading to a rise in the diagnosis of gestational diabetes mellitus, which places these patients at an elevated risk for various pregnancy complications 19 . Previous research has confirmed a higher incidence of PE, induction of labor, preterm delivery, low 1‐min Apgar score, and macrosomia in women with GDM compared with those without 2 , 20 . Insulin resistance, characterized by decreased sensitivity and impaired insulin response, has been identified as a key factor in the development of gestational diabetes mellitus and metabolic syndrome 21 . It has also been reported that insulin resistance contributes to endothelial damage, placenta dysfunction, oxidative stress, and inflammation, leading to adverse outcomes such as PE, preterm delivery, PAS, and others 22 , 23 , 24 , 25 , 26 . Additionally, TGs and lipid biomarkers have been suggested as independent risk factors for GDM and associated adverse outcomes (macrosomia, offspring adiposity, and post‐pregnancy endothelial dysfunction) in addition to the traditional risk factors 27 , 28 , 29 , 30 . The TyG index, calculated using TG and FPG, is a cost‐effective and easily accessible tool to identify insulin resistance in women with and without gestational diabetes mellitus, shown to outperform the homeostasis model assessment of insulin resistance (HOMA‐IR) index 31 .
The independent association of the TyG index with gestational diabetes mellitus and other complications has been well described 12 , 13 , 14 , 15 , 16 , 32 , 33 . However, limited research is available on the association between the TyG index and adverse pregnancy outcomes among women with gestational diabetes mellitus. One study in China revealed a link between the maternal TyG index and the likelihood of having large‐for‐gestational‐age infants 34 . A historical cohort study identified a positive independent correlation between the TyG index and PE, preterm birth, and macrosomia in non‐GDM women 35 . Moreover, findings from a prospective cohort study indicated that the TyG index was associated with an increased risk of gestational hypertension in the general population 32 . In the present study, we demonstrated that the TyG index, either as a continuous or categorical variable, was independently associated with an elevated risk of developing adverse outcomes in women with GDM, including PE, severe PE, preterm birth, PAS, and macrosomia, independent of the conventional risk factors in this population. Subgroup analysis revealed that this association remained consistent across age groups, parity, and pre‐pregnancy BMI categories, except for a higher PE prevalence among women with a pre‐pregnancy BMI < 24 kg/m2. This finding contrasts a previous study that reported a higher prevalence in women with high pre‐pregnancy BMI than with low BMI 36 . However, this inconsistency could be attributed to differences in study populations, as our study specifically included women with gestational diabetes mellitus while excluding those with chronic hypertension, who were more likely to have high pre‐pregnancy BMI.
Insulin use in relation to the TyG index remains uncertain. A Korean study found the TyG index had enhanced predictive power in women with GDM under insulin treatment 13 . However, our sensitivity analysis showed that excluding patients treated with insulin did not substantively alter the association between the TyG index and the likelihood for the five adverse outcomes to occur.
Gestational diabetes mellitus is not a benign condition 37 . Most women (73.7%) in our GDM dataset experienced one or more complications. These are of great concern, particularly given the increased lifetime risk of metabolic disorders and cardiovascular events 38 . Therefore, it is crucial to identify early unfavorable pregnancy outcomes in women with GDM. The present study evaluated the ability of the TyG index to predict these adverse outcomes, finding that it performed moderately well. Moreover, incorporating the TyG index into the existing clinical risk model conferred incremental benefits in predicting PE and macrosomia, with favorable respective AUCs in the training (0.766 and 0.676) and validation (0.753 and 0.772) sets. These results suggest that the TyG index can potentially identify high‐risk individuals likely to develop PE or macrosomia during pregnancy, providing additional information for clinical decision‐making.
Preeclampsia, preterm birth, PAS, and macrosomia are common and serious complications in women with gestational diabetes mellitus. However, effective preventative measures remain to be fully identified. The TyG index offers a novel and simple approach to addressing these issues. To our knowledge, this was the first study to comprehensively report on the independent association between the TyG index and the likelihood of experiencing adverse pregnancy outcomes in a GDM population. Our research is notable for its large sample, multicenter design, and meticulous documentation of obstetric complications by the researchers.
Several limitations should be acknowledged. First, the causal association between the TyG index and adverse outcomes is difficult to establish due to the observational nature of the study. Second, we failed to collect data on certain potential confounders, including family history of hypertension and diabetes, dietary habits, and lifestyle factors. Nevertheless, the absence of these factors is unlikely to substantially alter our results since we have already adjusted the models for essential confounders as much as possible. Third, pre‐pregnancy and early pregnancy TyG index data could not be collected because pregnant women did their first‐trimester medical examinations in community healthcare centers rather than in research hospitals, which limited the comprehensiveness of our analysis. Fourth, extra caution is needed when generalizing our findings to other populations, as our study only included women from eastern China. We encourage similar investigations in other countries and regions. Despite these limitations, the study has a significant clinical implication as it was the first to assess the association between adverse outcomes in women with gestational diabetes mellitus and the TyG index.
In conclusion, this study presented a comprehensive assessment of the second‐trimester TyG index to predict various adverse obstetric and neonatal outcomes in women with GDM. The TyG index was strongly and positively associated with the risk of PE, severe PE, preterm birth, PAS, and macrosomia, regardless of other risk covariates. The predictive value of the TyG index for PE, severe PE, preterm birth, PAS, and macrosomia was moderate. Incorporating the TyG index into the conventional clinical risk model improved its predictive accuracy. The TyG index could help in risk stratification and the prediction of complications in women with GDM, enabling early identification of high‐risk women and promoting treatment strategies. Future work should investigate the impact of the pre‐pregnancy and first‐trimester TyG index in women with GDM on adverse pregnancy outcomes and explore their causal relationships, concrete mechanisms, and possible public health interventions.
DISCLOSURE
The authors declare no conflict of interest.
Approval of the research protocol: The study was approved by the Medical Ethics Committee of Nanjing Women and Children's Healthcare Hospital (approval number 2022KY‐165‐01), and it conforms to the provisions of the Declaration of Helsinki (as revised in Fortaleza, Brazil, October 2013).
Informed consent: Due to the retrospective nature of this study, informed consent was waived.
Registry and the registration no. of the study/trial: N/A.
Animal studies: N/A.
Supporting information
Figure S1. Subgroup analysis for the association of the continuous TyG index with GDM‐related maternal and neonatal outcomes.
Table S1. Characteristics of participants according to quartiles of the TyG index in external validation set.
Table S2. Maternal and neonatal outcomes according to quartiles of the TyG index in GDM population.
Table S3. Hosmer‐Lemeshow test for training cohort, sensitivity analysis dataset, and validation cohort.
Table S4. Subgroup analysis for the association of the TyG index quartiles with GDM‐related maternal and neonatal outcomes.
Table S5. Characteristics of participants according to quartiles of the TyG index in sensitivity analysis dataset.
Table S6. Associations of the TyG index with maternal and neonatal outcomes in sensitivity analysis dataset.
Table S7. Receiver operating characteristic curve analysis of TyG index for detecting GDM‐related maternal and neonatal outcomes in sensitivity analysis dataset.
Table S8. Associations of the TyG index with maternal and neonatal outcomes in GDM population in the external validation cohort.
Table S9. Receiver operating characteristic curve analysis of TyG index for detecting GDM‐related maternal and neonatal outcomes in the external validation cohort.
ACKNOWLEDGMENTS
This work was supported by the National Key R&D Program of China (grant number 2022YFC2703500); the National Natural Science Foundation of China (grant numbers 82371697, 81971410); the Key Project of Changzhou Medical Center of Nanjing Medical University (grant number CMCM202312); the Clinical Research Project of Changzhou Medical Center of Nanjing Medical University (grant number CMCC202205); the Cohort of State Key Laboratory of Reproductive Medicine (grant number NMUC2021016A); and the Open Project of Jiangsu Biobank of Clinical Resources (grant number TC2021B024).
REFERENCES
- 1. Wang H, Li N, Chivese T, et al. IDF Diabetes Atlas: Estimation of global and regional gestational diabetes mellitus prevalence for 2021 by International Association of Diabetes in Pregnancy Study Group's Criteria. Diabetes Res Clin Pract 2022; 183: 109050. [DOI] [PubMed] [Google Scholar]
- 2. Ye W, Luo C, Huang J, et al. Gestational diabetes mellitus and adverse pregnancy outcomes: Systematic review and meta‐analysis. BMJ 2022; 377: e067946. [DOI] [PMC free article] [PubMed] [Google Scholar]
- 3. Jiang L, Tang K, Magee LA, et al. A global view of hypertensive disorders and diabetes mellitus during pregnancy. Nat Rev Endocrinol 2022; 18: 760–775. [DOI] [PMC free article] [PubMed] [Google Scholar]
- 4. Retnakaran R, Ye C, Hanley AJ, et al. Treatment of gestational diabetes mellitus and maternal risk of diabetes after pregnancy. Diabetes Care 2023; 46: 587–592. [DOI] [PubMed] [Google Scholar]
- 5. Moon JH, Jang HC. Gestational diabetes mellitus: Diagnostic approaches and maternal‐offspring complications. Diabetes Metab J 2022; 46: 3–14. [DOI] [PMC free article] [PubMed] [Google Scholar]
- 6. Singh S, Karagas MR, Mueller NT. Charting the maternal and infant microbiome: What is the role of diabetes and obesity in pregnancy? Curr Diab Rep 2017; 17: 11. [DOI] [PMC free article] [PubMed] [Google Scholar]
- 7. Park B, Lee HS, Lee YJ. Triglyceride glucose (TyG) index as a predictor of incident type 2 diabetes among nonobese adults: A 12‐year longitudinal study of the Korean Genome and Epidemiology Study cohort. Transl Res 2021; 228: 42–51. [DOI] [PubMed] [Google Scholar]
- 8. Simental‐Mendia LE, Rodriguez‐Moran M, Guerrero‐Romero F. The product of fasting glucose and triglycerides as surrogate for identifying insulin resistance in apparently healthy subjects. Metab Syndr Relat Disord 2008; 6: 299–304. [DOI] [PubMed] [Google Scholar]
- 9. Brito ADM, Hermsdorff HHM, Filgueiras MS, et al. Predictive capacity of triglyceride‐glucose (TyG) index for insulin resistance and cardiometabolic risk in children and adolescents: A systematic review. Crit Rev Food Sci Nutr 2021; 61: 2783–2792. [DOI] [PubMed] [Google Scholar]
- 10. Lee MJ, Bae JH, Khang AR, et al. Triglyceride‐glucose index predicts type 2 diabetes mellitus more effectively than oral glucose tolerance test‐derived insulin sensitivity and secretion markers. Diabetes Res Clin Pract 2024; 210: 111640. [DOI] [PubMed] [Google Scholar]
- 11. Zhang Z, Zhou Z, Li H. The role of lipid dysregulation in gestational diabetes mellitus: Early prediction and postpartum prognosis. J Diabetes Investig 2024; 15: 15–25. [DOI] [PMC free article] [PubMed] [Google Scholar]
- 12. Liu Y, Chi R, Jiang Y, et al. Triglyceride glycemic index as a biomarker for gestational diabetes mellitus: A systemic review and meta‐analysis. Endocr Connect 2021; 10: 1420–1427. [DOI] [PMC free article] [PubMed] [Google Scholar]
- 13. Kim JA, Kim J, Roh E, et al. Triglyceride and glucose index and the risk of gestational diabetes mellitus: A nationwide population‐based cohort study. Diabetes Res Clin Pract 2021; 171: 108533. [DOI] [PubMed] [Google Scholar]
- 14. Zeng Y, Yin L, Yin X, et al. Association of triglyceride‐glucose index levels with gestational diabetes mellitus in the US pregnant women: A cross‐sectional study. Front Endocrinol 2023; 14: 1241372. [DOI] [PMC free article] [PubMed] [Google Scholar]
- 15. Li H, Miao C, Liu W, et al. First‐trimester triglyceride‐glucose index and risk of pregnancy‐related complications: A prospective birth cohort study in Southeast China. Diabetes Metab Syndr Obes 2022; 15: 3705–3715. [DOI] [PMC free article] [PubMed] [Google Scholar]
- 16. Sanchez‐Garcia A, Rodriguez‐Gutierrez R, Saldivar‐Rodriguez D, et al. Diagnostic accuracy of the triglyceride‐glucose index for gestational diabetes screening: A practical approach. Gynecol Endocrinol 2020; 36: 1112–1115. [DOI] [PubMed] [Google Scholar]
- 17. International Association of Diabetes and Pregnancy Study Groups Consensus Panel , Metzger BE, Gabbe SG, et al. International association of diabetes and pregnancy study groups recommendations on the diagnosis and classification of hyperglycemia in pregnancy. Diabetes Care 2010; 33: 676–682. [DOI] [PMC free article] [PubMed] [Google Scholar]
- 18. Apgar V. A proposal for a new method of evaluation of the newborn infant. Curr Res Anesth Analg 1953; 32: 260–267. [PubMed] [Google Scholar]
- 19. McIntyre HD, Catalano P, Zhang C, et al. Gestational diabetes mellitus. Nat Rev Dis Primers 2019; 5: 47. [DOI] [PubMed] [Google Scholar]
- 20. McNestry C, Killeen SL, Crowley RK, et al. Pregnancy complications and later life women's health. Acta Obstet Gynecol Scand 2023; 102: 523–531. [DOI] [PMC free article] [PubMed] [Google Scholar]
- 21. Defronzo RA. Banting lecture. From the triumvirate to the ominous octet: A new paradigm for the treatment of type 2 diabetes. Diabetes 2009; 58: 773–795. [DOI] [PMC free article] [PubMed] [Google Scholar]
- 22. Hauth JC, Clifton RG, Roberts JM, et al. Maternal insulin resistance and preeclampsia. Am J Obstet Gynecol 2011; 204: 327.e1–327.e6. [DOI] [PMC free article] [PubMed] [Google Scholar]
- 23. Pan Y, Zou S, Xu Y, et al. Is there any association between early trimester triglyceride‐glucose index and incidence of hypertensive disorder of pregnancy and adverse pregnancy outcomes? Front Endocrinol 2023; 14: 1093991. [DOI] [PMC free article] [PubMed] [Google Scholar]
- 24. Lane‐Cordova AD, Khan SS, Grobman WA, et al. Long‐term cardiovascular risks associated with adverse pregnancy outcomes: JACC review topic of the week. J Am Coll Cardiol 2019; 73: 2106–2116. [DOI] [PubMed] [Google Scholar]
- 25. Afshar Y, Yin O, Jeong A, et al. Placenta accreta spectrum disorder at single‐cell resolution: A loss of boundary limits in the decidua and endothelium. Am J Obstet Gynecol 2024; 230: 443.e1–443.e18. [DOI] [PubMed] [Google Scholar]
- 26. Shainker SA, Silver RM, Modest AM, et al. Placenta accreta spectrum: Biomarker discovery using plasma proteomics. Am J Obstet Gynecol 2020; 223: 433.e1–433.e14. [DOI] [PubMed] [Google Scholar]
- 27. Furse S, Koulman A, Ozanne SE, et al. Altered lipid metabolism in obese women with gestational diabetes and associations with offspring adiposity. J Clin Endocrinol Metab 2022; 107: e2825–e2832. [DOI] [PMC free article] [PubMed] [Google Scholar]
- 28. Sokup A, Goralczyk B, Goralczyk K, et al. Triglycerides as an early pathophysiological marker of endothelial dysfunction in nondiabetic women with a previous history of gestational diabetes. Acta Obstet Gynecol Scand 2012; 91: 182–188. [DOI] [PubMed] [Google Scholar]
- 29. Song X, Chen L, Zhang S, et al. Gestational diabetes mellitus and high triglyceride levels mediate the association between pre‐pregnancy overweight/obesity and macrosomia: A prospective cohort study in Central China. Nutrients 2022; 14: 3347. [DOI] [PMC free article] [PubMed] [Google Scholar]
- 30. Hou G, Gao Y, Poon LC, et al. Maternal plasma diacylglycerols and triacylglycerols in the prediction of gestational diabetes mellitus. BJOG 2023; 130: 247–256. [DOI] [PubMed] [Google Scholar]
- 31. Ma N, Bai L, Lu Q. First‐trimester triglyceride‐glucose index and triglyceride/high‐density lipoprotein cholesterol are predictors of gestational diabetes mellitus among the four surrogate biomarkers of insulin resistance. Diabetes Metab Syndr Obes 2024; 17: 1575–1583. [DOI] [PMC free article] [PubMed] [Google Scholar]
- 32. Guo Y, Lu J, Bahani M, et al. Triglyceride‐glucose index in early pregnancy predicts the risk of gestational diabetes: A prospective cohort study. Lipids Health Dis 2024; 23: 87. [DOI] [PMC free article] [PubMed] [Google Scholar]
- 33. Mo Z, Cao C, Han Y, et al. Relationships between triglyceride‐glucose index and incident gestational diabetes mellitus: A prospective cohort study of a Korean population using publicly available data. Front Public Health 2024; 12: 1294588. [DOI] [PMC free article] [PubMed] [Google Scholar]
- 34. Liu PJ, Liu Y, Ma L, et al. The predictive ability of two triglyceride‐associated indices for gestational diabetes mellitus and large for gestational age infant among Chinese pregnancies: A preliminary cohort study. Diabetes Metab Syndr Obes 2020; 13: 2025–2035. [DOI] [PMC free article] [PubMed] [Google Scholar]
- 35. Zhang J, Yin B, Xi Y, et al. Triglyceride‐glucose index: A promising biomarker for predicting risks of adverse pregnancy outcomes in Hangzhou, China. Prev Med Rep 2024; 41: 102683. [DOI] [PMC free article] [PubMed] [Google Scholar]
- 36. Santos S, Voerman E, Amiano P, et al. Impact of maternal body mass index and gestational weight gain on pregnancy complications: An individual participant data meta‐analysis of European, North American and Australian cohorts. BJOG 2019; 126: 984–995. [DOI] [PMC free article] [PubMed] [Google Scholar]
- 37. Ornoy A, Becker M, Weinstein‐Fudim L, et al. Diabetes during pregnancy: A maternal disease complicating the course of pregnancy with long‐term deleterious effects on the offspring. A clinical review. Int J Mol Sci 2021; 22: 2965. [DOI] [PMC free article] [PubMed] [Google Scholar]
- 38. Plows JF, Stanley JL, Baker PN, et al. The pathophysiology of gestational diabetes mellitus. Int J Mol Sci 2018; 19: 3342. [DOI] [PMC free article] [PubMed] [Google Scholar]
Associated Data
This section collects any data citations, data availability statements, or supplementary materials included in this article.
Supplementary Materials
Figure S1. Subgroup analysis for the association of the continuous TyG index with GDM‐related maternal and neonatal outcomes.
Table S1. Characteristics of participants according to quartiles of the TyG index in external validation set.
Table S2. Maternal and neonatal outcomes according to quartiles of the TyG index in GDM population.
Table S3. Hosmer‐Lemeshow test for training cohort, sensitivity analysis dataset, and validation cohort.
Table S4. Subgroup analysis for the association of the TyG index quartiles with GDM‐related maternal and neonatal outcomes.
Table S5. Characteristics of participants according to quartiles of the TyG index in sensitivity analysis dataset.
Table S6. Associations of the TyG index with maternal and neonatal outcomes in sensitivity analysis dataset.
Table S7. Receiver operating characteristic curve analysis of TyG index for detecting GDM‐related maternal and neonatal outcomes in sensitivity analysis dataset.
Table S8. Associations of the TyG index with maternal and neonatal outcomes in GDM population in the external validation cohort.
Table S9. Receiver operating characteristic curve analysis of TyG index for detecting GDM‐related maternal and neonatal outcomes in the external validation cohort.