Abstract
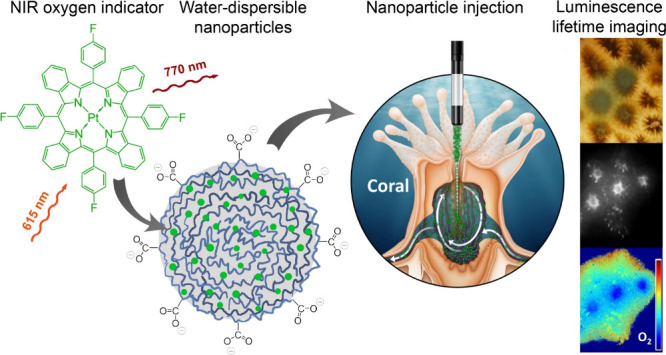
Mapping of O2 with luminescent sensors within intact animals is challenging due to attenuation of excitation and emission light caused by tissue absorption and scattering as well as interfering background fluorescence. Here we show the application of luminescent O2 sensor nanoparticles (∼50–70 nm) composed of the O2 indicator platinum(II) tetra(4-fluoro)phenyltetrabenzoporphyrin (PtTPTBPF) immobilized in poly(methyl methacrylate-co-methacrylic acid) (PMMA-MA). We injected the sensor nanoparticles into the gastrovascular system of intact colony fractions of reef-building tropical corals that harbor photosynthetic microalgae in their tissues. The sensor nanoparticles are excited by red LED light (617 nm) and emit in the near-infrared (780 nm), which enhances the transmission of excitation and emission light through biological materials. This enabled us to map the internal O2 concentration via time-domain luminescence lifetime imaging through the outer tissue layers across several coral polyps in flowing seawater. After injection, nanoparticles dispersed within the coral tissue for several hours. While luminescence intensity imaging showed some local aggregation of sensor particles, lifetime imaging showed a more homogeneous O2 distribution across a larger area of the coral colony. Local stimulation of symbiont photosynthesis in corals induced oxygenation of illuminated tissue areas and formation of lateral O2 gradients toward surrounding respiring tissues, which were dissipated rapidly after the onset of darkness. Such measurements are key to improving our understanding of how corals regulate their internal chemical microenvironment and metabolic activity, and how they are affected by environmental stress such as ocean warming, acidification, and deoxygenation. Our experimental approach can also be adapted for in vivo O2 imaging in other natural systems such as biofilms, plant and animal tissues, as well as in organoids and other cell constructs, where imaging internal O2 conditions are relevant and challenging due to high optical density and background fluorescence.
Keywords: optode, imaging, symbiosis, animal, photosynthesis, respiration
Measuring O2 concentration is a key component in many environmental, physiological, or ecological studies, as it is (i) consumed in aerobic respiration, (ii) produced in oxygenic photosynthesis, and (iii) used for reoxidation of reduced products from anaerobic processes. It thus plays an essential role for important physiological and biogeochemical processes in the biosphere.1,2 The solubility of O2 in water is relatively low, i.e., 1 L of air contains ca. 30 times more O2 than a liter of air-saturated water. At the same time, the O2 transport by diffusion is much slower in water, i.e., the O2 diffusion coefficient is about 5000–10000 times higher in air than in water, dependent on the actual temperature.3 Consequently, aquatic habitats and organisms can undergo strong shifts in their O2 regime ranging from supersaturated (hyperoxic) conditions over normal air saturated conditions (normoxia) to critical low concentrations (hypoxia) or even anoxia depending on the balance between O2 formation (via photosynthesis), consumption (via respiration), and transport via diffusion and advection. Excess loading of organic carbon in coastal waters can, e.g., lead to strong O2 depletion via microbial biomass breakdown, causing mortality of marine animals and formation of benthic or planktonic “death” zones, where O2 is deprived. Currently, climate change is driving an ongoing ocean deoxygenation,4 which already has led to increasing prevalence of hypoxia and its harmful effects in many marine habitats.5
Albeit overlooked for many years, ocean deoxygenation is now also recognized as a substantial threat to coral reefs,6,7 but how corals are able to regulate their internal O2 levels in response to changes in external O2 remains poorly understood.8 A key limitation is our ability to link the O2 concentration in the surrounding water to the tissue-level O2 concentration, which is affected by coral morphology and metabolism but also O2 transfer across the tissue–water and tissue–skeleton interfaces.
Colonies of tropical reef-building corals are composed of hundreds to thousands of simple, calcifying polyp animals that harbor photosynthetic microalgae in their tissues, and the photosynthates translocated from the microalgal symbionts to the surrounding host cells are the major source of organic carbon for the animal. The polyps have tentacles with stinging cells that can catch prey, which is taken up via the mouth and digested in the gastric cavity, releasing essential nutrients, which can be shared between different polyps in a coral colony via channels in their connective tissue (Figure 1). Corals can thus exhibit strong tissue plasticity via expansion and contraction, which affects the surface area to volume ratio and thus the gas exchange between coral tissue and the surrounding seawater.9
Figure 1.
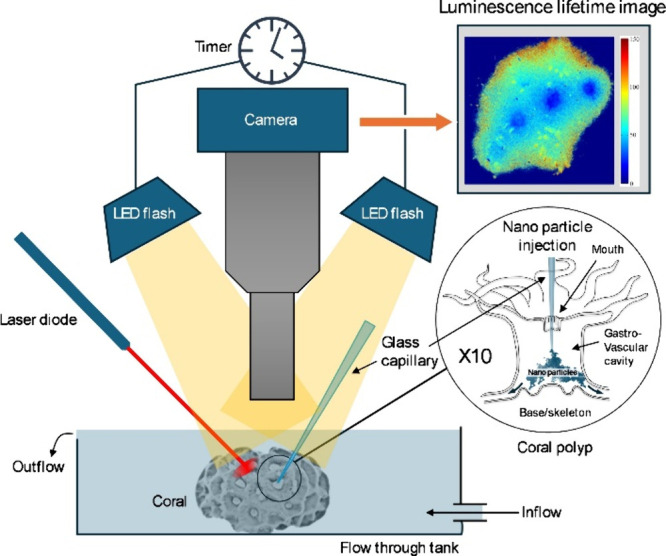
Schematic drawing of the setup used for injecting O2 sensor nanoparticles into the gastrovascular cavity of coral polyps and subsequent mapping of the internal O2 concentration with a luminescence lifetime system. The inset shows a coral polyp, where a glass microcapillary is introduced through the coral mouth into the gastrovascular cavity for injection of sensor nanoparticles that can then distribute to neighboring polyps via channels in the connective tissue (see also SVideo 1). A laser pointer was used to locally stimulate photosynthetic O2 production.
Point measurements with electrochemical and fiber-optic microsensors10,11 showed that the O2 status of corals undergoes strong dynamics during day–night cycles, where supersaturating O2 levels build up during daytime due to the photosynthesis by their microalgal symbionts, while hypoxic (or even anoxic) conditions are observed during nighttime due to respiration and limited O2 transfer from the surrounding seawater. However, such point measurements in tissue can be invasive and are not representative of the complex 3D morphology and compartmentalization of corals,12 which also includes intricate cilia-driven external and internal flow patterns at the tissue surface and in the gastric cavity of corals.13,14 Chemical imaging with optical sensor particles (e.g., refs (15, 16)) offer an interesting alternative to such measurements.
While O2-sensitive sensor particles have previously been applied for mapping the O2 concentration and dynamics over the external tissue surface of corals12,17,18 and aquatic plants,19 the mapping of internal O2 concentration in living coral tissue and gastric cavities has so far not been realized. External application of sensor particles has the following complications in corals: (i) the response to changes in O2 can be rather slow particularly for larger particles >5–10 μm); (ii) mucus production can bind and slowly remove the particles from the coral surface and may also influence the measurements; and (iii) O2 mapping inside the tissues is not possible as the mucus and epidermal tissue acts as a barrier.
Oxygen nanosensors represent analytical tools that can help to overcome the above limitations.20,21 Sensor nanoparticles can be injected directly into the tissue, and due to their small size, the sensor particles respond virtually instantaneously to changing the O2 concentration. However, because of strong light scattering and absorption in tissues, luminescent sensors relying on UV-blue excitation and emission in the visible spectral range are poorly suitable for mapping O2 inside tissues. As an alternative, optical indicators emitting in the NIR are promising materials for imaging O2 in tissues.22 Such sensor materials are often based on dendrimers containing a phosphorescent benzoporphyrin complex as a core.23−25 Alternatively, polymeric nanoparticles can be doped with a lipophilic O2 indicator.26 Similarly to the shell of a dendrimer, the polymeric material protects the indicator from undesired interferences (e.g., quenchers, ionic species, etc.) and controls the O2 permeability. This approach was preferred in the current work because of high flexibility in tuning the sensitivity of the probe and its spectral properties and the simplicity of the preparation methods.27 Furthermore, the indicator material is commercially available from several providers. Here we describe optical O2 sensor particles that are suitable for internal, subsurface O2 measurements in coral tissue and show their application in combination with luminescence lifetime imaging for studying the spatiotemporal dynamics of O2 concentration within the tissues of two reef-building coral species. An early draft of this article is available as a preprint.28
Experimental Section
Reagents and Chemicals
The luminescent oxygen indicator platinum(II)-tetra(4-fluoro)phenyltetrabenzoporphyrin (PtTPTBPF) was prepared according to the previously published procedure.29 Poly(methyl methacrylate-co-methacrylic acid) (PMMA-MA; 10% methacrylic acid, MW ∼ 100,000) was from Polysciences, Warrington, USA. The organic solvents were from Roth (Germany).
Preparation of Nanoparticles
Oxygen-sensitive nanoparticles were prepared according to a previously published procedure.27 Briefly, 3 mg of PtTPTTBPF and 200 mg of PMMA-MA were dissolved in 40 mL of tetrahydrofuran, and the solution was diluted to 100 mL with acetone. Then, 700 mL of water was added within 2–3 s under vigorous stirring. The organic solvents and most of the water were removed under reduced pressure. The aqueous dispersion was concentrated to contain about 20 mg particles mL–1.
The size and surface charge (Zeta-potential) of the sensor particles were measured via dynamic light scattering (DLS) on a particle size analyzer (Zetasizer Nano ZS; Malvern, UK). In a recent publication with similar sensor materials but with a reference dye added for ratiometric imaging,30 a good correlation was found between TEM and DLS data, and we therefore did not perform TEM measurements in the present study. Photostability was investigated by irradiating an air-saturated aqueous dispersion of the sensor nanoparticles (∼0.5 mg mL–1) with intense light from a metal halide lamp (400–700 nm range; photon irradiance of ∼7000 μmol photons·m–2·s–1) ensuring efficient excitation of PtTPTBPF both in the Soret and the Q-bands.
Imaging Setup
The imaging of O2 concentration was done with a modular luminescence lifetime imaging system,31,32 which encompasses a fast gate-able CCD camera (1280 × 1028 pixels; SensiCam-SensiMod, PCO/Excelitas, Kehlheim, Germany), 2 high power LED excitation light sources (617 nm; Roitner LaserTechnik GmbH, Vienna, Austria) to provide homogeneous excitation of the sample, and a custom built trigger unit to synchronize excitation light exposure and image acquisition over defined time intervals. The camera was equipped with a macro lens (1.4/17 CCTV, Xenoplan, Schneider-Kreuznach, Germany) equipped with distance rings (5 mm + 0.5 mm + 1 mm) for higher magnification. With the chosen objective, the achieved field of view was about 2.5 cm × 2 cm, yielding a resolution of 20 μm per pixel. A 720 nm long-pass filter (R-720; Edmund Optics, Barrington, USA) in combination with a plastic filter (“bright red”; Lee Filters, UK) was mounted in front of the lens. Given sufficient luminescence signal, the imaging system can acquire O2 images with a time resolution of ∼0.04–0.4 s.31
The pulse width of the LED was 40 μs, after which the intensity was measured in two time windows, after which the cycle was repeated over and over again within a chosen integration time. Depending on the timing scheme and number of repetitions, i.e., the chosen integration time, acquisition of a lifetime image set thus took ∼40–400 ms. The integration times were chosen in order to obtain the best signal-to-noise ratio and at the same time to avoid overexposed areas in the images.
The rapid lifetime determination method was used to calculate the luminescence decay time, τ, by measuring luminescence intensities in two windows (1–41 μs and 26–66 μs after a 40 μs excitation pulse, respectively). Autofluorescence (e.g., from chlorophyll in the algal symbionts or fluorescent host pigments in the coral) shows very short decay times of <10 ns and a 1 μs delay is sufficient to eliminate background signals from autofluorescence and scattering.31 Another potential artifact could be caused by a slow LED decay after a light pulse, but we did not see any apparent luminescence without the nanoparticles indicating that any LED afterglow was absent with the chosen 1 μs delay. The decay time, i.e., the luminescence lifetime, was calculated as31
| 1 |
where t1 and t2 are the times corresponding to the start of the first and the second window, respectively (1 and 26 μs in our setup) and I1 and I2 are the recorded luminescence intensities within the respective time windows.
Calibration of the O2-Sensitive Nanoparticles
A dispersion of the nanoparticles was placed inside a custom-made aluminum flow-through chamber equipped with a glass window. The cell was sparged with gas mixtures and the dispersion was stirred using a magnetic stirring bar for faster gas exchange. The gas mixtures were prepared from nitrogen (99.999% purity, Linde Gas, Austria) and compressed air using a gas mixing devices (Red-y, Aesch, Switzerland & Gasmixer, Sensor-Sense, Netherlands). The temperature of the cell and the gas mixtures was kept constant at 26 °C.
Sample Preparation and Experimental Setup
Symbiont bearing corals Goniastrea sp. and Pocillopora damicornis were sampled from the reef flat off Heron Island, Great Barrier Reef, Australia. After sampling, the corals were kept at the Heron Island Research Station in an outdoor aquarium continuously flushed with aerated seawater from the reef flat. Prior to the experiments, a coral specimen was transferred to a flow chamber flushed with aerated seawater (pH ∼ 8.1) at 26 °C and at a flow rate of approximately 3 cm s–1. The dispersion of the nanoparticles was injected through a tapered glass capillary into the mouth opening of a single coral polyp under stagnant conditions (Figure 1). The injection process was monitored under a dissection microscope (SM-6TZ-54S; Amscope, Irvine, USA) equipped with a CCD camera. To visualize the channel network connecting individual polyps in the coral colony, we also injected India ink using a similar procedure (see SVideo 1). The coral was left in the flow chamber for several hours prior to imaging experiments.
Stimulation of photosynthesis in the coral colony samples was performed by repeating excitation of the coral with light from the red LEDs used for image acquisition. Under constant LED illumination, the incident photon irradiance reached 1100–1200 μmol photons m–2 s–1, as measured with a mini scalar irradiance sensor (US-SQS/L; Walz GmbH, Effeltrich, Germany) connected to a light meter (ULM-500; Walz GmbH, Effeltrich, Germany). Under pulsed illumination via the camera system, the illumination time is roughly 1/5 of the total time, and the incident photon irradiance level was thus ∼220–240 μmol photons m–2 s–1. Local activation of symbiont photosynthesis in single coral polyps was performed with a red laser pointer (660 nm) for 1, 3, 6, and 10 min with a photon irradiance of 350 μmol photons m–2 s–1.
Data Processing
Image processing of the acquired images was done in Matlab 7.10 (Mathworks, USA) to obtain pseudocolor O2 concentration images based on the measured luminescence lifetime images and the calibration.
Results and Discussion
Oxygen-Sensitive Nanoparticles
To be suitable for subsurface imaging of O2 distribution in coral tissue, the O2 nanosensors should fulfill the following requirements: (i) be dispersible in water; (ii) be small enough to be distributed within the coral after injection; (iii) possess excitation and emission in the red and NIR part of the spectrum, respectively, to minimize the light loss in the tissue due to absorption and scattering; (iv) have good luminescence brightness enabling low to moderate excitation light levels to minimize actinic effects (e.g., stimulation of algal photosynthesis) during the measurements; and (v) possess a suitable dynamic range from anoxia to O2 concentrations significantly exceeding air saturation, i.e., mimicking the O2 dynamics experienced by corals in their tissue during day–night cycles.10
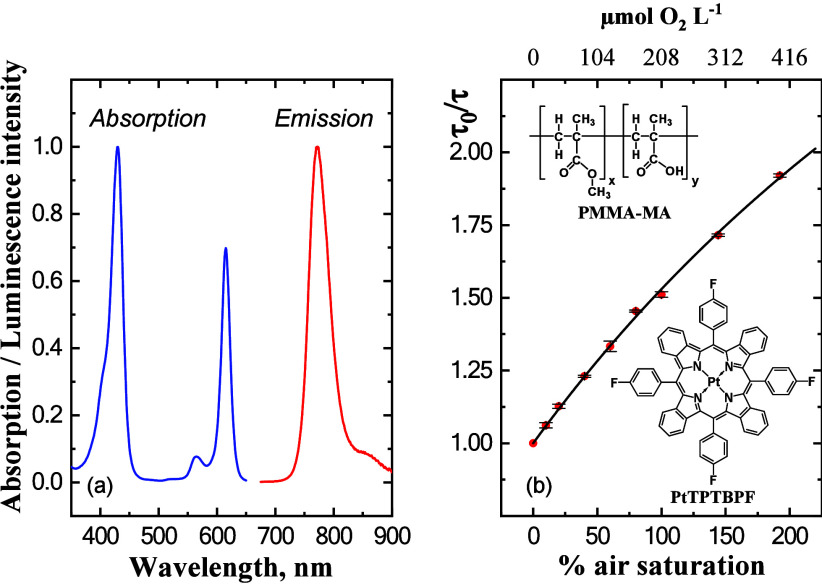
Based on the above requirements, we designed a new nanoparticle sensor material for O2 measurements in coral tissues (Figure 2). The nanoparticle sensors are composed of the O2-sensitive dye, platinum(II) tetra(4-fluorophenyl)tetrabenzoporphyrin (PtTPTBPF),28 incorporated into poly(methyl methacrylate-co-methacrylic acid) (PMMA-MA) nanoparticles via precipitation.27 The dye absorbs in the blue and red parts of the spectrum and shows phosphorescence in the NIR region (Figure 2a). These spectral properties make the sensor nanoparticles well suited for intra-tissue measurements. Moreover, the O2 indicator possesses very good luminescence brightness (i.e., the product of the molar absorption coefficient (ε) and the luminescence quantum yield (QY). Indeed, ε = 146,000 M–1·cm–1 for the Q-band (615 nm)27 and the QY is about 21%.33
Figure 2.
Spectral properties of the O2-sensitive dye, platinum(II) tetra(4-fluorophenyl)tetrabenzoporphyrin (PtTPTBPF), in toluene (a) and a Stern–Volmer plot of the luminescence lifetime, τ, for the O2-sensitive nanoparticles in seawater at 26 °C and a salinity of 35 as a function of the O2 concentration (b). The solid line in panel (b) represents a fit of eq 2 to the experimental values. The insets show the chemical structures of the O2 dye and the nanoparticle polymer components.
The charged groups, which are present in the copolymer (methacrylic acid), enabled us to prepare nanoparticles that dispersed well in water. This was achieved by using a simple precipitation method, where the O2 sensitive dye and the polymer are first dissolved in an organic solvent (tetrahydrofuran/acetone mixture) and are then precipitated by fast addition of water, with subsequent removal of the solvents and partly water under reduced pressure. The resulting nanoparticles are rather small (ZAV ∼ 65 nm, as determined by DLS measurements; SFigure 1) and negatively charged (Zeta potential of −25 mV; SFigure 2). Preliminary experiments with other nanoparticles, i.e., cationic Rl-100 beads,34 showed that they are unsuitable for measurements in seawater due to strong aggregation in the presence of high salt concentration. The PMMA-MA particles did not show any sign of aggregation after 3 months of storage at 4 °C (ZAV ∼ 62 nm, i.e., virtually identical to the size determined directly after preparation of the beads, SFigures 3 and 4). A recent study with similar sensor materials found that the particles can be stored for >1 year without significant alteration of their properties.30
Production of singlet oxygen during the quenching process may potentially cause fast photodegradation of the oxygen indicator inside the particle and/or the polymeric matrix. After 1 h of continuous irradiation, about 15% of the indicator degraded, as estimated from the absorption spectra (SFigure 5). This confirms the high photostability of the selected dye. On the other hand, the luminescent properties of the sensor were changed more significantly, and the decay times decreased by ∼20% under anoxic conditions and ∼15% at air saturation, while the luminescence intensity showed an almost 2-fold decrease. As the indicator itself appears to be rather robust toward degradation by singlet oxygen, we speculate that the polymeric matrix surrounding the indicator molecules may get oxidized, resulting in accumulation of functional groups responsible for quenching of luminescence. We note, however, that we used a very high irradiance in the photobleaching test, i.e., 3–5 times higher than maximal levels of solar irradiance experienced by corals in their habitat. In our experiments, actinic irradiance levels were much lower (220–350 vs 7000 μmol photons m–2 s–1) and light exposures were rather short.
The sensitivity of the O2-sensing material is mostly determined by (i) the luminescence decay time of the indicator (τ0 about 54 μs in the absence of O2 for PtTPTBPF), and (ii) the O2 permeability of the polymer matrix. In our sensor nanoparticles, the O2 permeability of PMMA-MA is lower than e.g. in commonly used polystyrene-based sensor nanoparticles or planar optodes.16 Consequently, the sensor particles exhibit a sufficiently strong change in luminescence at an O2 concentration exceeding air saturation. A Stern–Volmer plot of the quenching properties of the sensor particles (Figure 2b) shows that they are suitable for O2measurements from 0 to >200% air saturation. The nonlinear Stern–Volmer response was well described by the “two-site model”35 assuming localization of the indicator in two significantly different environments. Assuming the negligible quenchability of the indicator in the second site and extending the fit to the luminescence decay time (albeit without any physical meaning) the following equation can be used:
| 2 |
where f and KSV are the fraction of the total emission and the Stern–Volmer constant for the first site, respectively. Fitting eq 2 to our calibration data showed an excellent fit (r2 = 0.999) yielding values of f = 0.80 and KSV = 0.0075% air saturation–1.
While we did not measure the response time of the sensor nanoparticles, optical O2 sensors immobilized in thin polymer layers or sensor particles generally have response times of <10–100 ms.21 The response time of oxygen microoptodes, with a few μm thick sensing layer composed of matrices with similar O2 permeability as the sensor nanoparticles, are about 0.1 s.36 The dimensions of the nanoparticles are so much smaller that their response is much faster than that. Temperature will affect the response times of optical oxygen sensors due to faster diffusion at higher temperature, but for the very fast response in the case of nanoparticles, this is not really important. Their small size (∼65 nm) and large surface areas to volume ratio also prevents any impedance of their O2 response due to diffusive boundary layers around the particles. When injected in the coral tissue, the response of the sensor nanoparticles thus is more or less instantaneous and dependent on the local O2 conditions within the coral. However, temperature influences both the decay time of PtTPTBPF under anoxic conditions (which decreases due to thermal quenching) and the Stern–Volmer quenching constant KSV (which increases with temperature).22,26 The decay time of PtTPTBPF in the particles is only minorly affected by temperature (about 0.07%/°K). The effect of the temperature on KSV is more significant (about 1.3%/K). In other words, alteration of temperature by 1 °C would produce an error of ∼1.3% in the determination of the O2 partial pressure.
Nanoparticle Cytotoxicity and Phototoxicity
Coral cell lines for standardized cytotoxicity tests are not available; however, similar sensor particle materials showed no cytotoxicity in tests on a wide range of animal cell lines.30,37 Furthermore, the test of O2 nanoparticles on green microalgae generally showed good biocompatibility,38 and earlier studies applying O2 sensor micro- and nanoparticles to the external coral tissue surface found no inhibitory effects.17,18 Hence we expect cytotoxicity for the corals to be very unlikely.
We also assume a low phototoxicity due to the generation of singlet oxygen in the dynamic quenching process of O2 in the nanoparticles. Singlet oxygen has a low diffusion coefficient (D = ∼1 × 10⁻⁸ cm2 s–1) and a short lifetime (t = ∼20–25 μs) in PMMA,39,40 and using the Einstein–Smoluchowski relation, we can estimate the diffusion distance of singlet oxygen in PMMA as d = √(6·D·t) = 11–12 nm. Most of the generated singlet oxygen will thus be dissipated within our PMMA sensor nanoparticles (average diameter 65 nm), and as singlet oxygen also has a short lifetime of 3 μs in water,41 we argue that our sensor particles cause very little phototoxicity to surrounding tissue.
Nanoparticle Injection and Distribution
A solution of nanoparticles dispersed in seawater was injected through a glass capillary directly into the mouth and gastric cavity of the coral, where they distributed inside the coral gastrovascular canal system connecting neighboring polyps (Figure 1). In this study we aimed to fill the gastrovascular cavity with sensor materials by continuing the injection until we could see particles coming out of the neighboring polyps (SVideo 1). In the coral Pocillopora damicornis, the intensity in the injection point remained high for several hours (SFigure 2), whereas with the larger polyps of Goniastrea sp. a more homogeneous particle distribution was achieved within several minutes after the injection (Figure 3). This probably reflects differences in the connectivity between individual polyps as well as different skeletal architecture and internal dimensions of the gastric cavities in the different coral species.42,43 Mucus produced during the injection was removed by the water flow, but the injected particles were retained within the coral tissue even after 24 h, while no particles were evident on the external tissue surface of the corals. This is in contrast to magnetic microparticles used in previous work to map the O2 conditions on the external coral tissue surface,17 which were partially trapped and slowly carried away with mucous when water flow was applied.
Figure 3.
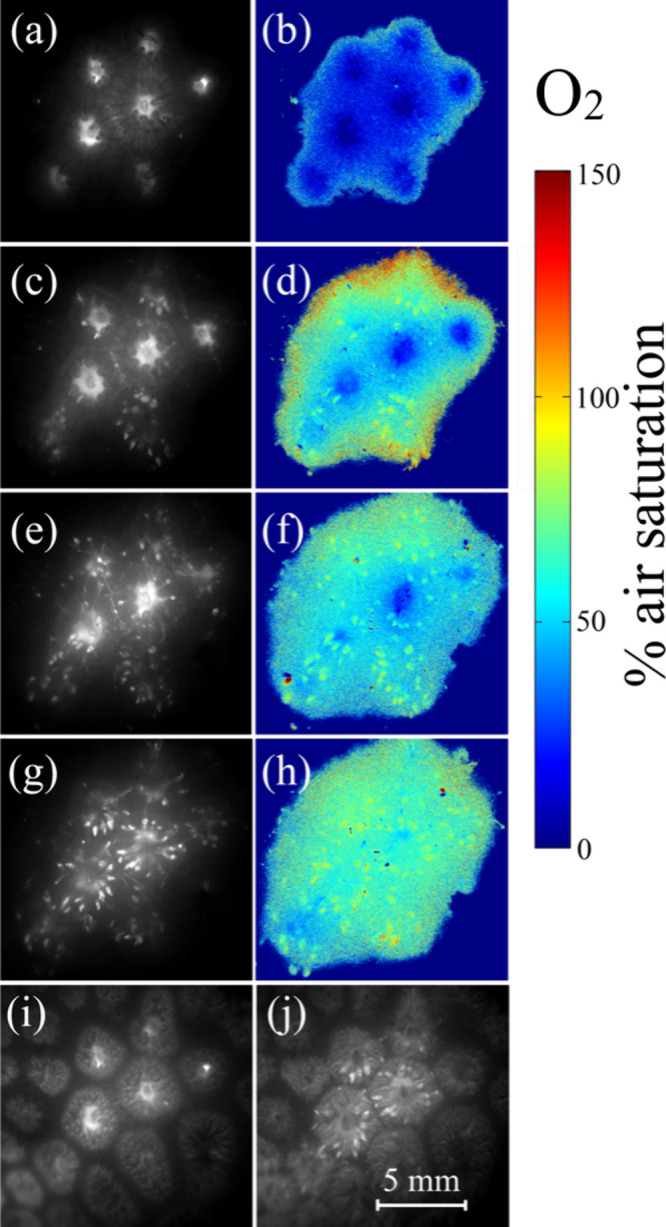
NIR (780 nm) luminescence intensity and subsurface O2 dynamics in the coral Goniastrea sp. as a function of time after the injection of sensor particles. (a), (c), (e), and (g) show luminescence intensity images (recorded with 1 μs delay after LED flash) at 10, 90, 180, and 280 min after the injection of sensor nanoparticles. (b), (d), (f), and (h) show corresponding pseudocolor images of the O2 concentration. (i) and (j) show intensity images recorded during the excitation pulse at 10 and 280 min after the injection of sensor particles, respectively, revealing the coral structure.
So far, we have mainly performed short-term experiments with nanoparticles in corals lasting from hours to a full day. Over such a time scale, we did not observe a strong decay of particle signal once they were injected. It is, however, known that corals can clear their gastric cavity, e.g., by accumulating debris in mucus pellets that can be ejected. Whether such a mechanism affects the concentration of sensor particles over longer time scales remains to be investigated.
Oxygen Dynamics in Corals after Nanoparticle Injection
Figure 3 shows NIR (780 nm) luminescence intensity images and the corresponding subsurface O2 distribution in the coral Goniastrea sp., as derived from luminescence lifetime imaging, recorded immediately after the injection of sensor particles and during longer periods in darkness. Initially the coral polyps contracted, and the coral tissue was hypoxic (about 5% and 20% air saturation for the coral mouth tissue and tentacles, respectively). Over the course of 2–3 h in darkness, the coral tissue expanded as the mouth opened and tentacles stretched out into the overlying seawater. While initially highly concentrated in the mouth tissue, the sensor nanoparticles also became more dispersed within the coral tissue during this time, presumably by a combination of diffusion and active transport in the gastrovascular channels via cilia-induced advective transport.14,44
The small size of the sensor nanoparticles also enables their dispersion from the gastric cavity into the coral tissue. In Pocillopora damicornis, we found that the O2 concentration in the upper tissue layer was different than when focusing into deeper tissue layers (Figure S1). This indicates the presence of an O2 gradient, which was measured with sensor nanoparticles distributed within the tissue and in the gastrovascular system. However, our macroscopic imaging system was not optimized for precise z-stacking, and a more precise 3D quantification of the O2 distribution in corals would require more sophisticated imaging systems such as confocal or light sheet microscopes.45 Such high-resolution measurements would also enable a more precise mapping of the nanoparticle distribution in the sample. In this study, we could not discriminate between signals from intra- and extracellular sensor nanoparticles. However, we assume that most signal originated from extracellular sensor particles, as the uptake of similar negatively charged nanoparticles into animal cells was found to be much less than for cationic ones.30
In Goniastera sp., the sensor nanoparticles showed a tendency to accumulate in the tentacles (Figure 3g,j), and the O2 concentration increased to ∼60 and 100% air saturation in the coral mouth tissue and tentacles, respectively, in darkness. The higher availability of O2 within tentacles can be explained by their higher surface area to volume ratio securing a more efficient O2 supply from the surrounding seawater.9
The observed uneven distribution of luminescence intensity could be due to a heterogeneous distribution of nanoparticles or may be due to the orientation of the tentacles in the direction of the camera lens with scattering effect within the tentacles so that the emission light is mostly outcoupled directly from the tentacle tips. While such heterogeneity, in combination with a strong autofluorescence of coral host pigments and chlorophyll in the microalgal symbionts, would severely complicate ratiometric imaging of O2, the time-domain luminescence lifetime imaging approach enabled us to map the O2 distribution without such interferences.
Light-Dark O2 Dynamics in Goniastrea sp. Coral
We stimulated the photosynthetic O2 production of the symbiotic microalgae in the coral Goniastrea sp. with red light from the high power LED used for lifetime imaging. Figures 4 and 5 show the resulting dynamics of the O2 during the light activation phase and subsequent relaxation in darkness. We found a fast response in the subsurface O2 concentration in the coral tissue within a few seconds after the onset of light or dark conditions. Even faster O2 dynamics within a few seconds after a change in light conditions has previously been measured via point measurements with O2 microsensors.10
Figure 4.
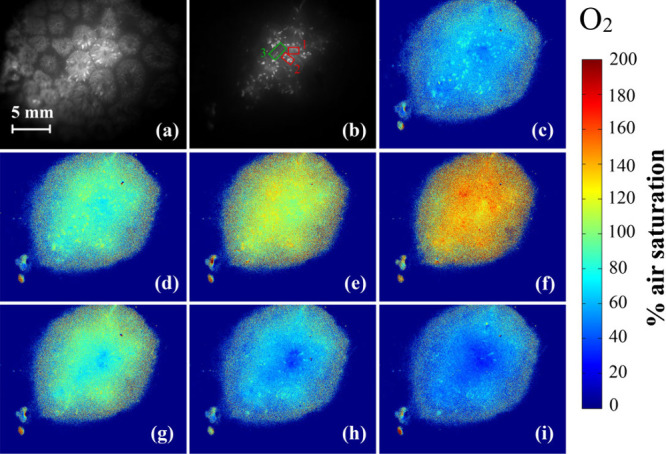
Subsurface O2 dynamics during light–dark shifts in the coral Goniastrea sp. (a) Structure of the coral revealed by an intensity image; (b) phosphorescence intensity image (1 μs delay) and the 3 regions of interest; (c–i), pseudocolor images of the O2 distribution during light activation with a photon irradiance (617 nm) of 110–120 μmol photons·m–2·s–1 after 0, 65, 135, and 260 s for (c), (d), (e), and (f), respectively, and during the subsequent dark phase after 50, 70, and 130 s for (g), (h), and (i), respectively.
Figure 5.
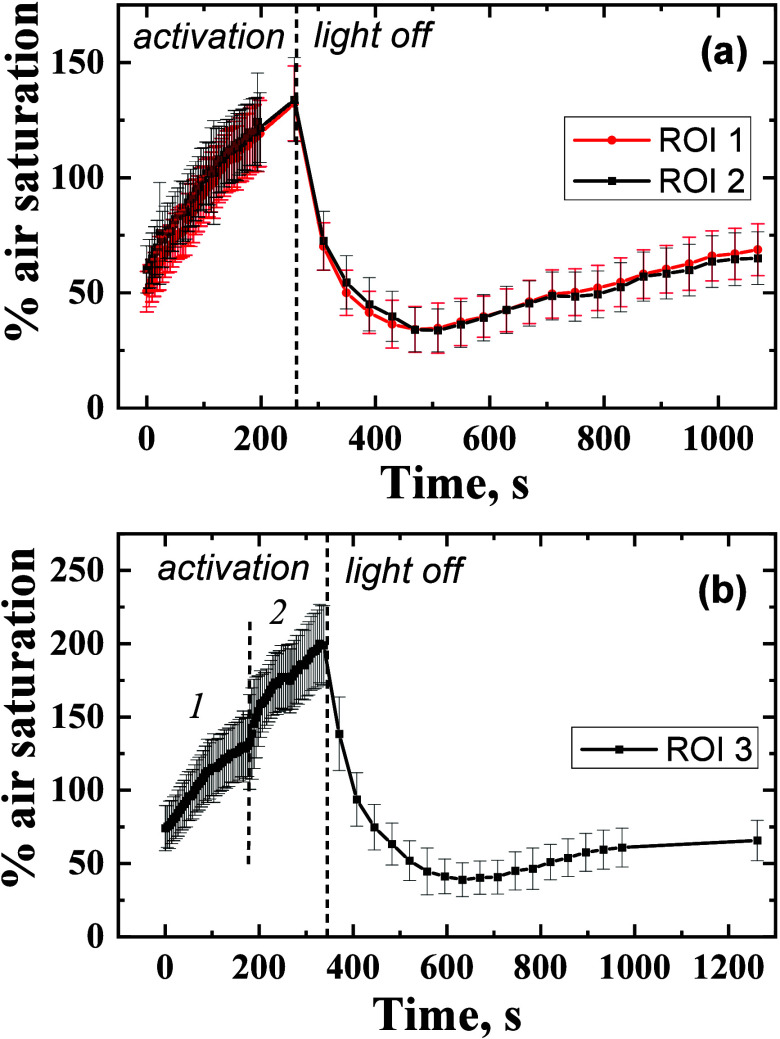
Subsurface O2 dynamics in specific tissue ROI’s (outlined in Figure 4b) of the coral Goniastrea sp. light–dark shifts. In panel (a) the photon irradiance during activation was 110–120 μmol photons·m–2·s–1, while in panel (b) the respective values were 110–120 μmol photons·m–2·s–1 (period 1) and 220–240 μmol photons·m–2·s–1 (period 2). Symbols with error bars indicate means ± standard deviation within the ROI.
A more detailed analysis of the O2 dynamics in specific regions of interest (ROI) 1 and 2 (outlined in Figure 4b) showed initially higher oxygenation in the tentacles compared to that in the coral mouth, followed by a decrease of the oxygenation to similar values (about 130% air saturation) during the activation. Interestingly, the analysis of the light–dark shifts shows that the O2 content rapidly dropped to about 35% air saturation and then gradually increased again to 50–80% air saturation.
In the second experiment, we doubled the photon flux (220–240 μmol photons·m–2·s–1) and observed a further increase in the oxygenation up to 200% air saturation (Figure 5b). Again, a minimum O2 concentration was reached after 300 s in darkness, after which the O2 concentration increased to about 65% air saturation. This dynamic can indicate significantly higher metabolic activity of the corals directly after the activation, e.g., via enhanced light and postillumination respiration.46 Alternatively, the initial drop in O2 concentration could also reflect a rapid local consumption, where the O2 concentration drop gradually becomes alleviated by circulating water in the gastrovascular canals in the coral colony.14
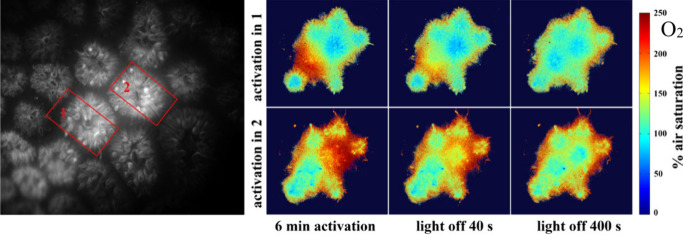
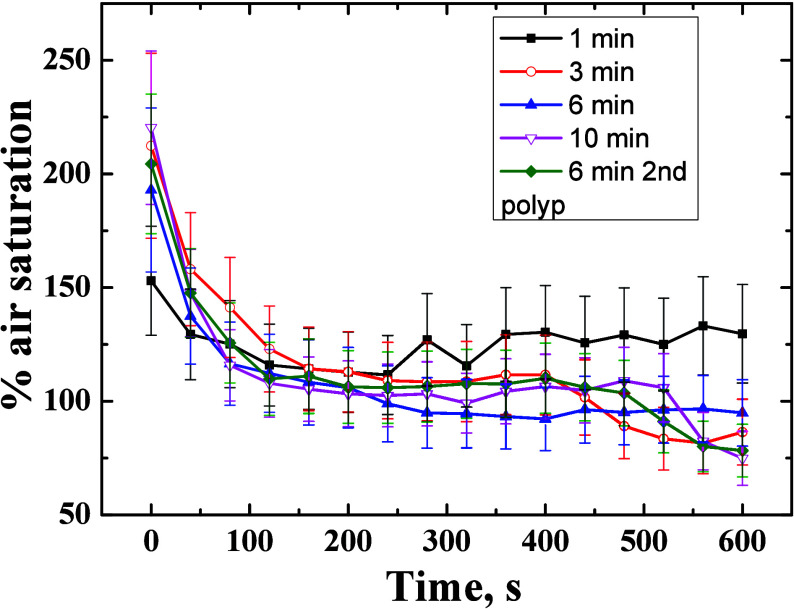
We also performed local activation of photosynthesis in individual coral polyps in Goniastrea sp. colonies using a red (660 nm) laser pointer with defined photon irradiance (350 μmol photons·m–2·s–1). The corresponding oxygenation values revealed that 1 min of continuous activation was not sufficient to saturate photosynthesis (Figures 6, 7), while internal tissue O2 levels obtained after 3, 6, and 10 min of local illumination were virtually identical (190–220% air saturation) indicating the onset of a steady state between local production, consumption, and transport of O2. The consumption of O2 via respiration after the onset of darkness was similar in different polyps (Figure 7).
Figure 6.
Luminescence intensity image showing internal tissue structure of the coral Goniastrea sp. indicating 2 ROI’s where photosynthesis was activated (left). Pseudocolor images of the distribution of the O2 in the two ROIs immediately after activation and during a subsequent dark phase. A red laser pointer (λmax 660 nm) was used for the local activation of photosynthesis with a photon irradiance of 350 μmol photons m–2 s–1, while the rest of the coral sample was in darkness.
Figure 7.
Oxygen dynamics during the light-dark shifts for 2 different polyps (see Figure 6) at varying duration of the activation with a red laser pointer (660 nm; 350 μmol photons m–2 s–1). Symbols with error bars indicate means ± standard deviation within the ROI.
Conclusion and Outlook
We showed that O2-sensitive nanoparticles based on a NIR luminescent indicator represent promising tools for macroscopic in vivo imaging of the internal O2 dynamics in corals. The sensor nanoparticles can be injected via the coral mouth and are distributed within the coral tissue via a network of gastrovascular canals connecting individual polyps in the coral colony. Lifetime imaging enables noninvasive mapping of the internal O2 distribution in different parts of the corals without interference from background fluorescence, and the red excitation and NIR emission of the sensor nanoparticles ensured good tissue penetration. A similar approach using other types of sensor nanoparticles suitable for aquatic systems16 can be used for mapping other relevant parameters such as the internal pH or temperature distribution in corals, which are additional key factors affecting coral health. Such measurements are key to improving our understanding of how coral tissue structure and plasticity regulate the internal chemical microenvironment and metabolic activity of corals and their endosymbionts—and how they are affected by environmental stress such as ocean warming, acidification, and deoxygenation.
In this proof-of-concept, we focused on 2D macroscopic imaging covering larger coral tissue areas. We are now working on extending such measurements with higher resolution 3D luminescence lifetime imaging on suitable microscope platforms. Such measurements will enable a more detailed description of the internal O2 distribution relative to the water-filled gastric cavity and the tissue layers of the coral.
Our experimental approach can also be adapted for O2 mapping in other natural systems such as biofilms, plant and animal tissues, as well as in organoids and other cell constructs, where imaging internal O2 conditions are relevant but challenging due to high optical density and background fluorescence.
Acknowledgments
We thank Birgit Ungerböck (Graz University of Technology) for help with image processing. The staff of Heron Island Research Station (University of Queensland) is thanked for their logistic support during the field and lab work. The research was conducted under research permits for field work on the Great Barrier Reef, Australia (G11/34670.1 and G09/31733.1).
Glossary
Abbreviations
- LED
light emitting diode
- PtTPTBPF
platinum(II) tetra(4-fluorophenyl)tetrabenzoporphyrin
- PMMA-MA
poly(methyl methacrylate-co-methacrylic acid)
- ROI
region of interest
Supporting Information Available
The Supporting Information is available free of charge at https://pubs.acs.org/doi/10.1021/acssensors.4c01029.
SFigures 1–4: size distribution and zeta potential of sensor nanoparticles; SFigure 5: absorption spectra showing photostability of sensor nanoparticles; SFigure 6: supplementary figure showing images of O2 dynamics and structure in the coral Pocillopora damicornis (PDF)
Supplementary video showing injection of particles into corals (MP4)
Author Contributions
MK and SB designed research, SB, DN, and MK conducted experiments, MK and SB analyzed data and wrote the manuscript with editorial input from DN. All authors have given approval to the final version of the manuscript.
Gordon and Betty Moore Foundation (MK; grant no. GBMF9206; https://doi.org/10.37807/GBMF9206); MSCA-DN Flimagin3D funded by the European Union’s Horizon 2020 research and innovation program (MK; grant agreement no. 101073507); Villum Foundation (MK; VIL57413); Independent Research Fund Denmark (MK; DFF-8022-00301B); Australian Research Council (MK; DP230100210).
The authors declare no competing financial interest.
Supplementary Material
References
- Fenchel T.; Finlay B. Oxygen and the Spatial Structure of Microbial Communities. Biol. Rev. Camb. Philos. Soc. 2008, 83, 553–569. 10.1111/j.1469-185X.2008.00054.x. [DOI] [PubMed] [Google Scholar]
- Jo J.; Price-Whelan A.; Dietrich L. E. P. Gradients and Consequences of Heterogeneity in Biofilms. Nat. Rev. Microbiol. 2022, 20 (10), 593–607. 10.1038/s41579-022-00692-2. [DOI] [PMC free article] [PubMed] [Google Scholar]
- Denny M. W.Air and Water: The Biology and Physics of Life’s Media; Princeton University Press: 1993. [Google Scholar]
- Keeling R. E.; Körtzinger A.; Gruber N. Ocean Deoxygenation in a Warming World. Annu. Rev. Mar. Sci. 2010, 2, 199–229. 10.1146/annurev.marine.010908.163855. [DOI] [PubMed] [Google Scholar]
- Morée A. L.; Clarke T. M.; Cheung W. W. L.; Frölicher T. L. Impact of Deoxygenation and Warming on Global Marine Species in the 21st Century. Biogeosci. 2023, 20, 2425–2454. 10.5194/bg-20-2425-2023. [DOI] [Google Scholar]
- Hughes D. J.; Alderdice R.; Cooney C.; Kühl M.; Pernice M.; Voolstra C. R.; Suggett D. J. Coral Reef Survival under Accelerating Ocean Deoxygenation. Nat. Clim. Change 2020, 10, 296–307. 10.1038/s41558-020-0737-9. [DOI] [Google Scholar]
- Pezner A. K.; Courtney T. A.; Barkley H. C.; Chou W.-C.; Chu H.-C.; Clements S. M.; Cyronak T.; DeGrandpre M. D.; Kekuewa S. A. H.; Kline D. I.; Liang Y.-B.; Martz T. R.; Mitarai S.; Page H. P.; Rintoul M. S.; Smith J. E.; Soong K.; Takeshita Y.; Tresguerres M.; Wei Y.; Yates K. K.; Andersson A. J. Increasing Hypoxia on Global Coral Reefs under Ocean Warming. Nat. Clim. Change 2023, 13 (4), 403–409. 10.1038/s41558-023-01619-2. [DOI] [Google Scholar]
- Hughes D. J.; Cobbs G.; Alexander J.; Kühl M.; Cooney C.; Pernice M.; Varkey D.; Voolstra C.; Suggett D. Widespread Oxyregulation in Tropical Corals under Hypoxia. Mar. Pollut. Bull. 2022, 179, 113722. 10.1016/j.marpolbul.2022.113722. [DOI] [PubMed] [Google Scholar]
- Patterson M. R. A Chemical Engineering View of Cnidarian Symbioses. Am. Zool. 1992, 32 (4), 566–582. 10.1093/icb/32.4.566. [DOI] [Google Scholar]
- Kühl M.; Cohen Y.; Dalsgaard T.; Jørgensen B. B.; Revsbech N. P. The Microenvironment and Photosynthesis of Zooxanthellae in Scleractinian Corals Studied with Microsensors for O2, pH and Light. Mar. Ecol.: Prog. Ser. 1995, 117, 159–172. 10.3354/meps117159. [DOI] [Google Scholar]
- Kühl M. Optical Microsensors for Analysis of Microbial Communities. Meth. Enzymol. 2005, 397, 166–199. 10.1016/S0076-6879(05)97010-9. [DOI] [PubMed] [Google Scholar]
- Hughes D. J.; Raina J.-B.; Nielsen D. A.; Suggett D. J.; Kühl M. Disentangling Compartment Function in Sessile Marine Invertebrates. Trends Ecol. Evol. 2022, 37, 740–748. 10.1016/j.tree.2022.04.008. [DOI] [PubMed] [Google Scholar]
- Pacherres C. O.; Ahmerkamp S.; Koren K.; Richter C.; Holtappels M. Ciliary Flows in Corals Ventilate Target Areas of High Photosynthetic Oxygen Production. Curr. Biol. 2022, 32 (19), 4150–4158. 10.1016/j.cub.2022.07.071. [DOI] [PubMed] [Google Scholar]
- Bouderlique T.; Petersen J.; Faure L.; Abed-Navandi D.; Bouchnita A.; Mueller B.; Nazarov M.; Englmaier L.; Tesarova M.; Frade P. R.; Zikmund T.; Koehne T.; Kaiser J.; Fried K.; Wild C.; Pantos O.; Hellander A.; Bythell J.; Adameyko I. Surface Flow for Colonial Integration in Reef-Building Corals. Curr. Biol. 2022, 32 (12), 2596–2609. 10.1016/j.cub.2022.04.054. [DOI] [PubMed] [Google Scholar]
- Koren K.; Kühl M.. Optical O2 Sensing in Aquatic Systems and Organisms. Quenched-Phosphorescence Detection of Molecular Oxygen: Applications in Life Sciences; Detection Science Series; Royal Society of Chemistry: 2018; Vol. 11, pp 145–174. [Google Scholar]
- Mosshammer M.; Brodersen K. E.; Kühl M.; Koren K. Nanoparticle-based Luminescence Imaging of Chemical Species and Temperature in Aquatic Systems: A Review. Microchim. Acta 2019, 186, 126. 10.1007/s00604-018-3202-y. [DOI] [PubMed] [Google Scholar]
- Fabricius-Dyg J.; Mistlberger G.; Staal M.; Borisov S.; Klimant I.; Kühl M. Imaging of Surface O2 Dynamics in Corals with Magnetic Micro Optode Particles. Mar. Biol. 2012, 159, 1621–1631. 10.1007/s00227-012-1920-y. [DOI] [Google Scholar]
- Koren K.; Jakobsen S. L.; Kühl M. In-vivo Imaging of O2 Dynamics on Coral Surfaces Spray-Painted with Sensor Nanoparticles. Sens. Act. B 2016, 237, 1095–1101. 10.1016/j.snb.2016.05.147. [DOI] [Google Scholar]
- Elgetti Brodersen K.; Kuhl M.; Trampe E.; Koren K. Imaging O2 Dynamics and Microenvironments in the Seagrass Leaf Phyllosphere with Magnetic Optical Sensor Nanoparticles. Plant J. 2020, 104, 1504–1519. 10.1111/tpj.15017. [DOI] [PubMed] [Google Scholar]
- Aylott J. W. Optical Nanosensors - an Enabling Technology for Intracellular Measurements. Analyst 2003, 128, 309–312. 10.1039/b302174m. [DOI] [PubMed] [Google Scholar]
- Borisov S. M.; Klimant I. Optical Nanosensors - Smart Tools in Bioanalytics. Analyst 2008, 133, 1302–1307. 10.1039/b805432k. [DOI] [PubMed] [Google Scholar]
- Lebedev A. Y.; Cheprakov A. V.; Sakadzic S.; Boas D. A.; Wilson D. F.; Vinogradov S. A. Dendritic Phosphorescent Probes for Oxygen Imaging in Biological Systems. ACS Appl. Mater. Interfaces 2009, 1, 1292–1304. 10.1021/am9001698. [DOI] [PMC free article] [PubMed] [Google Scholar]
- Sakadzic S.; Roussakis E.; Yaseen M. A.; Mandeville E. T.; Srinivasan V. J.; Arai K.; Ruvinskaya S.; Devor A.; Lo E. H.; Vinogradov S. A.; Boas D. A. Two-photon High-resolution Measurement of Partial Pressure of Oxygen in Cerebral Vasculature and Tissue. Nat. Methods 2010, 7, 755–759. 10.1038/nmeth.1490. [DOI] [PMC free article] [PubMed] [Google Scholar]
- Esipova T. V.; Karagodov A.; Miller J.; Wilson D. F.; Busch T. M.; Vinogradov S. A. Two New ‘Protected’ Oxyphors for Biological Oximetry: Properties and Application in Tumor Imaging. Anal. Chem. 2011, 83, 8756–8765. 10.1021/ac2022234. [DOI] [PMC free article] [PubMed] [Google Scholar]
- Lecoq J.; Parpaleix A.; Roussakis E.; Ducros M.; Houssen Y. G.; Vinogradov S. A.; Charpak S. Simultaneous Two-Photon Imaging of Oxygen and Blood Flow in Deep Cerebral Vessels. Nat. Med. 2011, 17, 893–898. 10.1038/nm.2394. [DOI] [PMC free article] [PubMed] [Google Scholar]
- Borisov S. M.; Klimant I. Luminescent Nanobeads for Optical Sensing and Imaging of Dissolved Oxygen. Microchim. Acta 2009, 164, 7–15. 10.1007/s00604-008-0047-9. [DOI] [Google Scholar]
- Borisov S. M.; Mayr T.; Mistlberger G.; Waich K.; Koren K.; Chojnacki P.; Klimant I. Precipitation as a Simple and Versatile Method for Preparation of Optical Nanochemosensors. Talanta 2009, 79, 1322–1330. 10.1016/j.talanta.2009.05.041. [DOI] [PubMed] [Google Scholar]
- Borisov S. M.; Nuss G.; Haas W.; Saf R.; Schmuck M.; Klimant I. New NIR-emitting Complexes of Platinum(II) and Palladium(II) with Fluorinated Benzoporphyrins. J. Photochem. Photobiol. A: Chem. 2009, 201, 128–135. 10.1016/j.jphotochem.2008.10.003. [DOI] [Google Scholar]
- Borisov S. M.; Nuss G.; Haas W.; Saf R.; Schmuck M.; Klimant I. New NIR-emitting Complexes of Platinum(II) and Palladium(II) with Fluorinated Benzoporphyrins. J. Photochem. Photobiol. A: Chem. 2009, 201, 128–135. 10.1016/j.jphotochem.2008.10.003. [DOI] [Google Scholar]
- Debruyne A. C.; Okkelman I. A.; Heymans N.; Pinheiro C.; Hendrix A.; Nobis M.; Borisov S. M.; Dmitriev R. I. Live Microscopy of Multicellular Spheroids with the Multimodal Near-Infrared Nanoparticles Reveals Differences in Oxygenation Gradients. ACS Nano 2024, 18, 12168–12186. 10.1021/acsnano.3c12539. [DOI] [PMC free article] [PubMed] [Google Scholar]
- Holst G.; Kohls O.; Klimant I.; König B.; Richter T.; Kühl M. A Modular Luminescence Lifetime Imaging System for Mapping Oxygen Distribution in Biological Samples. Sens. Act. B 1998, 51, 163–170. 10.1016/S0925-4005(98)00232-9. [DOI] [Google Scholar]
- Koren K.; Mosshammer M.; Scholz V.; Borisov S. M.; Holst G.; Kühl M. Luminescence Lifetime Based Chemical Imaging - a Comparison Between Time-domain and Frequency-domain Based Camera Systems. Anal. Chem. 2019, 91, 3233–3238. 10.1021/acs.analchem.8b05869. [DOI] [PubMed] [Google Scholar]
- Zach P. W.; Freunberger S. A.; Klimant I.; Borisov S. M. Electron-Deficient Near-Infrared Pt(II) and Pd(II) Benzoporphyrins with Dual Phosphorescence and Unusually Efficient Thermally Activated Delayed Fluorescence: First Demonstration of Simultaneous Oxygen and Temperature Sensing with a Single Emitter. ACS Appl. Mater. Interfaces 2017, 9, 38008–38023. 10.1021/acsami.7b10669. [DOI] [PubMed] [Google Scholar]
- Tsytsarev V.; Arakawa H.; Borisov S.; Pumbo E.; Erzurumlu R. S.; Papkovsky D. B. In vivo imaging of brain metabolism activity using a phosphorescent oxygen-sensitive probe. J. Neurosci. Methods 2013, 216, 146–151. 10.1016/j.jneumeth.2013.04.005. [DOI] [PMC free article] [PubMed] [Google Scholar]
- Carraway E. R.; Demas J. N.; DeGraff B. A. Luminescence quenching mechanism for microheterogeneous systems. Anal. Chem. 1991, 63, 332–336. 10.1021/ac00004a006. [DOI] [Google Scholar]
- Granville K. E.; Berg P.; Huettel M. A high-resolution submersible oxygen optode system for aquatic eddy covariance. Limnol. Oceanogr. Meth. 2023, 21, 152–163. 10.1002/lom3.10535. [DOI] [Google Scholar]
- Dmitriev R. I.; Borisov S. M.; Kondrashina A. V.; Pakan J. M. P.; Anilkumar U.; Prehn J. H. M.; Zhdanov A. V.; McDermott K. W.; Klimant I.; Papkovsky D. B. Imaging oxygen in neural cell and tissue models by means of anionic cell-permeable phosphorescent nanoparticles. Cell. Mol. Life Sci. 2015, 72, 367–381. 10.1007/s00018-014-1673-5. [DOI] [PMC free article] [PubMed] [Google Scholar]
- Trampe E.; Koren K.; Akkineni A. R.; Senwitz C.; Krujatz F.; Lode A.; Gelinsky M.; Kühl M. Functionalized bioink with optical sensor nanoparticles for O2 imaging in 3D bioprinted constructs. Adv. Funct. Mater. 2018, 28, 1804411. 10.1002/adfm.201804411. [DOI] [Google Scholar]
- Clough R. L.; Dillon M. P.; Iu K. K.; Ogilby P. R. Behavior of singlet molecular oxygen in a polymer matrix: effects of temperature, matrix rigidity, and molecular composition. Macromolecules 1989, 22, 3620–3628. 10.1021/ma00199a020. [DOI] [Google Scholar]
- Ogilby P. R.; Dillon M. P.; Kristiansen M.; Clough R. L. Quenching of singlet oxygen in solid organic polymers. Macromolecules 1992, 25, 3399–3405. 10.1021/ma00039a014. [DOI] [Google Scholar]
- Boix-Garriga E.; Rodríguez-Amigoa B.; Planas O.; Nonell S.. Properties of Singlet Oxygen. In Singlet Oxygen: Applications in Biosciences and Nanosciences; Nonell S., Flors C., Eds.; Royal Society of Chemistry: 2016; pp 25–44. 10.1039/9781782622208. [DOI] [Google Scholar]
- Yost D. M.; Wang L.-H.; Fan T.-Y.; Chen C.-S.; Lee R. W.; Sogin E.; Gates R. D. Diversity in Skeletal Architecture Influences Biological Heterogeneity and Symbiodinium Habitat in Corals. Zoology 2013, 116, 262–269. 10.1016/j.zool.2013.06.001. [DOI] [PubMed] [Google Scholar]
- Dellaert Z.; Putnam H. M. Reconciling the Variability in the Biological Response of Marine Invertebrates to Climate Change. J. Exp. Biol. 2023, 226, jeb245834. 10.1242/jeb.245834. [DOI] [PubMed] [Google Scholar]
- Gladfelter E. H. Circulation of Fluids in the Gastrovascular System of the Reef Coral Acropora cervicornis. Biol. Bull. 1983, 165 (3), 619–636. 10.2307/1541469. [DOI] [PubMed] [Google Scholar]
- Dmitriev R. I.; Intes X.; Barroso M. M. Luminescence Lifetime Imaging of Three-dimensional Biological Objects. J. Cell Sci. 2021, 134 (9), 1–17. 10.1242/jcs.254763. [DOI] [PMC free article] [PubMed] [Google Scholar]
- Schrameyer V.; Wangpraseurt D.; Hill R.; Kühl M.; Larkum A. W. D.; Ralph P. J. Light Respiratory Processes and Gross Photosynthesis in Two Scleractinian Corals. PLoS One 2014, 9 (10), e110814 10.1371/journal.pone.0110814. [DOI] [PMC free article] [PubMed] [Google Scholar]
Associated Data
This section collects any data citations, data availability statements, or supplementary materials included in this article.


