

Abstract
Objective:
Despite its importance, detailed, national estimates of intensive care unit (ICU) utilization and outcomes remain lacking. We aimed to characterize trends in ICU utilization and outcomes over a recent 12-year period in the U.S.
Design/Setting:
In this longitudinal study, we examined hospitalizations involving ICU care (“ICU hospitalizations”) alongside hospitalizations not involving ICU care (“non-ICU hospitalizations”) among traditional Medicare beneficiaries using 100% Medicare Part A claims data and commercial claims data for the under-65 adult population from 2008 through 2019.
Patients/Interventions:
There were 18,313,637 ICU hospitalizations and 78,501,532 non-ICU hospitalizations in Medicare, and 1,989,222 ICU hospitalizations and 16,732,960 non-ICU hospitalizations in the commercially insured population.
Measurements and Main Results:
From 2008 to 2019, about 20% of Medicare hospitalizations and 10% of commercial hospitalizations involved ICU care. Among these ICU hospitalizations, length of stay and ICU length of stay decreased on average. Mortality and hospital readmissions on average also decreased, and they decreased more among ICU hospitalizations than among non-ICU hospitalizations, for both Medicare and commercially insured patients. Both Medicare and commercial populations experienced a growth in shorter ICU hospitalizations (between 2–7 days in length), which were characterized by shorter ICU stays and lower mortality. Among these short hospitalizations in the Medicare population, for common clinical diagnoses cared for in both ICU and non-ICU settings, patients were increasingly triaged into an ICU during the study period, despite being younger and having shorter hospital stays.
Conclusions:
ICUs are used in a sizeable share of hospitalizations. From 2008 to 2019, ICU length of stay and mortality have declined, while short ICU hospitalizations have increased. In particular, for clinical conditions often managed both within and outside of an ICU, shorter ICU hospitalizations involving younger patients have increased. Our findings motivate opportunities to better understand ICU utilization and to improve the value of ICU care for patients and payers.
Keywords: intensive care units, health policy, health services, mortality, readmissions, utilization
Introduction
The U.S. spends hundreds of billions of dollars annually on care delivered in intensive care units (ICUs).1 Despite this substantial spending, large-scale, national, claims-based evidence on changes in ICU utilization and the resultant outcomes remains scant. The ICU services literature has also primarily focused on Medicare patients, even though commercially-insured patients account for nearly half of adult ICU days.2–4 The lack of large scale, claims-based evidence on ICU utilization and outcomes across payers is a key gap in knowledge.5
Whether a patient receives ICU-level care can be subjective, often affected by physician preferences.6–8 As a result, ICU utilization varies significantly between countries and within the U.S.6–12 This variability in clinical decision-making, however, has both clinical implications to patients and concrete economic implications for payers.2,5,13 Early research on ICU outcomes has focused on specific clinical conditions and mortality; mortality in sepsis declined from 1994–2014, work looking broadly at outcomes from 1996–2010 found unadjusted mortality after an ICU stay to be largely unchanged.14,15 Despite a suggestion of increased ICU utilization nationally, evidence is lacking regarding recent trends, whether certain types of admissions are responsible for those trends, and the corresponding patient outcomes.
To address this important gap in evidence on ICU care, we examined 100% traditional Medicare inpatient claims and a large nationwide sample of commercially insured enrollees over a recent 12-year period. We analyzed temporal trends in admissions and outcomes for hospitalizations that included ICU care (“ICU hospitalizations”). To provide a comprehensive view of adult hospitalizations, we also analyzed hospitalizations that did not involve ICU care (“non-ICU hospitalizations”). To better understand recent trends in ICU utilization, we then analyzed ICU utilization both by length of stay and for clinical diagnoses that are often treated both inside and outside the ICU setting. We hypothesized that growth of ICU utilization in the adult population, which has been suggested in prior work,16 is driven by shorter admissions, which may involve younger (and healthier) patients.
Methods
Medicare Claims Data and Variables
We analyzed 2008–2019 traditional (fee-for-service) Medicare inpatient claims data provided by the Centers of Medicare & Medicaid Services (CMS), containing 100% of inpatient admissions for traditional Medicare beneficiaries. We limited our sample to beneficiaries 65 years of age or older who were enrolled in Medicare Part A at the time of the hospitalization.
For each hospitalization, we obtained the patient age, sex, race and ethnicity, hospital identifier, geographic area of service, admission diagnosis-related group (DRG), and revenue center codes billed during the hospitalization.17 We also gathered present-on-admission diagnoses to calculate the van Walraven-Elixhauser comorbidity score, a validated predictor of in-hospital mortality.18–20 Elixhauser comorbidities were defined using International Classification of Diseases (ICD) 9th and 10th Revision codes.21
Commercial Claims Data and Variables
For the commercial population, we analyzed 2008–2019 inpatient claims from the MarketScan Commercial Claims and Encounters database.22 This database contains a large, nationwide convenience sample of commercially insured individuals with employer-sponsored insurance under age 65. The MarketScan databases include data from approximately 350 commercial payers and contain longitudinal claims for over 270 million unique patients since its creation in 1995. Our sample included all inpatient admissions for adults aged 18–64.
For each hospitalization, we similarly gathered information on patient age, sex, insurance plan type, geographic region of service, and admission DRG for the hospitalization, and the revenue center codes billed during the hospitalization. We again calculated the van Walraven-Elixhauser comorbidity index using present-on-admission diagnoses. Data on race or ethnicity and hospital identifiers were not available in the MarketScan files.
Outcome Variables
Consistent with prior work, ICU utilization was identified using validated revenue center codes that indicated the delivery of services within an ICU (Appendix Table 1).23,24 Hospitalizations including ICU revenue codes (implying admission to an ICU) were classified as “ICU hospitalizations” while hospitalizations not inclusive of ICU revenue codes were classified as “non-ICU hospitalizations.”23 Consistent with prior studies, we excluded intermediate care units (revenue center codes 206, 214) from our definition of ICU hospitalizations.11,23,24
We measured the quantity and rate of hospitalizations that involved an ICU admission and those that did not. We obtained hospital length of stay (derived by subtracting the date of admission from the date of discharge and adding one, ensuring that all hospitalizations were at least one day in length). We also obtained ICU length of stay, or days spent in the ICU, using revenue center counts for ICU beds for ICU hospitalizations. Other outcomes included the in-hospital mortality rate, and 30-day, as well as 31–90 day, rates of readmission to the hospital, calculated among survivors at discharge.
Statistical Analysis
In unadjusted analyses, we calculated the number of hospitalizations per beneficiary-year annually among ICU and non-ICU hospitalizations. We then calculated the length of stay, readmissions, and mortality among ICU and non-ICU hospitalizations.
Adjusted analyses used the hospitalization as the unit of analysis. We estimated annual changes in utilization, ICU length of stay, readmissions, and mortality using an ordinary least squares regression model. In the Medicare population, we adjusted for beneficiary age, sex, van Walraven-Elixhauser comorbidity score, admission DRG, and hospital-level fixed effects, which accounted for time-invariant within-hospital factors. In the commercial population, we similarly adjusted for enrollee age, sex, and admission DRG. However, given the lack of hospital identifiers in MarketScan claims data, we included metropolitan statistical area (MSA) fixed effects. Patient race/ethnicity is not included in the MarketScan data and was thus excluded from the main analysis. We conducted a sensitivity analysis inclusive of race/ethnicity as a covariate for Medicare patients for claims between 2009–2019 (race/ethnicity data were incomplete in 2008).
Subgroup Analyses
Categorization by Length of Stay
To determine if there was heterogeneity in outcomes and utilization within ICU hospitalizations, we analyzed ICU hospitalizations by quartiles of length of stay, given prior evidence differential outcomes and patient morbidity by length of stay categories.25 We stratified ICU hospitalizations into “ultrashort” hospitalizations (length of stay 1 day, less than first quartile), “short” hospitalizations (length of stay 2–7 days, first through third quartile), and “long” hospitalizations (greater than 7 days, greater than third quartile).
ICU Utilization by Clinical Category
Among “short” hospitalizations, we conducted further subgroup analyses to determine patient composition and triage decisions by clinical category. We created a clinical basket of DRGs that often result in—but do not always clinically necessitate—an ICU admission. These DRGs represent clinical diagnoses that historically involved discretion regarding ICU admission and allowed us to investigate how triage decisions are changing over time. To create this list, we determined the top 50 admission DRGs by ICU volume separately for the Medicare and commercial samples. We then selected DRGs that resulted in ICU utilization for between 20% and 70% of hospitalizations in the respective samples. Finally, we grouped these DRGs into clinically meaningful categories (Appendix Tables 2,3).
We calculated two-sided p-values subject to the Bonferroni correction for multiple hypothesis testing. This study was approved by the Institutional Review Board at Harvard Medical School (IRB approval date: 1/6/2022, Title: Changes in the Prices and Quantities of Health Care Services in the Medicare and Commercially-Insured Populations). Analyses were conducted using Stata statistical software, version 16.
Results
Study Sample
We analyzed 18,313,637 ICU hospitalizations (those involving ICU services) and 78,501,532 non-ICU hospitalizations in Medicare, and 1,989,222 ICU hospitalizations and 16,732,960 non-ICU hospitalizations in the commercial population. Average ages of the Medicare patients were similar between the ICU and non-ICU groups, but in the commercial population, patients requiring ICU admission were, on average, 8 years older. Geographic distribution of the hospitalizations was similar between ICU and non-ICU, as well as between the Medicare and commercial samples (Tables 1,2). Across both the Medicare and commercial populations, sepsis, cardiovascular disease, and pulmonary disease were among the most common admitting diagnoses (Appendix Tables 2,3).
Table 1.
Baseline Characteristics of Medicare Hospitalized Patients
| Medicare | ||
|---|---|---|
| Non-ICU | ICU | |
| Sample (n) | 78,501,532 | 18,313,637 |
| Patient Characteristics | ||
| Age (years) | 78.5 | 77.4 |
| Sex (% female) | 57.7 | 49.8 |
| van Walraven-Elixhauser score | 8.0 | 11.1 |
| Geographic Characteristics (%) | ||
| North Central | 24.7 | 24.2 |
| Northeast | 19.6 | 16.7 |
| South | 40.0 | 43.0 |
| West | 16.0 | 15.8 |
| Unknown/Other | 0.0 | 0.0 |
| Patient Race/Ethnicity (%) | ||
| White | 82.6 | 80.3 |
| Black | 9.2 | 10.0 |
| Other | 0.5 | 0.6 |
| Asian | 1.6 | 2.0 |
| Hispanic | 5.1 | 6.1 |
| Native American | 0.6 | 0.0 |
| Unknown | 0.5 | 0.4 |
This Table shows the baseline characteristics of the hospitalized patients 100% Medicare Fee-for-Service data for Medicare patients between 2008–2019.
Table 2.
Baseline Characteristics of Commerically-Insured Hospitalized Patients
| Commercial | ||
|---|---|---|
| Non-ICU | ICU | |
| Sample (n) | 16,732,960 | 1,989,222 |
| Patient Characteristics | ||
| Age (years) | 43.0 | 50.0 |
| Sex (% female) | 67.2 | 44.2 |
| van Walraven-Elixhauser score | 2.0 | 6.4 |
| Geographic Characteristics (%) | ||
| North Central | 23.5 | 23.9 |
| Northeast | 17.8 | 15.8 |
| South | 41.6 | 45.2 |
| West | 15.8 | 13.7 |
| Unknown/Other | 1.2 | 1.4 |
| Insurance Characteristics (%) | ||
| Basic/major medical | 0.0 | 0.0 |
| CDHP | 5.8 | 5.6 |
| Comprehensive | 2.7 | 3.7 |
| EPO | 1.7 | 1.5 |
| HDHP | 4.1 | 3.7 |
| HMO | 13.3 | 11.3 |
| POS | 7.8 | 7.1 |
| POS with capitation | 0.8 | 0.8 |
| PPO | 63.4 | 65.8 |
| Unknown | 4.3 | 3.9 |
| Industry of Employer (%) | ||
| Finance Insurance Real Estate | 7.8 | 6.0 |
| Manufacturing | 16.9 | 17.8 |
| Oil Gas and Mining | 0.9 | 0.9 |
| Other | 1.3 | 1.3 |
| Retail Trade | 3.2 | 3.1 |
| Services | 15.6 | 12.6 |
| Transportation Comms Utilities | 8.4 | 8.9 |
| Unknown | 46.0 | 48.3 |
This Table shows the baseline characteristics of the hospitalized patients within the IBM MarketScan Data for commercially-insured patients between 2008–2019.
Volume of Hospitalizations
In Medicare, non-ICU hospitalizations declined by 40.5% from 2008 to 2019—from 195 to 116 hospitalizations per 1,000 enrollees. ICU hospitalizations in Medicare decreased by a similar proportion—from 45 to 26 per 1,000 enrollees (Figure 1). As a share of all Medicare hospitalizations, those involving ICU services thus remained largely unchanged over this period, at about 20%. As a share of all commercial hospitalizations indexed to number of beneficiaries, those involving ICU services stably comprised around 10%.
Figure 1. Rate of ICU and Non-ICU Hospitalizations in the Medicare and Commercial Populations, 2008–2019.
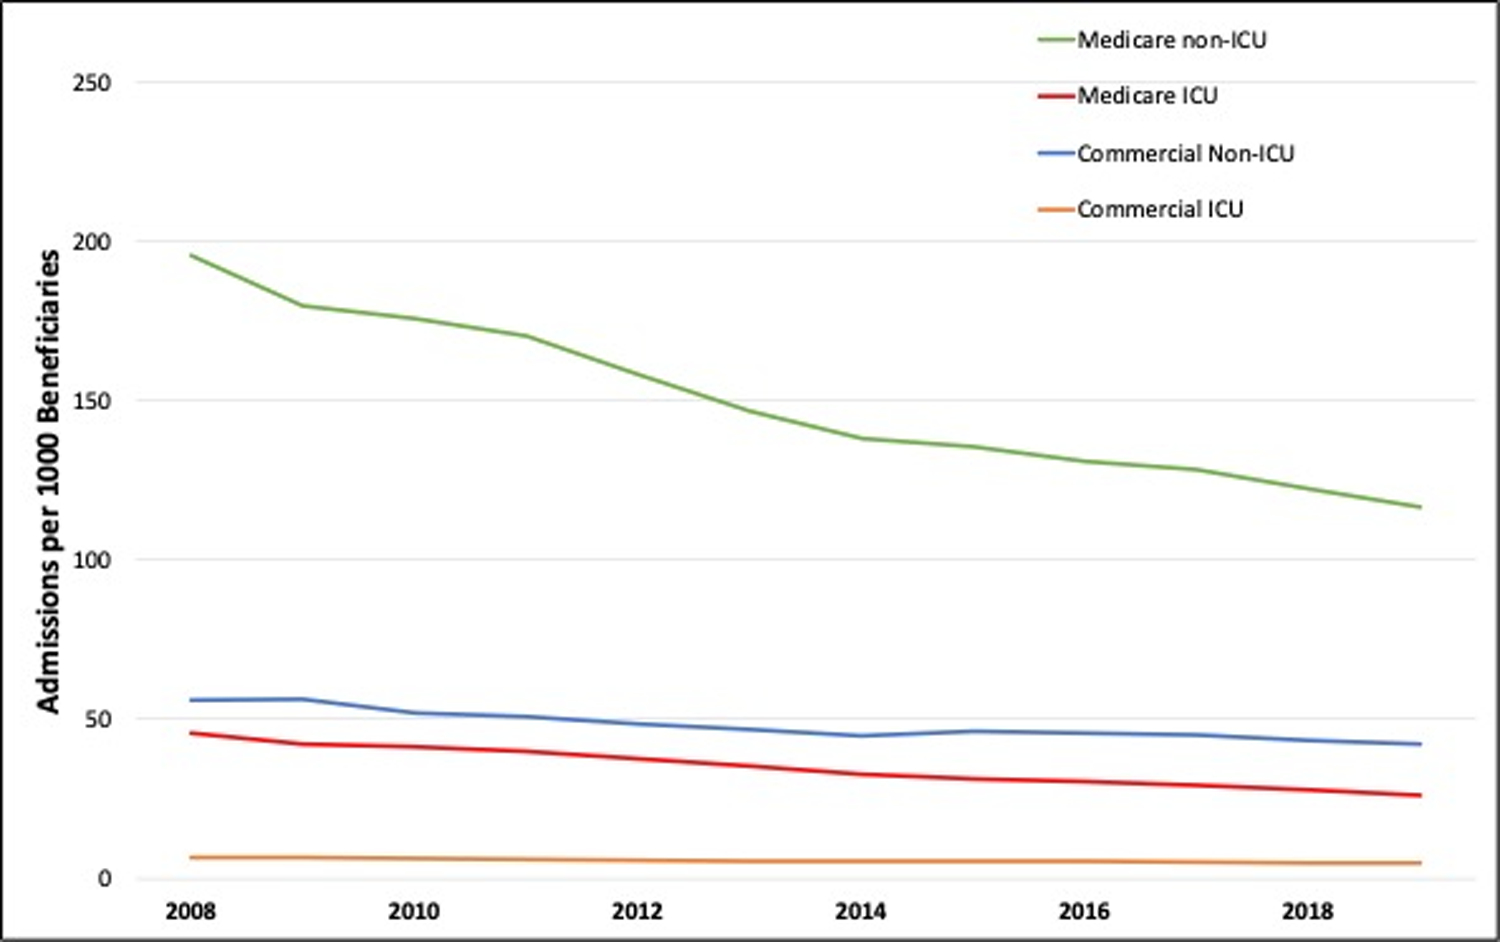
This Figure shows rates of ICU and non-ICU hospitalizations per 1,000 beneficiaries using 2008–2019 traditional (fee-for-service) Medicare 100% inpatient claims data provided by the Centers of Medicare & Medicaid Services (CMS) and 2008–2019 inpatient claims from the MarketScan Commercial Claims and Encounters database.
Within-hospitalization Utilization
The average length of stay for ICU hospitalizations was between 10 to 11 days in the Medicare population and between 7 and 8 days in the commercial population. The average number of days spent in the ICU was similar for the Medicare and commercial populations, between 3 and 4 days (Table 3, Appendix Table 4). The average hospitalization length of stay for ICU hospitalizations and days spent in the ICU both decreased over time in the Medicare and commercial populations when adjusted for patient and admission factors (Table 3). Adjusted hospital lengths of stay for non-ICU hospitalizations similarly decreased annually, though by smaller magnitudes.
Table 3.
Changes in Utilization and Outcomes Among ICU and Non-ICU Hospitalizations
| Medicare (n=96,815,169) | Commercial (n=18,722,182) | ||||||||||
|---|---|---|---|---|---|---|---|---|---|---|---|
| Unadjusted Means | Adjusted yearly difference (95% CI) | p-value | Unadjusted Means | Adjusted yearly difference (95% CI) | p-value | ||||||
| 2008–2011 | 2012–2015 | 2016–2019 | 2008–2011 | 2012–2015 | 2016–2019 | ||||||
| Utilization | ICU Length of Stay (days) | 3.98 | 3.82 | 3.67 | −0.07 (−0.07,−0.07) | <0.001 | 3.33 | 3.34 | 3.50 | −0.01 (−0.01,0.00) | <0.001 |
| Hosp. Length of Stay (days) | |||||||||||
| non-ICU | 5.54 | 5.63 | 5.68 | −0.04 (−0.05,−0.04) | <0.001 | 3.57 | 3.70 | 3.88 | −0.02 (−0.02,−0.01) | <0.001 | |
| ICU | 10.29 | 10.16 | 10.07 | −0.15 (−0.15,−0.14) | <0.001 | 7.51 | 7.53 | 7.59 | −0.07 (−0.07,−0.06) | <0.001 | |
| Outcomes | 30-day readmissions (%) | ||||||||||
| non-ICU | 11.41 | 10.88 | 10.72 | −0.18 (−0.18,−0.17) | <0.001 | 11.89 | 11.79 | 12.86 | −0.08 (−0.09,−0.07) | <0.001 | |
| ICU | 13.25 | 12.97 | 12.67 | −0.22 (−0.22,−0.21) | <0.001 | 15.82 | 16.19 | 16.02 | −0.17 (−0.19,−0.14) | <0.001 | |
| 31–90 day readmissions (%) | |||||||||||
| non-ICU | 7.12 | 7.29 | 7.13 | 0.00 (0.00,0.01) | <0.001 | 6.78 | 6.80 | 6.97 | −0.03 (−0.04,−0.03) | <0.001 | |
| ICU | 6.83 | 7.03 | 6.83 | −0.01 (−0.01,−0.01) | <0.001 | 7.90 | 7.92 | 7.83 | −0.08 (−0.1,−0.06) | <0.001 | |
| Mortality (%) | |||||||||||
| non-ICU | 2.10 | 1.86 | 1.66 | −0.13 (−0.13,−0.13) | <0.001 | 0.52 | 0.47 | 0.28 | −0.04 (−0.04,−0.04) | <0.001 | |
| ICU | 11.96 | 11.82 | 11.68 | −0.39 (−0.4,−0.39) | <0.001 | 5.18 | 5.52 | 4.64 | −0.21 (−0.22,−0.20) | <0.001 | |
Using data from 2008–2019 traditional (fee-for-service) Medicare 100% inpatient claims data provided by the Centers of Medicare & Medicaid Services (CMS) and 2008–2019 inpatient claims from the MarketScan Commercial Claims and Encounters database, we estimated average annual changes in utilization and outcomes with the hospitalization as the unit of observation, adjusted for patient age, sex, van Walraven-Elixhauser comorbidity score, and admission diagnosis-related group. The models included hospital-level fixed effects for the Medicare population and metropolitan statistical area fixed effects for the commercial population. LOS = length of stay in days (d). Mortality denotes in-hospital mortality. Two-sided p-values were subject to the Bonferroni correction for multiple hypothesis testing.
Outcomes
Adjusted 30-day, 31–90 day readmissions, and mortality all decreased for both ICU and non-ICU hospitalizations in the Medicare and commercial populations (Table 3). Adjusted annual reductions in readmissions and mortality were larger for ICU hospitalizations compared to non-ICU hospitalizations. The hospitalized Medicare population’s 30-day readmission rate was 12–13% for ICU hospitalizations and its 31–90 day readmission rate was lower at 6–7%. The commercial population’s 30-day readmission rate was about 15–16% for ICU hospitalizations, substantially higher than the readmission rate for non-ICU hospitalizations. The hospitalized commercial population’s 31–90 day readmission rate was 7–8% for both ICU and non-ICU hospitalizations.
In-hospital mortality decreased for all Medicare and commercial hospitalizations. The largest adjusted decrease was seen in the Medicare ICU population of 0.39 percentage points per year when controlling for patient and admission factors (including admitting DRG and hospital of admission). In-hospital mortality was highest among Medicare ICU hospitalizations, followed by commercial ICU hospitalizations, Medicare non-ICU hospitalizations, and commercial non-ICU hospitalizations. The inclusion of race/ethnicity as a covariate in the Medicare population did not change our findings (Appendix Table 5).
Subgroup Analysis – ICU Outcomes and Utilization by Length of Stay
To better understand how different patient populations utilized ICUs, we performed subgroup analyses of ICU hospitalizations by length of stay for the hospitalization. We categorized patients with ICU hospitalizations into “ultrashort” stay hospitalizations (hospital length of stay less than 2 days), “short” (hospital length of stay between 2 and 7 days), and “long” (hospital length of stay greater than 7 days) hospitalizations. In Medicare, patients in “short” hospitalizations were younger that patients in “ultrashort” hospitalizations but older than those in “long” hospitalizations. Medicare patients in “short” hospitalizations had the lowest comorbidity indices. Within commercial, patients with “short” hospitalizations were characterized by intermediate age and intermediate Elixhauser comorbidity indices (Appendix Figures 1, 2).
In Medicare, “short” stay hospitalizations (hospital length of stay between 2 and 7 days) showed significant increased utilization (an annual increase of 0.2% of total annual hospitalizations) over the study period; adjusted rates of “ultrashort” (hospital length of stay less than 2 days) and “long” (hospital length of stay greater than 7 days) hospitalizations decreased over time (Table 4). Within the commercial population, “short” stay ICU hospitalizations showed slight increases over this period as a proportion of total annual hospitalizations. The share of total hospital days spent in the ICU decreased among all Medicare ICU hospitalizations but increased among all commercial ICU hospitalizations. Additionally, short ICU hospitalizations were characterized by the lowest mortality of all ICU hospitalizations in both commercial and Medicare populations. Ultrashort hospitalizations had the highest mortality in both commercial and Medicare. Results were similar when including race/ethnicity as a covariate in the Medicare population (Appendix Table 6).
Table 4.
Changes in Utilization and Mortality Among Hospitalizations involving ICU Care, by Length of Hospitalization
| Medicare (N= 18,313,637) | Commercial (N= 1,989,222) | |||||||
|---|---|---|---|---|---|---|---|---|
| Unadjusted Means | Adjusted annual change (95% CI) | Unadjusted Means | Adjusted annual change (95% CI) | |||||
| 2008–2011 | 2012–2015 | 2016–2019 | 2008–2011 | 2012–2015 | 2016–2019 | |||
| Share of total hospitalizations (%) | ||||||||
| 0–1 day hospitalizations | 0.25 | 0.23 | 0.21 | −0.01 (−0.01,−0.01) | 1.49 | 1.31 | 1.30 | 0.02 (0.02,0.02) |
| 2–7 day hospitalizations | 9.54 | 9.67 | 9.87 | 0.02 (0.02,0.02) | 6.14 | 6.19 | 5.96 | 0.01 (0.01,0.01) |
| 8 or more day hospitalizations | 9.23 | 9.24 | 8.76 | −0.01 (−0.01,0.00) | 3.09 | 3.16 | 3.07 | −0.03 (−0.03,−0.02) |
| Share of hospital days in ICU (%) | ||||||||
| 0–1 day hospitalizations | 97.85 | 95.46 | 94.25 | −0.76 (−0.78,−0.74) | 92.87 | 94.24 | 94.52 | 0.03 (0.02,0.03) |
| 2–7 day hospitalizations | 45.90 | 44.20 | 43.85 | −0.27 (−0.27,−0.27) | 52.93 | 52.55 | 55.18 | 0.04 (0.03,0.04) |
| 8 or more day hospitalizations | 37.85 | 37.25 | 36.33 | −0.20 (−0.20,−0.19) | 40.58 | 40.85 | 42.90 | 0.02 (0.01,0.02) |
| Mortality after ICU Care (%) | ||||||||
| 0–1 day hospitalizations | 65.89 | 70.55 | 71.32 | −0.70 (−0.74,−0.66) | 8.21 | 9.97 | 7.69 | −0.56 (−0.60,−0.53) |
| 2–7 day hospitalizations | 9.63 | 9.03 | 8.82 | −0.49 (−0.50,−0.48) | 3.27 | 3.69 | 3.57 | −0.12 (−0.14,−0.11) |
| 8 or more day hospitalizations | 11.85 | 11.16 | 11.17 | −0.35 (−0.35,−0.34) | 7.55 | 7.33 | 5.47 | −0.26 (−0.29,−0.23) |
Using data from 2008–2019 traditional (fee-for-service) Medicare 100% inpatient claims data provided by the Centers of Medicare & Medicaid Services (CMS) and 2008–2019 inpatient claims from the MarketScan Commercial Claims and Encounters database, we categorized ICU hospitalizations by total length of stay. We then estimated each category’s share of total hospitalizations, the share of days in a hospitalization spent in the ICU, and in-hospital mortality. We estimated average annual changes in these utilization and mortality outcomes by category with the hospitalization as the unit of observation, adjusted for patient age, sex, van Walraven-Elixhauser comorbidity score and admission diagnosis-related group. The models included hospital-level fixed effects for the Medicare population and metropolitan statistical area fixed effects for the commercial population. LOS = length of stay in days (d). Mortality denotes in-hospital mortality.
Subgroup Analysis – ICU Utilization for “Short Hospitalizations”
Given the increase in “short” ICU hospitalizations as a share of all hospitalizations, we conducted a further subgroup analysis by admission clinical indication to better understand changes in ICU utilization in this population of patients with the lowest mortality among patients hospitalized in the ICU. Among clinical conditions that are frequently treated both within and outside of an ICU (Appendix Tables 2,3), we found that patients hospitalized between 2–7 days were more likely to be triaged to an ICU over time in the Medicare population (Appendix Figure 3). However, Medicare patients in “short” hospitalizations admitted to the ICU for these diagnoses were, on average, younger over time (Appendix Figure 4) and ICU length of stay was shortening (Appendix Figure 5). The average Medicare patient van Walraven-Elixhauser index increased for these diagnoses (Appendix Figure 6). Within short commercial ICU hospitalizations, there was more variation in trends regarding age, van Walraven-Elixhauser score, and fraction of hospitalizations requiring ICU care (Appendix Figures 3,4,5 and 6).
Discussion
In a large, nationwide study of hospitalizations, ICU use was prevalent in both the Medicare and commercially-insured adult populations. ICUs were used in about 20% of Medicare and 10% of commercial hospitalizations across 2008 through 2019. Over this period, Medicare beneficiaries increasingly spent, on average, less time in the ICU during a hospitalization. Moreover, their in-hospital mortality and readmission rates improved relative to non-ICU hospitalizations in both populations. In both Medicare and commercially insured populations, the reduction in ICU length of stay was in part explained by an increase in the share of hospitalizations involving short ICU stays (those totaling a length of 2 to 7 days). Within these shorter hospitalizations, among diagnoses that are often treated or managed both in ICUs and general wards, the share of Medicare patients triaged to an ICU has increased over time, relative to most diagnoses. These beneficiaries triaged to the ICU during shorter hospitalizations have also been on average younger.
These findings add to the literature in several novel ways. First, this study used the 100% traditional Medicare inpatient data to analyze the evolution of ICU utilization and outcomes for beneficiaries. Second, this work established an evidence base on ICU use among the lesser studied under-65 commercially insured population. In this population, a larger share of each ICU hospitalization was spent in the ICU, relative to Medicare. Third, we linked clinically important outcomes pertinent to the ICU for both Medicare and commercially insured patients, including readmissions and mortality. Fourth, we placed ICU utilization and outcomes in the context of broader inpatient hospitalizations. Additionally, we provided further nuance to estimates of ICU utilization. Though ICU utilization nationally has been relatively unchanged over time, ICU care is delivered in a sizeable share of hospitalizations, and shorter ICU hospitalizations are becoming more frequent for both commercial and Medicare patients. Finally, this study substantially expanded on prior findings of increased ICU utilization by identifying short stay hospitalizations with even shorter ICU stays as a driver of increased utilization, characterizing the patients in these hospitalizations and analyzing the clinical outcomes of these hospitalizations.9,10,15 These results motivate important future avenues of research surrounding utilization of ICU resources, which have meaningful implications for payers and patients.
First, what are the consequences of the growth in short stay ICU utilization for the Medicare Trust Fund, the U.S. Treasury account that funds Medicare, which is due to be depleted by 2031? Patients spend about half of short hospitalizations in ICUs, which garners substantially higher prices than general wards.2,26 Though ICU length of stay is decreasing, there is a concomitant, and more substantial, rise in the number of these short hospitalizations. The increase in ICU care for short hospitalizations and an increase in the duration of short hospitalizations spent in the ICU in the commercial population, where hospitalizations are substantially more expensive, has notable implications for national health care spending.27
Second, what are the consequences to patients of increased triage to ICUs for common clinical conditions that are often managed in the general wards? Diagnoses frequently treated in both ICUs and general wards likely have substantial physician discretion on location of care—incorporating key factors including patient acuity, admitting diagnosis, and hospital capacity at a given point in time.28 For these diagnoses, we found Medicare patients spent less time in the ICU, though they were admitted to ICUs more frequently. This may be due to improved ICU care over time, including rapid stabilization and subsequent discharge. However, despite these benefits, from the patient perspective, ICU care is accompanied by substantial risk (e.g. delirium, critical illness myopathy, and others) and can result in significant morbidity.13 Because lengths of stay both in the ICU and the hospitalization were both decreasing, it is likely that fewer services were being provided per admission. Given this finding, it is important for hospitals and providers to determine which parts of ICU care, such as nursing intensity or monitoring capability, provide sufficient benefit relative to non-ICU settings to justify the added costs of ICU care.
Finally, can hospitals and clinicians more efficiently allocate expensive and scarce ICU resources? While ICU hospitalizations comprised a stable fraction of total hospitalizations in both the Medicare and commercial populations, we found substantial heterogeneity in utilization patterns. The rise of shorter hospitalizations involving ICU care provides a potential opportunity for intervention. Of note, it is possible that an increase in comorbidities could justify the increase in short ICU hospitalizations. Advances in ICU care and the increased rates of discharge to long term acute care facilities (LTACs) or intermediate care units (IMCUs) may also contribute to the shortened ICU length of stay. However, to the extent that age is correlated with health status, the decrease in age across all indications, alongside improved mortality, reduced readmissions, and reduced length of stay suggest, at least in part, a Medicare ICU population that is healthier and that the increasing comorbidity index may be due to coding practices.29 Accordingly, hospitals could more closely analyze ICU utilization patterns by diagnosis to better understand the benefits provided by finite ICU resources.
This study has several limitations. First, while the Medicare population and MarketScan sample are large, our results may not generalize to other populations, including patients with Medicare Advantage, Medicaid, or no insurance. Additionally, MarketScan comprises a convenience sample of patients with employer-sponsored commercial health insurance and our findings in this population may not generalize to enrollees with other types of commercial insurance plans (e.g. Affordable Care Act Marketplace or small group plans). Second, there were likely unmeasured patient factors (e.g. illness acuity at admission presentation) not captured by the van Walraven-Elixhauser comorbidity score which influenced triage to an ICU and patient outcomes. Third, there were likely unobserved delivery system factors (e.g. physician admission preferences, hospital-specific ICU admission thresholds, etc.) that contributed to between-hospital variations in ICU utilization. This study abstracted across such variations to evaluate national means, although we adjusted for hospital-level fixed effects within the Medicare population and the geographic area of service within the commercial population. Finally, our analyses did not establish causal explanations behind the changes in utilization or outcomes.
Conclusion
Hospital care in the U.S. is costly, and ICU care within hospitals is particularly costly to patients and payers. From 2008 to 2019, ICUs have been used in a sizeable share of hospitalizations, both in the Medicare and commercially insured populations. During this time, ICU length of stay and mortality have declined, likely explained, in part, by a rise in short ICU hospitalizations. Among clinical conditions that were frequently managed both in ICUs and outside of ICUs, shorter ICU hospitalizations have also increased, notably among younger patients in the Medicare population. These findings motivate future research to better understand ICU utilization and to improve the value of ICU care for patients and payers.
Supplementary Material
Key Points.
Question:
We aimed to characterize trends in ICU utilization and outcomes for U.S. adults over a recent 12-year period.
Findings:
About 20% of Medicare hospitalizations and 10% of commercial hospitalizations involved ICU care. Among these ICU hospitalizations, length of stay and ICU length of stay decreased on average. Mortality and hospital readmissions on average also decreased, more so among ICU than non-ICU hospitalizations. Both Medicare and commercial patients experienced an increase in shorter ICU hospitalizations (between 2–7 days in length), involving shorter ICU stays and lower mortality. For common clinical diagnoses cared for in both ICU and non-ICU settings, Medicare patients were increasingly triaged into an ICU during the study period, despite being younger and having shorter hospital stays.
Meaning:
ICU length of stay declined from 2008 to 2019, alongside an increase in short ICU hospitalizations. Among clinical conditions frequently managed both in and outside of ICUs, this growth in shorter ICU hospitalizations has notably been among younger patients in the Medicare population, motivating a need to better understand the value of ICU use for patients and payers.
Acknowledgements
Conflicts of Interest and Source of Funding:
This work was supported by the National Institutes of Health (T32HL15502-03) (Dr. Kannan), the National Institutes of Health (P01-AG032952, Dr. Song), and Arnold Ventures (Dr. Song). The authors have no conflicts of interest.
Copyright Form Disclosure:
The authors received funding from the National Heart, Lung, and Blood Institute, the National Institute on Aging (NIA), and the Arnold Foundation; Drs. Kannan and Song received support for article research from the National Institutes of Health. Dr. Song’s institution received funding from the NIA (P01-AG032952) and Arnold Ventures (Grant ID: 20-04402); he also received funding from Research Triangle Institute, Google Ventures, and Greylock McKinnon Associates. Dr. Giuriato has disclosed that she does not have any potential conflicts of interest.
References
- 1.Critical Care Statistics. Society of Critical Care Medicine. https://www.sccm.org/Communications/Critical-Care-Statistics. Updated 2019. Accessed October 20, 2023.
- 2.Halpern NA, Pastores SM. Critical Care Medicine Beds, Use, Occupancy, and Costs in the United States: A Methodological Review. Crit Care Med. 2015;43(11):2452–2459. [DOI] [PMC free article] [PubMed] [Google Scholar]
- 3.Halpern NA, Pastores SM. Critical care medicine in the United States 2000–2005: an analysis of bed numbers, occupancy rates, payer mix, and costs. Crit Care Med. 2010. Jan;38(1):65–71. [DOI] [PubMed] [Google Scholar]
- 4.Angus DC, Kelley MA, Schmitz RJ, et al. , for the Committee on Manpower for Pulmonary and Critical Care Societies (COMPACCS). Current and Projected Workforce Requirements for Care of the Critically Ill and Patients With Pulmonary Disease: Can We Meet the Requirements of an Aging Population? JAMA. 2000;284(21):2762–2770. [DOI] [PubMed] [Google Scholar]
- 5.Kahn Jeremy M. Understanding economic outcomes in critical care. Current Opinion in Critical Care 12(5):p 399–404, October 2006. [DOI] [PubMed] [Google Scholar]
- 6.Admon AJ, Seymour CW, Gershengorn HB, Wunsch H, Cooke CR. Hospital-level variation in ICU admission and critical care procedures for patients hospitalized for pulmonary embolism. Chest. 2014;146(6):1452–1461. [DOI] [PMC free article] [PubMed] [Google Scholar]
- 7.Wunsch H, Angus DC, Harrison DA, Linde-Zwirble WT, Rowan KM. Comparison of medical admissions to intensive care units in the United States and United Kingdom. Am J Respir Crit Care Med. 2011;183(12):1666–1673. [DOI] [PubMed] [Google Scholar]
- 8.Gershengorn HB, Iwashyna TJ, Cooke CR, Scales DC, Kahn JM, Wunsch H. Variation in use of intensive care for adults [DOI] [PMC free article] [PubMed]
- 9.Weissman GE, Kerlin MP, Yuan Y, et al. Population Trends in Intensive Care Unit Admissions in the United States Among Medicare Beneficiaries, 2006–2015 [published correction appears in Ann Intern Med. 2019 May 7;170(9):668–669]. Ann Intern Med. 2019;170(3):213–215. doi: 10.7326/M18-1425 [DOI] [PMC free article] [PubMed] [Google Scholar]
- 10.Wallace DJ, Angus DC, Seymour CW, Barnato AE, Kahn JM. Critical care bed growth in the United States. A comparison of regional and national trends. Am J Respir Crit Care Med. 2015;191(4):410–416. doi: 10.1164/rccm.201409-1746OC [DOI] [PMC free article] [PubMed] [Google Scholar]
- 11.Barbash IJ, Wallace DJ, & Kahn JM (2019). Effects of Changes in ICU Bed Supply on ICU Utilization. Medical care, 57(7), 544–550. [DOI] [PMC free article] [PubMed] [Google Scholar]
- 12.Gooch RA, Kahn JM. ICU bed supply, utilization, and health care spending: an example of demand elasticity. JAMA. 2014. Feb 12;311(6):567–8. [DOI] [PubMed] [Google Scholar]
- 13.Hiser SL, Fatima A, Ali M et al. Post-intensive care syndrome (PICS): recent updates. j intensive care 11, 23 (2023). 10.1186/s40560-023-00670-7 [DOI] [PMC free article] [PubMed] [Google Scholar]
- 14.Law A, Stevens J; Walkey A National Trends in Timing of Death Among Patients With Septic Shock, 1994–2014. Critical Care Medicine 47(11):p 1493–1496, November 2019. [DOI] [PMC free article] [PubMed] [Google Scholar]
- 15.Sjoding MW, Prescott HC, Wunsch H, Iwashyna TJ, Cooke CR. Longitudinal changes in ICU admissions among elderly patients in the United States. Crit Care Med 2016;44:1353–1360. [DOI] [PMC free article] [PubMed] [Google Scholar]
- 16.Wallace DJ, Seymour CW, Kahn JM. Hospital-Level Changes in Adult ICU Bed Supply in the United States. Crit Care Med 2017;45(1):e67–76. [DOI] [PMC free article] [PubMed] [Google Scholar]
- 17.Chronic Conditions Warehouse. Getting Started with CMS Medicare Administrative Research Files. Updated September 2022. Accessed December 2022.
- 18.Elixhauser A, Steiner C, Harris DR, Coffey RM. Comorbidity measures for use with administrative data. Med Care. 1998;36(1):8–27. [DOI] [PubMed] [Google Scholar]
- 19.van Walraven C, Austin PC, Jennings A, Quan H, Forster AJ. A modification of the Elixhauser comorbidity measures into a point system for hospital death using administrative data. Med Care. 2009;47(6):626–633. [DOI] [PubMed] [Google Scholar]
- 20.Thompson N, Fan Y, Dalton H, et al. A New Elixhauser-based Comorbidity Summary Measure to Predict In-Hospital Mortality. Medical Care 53(4):p 374–379, April 2015. [DOI] [PMC free article] [PubMed] [Google Scholar]
- 21.Stagg V. “ELIXHAUSER: Stata module to calculate Elixhauser index of comorbidity,” Statistical Software Components S458077, Boston College Department of Economics. Published 2015. Accessed October 20, 2023. [Google Scholar]
- 22.Truven Health Analytics. IBM MarketScan Research Databases. Accessed October 20, 2023. https://www.ibm.com/products/marketscan-research-databases/resources.
- 23.Weissman GE, Hubbard RA, Kohn R, Anesi GL, Manaker S, Kerlin MP, Halpern S Validation of an Administrative Definition of ICU Admission Using Revenue Center Codes. Critical care medicine, 45(8), e758–e762 (2017). [DOI] [PMC free article] [PubMed] [Google Scholar]
- 24.Valley TS, Sjoding MW, Ryan AM, Iwashyna TJ, Cooke CR. Association of Intensive Care Unit Admission With Mortality Among Older Patients With Pneumonia. JAMA. 2015;314(12):1272–1279. doi: 10.1001/jama.2015.11068 [DOI] [PMC free article] [PubMed] [Google Scholar]
- 25.Lingsma HF, Bottle A, Middleton S, Kievit J, Steyerberg EW, Marang-van de Mheen PJ. Evaluation of hospital outcomes: the relation between length-of-stay, readmission, and mortality in a large international administrative database. BMC Health Serv Res. 2018. Feb 14;18(1):116. doi: 10.1186/s12913-018-2916-1. [DOI] [PMC free article] [PubMed] [Google Scholar]
- 26.2021 Annual Report. The Boards of Trustees, Federal Hospital Insurance and Federal Supplementary Medical Insurance Trust Funds. US Government Publishing Office. Washington. September 23, 2021. Accessed October 20, 2023. https://www.govinfo.gov/content/pkg/CDOC-117hdoc62/pdf/CDOC-117hdoc62.pdf. [Google Scholar]
- 27.The Prices That Commercial Health Insurers and Medicare Pay for Hospitals’ and Physicians’ Services. Congressional Budget Office. Published July, 2022. Accessed October 20, 2023. https://www.cbo.gov/system/files/2022-01/57422-medical-prices.pdf [Google Scholar]
- 28.Halpern SD. ICU capacity strain and the quality and allocation of critical care. Curr Opin Crit Care. 2011. Dec;17(6):648–57. doi: 10.1097/MCC.0b013e32834c7a53. [DOI] [PubMed] [Google Scholar]
- 29.Geruso M, Layton T. Upcoding: Evidence from Medicare on Squishy Risk Adjustment. Journal of Political Economy. 2020;128(3):984–1026. [DOI] [PMC free article] [PubMed] [Google Scholar]
Associated Data
This section collects any data citations, data availability statements, or supplementary materials included in this article.