Abstract
Nuclear receptor corepressors (NCORs) function in multiprotein complexes containing histone deacetylase 3 (HDAC3). In the liver, loss of HDAC3 causes a marked hepatosteatosis largely due to de-repression of genes involved in lipid metabolism. Here we show that adult loss of both NCOR1 and 2 (dKO) in hepatocytes phenocopied the hepatomegalic fatty liver phenotype of HDAC3 KO. In addition, dKO livers exhibited a dramatic reduction in glycogen storage and gluconeogenic gene expression that was not observed with hepatic KO of individual NCORs nor HDAC3, resulting in profound fasting hypoglycemia. This surprising HDAC3-independent activation function of NCOR1/2 was due to an unexpected loss of chromatin accessibility upon deletion of NCORs that prevented glucocorticoid receptor binding and stimulatory effect on gluconeogenic genes. These studies reveal an unanticipated, non-canonical activation function of NCORs that is required for metabolic health.
Nuclear receptors (NRs) comprise a family of transcription factors (TFs) that respond to metabolic and hormonal signals to drive transcriptional changes upon ligand binding1. In the liver, NRs are critical effectors of metabolic signaling that integrate these inputs within the nucleus, ultimately driving metabolic homeostasis through the transcriptional control of specific signal-dependent pathways2. Due to their potent transcriptional effects and ligand-inducible activation, NRs have been intensely pursued as druggable targets for the treatment of metabolic syndrome, and agonists for a number of NRs are widely used in the clinical setting3. Conversely, untoward metabolic effects of receptor agonism may limit the utility of targeting certain nuclear receptors4-6. Thus, there is a need for a deeper understanding of the mechanisms that mediate NR function to achieve metabolic balance.7
In addition to ligand-dependent activation of NRs, which is mediated by coactivators8, many NRs repress transcription in their unliganded state. Repression is mediated by the recruitment of Nuclear Receptor Corepressors (NCOR) 1 and 2 (NCOR2 is also known as Silencing Mediator of Retinoid and Thyroid receptors, or SMRT)8. NCOR1 and 2 are highly similar proteins9,10, but appear not to be redundant because germline knockout of either alone is embryonic lethal11,12 and mutations of transcription factor binding domains in each protein have distinct transcriptional and metabolic effects13-18. NCOR1 and 2 both exist in large multiprotein complexes containing stoichiometric amounts of several components including the epigenomic modulating protein Histone Deacetylase 3 (HDAC3)19-22. In the liver, the NCOR complex is recruited to the genome by NRs such as the circadian NRs REV-ERBα/β which repress anabolic lipid metabolic gene expression during the inactive phase23 and loss of function of NCOR1, HDAC3 or REV-ERBs elicits de-repression of lipogenic genes and the development of fatty liver in mice23-26.
Here, we report an unexpected function for NCORs in facilitating transcription of target genes during fasting. In addition to the de-repression of lipid metabolic gene expression in common with the loss of HDAC3, loss of NCOR1 and 2 in hepatocytes of adult mice resulted in decreased chromatin accessibility at NCOR1/2 binding sites near genes critical for maintaining blood glucose levels. The altered accessibility and decreased glucometabolic gene expression occurred at sites of GR binding, and GR binding and transcriptional activation of fasting-responsive glucoregulatory loci were dramatically reduced in livers lacking NCOR1 and 2. These data demonstrate an unanticipated HDAC3-independent activation function of NCORs that controls glucose metabolism and is critical for the physiological response to fasting.
Hepatocyte-specific knockout of Ncor1 and Ncor2 was induced in adult mice using tail vein injections of AAV8-Cre driven by the TBG promoter (Extended Data Fig. 1a), resulting in efficient knockout of Ncor1/2 (hereafter referred to as ‘dKO’) mRNA and protein in the liver (Extended Fig. 1b,c). dKO mice developed hepatomegaly despite no change in body weight by 15 days post AAV injection (Extended Fig. 1d,e) due in part to hepatocyte hypertrophy as shown by hematoxylin and eosin (H&E) staining of liver sections (Extended Data Fig. 1f). Additionally, dKO livers displayed increased staining for Sirius Red (SR), alpha-Smooth Muscle Actin (αSMA), and F4/80, consistent with the development of fibrosis and inflammation (Extended Data Fig. 1f). Together these observations support the rapid development of liver failure upon loss of NCOR1/2, and indeed analysis of serum ALT activity showed elevation by ten days post AAV injection (Extended Data Fig. 1g). This rapid and progressive liver phenotype led to decreased survival, with nearly 50% of mice failing to thrive by 40 days post AAV-injection (Extended Data Fig. 1h). Single knockout of Ncor1, Ncor2, or Hdac3 did not phenocopy the Ncor1/2 dKO (Extended Data Fig. 1i-k). Loss of any one factor resulted in minor changes in liver weight (Extended Data Fig. 1l) without statistically significant changes in serum ALT levels (Extended Data Fig. 1m) nor fibrosis/inflammation-related gene expression (Extended Data Fig. 1n) at 15 days post knockout.
Principal Component Analysis (PCA) of RNAseq in single and double KO livers revealed an impressive transcriptome reprogramming in dKO livers that was distinct from changes in the single knockout models (Fig. 1a). Interestingly, the single Ncor2 KO had little effect on gene expression, with only 9 differentially expressed genes, yet loss of both Ncor1 and 2 dramatically altered gene expression compared with the Ncor1 KO (Fig. 1b). The profound gene expression changes and progressive phenotype of the dKO relative to the lesser effects of single KOs of Ncor1 and Hdac3, and Ncor2 suggested that there are previously unrecognized transcriptional targets of NCOR1/2 that are masked in single knockouts due to compensation effects.
Figure 1. Loss of NCOR1 and 2 in hepatocytes results in severe hypoglycemia.
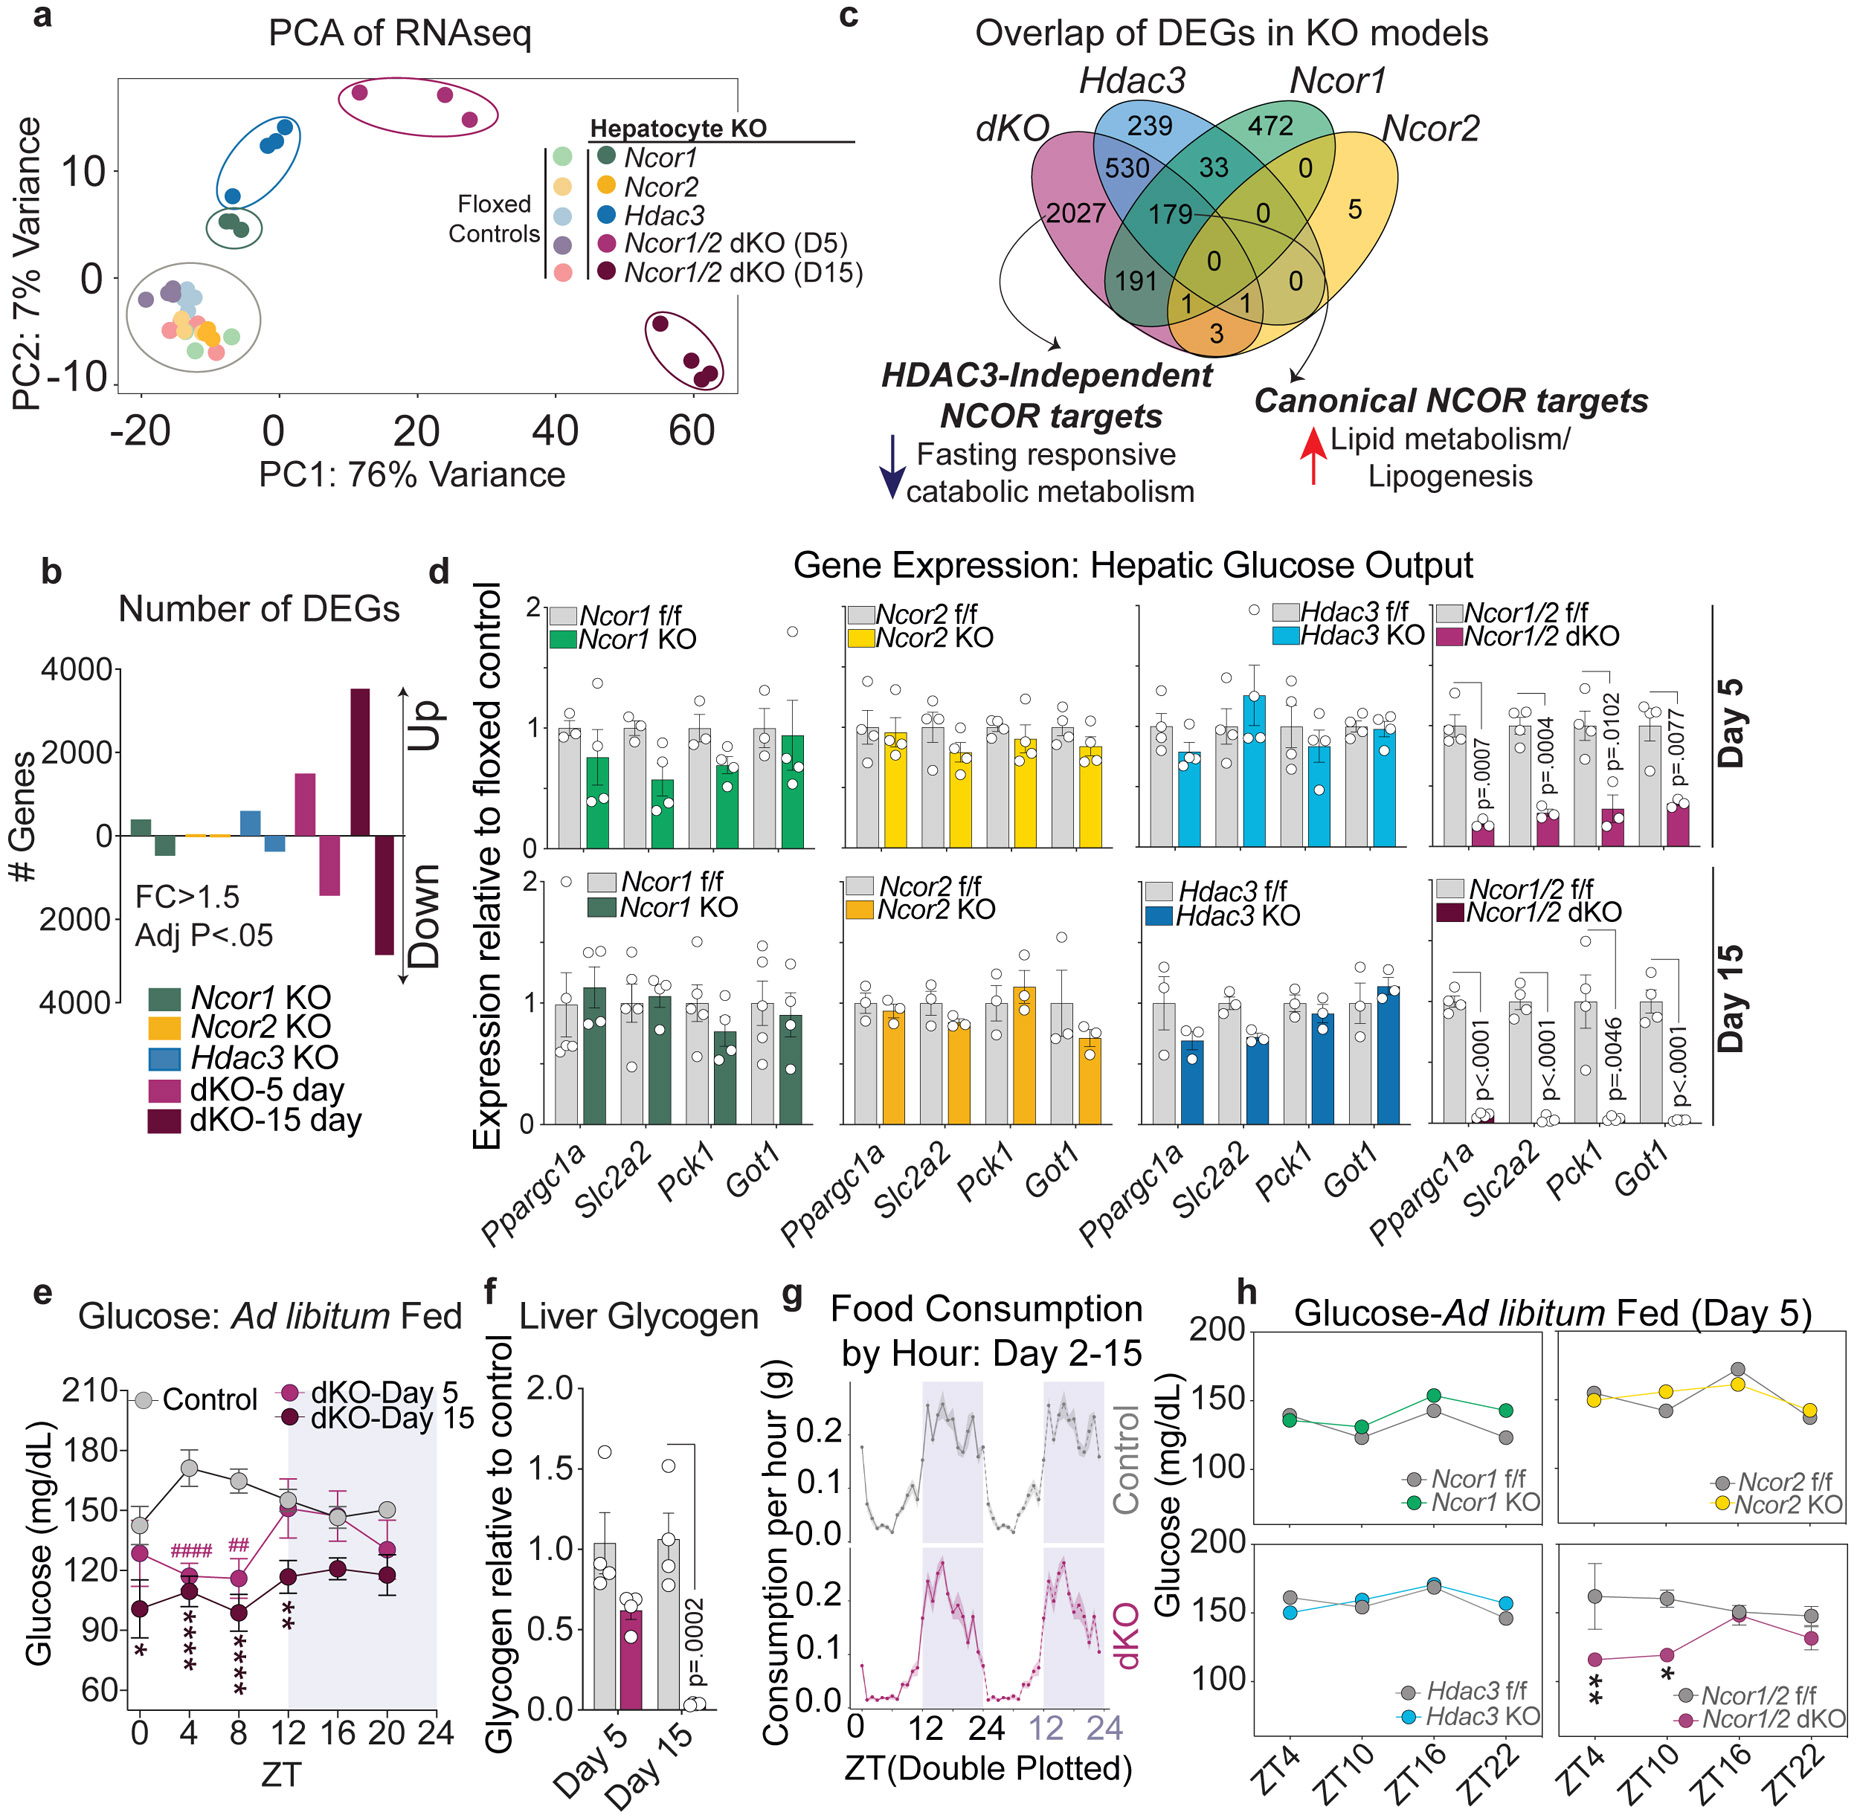
a, Principal Component Analysis (PCA) of RNAseq data from dKO (5 and 15 days post knockout) and single knockout (15 days post knockout) livers. b, Number of differentially expressed genes in each model (DEGs determined by fold change >1.5 compared to each respective floxed control and FDR< .05). Upregulated genes are indicated above the x-axis and downregulated genes are below the x-axis. c, Venn Diagram of differentially expressed genes in each knockout model (dKO: Day 5, Hdac3, Ncor1, Ncor2: Day 15). d, RT-qPCR of genes related to hepatic glucose output, relative to 36b4. Data are presented as mean values +/− S.E.M. and p-values were calculated using two-tailed unpaired student’s t-test with correction for multiple comparisons using the Holm-Šídák method. Biological replicates representing individual mice are plotted (n=3-4 mice per timepoint and genotype). e, Blood glucose levels measured every 4 hours in ad-libitum fed mice, 5 and 15 days post AAV injection. Data are presented as mean values +/− S.E.M.: Day 5 dKO, (n=5 mice), Day 15 dKO, (n=6 mice), Control Day 5 (n=5 mice), Control Day 15 (n=5 mice). Control mouse data measured at day 5 and 15 were pooled for visualization. P-values were calculated for each time point by RM two-way ANOVA with Šídák’s multiple comparisons test; (#) refer to p-values at day 5, while (*) refer to p-values at day 15. Day 5: ZT4 (p=<.0001), ZT8 (p=.0013). Day 15: ZT0 (p=.0109), ZT4 (p<.0001), ZT8 (p<.0001), ZT12 (p=.0017). f, Relative glycogen levels at ZT10 (5 PM) in dKO livers compared to controls at day 5 and day 15 post AAV injection (n=4 mice per group). Data are presented as mean values +/− S.E.M.and p-values were calculated for each time point by two-way ANOVA. g, Double-plotted mean food consumption (measured via BioDAQ) per hour for singly-housed control and dKO for days 2-15 post AAV injection (n=5 mice, shaded ribbon represents standard deviation). h, Blood glucose in ad-libitum fed mice at 4 timepoints, 5 days post AAV). The mean +/− S.E.M of the biological replicates is plotted: Ncor1 f/f (n=5 mice), Ncor1 KO (n=5 mice), Ncor2 f/f (n=3 mice), Ncor2 KO (n=3 mice), Hdac3 f/f (n=4 mice), Hdac3 KO (n=4 mice), Ncor1/2 f/f (n=3 mice), dKO (n-4 mice). p-values were calculated by RM two-way ANOVA with Šídák’s multiple comparisons test: dKO ZT4 (p=.0088), dKO ZT10 (p=.0206).
We next compared differentially expressed genes between models, with a focus on the day 5 dKO in order to define direct targets of NCOR1/2-mediated regulation and avoid secondary effects of inflammation and fibrosis in day 15 dKO livers. As expected from previous studies showing direct repression of lipid metabolism genes by NCOR1 and HDAC323,26, there was a strong overlap in upregulated genes between Ncor1, Hdac3, and dKO models (Extended Data Fig. 2a,b), and pathway analysis affirmed that these transcripts were enriched for fatty acid metabolism genes (Fig. 1c, Extended Data Fig. 2c). RT-qPCR and western blotting confirmed the de-repression of lipogenic genes in the dKO livers, similar to that of the Hdac3 KO livers and much greater than either Ncor single KO (Extended Data Fig. 2d,e). Accordingly, knockout of Hdac3 and Ncor1/2 dKO both led to Triglyceride (TG) accumulation whereas Ncor single KOs had little or no effect on hepatic TG (Extended Data Fig. 2f).
Comparison of differential expression among knockout models also revealed a large number of genes (1044) that were repressed only in the dKO livers (Extended Data Fig. 3a,b, Fig. 1c). Ontology analysis showed enrichment for genes involved in amino acid catabolism (Extended Data Fig. 3c, Fig. 1c), which is the primary pathway that feeds carbons into gluconeogenesis. Among this group were major glucoregulatory genes including Ppargc1a/Pgc1α, Pck1, Slc2a2 (Glut2), and Got1, each of which demonstrated little or no change in expression in single KOs, but a striking decrease in the dKO livers (Fig. 1d).
Given the impaired expression of hepatic glucose output-related genes, we measured blood glucose levels of single and double knockout mice. In line with the observed gene expression, ad-libitum fed dKO mice displayed hypoglycemia at 5 days post KO, which became more severe by 15 days (Fig. 1e). This effect was specific to the light (inactive) phase, when maintenance of glucose levels relies on glycogenolysis and gluconeogenesis (Fig. 1e). By day 15, glycogen stores were nearly depleted in dKO animals (Fig. 1f). Analysis of eating behavior over 15 days following AAV injection revealed no changes in feeding patterns or quantity (Extended Data Fig. 3d, Fig. 1g), confirming that the hypoglycemia was not due to hypophagia. In line with observations of other mouse models with depleted expression of gluconeogenic genes27-30, assessment of glucose and insulin tolerance by IP-GTT and IP-ITT, respectively, revealed that dKO animals exhibited increased glucose tolerance relative to control animals and no change in insulin tolerance (Extended Data Fig. 3e-h). In contrast, KO of Ncor1, Ncor2, or Hdac3 had no effect on blood glucose levels in ad-libitum fed mice at 5 days post KO (Fig. 1h) or 15 days post KO (Extended Data Fig. 3i).
We further investigated whether HDAC3 catalytic activity was required for the observed changes in glucoregulatory genes using the NSDAD mouse model, in which NCOR1 and NCOR2 are expressed at normal levels but harbor point mutations in the deacetylase activating domain (DAD) (Extended Data Fig. 4a)31. HDAC3 requires physical interaction via the DAD to actively deacetylate substrates, and thus the NSDAD model is effectively void of HDAC3 catalytic activity (Extended Data Fig. 4b). NSDAD mice exhibited no change in body weight, liver weight, or serum ALT activity compared to controls, (Extended Data Fig. 4c-e) and in line with previous studies31 lipogenic gene expression and liver TG were increased relative to controls (Extended Data Fig. 4f,g) though much more modestly than in HDAC3 KO and dKO models. Conversely, there was no change in expression of hepatic glucose output genes (Extended Data Fig. 4h) or glycogen stores (Extended Data Fig. 4i). Together, these data confirmed that NCOR1 coordinates with HDAC3 to repress lipogenic genes but revealed a surprising HDAC3-independent role for NCORs 1 and 2 in the activation of genes that contribute to glucose homeostasis in the liver.
As the dKO mice were hypoglycemic only during the light (inactive) phase but display normal feeding behavior, we wondered whether loss of NCOR1/2 resulted in an impaired transcriptional response to fasting. To test this, we fasted mice for 24 hours or fasted and re-fed for 3 hours (Fig. 2a). dKO mice exhibited hypoglycemia after four hours of fasting despite no difference in body weight between control and dKO animals (Fig. 2b,c). By contrast, NSDAD animals had no change in fasting glucose levels (Extended Data Fig. 4j). In agreement with the lower glycogen stores in ad-libitum fed dKO animals, dKO livers had lower glycogen stores following fasting and re-feeding when compared to control animals, consistent with impaired glycogen synthesis (Extended Data Fig. 5a). In contrast to the hypoglycemia observed early during fasting, we observed no difference between control and dKO animals in serum beta hydroxybutyrate (βHB), which was strongly induced by fasting and decreased following refeeding as expected (Extended Data Fig. 5b). In line with this, ketogenic gene expression was unchanged between control and dKO animals (Extended Data Fig. 5c). Similarly, hepatic free fatty acids were elevated in fasted relative to refed animals in both dKO and controls, although the dKO animals did exhibit a slight increase in FFA in the refed condition (Extended Data Fig. 5d) consistent with the de-repression of key FAO genes that are known targets of PPARA/NCOR (Extended Data Fig. 5e).
Figure 2. NCORs are required for the hepatic fasting response.
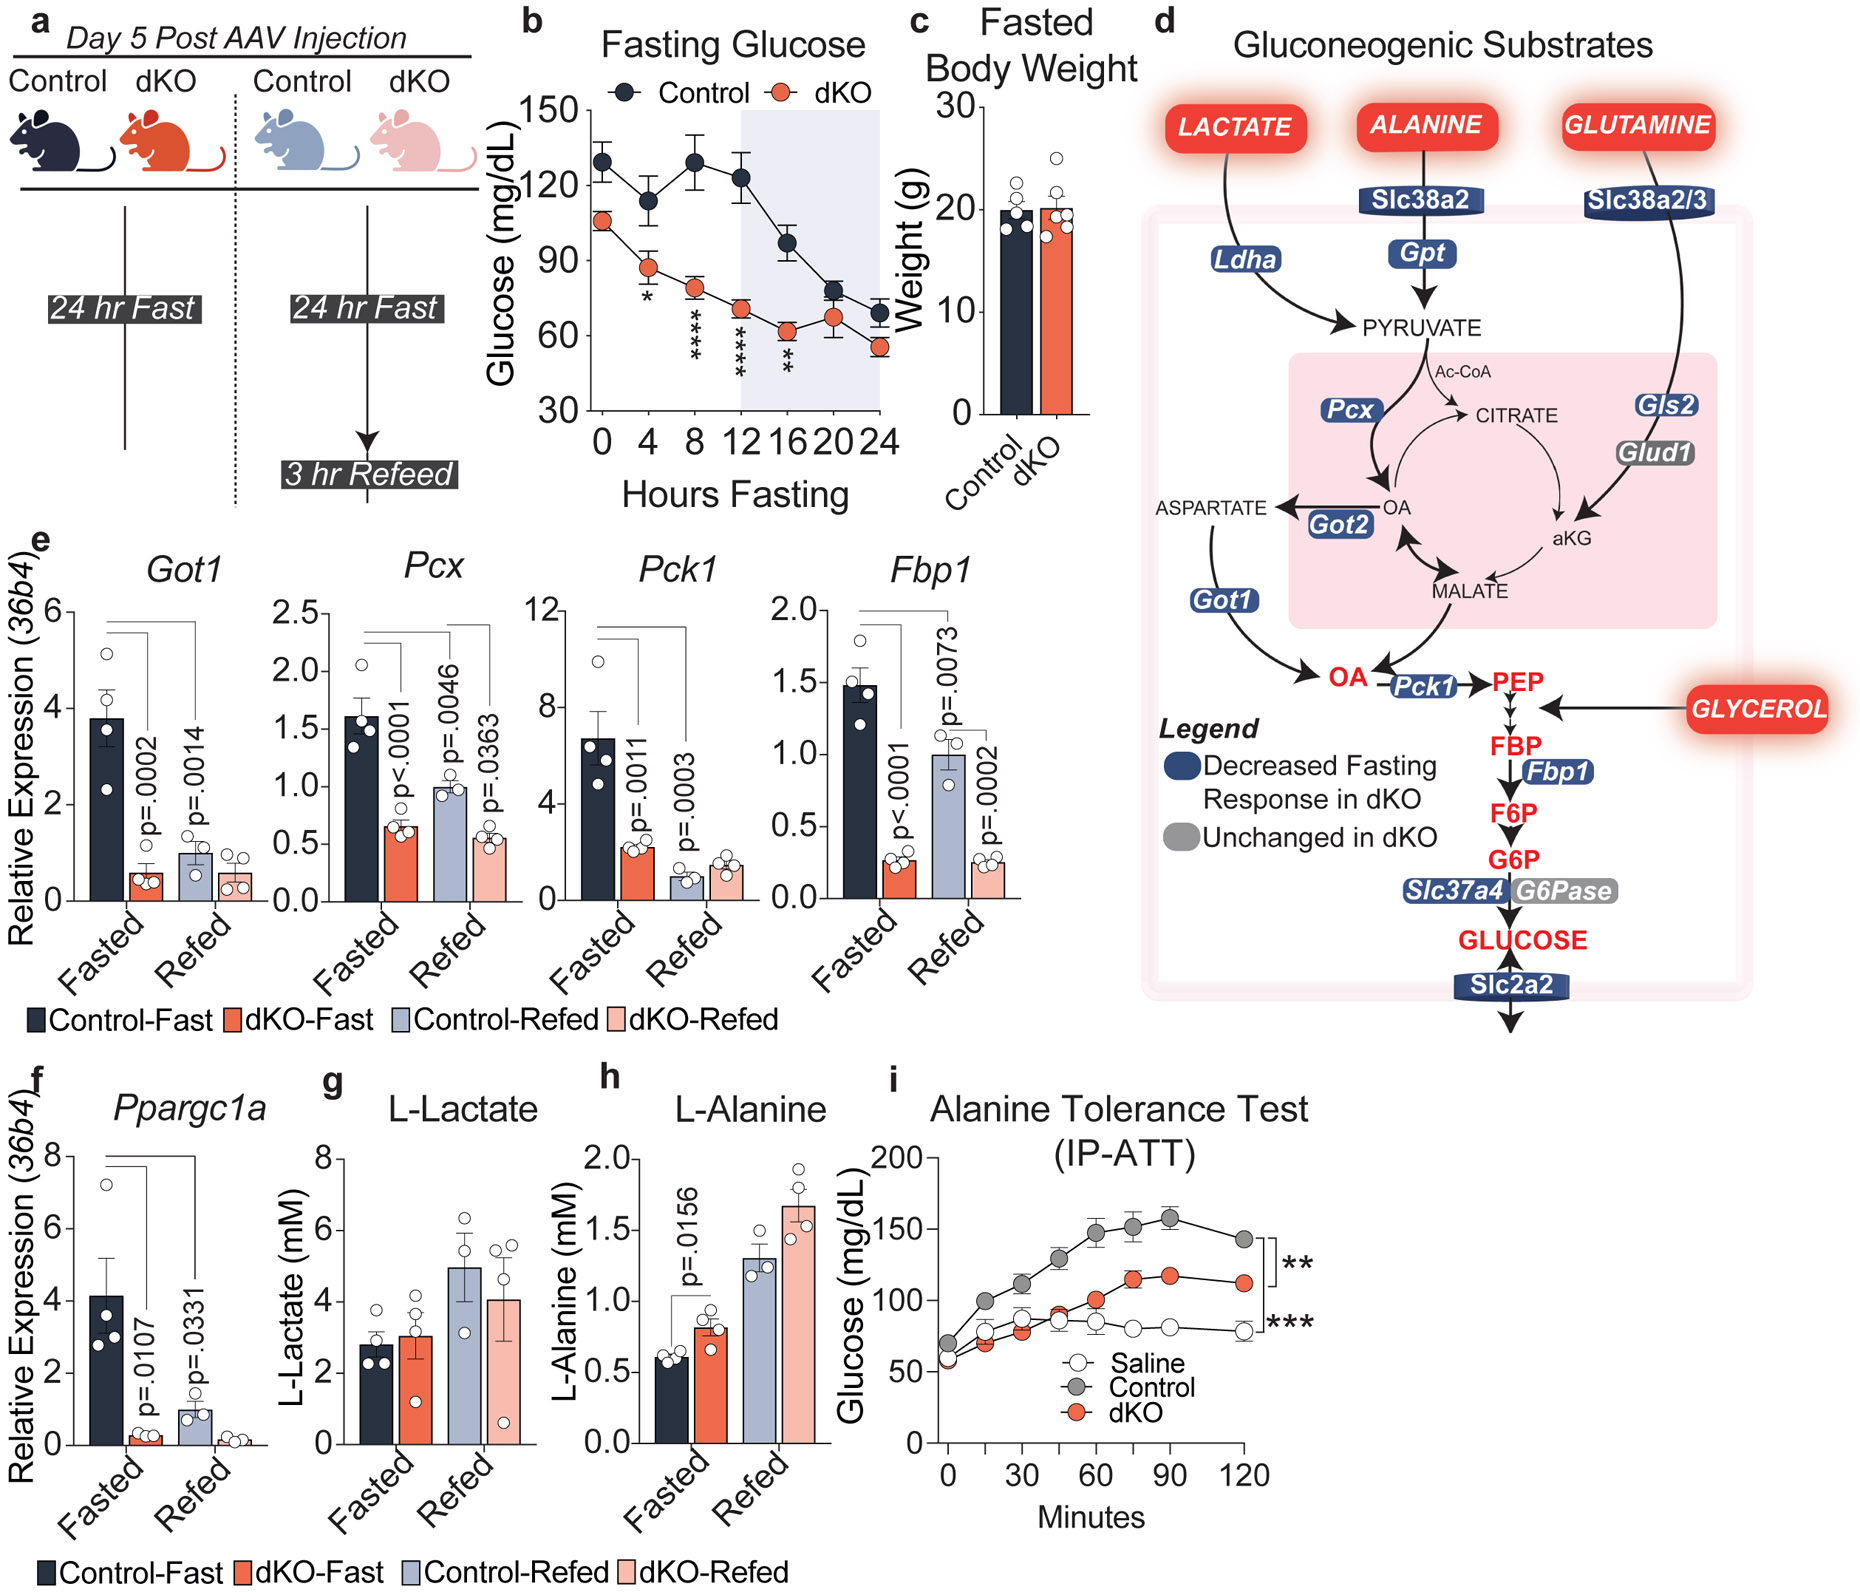
a, Experimental Design, created with BioRender.com. 5 days after AAV administration, control and dKO mice were fasted for 24 hours or fasted for 24 hours and refed for 3 hours. b, Fasting glucose throughout a 24 hour fast in control (n=6 mice) and dKO animals (n=7 mice). P-values calculated by RM two-way ANOVA with Šídák’s multiple comparisons test: (ZT4 p=.0445, ZT8 p<.0001, ZT12 p<.0001, ZT16 p=.0026). c, Body weight of 24 hour fasted animals (n=5-6 animals) d, Schematic of major substrates contributing to hepatic gluconeogenesis. All factors shown in blue exhibit impaired transcriptional response to fasting. e,f, RT-qPCR of primary gluconeogenic factors relative to 36b4. p-values were calculated by two-way ANOVA with Turkey’s test for multiple comparisons. g, Serum L-lactate levels (mM). h, Serum L-alanine levels (mM). p-values for g-h calculated by students unpaired two-tailed t-test. For panels e-h, biological replicates representing individual mice are plotted: Control-Fast (n=4), dKO-Fast (n=4), Control-Refed (n=3), dKO-Refed (n=4). i, Alanine Tolerance Test. Experiment was performed twice. Control- saline (n=5 mice), Control-Alanine (n=11 mice), dKO-Alanine (n=6 mice). Data was analyzed by two-way ANOVA (Control:dKO p=.0013, Control:Saline p=.0005). For all panels, data are presented as mean values +/− S.E.M.
As hepatic glycogen stores are depleted, the major substrates for gluconeogenesis include lactate, alanine, and glutamine derived primarily from skeletal muscle, and glycerol generated by lipolysis in white adipose tissue (Fig. 2d)32,33. dKO livers had impaired fasting-induced expression of genes encoding enzymes critical for the uptake and catabolism of lactate (Ldha), Alanine (Slc38a2/3, Gpt, Got1, Got2), and glutamine (Slc38a2/3, Gls2) (Fig. 2d, Extended Fig. 5f). In addition, fasting-induced expression of Got1, Pcx, Pck1, and Fbp1; genes encoding core gluconeogenic enzymes, was markedly impaired (Fig. 2e) as was the hepatic gluconeogenic coactivator Ppargc1α/Pgc1α (Fig. 2f). Of note, not all fasting responsive genes exhibited impaired expression; Glucose 6 phosphatase (G6Pc), and Glucokinase (Gck) exhibited normal fed/fasting expression in dKO livers (Extended Data Fig. 5g), consistent with their robust regulation by glucagon and insulin34,35. Analysis of the primary substrates that contribute to hepatic glucose output revealed that while serum levels of L-lactate were unchanged between control and dKO animals (Fig. 2g), L-alanine levels were higher in the serum of dKO animals (Fig. 2h). This suggests that dKO livers had impaired ability to uptake and catabolize alanine, the preferred amino acid substrate for hepatic gluconeogenesis36, and indeed glucose production was impaired in response to alanine administration (Fig. 2i).
Importantly, we observed a similar phenotype in female dKO mice. dKO females exhibited no change in body weight with a large increase in liver weight (Extended Data Fig. 6a,b), as well as increased lipogenic gene expression, with the exception of Cidec, and elevated hepatic TG levels (Extended Data Fig. 6c,d). Gluconeogenic gene expression and fasting glucose levels were decreased (Extended Data Fig. 6e,f) and glucose production from alanine was impaired (Extended Data Fig. 6g).
We next sought to identify the NCOR1/2-regulated enhancers that drive hepatocyte gene expression changes unique to the dKO. ATACseq analysis (Extended Data Fig. 7a) revealed thousands of sites with altered chromatin accessibility in hepatocytes from dKO livers (Extended Data Fig. 7b). Surprisingly, 44% (6756/15,440) of differential ATAC peaks were down-regulated (Extended Data Fig. 7b), and nearly half (3,175/ 6,756) of those with decreased accessibility were NCOR1/2 binding sites (Fig. 3a). Moreover, the binding of NCOR1 and NCOR2 was much greater at the sites of reduced accessibility in the dKO (Extended Data Fig. 7c). In contrast, only 8% (679/8684) of increased ATAC sites were NCOR1/2 binding sites (Fig. 3a). Presumably the altered chromatin accessibility at sites not normally occupied by NCOR1/2 reflects indirect effects of the dKO, but those remain to be determined. In addition, despite the marked reductions in chromatin accessibility at NCOR binding sites, gene expression of SWI/SNF remodelers was not down-regulated (Extended Fig. 7d), although we cannot rule out post-transcriptional regulation in the dKO.
Figure 3. Loss of hepatic NCORs results in decreased chromatin accessibility at enhancers of glucoregulatory genes.
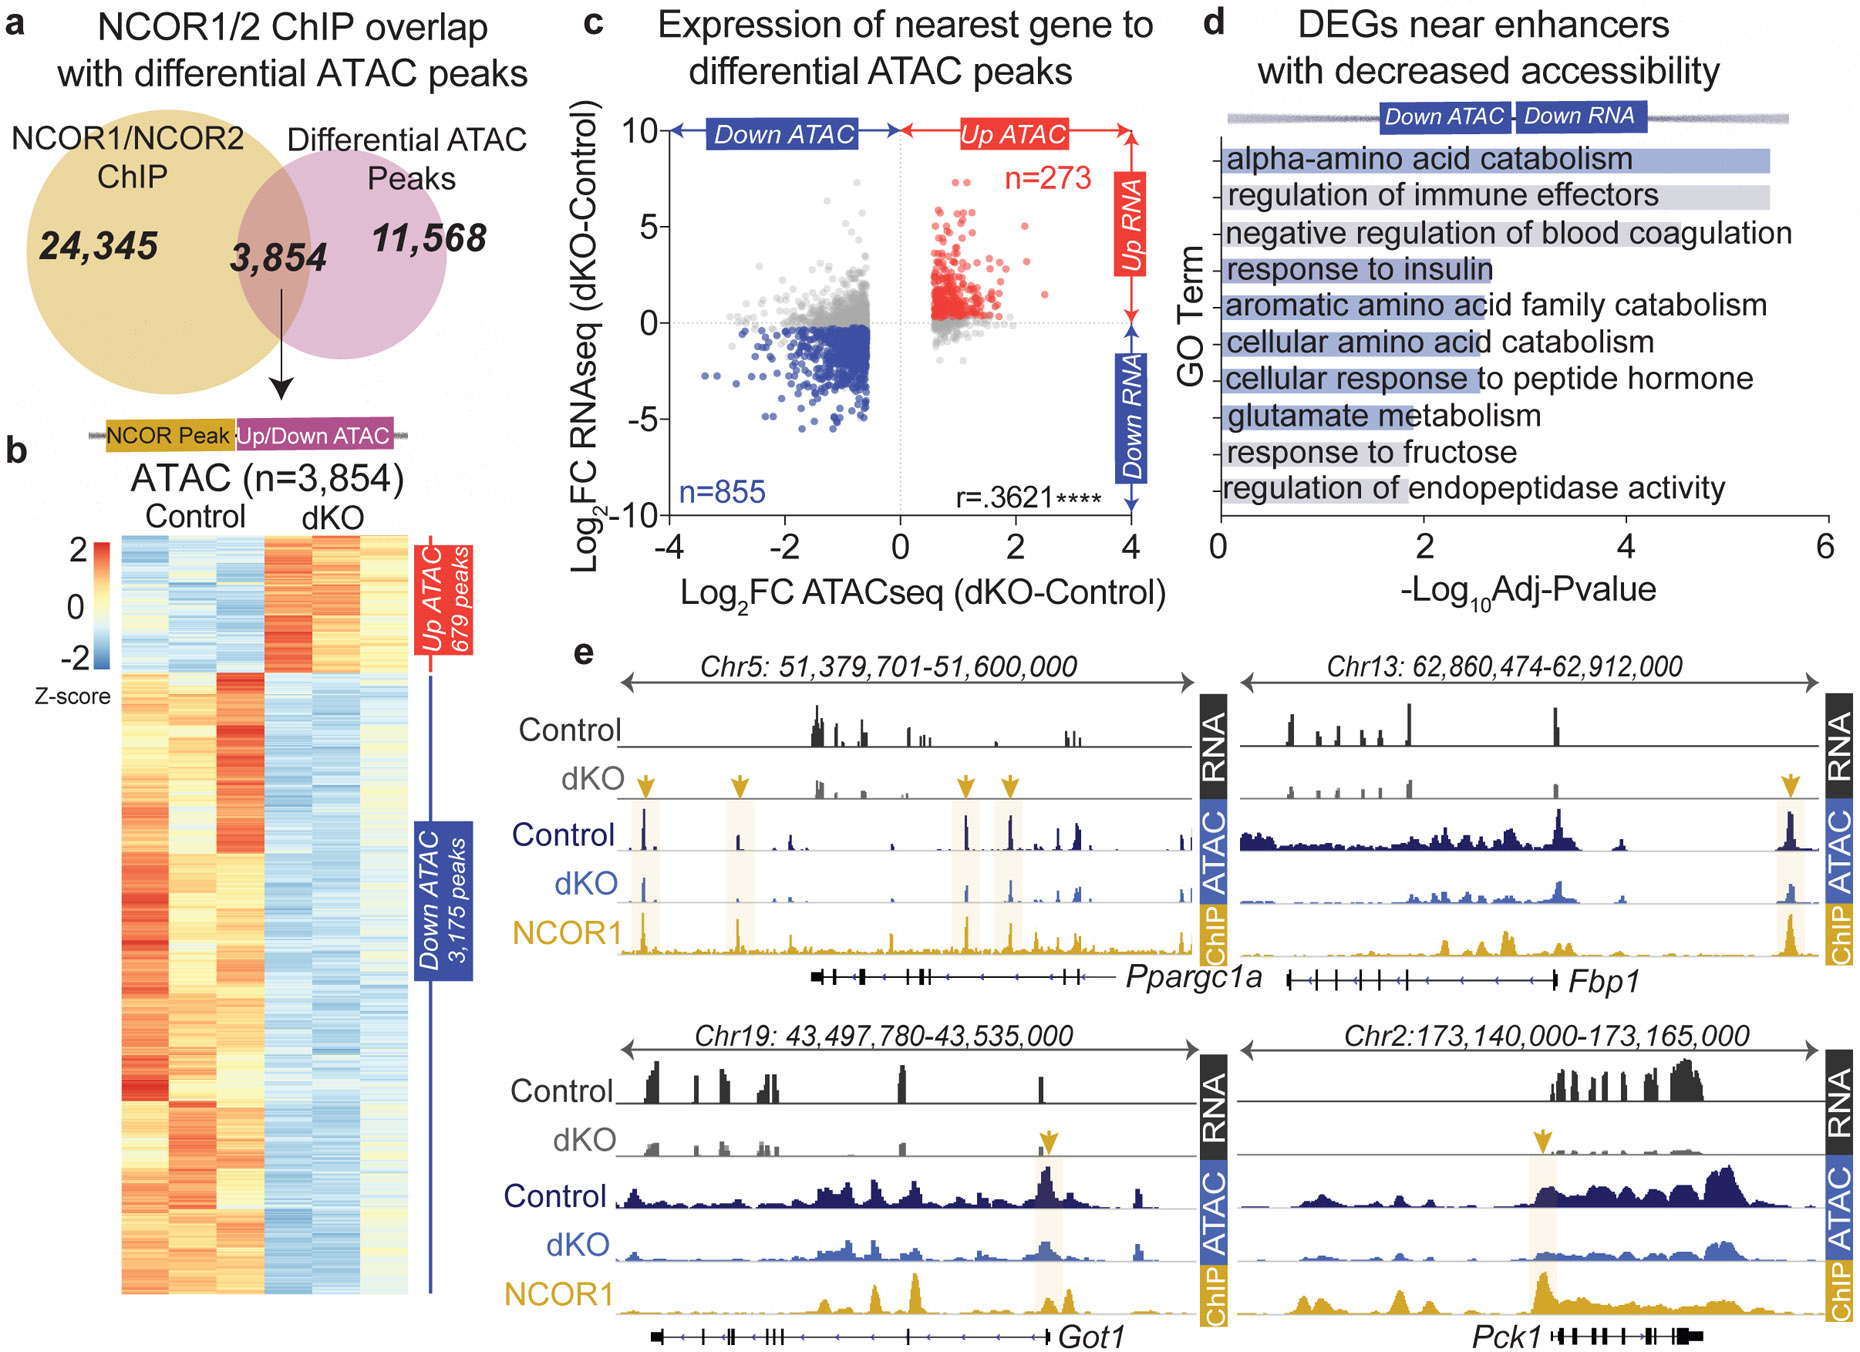
a, (upper). Venn diagram of ChIP peaks for NCOR1 (GSM647027) or NCOR2 (GSM1236494) and differential ATAC peaks (Differential ATAC peaks were filtered based on fold change>1.5 compared to control samples with FDR <.05). (lower) Z-score normalized heatmap showing ATACseq signal for genomic regions identified in Venn overlap (panel a). These correspond to 3,854 NCOR1/2 binding sites that exhibited changes in chromatin accessibility in the dKO. b, Pearson’s Correlation of RNAseq (dKO day 5) and differential ATAC peaks bound by NCOR1/NCOR2 (sites identified in Venn overlap from panel a), p<.0001. ATAC peaks were filtered with a 200kb cutoff to nearest gene and differential gene expression was filtered based on FDR<.05, FC≥1.2. c, −Log10(FDR) of Top ontology terms (GO: Biological Process) of downregulated genes nearest to the 855 enhancers bound by NCOR1/2 with decreased accessibility. d, Example tracks of loci with enhancers exhibiting decreased accessibility and decreased gene expression. RNAseq tracks (control and dKO day 5 livers, group autoscaled), ATACseq tracks (hepatocytes isolated from control and dKO day 5 livers, group autoscaled) and NCOR1 ChIPseq (control livers, ZT10, autoscaled) are shown.
Expression of the nearest gene to differential ATAC peaks bound by NCORs showed a positive correlation (Fig. 3b), and ontology analysis of differentially expressed genes close to differential ATAC peaks revealed that enhancers with increased accessibility were proximal to fatty acid metabolism and glutathione metabolism genes (Extended Data Fig. 7e), including Scd1 and Gstm2 (Extended Data Fig. 7f). In contrast, enhancers with decreased ATAC signal were enriched for pathways that contribute to hepatic gluconeogenesis including amino acid catabolism (Fig. 3c). Indeed, genes including Ppargc1a/Pgc1a, Fbp1, Got1, and Pck1 (Fig. 3d) all had enhancers bound by NCOR1/2 with decreased ATAC signal in the dKO. These data suggest that loss of NCOR1/2 results in decreased accessibility at specific sites and are required for selective activation of gene expression at enhancers of glucoregulatory genes.
We next sought to identify factors that coordinate gene expression from these sites with NCOR1/2. Query of existing liver/hepatocyte cistromes in Cistrome DB revealed that NCOR1/2 sites with increased accessibility were also bound by HDAC3 and nuclear receptors including REV-ERBα/β (Extended Data Fig. 7g), consistent with the previously described functions of these factors in the repression of hepatic lipogenesis23. NCOR1/2 sites with decreased accessibility were strongly enriched for binding by the Glucocorticoid Receptor (GR, also known as NR3C1) (Fig. 4a). Indeed, over 50% of down ATAC peaks localized to GR binding sites, whereas only 8% of up ATAC peaks were at GR binding sites (Fig. 4b). Analysis of other fasting-induced transcription factors including CREB and PPARα revealed much lower overlap (5% and 21%, respectively) (Extended Data Fig. 7h). Together, these data show that NCORs are required for chromatin accessibility at GR binding sites.
Figure 4. NCORs are required for GR transcriptional activity and selective binding at NCOR1/GR co-bound sites.
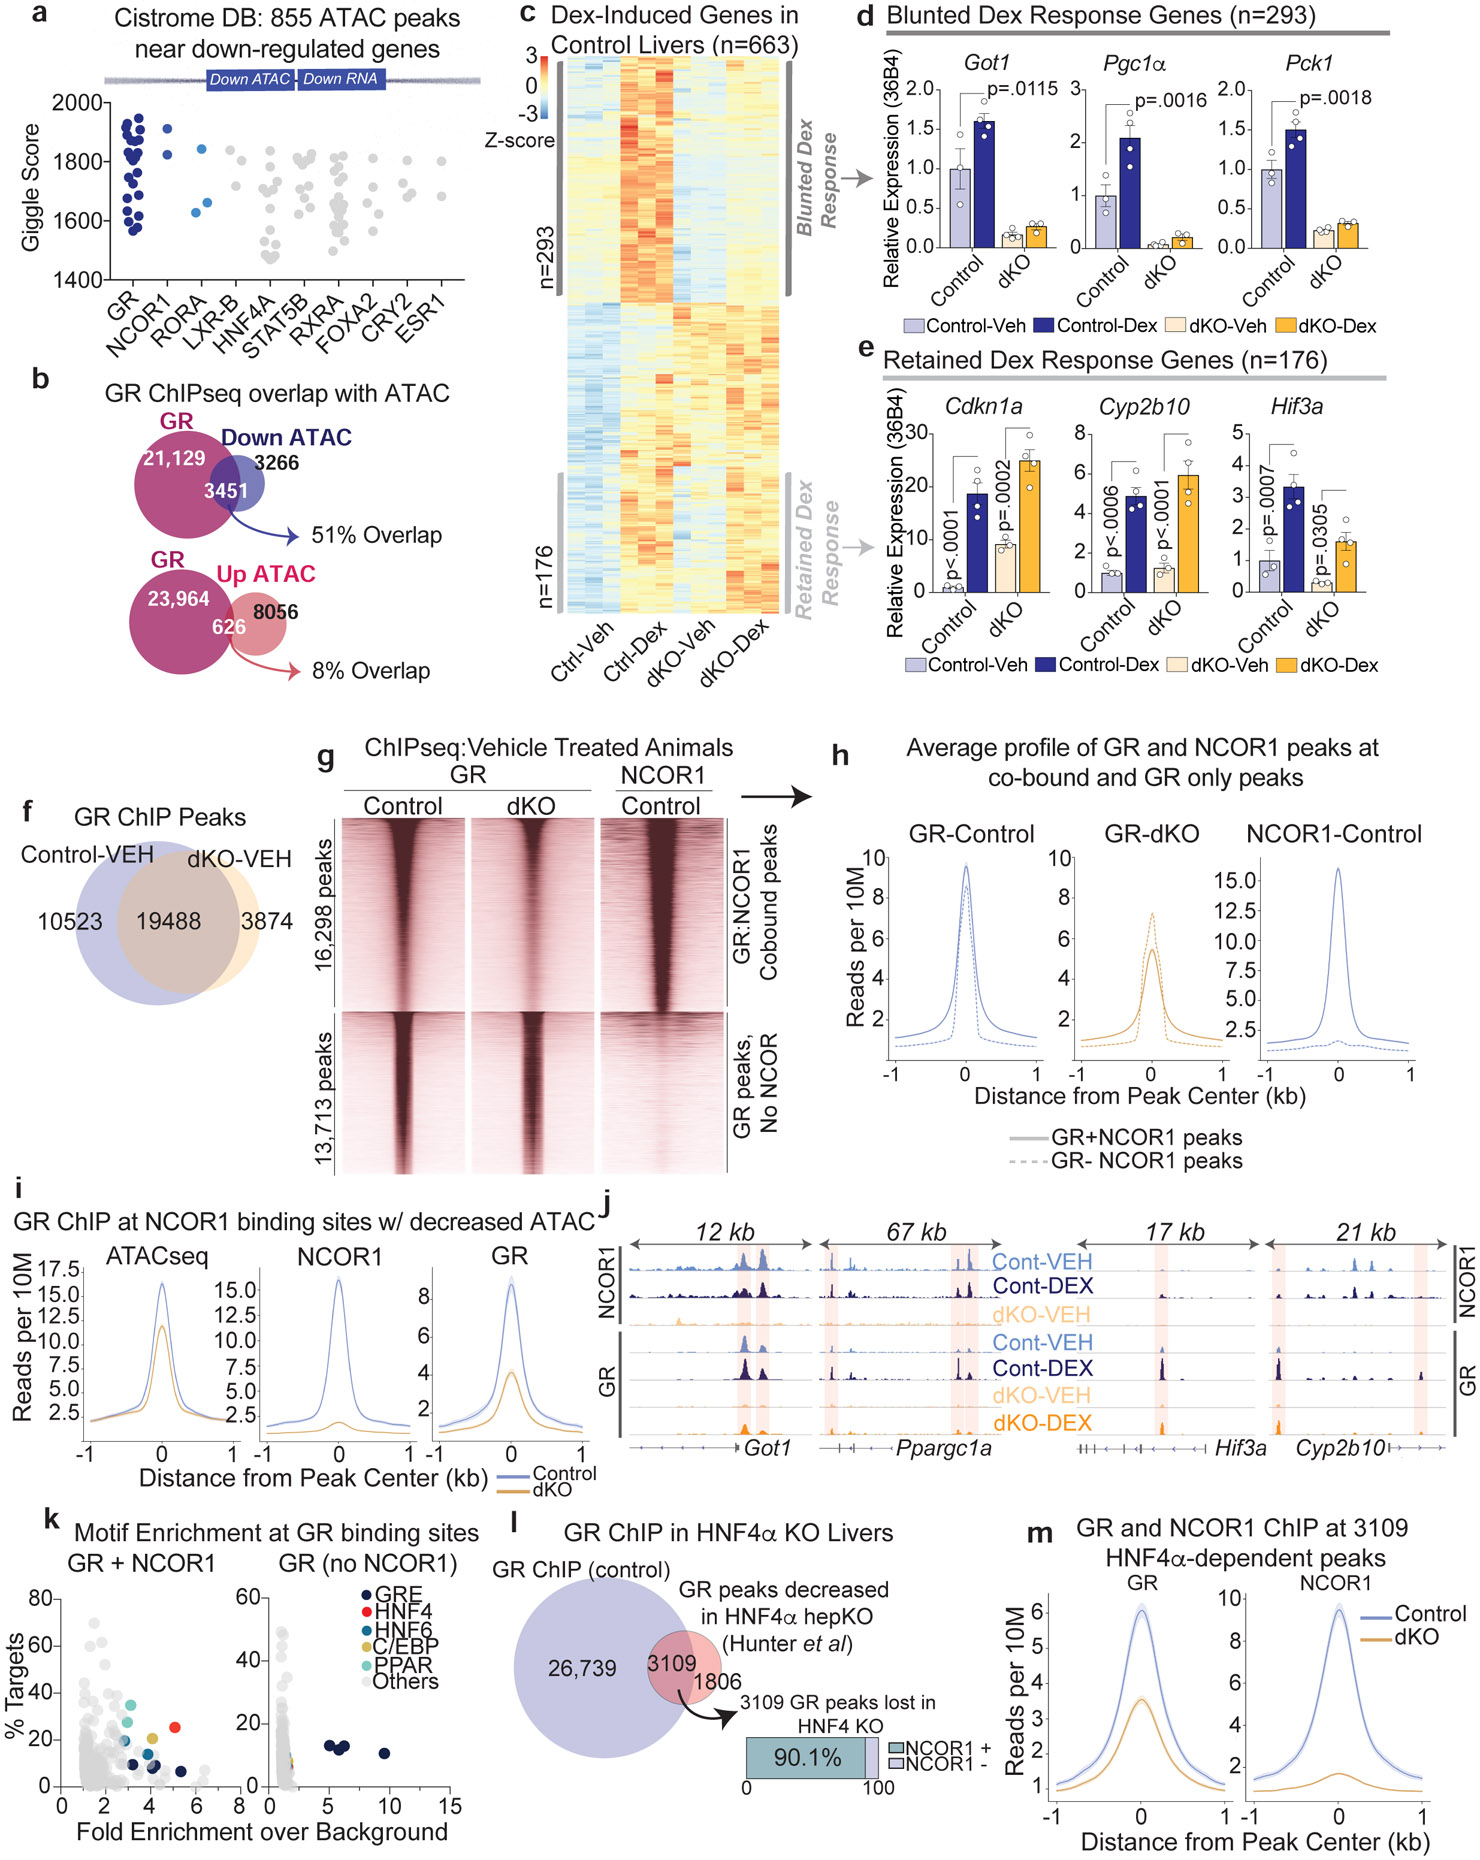
a, Top 10 factors, ranked by Giggle Score, with overlapping cistromes compared to the 855 NCOR1/2-bound ATAC peaks near downregulated genes. b, Venn diagrams showing overlap of peaks between Liver GR ChIPseq at ZT10 (GSE45674) and differential ATAC peaks between control and dKO hepatocytes. c, Z-Score normalized heatmap of all genes induced by Dex treatment in control mice. Dex-induced genes were filtered based on a fold change >1.5 in Control, Dex-Treated animals compared to Control, Vehicle treated animals, with FDR cutoff <.05., n=3 mice for all experimental groups. d, RT-qPCR of example genes exhibiting a blunted Dex responsiveness: Ppargc1a, Got1, Pck1. Data represented as mean +/− S.E.M with p-values calculated by two-way ANOVA. Biological replicates are plotted: Control-Veh (n=3 mice), Control-Dex (n=4 mice), dKO-Veh (n=4 mice), dKO- Dex (n=3 mice). e, RT-qPCR of example genes exhibiting retained Dex responsiveness: Cdkn1a, Cyp2b10, Hif3a. Data represented as mean +/− S.E.M with p-values calculated by two-way ANOVA. Biological replicates are plotted: Control-Veh (n=3 mice), Control-Dex (n=4 mice), dKO-Veh (n=3 mice), dKO-Dex (n=4 mice). f, Overlap of GR ChIP peaks identified in Control and dKO animals treated with Vehicle. g, Heatmap showing all GR peaks in vehicle treated animals sorted by NCOR1 co-occupancy. h, Average profiles of GR and NCOR1 peaks at GR:NCOR1 cobound sites and GR only sites. Shading indicates 95% confidence interval. i, Average profile of GR ChIPseq at sites identified as NCOR1 binding sites with decreased accessibility. Shading indicates 95% confidence interval. j, Example ChIP tracks for GR and NCOR1. All GR and all NCOR1 tracks are group autoscaled. k, Motif enrichment at GR binding sites (all identified motifs). X-axis represents fold enrichment over background and y-axis indicates the percent of all queried sites with that motif. l, Comparison of HNF4α-dependent GR peaks (GR peaks lost in HNF4α knockout, Hunter et al) with NCOR1 ChIP. m, Average GR ChIP Profile at sites identified by Hunter et al as HNF4a-dependent. Shading indicates 95% confidence interval.
GR is widely recognized as a critical effector of the fasting response in both rodents and humans37, and previous knockout studies demonstrate that loss of GR in mice results in depleted glycogen stores, impaired gluconeogenic gene expression, and fasting hypoglycemia29,38-40. Overlap of liver transcriptomes from hepatocyte-specific GR-KO mice38 with those of dKO livers revealed that genes down regulated in both models were enriched for glucose metabolism and amino acid transport/catabolism, including Ppargc1a (Pgc1α), Pck1, Got1, and several AA transporters (Extended Data Fig. 7i). Thus, we next tested whether GR function was impaired in the dKO livers.
To test GR function, control and dKO mice were treated with the powerful synthetic glucocorticoid dexamethasone (Dex), and livers were subjected to GR and NCOR1 ChIPseq and transcriptomic analysis (Extended Data Fig. 8a). Serum corticosterone (Extended Data Fig. 8b) and nuclear GR and phospho-GR protein levels (Extended Data Fig. 8c) were similar between control and dKO animals, yet 44% (293/663) of Dex-responsive genes exhibited a blunted response in the dKO (Fig. 4c,d). By contrast, a subset of genes unrelated to glucose metabolism retained their glucocorticoid-responsiveness in the dKO livers (Fig. 4c,e). Determination of the GR cistromes revealed that GR binding at sites where NCOR1 was also bound was markedly decreased in the dKO (Fig. 4f,g), whereas little change in GR binding was noted at sites where GR bound independently of NCOR1 (Fig. 4h). This was the case in both vehicle-treated and Dex-treated animals (Extended Data Fig. 8d), likely because the study was performed during the light phase (ZT10) when endogenous corticosterone levels are relatively high and at which time previous studies have also demonstrated robust GR binding to the genome41.
Integrated analysis of the GR cistromes with ATACseq in control and dKO animals revealed that NCOR1 binding sites with decreased accessibility exhibited a clear loss of GR binding in dKO animals relative to controls (Fig. 4i). Similarly, sites that lost Dex-induced binding were enriched for NCOR1 binding compared to those that retained Dex-responsiveness (Extended Data Fig. 8d). Sites of lost GR binding included enhancers for genes with lost Dex-responsiveness, including Got1 and Ppargc1a while GR sites with retained responsiveness included enhancers for genes that maintained Dex-induced expression including Cy2b10 and Hif3a (Fig. 4j). In addition, fasting-induced GR binding was impaired at the enhancers for Got1, Ppargc1a, and Pck1 (Extended Data Fig. 8e).
Analysis of GR binding sites that were lost in the dKO livers revealed an enrichment for motifs bound by nuclear receptor HNF4α (Fig 4k, Extended Data Fig. 8f), which has extensive binding overlap with the NCOR complex42 and is required for GR binding at many sites in the liver, especially those sites lacking strong GRE motifs43. Indeed, over 90% of HNF4α-dependent GR binding sites43 were also bound by NCOR1 (Fig. 4l), and GR binding at these sites decreased in the dKO livers (Fig. 4m). Together these data suggest that NCOR1/2 is required for GR recruitment and function at these HNF4α sites.
DISCUSSION
Corepressor complexes are primary effectors of NR action, and their recruitment and activity are essential for metabolic homeostasis through the transcriptional response to endocrine and metabolic signals. Here we identified a surprising function for NCOR1 and 2 in facilitating GR genomic binding in response to glucocorticoid and the resultant transcriptional activation of gene targets. Loss of NCOR1/2 caused decreased chromatin accessibility at enhancers of GR target genes, including those responsible for driving hepatic glucose output during fasting, ultimately leading to the impaired ability to defend blood glucose during the inactive phase.
NCORs were originally identified on the basis of their binding to unliganded NRs to effect transcriptional repression44-46 and the discovery of their intimate association with HDAC3 provided a compelling molecular mechanism20-22. Here, we confirmed this canonical repressive function of the complex in the liver, and showed that loss of NCOR1, HDAC3 or both NCOR1/2 in hepatocytes leads to depression of lipogenic genes and steatosis.
Interestingly, loss of NCOR2 had negligible effects on the transcriptome, indicating that it is not required for repression of lipid metabolism. Indeed, it has been challenging to tease apart contributions of NCOR1 and NCOR2, as both exist in similar complexes, yet each is essential during development11,12. Here, despite the minimal effect of the single hepatic NCOR2 KO, there was a dramatic transcriptional shift upon loss of both NCORs, with most differentially expressed genes being uniquely altered in the dKO. In line with this, while inducible, global KO of NCOR1/2 results in lethality just days post KO, single KOs had no effect on lifespan47. Of note, neither mice with mutations in NCOR1/2 that prevent interaction with HDAC348 nor mice lacking NCOR2 in the liver and expressing only a truncated NCOR1 lacking several nuclear-receptor interaction domains16 exhibit the changes in glucose metabolism observed here upon loss of both NCOR1/2. Taken together, the data suggest that in liver, NCORs redundantly control a large number of genes independently from HDAC3, and this likely occurs via a mechanism that does not require the C-terminal nuclear-receptor interacting domains.
The markedly reduced expression of genes involved in hepatic glucose output (encompassing amino acid catabolism, hepatic gluconeogenesis, and hepatic glucose export) in the NCOR1/2 dkO livers stands out both because of the unexpected direction of their regulation upon loss of the corepressors and because disruption of these pathways has not been observed with deletion of other components of NCOR complexes including HDAC325, GPS249, and TBL150. Many of these genes are normally induced robustly by fasting, and the loss of their fasting response in the NCOR liver dKO mice led to a pronounced inability to defend blood glucose in the absence of food. This direct regulation of gluconeogenic gene expression contrasts with the indirect role of HDAC3 in regulation of substrate availability due to a massive increase in lipid storage25.
Integrative functional genomics revealed loss of open chromatin at enhancers co-bound by NCOR1/2 and GR at the glucoregulatory genes whose expression was abrogated in the NCOR1/2 dKO. Many of these sites are also bound by HNF4α, and the requirement for HNF4a and NCOR1 helps explain the functional selectivity of these sites for GR binding and regulation of gluconeogenic gene expression43,51.
Several recent studies have identified activation functions of the NCOR complex in other tissues, including mechanisms that require HDAC3 activity in brown adipose tissue and osteoclasts52,53 as well as potential HDAC3-independent roles in monocyte/macrophages54. However, to our knowledge the present findings represent the first observation that loss of a co-repressor negatively impacted chromatin accessibility and nuclear receptor binding. It remains to be determined precisely how NCORs impact accessibility and whether this mechanism pertains to tissues other than the liver. Nevertheless, this work identifies the non-canonical activation of gluconeogenesis in liver by NCOR1/2 as a critical regulator of the fasting response that may also be a target for remediation of the hyperglycemic side-effects of pharmacological glucocorticoid therapy6.
METHODS
Animals
All mouse experiments were performed according to Institutional Animal Care and Use Committee at the University of Pennsylvania specifications (IACUC protocol 803640) in a temperature and humidity controlled facility at 22°C with 12:12-hour light-dark cycle (lights on 7 AM, lights off 7 PM). Adult male mice between the ages of 8-12 weeks, fed ad libitum on a normal chow diet (LabDiet 5010) were used for all experiments unless otherwise indicated. Specific experiments were repeated in female mice as indicated. All strains were maintained on a C57Bl/6J background. Ncor1 floxed mice were originally obtained from MCI/ICS (Mouse Clinical Institute-Institut Clinique de la Souris, Illkirch-Graffenstaden) and characterized previously24. Ncor2 floxed mice were obtained from Dr. Ronald Cohen (U Chicago) and crossed to Ncor1 floxed mice to obtain Ncor1/2 floxed mice. Hdac3 floxed mice were generated by the Lazar lab and characterized previously23,55. All floxed models are maintained on a C57Bl/6J background. Mice were injected intravenously with 1.5 x 10¹¹ GC/mouse of AAV8-TBG-eGFP (negative control) or AAV8-TBG-CRE (hepatocyte knockout). Mice were sacrificed at ZT10 (5 PM) 5 days post AAV injection or 15 days post AAV injection as indicated. Floxed mice from the same strain and injected with AAV8-TBG-eGFP were used as negative controls in every experiment. NSDAD mice were generated previously31 and maintained on a C57Bl/6J background.
Feeding Behavior Measurement and Analysis
Feeding behavior was monitored using the BioDAQ Food and Water intake monitoring system (Research Diets, Inc.). Male mice were injected with either AAV-TBG-eGFP or Cre as described above followed by single housing with ad libitum access to food and water in the the BioDAQ system. Mice were acclimatized for 48 hours before data collection of feeding behavior began and continued for 13 days. For each mouse, feeding activity (consumed grams) was binned hourly, and an average profile was generated by calculating the mean consumption at each hour over the 13 days recorded.
Fasting studies
At the beginning of a fast, mice were moved into new cages equipped with ALPHA-dri bedding, free access to water, but no food. Animals were fasted for 24 hours and either euthanized or refed by reintroduction of chow diet to the cage for three hours.
Histology and Immunohistochemistry
Freshly isolated liver was fixed in 4% paraformaldehyde (Thermo Fisher Scientific, AAJ19943K2) for 24-48 h at 4°C and dehydrated prior to embedding in paraffin. Embedded liver was sectioned at a thickness of 5 μm. Hematoxylin and eosin stain was applied by the Institute for Diabetes, Obesity, and Metabolism Histology Core according to the manufacturer’s instructions. Picrosirius red staining was performed using a picrosirius red stain kit (Polysciences, Inc., 24901) according to the manufacturer’s protocol. For immunohistochemistry, anti-α-SMA (DAKO, M0851) and F4/80 (cell signaling technology, 70076) antibodies were used. Signals were amplified by Histofine Simple Stain Mouse MAX PO (Nichirei Bio Sciences, 414311 or 414321) and color was developed by DAB. Sections were counterstained with hematoxylin.
Glucose, Insulin, and Alanine Tolerance Testing
For IP-GTT, mice were fasted overnight and administered an intraperitoneal (IP) injection of 2 mg/kg glucose. Blood glucose was measured by tail bleed every 15-30 minutes for two hours post injection. For IP-ITT, mice were fasted for 6 hours and administered an IP injection of .5U/kg insulin followed by monitoring of blood glucose for two hours. For both GTT and ITT cohorts, mice were assayed at 5 days post knockout and again at 15 days post dKO. For Alanine tolerance, 5 days post AAV-injection mice were fasted for 20 hours, followed by an intraperitoneal (IP) injection of 2 g/kg L-alanine (Sigma A7627) or saline control at ZT6 (1PM). Blood glucose was measured by tail bleed every 15-30 minutes for two hours post injection.
Dexamethasone Administration
5 days post AAV-injection, male mice were injected with 1 mg/kg water soluble Dexamethasone (Millipore D2915) at ZT8 (3 PM). 2 hours later, mice were sacrificed, and tissues were frozen for RNAseq and ChIPseq analysis.
Blood and Serum Measurements
Contour Next Glucometers, Lactate Plus lactate meter, and the Precision Xtra blood ketone meter were used to measure blood glucose, lactate, and βHB respectively, by tail bleed during indicated experiments. For corticosterone measurements, blood was collected and serum prepared at four timepoints starting at ZT4 on day 5 post AAV-injection. Corticosterone levels were measured by ELISA (Cayman Chemical-#501320). Serum ALT activity (LS-Bio LS-K38-100) was measured from mice sampled serially at 0, 5, 10, and 15 days post AAV injection. Serum prepared from blood collected at the time of sacrifice was used for L-alanine (abcam 83384) measurements.
Triglyceride, Free Fatty Acid, and Glycogen Measurements
Flash frozen tissue was homogenized according to kit procedure and assayed for hepatic triglyceride levels (StanBio 2100-430), free fatty acids (Abcam 65341) and glycogen (Cayman Chemicals, 700480).
Western Blotting
Whole cell lysates were prepared by homogenizing snap-frozen liver samples in modified RIPA buffer containing 150 mM NaCl, 50 mM Tris pH 8.0, 0.5% Sodium Deoxycholate, 1.0% NP-40, and 5 mM EDTA, and 1 mM PMSF using a TissueLyser (Qiagen). SDS was added to a final concentration of .2% and samples were briefly sonicated using a probe sonicator. For preparation of nuclear lysates, livers were homogenized with glass/glass dounce homogenizers in nuclear isolation buffer containing 50 mM HEPES-KOH, pH 7.5, 140 mM NaCl, 1 mM EDTA, 10% Glycerol, 0.5% NP-40, 0.25% Triton X-100, and protease/phosphatase inhibitors. Nuclei were recovered by differential centrifugation and supernatant was retained for the cytoplasmic fraction. Nuclei were washed with wash buffer (10mM Tris-HCl, pH 8.0, 200 mM NaCl, 1 mM EDTA, 0.5 mM EGTA) followed by lysis and sonication in lysis buffer containing 10 mM Tris-Cl, pH 8.0, 100 mM NaCl, 1 mM EDTA, 0.5 mM EGTA, 0.1% Na-Deoxycholate, 0.1% SDS, 1% Triton X-100 and protease/phosphatase inhibitors. Protein concentration was measured via BCA assay (Thermo Scientific) and lysates were prepared for SDS-PAGE with Laemmli Buffer (BioRad). Proteins were resolved by SDS-PAGE, transferred to PVDF via wet-transfer, and blotted for proteins of interest using the following antibodies: NCOR1 (Cell Signaling 5948S), NCOR2 (Millipore Sigma 06-891), HDAC3[EP426Y] (Abcam 76295), GR[G-5] (Santa Cruz-393232), p-GR (Thermo Scientific, PA5-17668), CD36 (Cell Signaling 74002S), CIDEC(Abcam 198204), PLIN2 (Proteintech 15294-1-AP), SCD1(Thermo Scientific PA5-17409), GAPDH (Cell Signaling, 2118S), TBP (Abcam 63766), VINCULIN[hVIN-1] (Millipore Sigma V9264), Anti-Rabbit IgG-HRP (Cell Signaling 7074S), Anti-Mouse IgG-HRP (Cell Signaling 7076S), Donkey-Anti-Mouse IRDye 800CW (Licor 926-32212). Blots were imaged using the ChemiDoc Imaging System (BioRad) and LICOR Odyssey Clx.
RT-qPCR and RNAseq
Total RNA was isolated from liver using Trizol (Invitrogen) and RNeasy Mini Kits with DNAse treatment (Qiagen). Reverse Transcription was carried out with the High-Capacity RT kit (Thermo Fisher Scientific). Quantitative PCR was performed on a QuantStudioTM 6 Flex Real-Time PCR instrument with SYBR Green (Thermo Fisher Scientific). Ribosomal transcripts 36b4 and 18s were used as housekeeping controls in all experiments. Primers for specific transcripts are indicated in Supplementary Data Table 1. For RNAseq, libraries were prepared from total RNA from 3-4 individual mouse livers and sequenced by Novogene. For RNA-seq analysis, we applied the community-currated nf-core/rnaseq V 3.5 pipeline for cutadapter, read alignment to mm10 using STAR aligner, read counts and quality control of results. Differential gene analysis was performed in R V4.1.3 using Deseq2 V1.34.0. Fold change greater than 1.5 versus floxed control with an adjusted p-value of less than .05 was applied as the cutoff for differentially expressed genes. pheatmap V1.0.12 was used for heatmap visualization. Previously published RNAseq data from GR knockout livers at ZT10 (GSE17372338) was reanalyzed using the same pipeline. Ontology analysis was performed with Enrichr56-58 and pathways with and adj p-value <.05 were considered significantly enriched. Upset plot was generated in R by determining, for each gene differentially expressed in any of the indicated datasets, in which dataset(s) the gene is differentially expressed and in what direction. For genes differentially expressed in more than one dataset, only those that were differentially expressed in the same direction were plotted.
ATACseq
Livers were snap frozen in liquid nitrogen, and nuclei were isolated by dounce homogenization followed by centrifugation on an iodixanol gradient, as previously described59. Nuclei were resuspended in FACS buffer (1% BSA in PBS) at 5 x 10⁶/mL and stained with anti-HNF4A primary antibody (Thermo Fisher Scientific MA1-199 [Clone K9218]) at 1:100 for 30 mins on ice. Antibody was washed off, and nuclei were incubated in secondary antibody (donkey-anti-mouse AF647) for 20 mins on ice, before being washed and resuspended in FACS buffer with DAPI at 1:1000. 50 x 103 HNF4A+ DAPI+ nuclei were sorted on a BD Influx. ATAC libraries were prepared following the Omni-ATAC protocol59 with AMPure beads for size selection60.
ATAC-seq raw data were preprocessed using nfcore/atacseq V1.2.2 with default parameters. Trim-galore V0.6.4 was used to remove the adapters, trimmed reads were mapped to mm10 using BWAMEM v0.7.17, Picard MarkDuplicates v2.23.1 was used to mark the duplicates reads, and duplicated and multimapping reads were filtered using the Samtools v1.10. Homer V4.11 was used to make tag directories of filtered bam using makeTagDirectory command with default parameters, findPeaks command with parameter -style factor was used to call peaks. Homer mergePeaks command was used to merge all peaks for downstream analysis. Consensus peaks were selected if peaks co-localized in at least two replicates out of three. AnnotatePeaks command with option -raw was used to calculate the mapped tag counts matrix for differential peak analysis and visualization. Deseq2 V 1.34.0 based on R V4.1.3 was used for differential peaks analysis. Pheatmap V1.0.12 was used for heatmap visualization.
GIGGLE score calculation
To screen for transcription factors that bound to specific subsets of differentially expressed ATAC peaks, Cistrome Data Browser61,62 was used. Peak coordinates were used as input and queried against previously published hepatocyte/liver cistromes.
ChIPseq and ChIP-qPCR
For chromatin immunoprecipitation, livers were minced in PBS containing 1% formaldehyde and rotated end-over-end at room temperature for 20 minutes. Samples were then quenched with glycine, washed with PBS, and dounce homogenized in ChIP buffer (50 mM HEPES pH 7.4, 1.1% Triton X-100, 0.11% Sodium Deoxycholate, 1 mM EDTA, 155 mM NaCl, supplemented with protease and phosphatase inhibitors), and sonicated via probe sonication (Branson). Homogenates were subsequently subject to chromatin immunoprecipitation via overnight incubation with the following antibodies: NCOR1, 5ug, (Generated in-house and previously described23, raised in rabbit against amino acids 1944–2453), GR, 2 ug each of: Santa Cruz-393232 [G-5], Thermo Fisher MA1510 [BuGR2], Thermo Fisher PA1-511A). All antibodies have been previously validated in the literature for ChIP. ChIP conjugates were captured via Protein-A/G sepharose beads blocked with BSA, exhaustively washed, eluted, reverse crosslinked, and subject to protease digestion followed by DNA isolation and quantitative PCR. Primers used for ChIP-qPCR can be found in Extended Table 1. For ChIPseq, ChIP libraries were generated using the NEBNext Ulta II DNA library Prep Kit (NEB). Library size and quality was assessed using DNA highsensitivity kits on an Agilent Tapestation and sequenced on a NOVAseqX Plus.
ChIPseq Analysis
Previously published cistromes from control C57Bl/6J male mice at ZT10 for NCOR1 (GSM64702723), NCOR2 (GSM123649424), and GR (GSE4567463), PPARA ChIPseq (GSE11315749) and ChIPseq from control C57Bl/6J male mice fasted for 24 hours for CREB (GSE4567463) as well as newly generated cistromes were processed using the following parameters: Trim-galore v0.6.4 was used to cut adapter reads, BWA MEM v0.7.17 with default settings was used to align the trimmed reads to mm10 reference genome. MarkDuplicates V2.23.1 was used to mark and exclude the duplicated reads from bam files. Homer V4.11 were used to make tag directories from bam files using makeTagDirectory command with default parameters, findPeaks command with parameter -style factor was used to call peaks. BEDTools v2.29.2 was used to generate bigwig files and normalized to million mapped reads. The set of peaks where GR biding is lost in HNF4α KO was obtained from Hunter et al (2022).43
Statistics
Data are presented as mean +/− S.E.M unless otherwise stated and detailed information about statistical tests and sample number is provided in the figure legends. Individual data points are plotted when possible. For pairwise comparisons, unpaired, two-tailed Student’s t-test was used to test for statistical significance with correction for multiple comparisons when appropriate. For comparison between multiple groups, one-way ANOVA was used. For comparison between two independent variables, two-way ANOVA was used and for experiments with serial sampling (glucose, GTT, ITT), repeated measure (RM) two-way ANOVA was used. For survival, Log-rank Mantel-Cox test was used. Graphpad Prism (v.7) was used for analysis and visualization. Unless otherwise noted, significance is denoted as follows :P<.05 (*), P<.01 (**), P<.001 (***), P<.0001 (****).
Littermates were randomized into experimental groups for knockout studies and treatment with Dexamethasone, and Alanine tolerance tests. When possible, for serial glucose measurements and GTT, ITT, and ATT assays, the researcher was blinded to experimental group during data collection. Data analysis was not performed blind to the experimental conditions. No statistical methods were used to pre-determine sample sizes but our sample sizes are similar to those reported in previous publications38,64-66. Data distribution was assumed to be normal but this was not formally tested. The only cases in which data was removed was due to clear technical failure prior to analysis, for example failed cDNA synthesis (no amplification of housekeeping genes) or a missed tail vein injection (no cre expressed).
Extended Data
Extended Data Figure 1. Adult mice with depletion of hepatic NCOR1 and 2 rapidly develop liver failure.
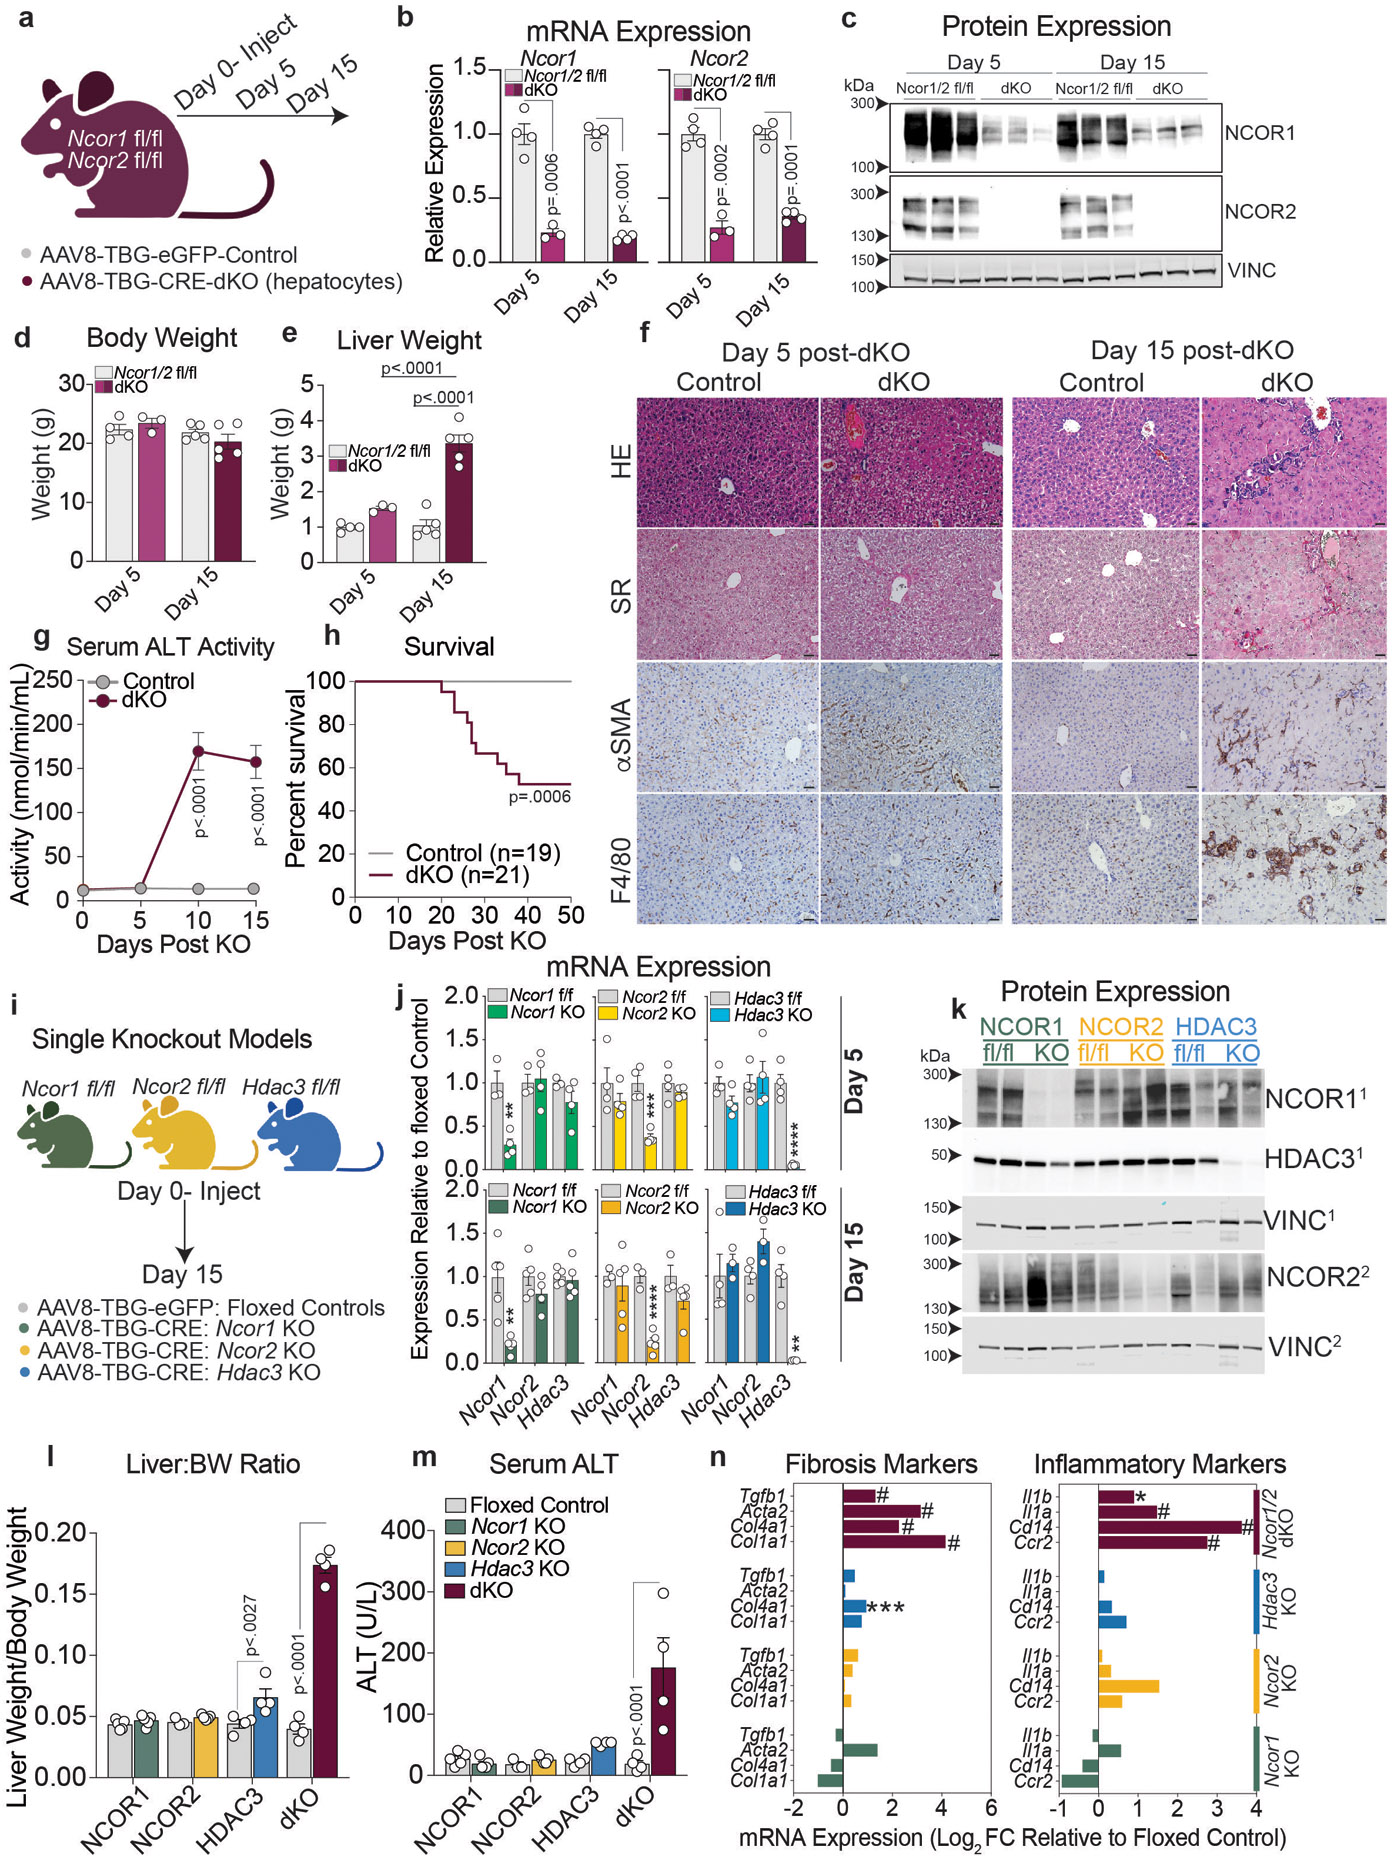
a, Model for hepatocyte-specific knockout of Ncor1/2 in adult mice (Created with BioRender.com). Ncor1fl/flNcor2fl/fl mice were injected with AAV8-TBG-eGFP (control) or AAV8-TBG-Cre (dKO) virus by tail vein at 8-10 weeks of age. Mice were sacrificed 5 days or 15 days post AAV injection. b, RT-qPCR of Ncor1 and Ncor2 relative to 36b4 5 or 15 days after AAV injection. Data represented as mean +/− S.E.M, with p-values calculated by two-tailed students t-test. Biological replicates representing individual mice are plotted (n= 3-4 animals) c, Western blots of NCOR1, NCOR2 and Vinculin (VINC) in whole cell lysates from Control and dKO livers at day 5 and 15 post AAV injection. NCOR1 and 2 blots are from the same samples but separate membranes. Equal loading was confirmed by Vinculin blots on each membrane. d, Body weight and e, liver weight in grams 5 and 15 days post AAV injection. Biological replicates are plotted (n=3-5 animals) and data represented as mean +/− S.E.M, with p-values calculated by 2-way ANOVA. f, Representative liver sections at 5 and 15 days. HE (Hematoxylin and Eosin), SR (Sirius Red), αSMA (alpha-Smooth Muscle Actin), F4/80 antigen. Scale bar indicates 20 μM in all panels. g, Activity of ALT in the serum collected serially from mice on Day 0, 5,10, and 15 post AAV injection (n=5 mice). Data represented as mean +/− S.E.M. p-values calculated by two-way ANOVA. h, Survival curve of control and dKO mice with day 0 indicating time of AAV administration. p-value was calculated by Log rank Mantel-Cox test. i, Model for single KO of Ncor1, Ncor2, and Hdac3 (Created with BioRender.com). j, RT-qPCR of, Ncor1, Ncor2, and Hdac3 in each respective single knockout model at 5 and 15 days after AAV administration. Biological replicates are plotted (n=3-5 animals) and data represented as mean +/− S.E.M with p-values calculated by unpaired two-tailed students t-test. Ncor1 mRNA: Ncor1 KO (Day 5: p=.0039, Day15: p=.0025), Ncor2 mRNA:Ncor2 KO (Day 5: p=.0008, Day15: p=.0001), Hdac3 mRNA:Hdac3 KO (Day 5: p<.0001, Day15: p=.0015). k, Western blot of NCOR1, NCOR2, HDAC3, and VINCULIN in whole cell lysates from control floxed (fl/fl) livers and single knockout (KO) livers at day 15. Superscript denotes which membrane (1 or 2) was used to blot for each protein. l, Liver to body weight ratio in fl/fl control animals (gray) or knockout animals, 15 days post AAV injection. Biological replicates are plotted (n=3-5 animals) and data is represented as mean +/− S.E.M. p-values were calculated by two-way ANOVA. m, Serum ALT levels in floxed (fl/fl) control animals (gray) or knockout (KO) animals 15 days post AAV injection. Biological replicates are plotted (n=3-5 animals) and data is represented as mean +/− S.E.M. p-values were calculated by calculated by two-way ANOVA. n, Expression represented as Log2 Fold Change relative to each floxed control for example fibrosis genes and pro-inflammatory genes (Adj p-value: * <.01, **<.001,***<.001, #<.000001).
Extended Data Figure 2. Lipogenic gene induction in both NCOR1/2 dKO and HDAC3 knockout livers.
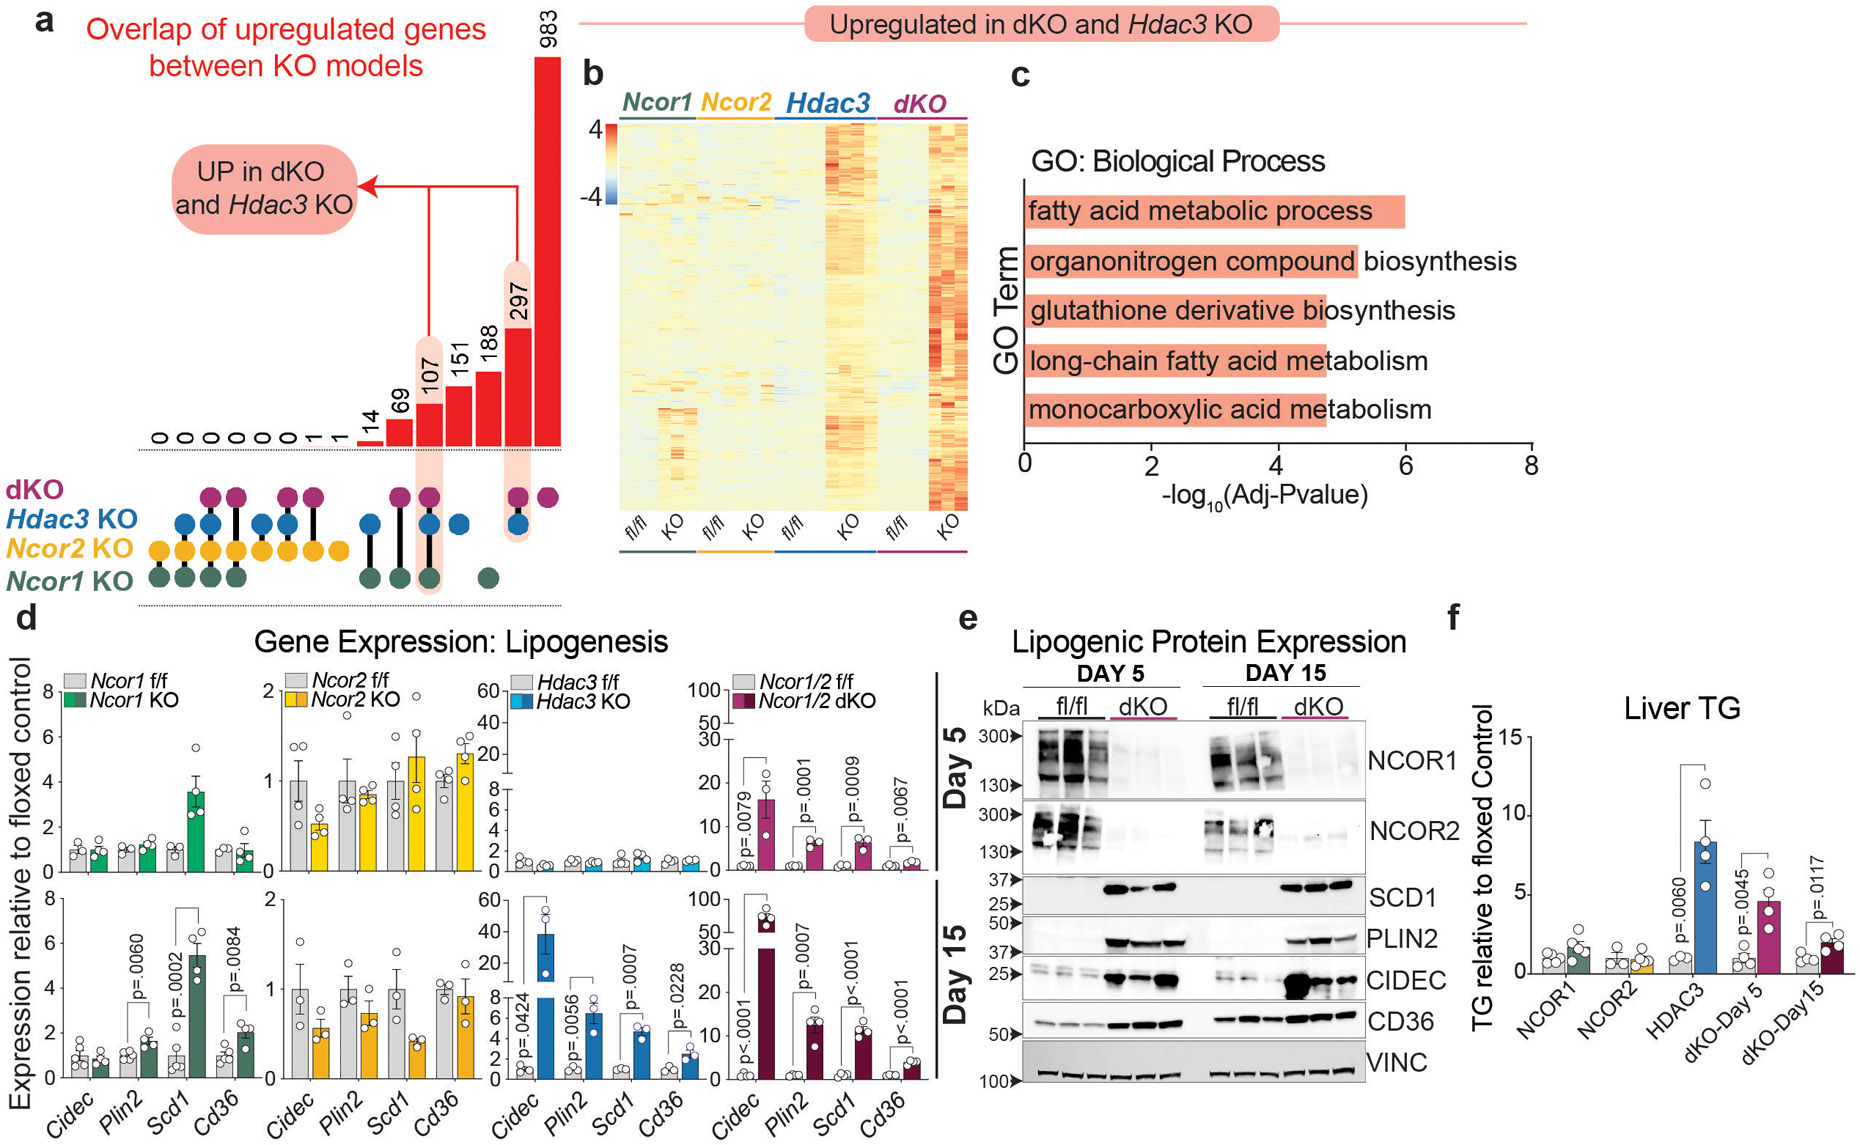
a, Upset plot showing overlap of upregulated genes (fold change>1.5 relative to floxed control, adj p-value <.05) between each knockout model: (dKO-5 day, purple dots), Hdac3 KO (blue dots), Ncor2 KO (yellow dots), and Ncor1 KO (green dots). Each linkage represents common differentially expressed genes between the indicated groups. b, Z-score normalized heatmap of all genes upregulated (Adj Pvalue <.05, Fold Change >1.5) in both Hdac3 KO and dKO models. c, Top ontology terms (GO:Biological Process) for all genes upregulated in both Hdac3 KO and dKO models. d, RT-qPCR of a panel of lipogenic genes relative to 36b4. Data represented as fold change relative to floxed control and plotted as mean +/− S.E.M. p-values were calculated by unpaired two-tailed students t-test with correction for multiple comparisons using the Holm-Šídák method. Biological replicates are plotted (n=3-5 animals) e,Western blot of lipogenic factors and day 5 and 15 post dKO. The same samples were loaded into 4 separate gels. Equal loading was confirmed by Vinculin blotting on each membrane. f, Liver triglyceride relative to fl/fl control for each model. 5 days and 15 days post AAV injection for (dKO) and 15 days post AAV injection (Hdac3 KO, Ncor1 KO, Ncor2 KO). Data represented as fold change relative to mean of floxed control. Biological replicates are plotted (n=3-5 animals) as mean +/− S.E.M. p-values were calculated by unpaired two-tailed students t-test.
Extended Data Figure 3. Impaired glucose metabolism in hepatic dKO animals.
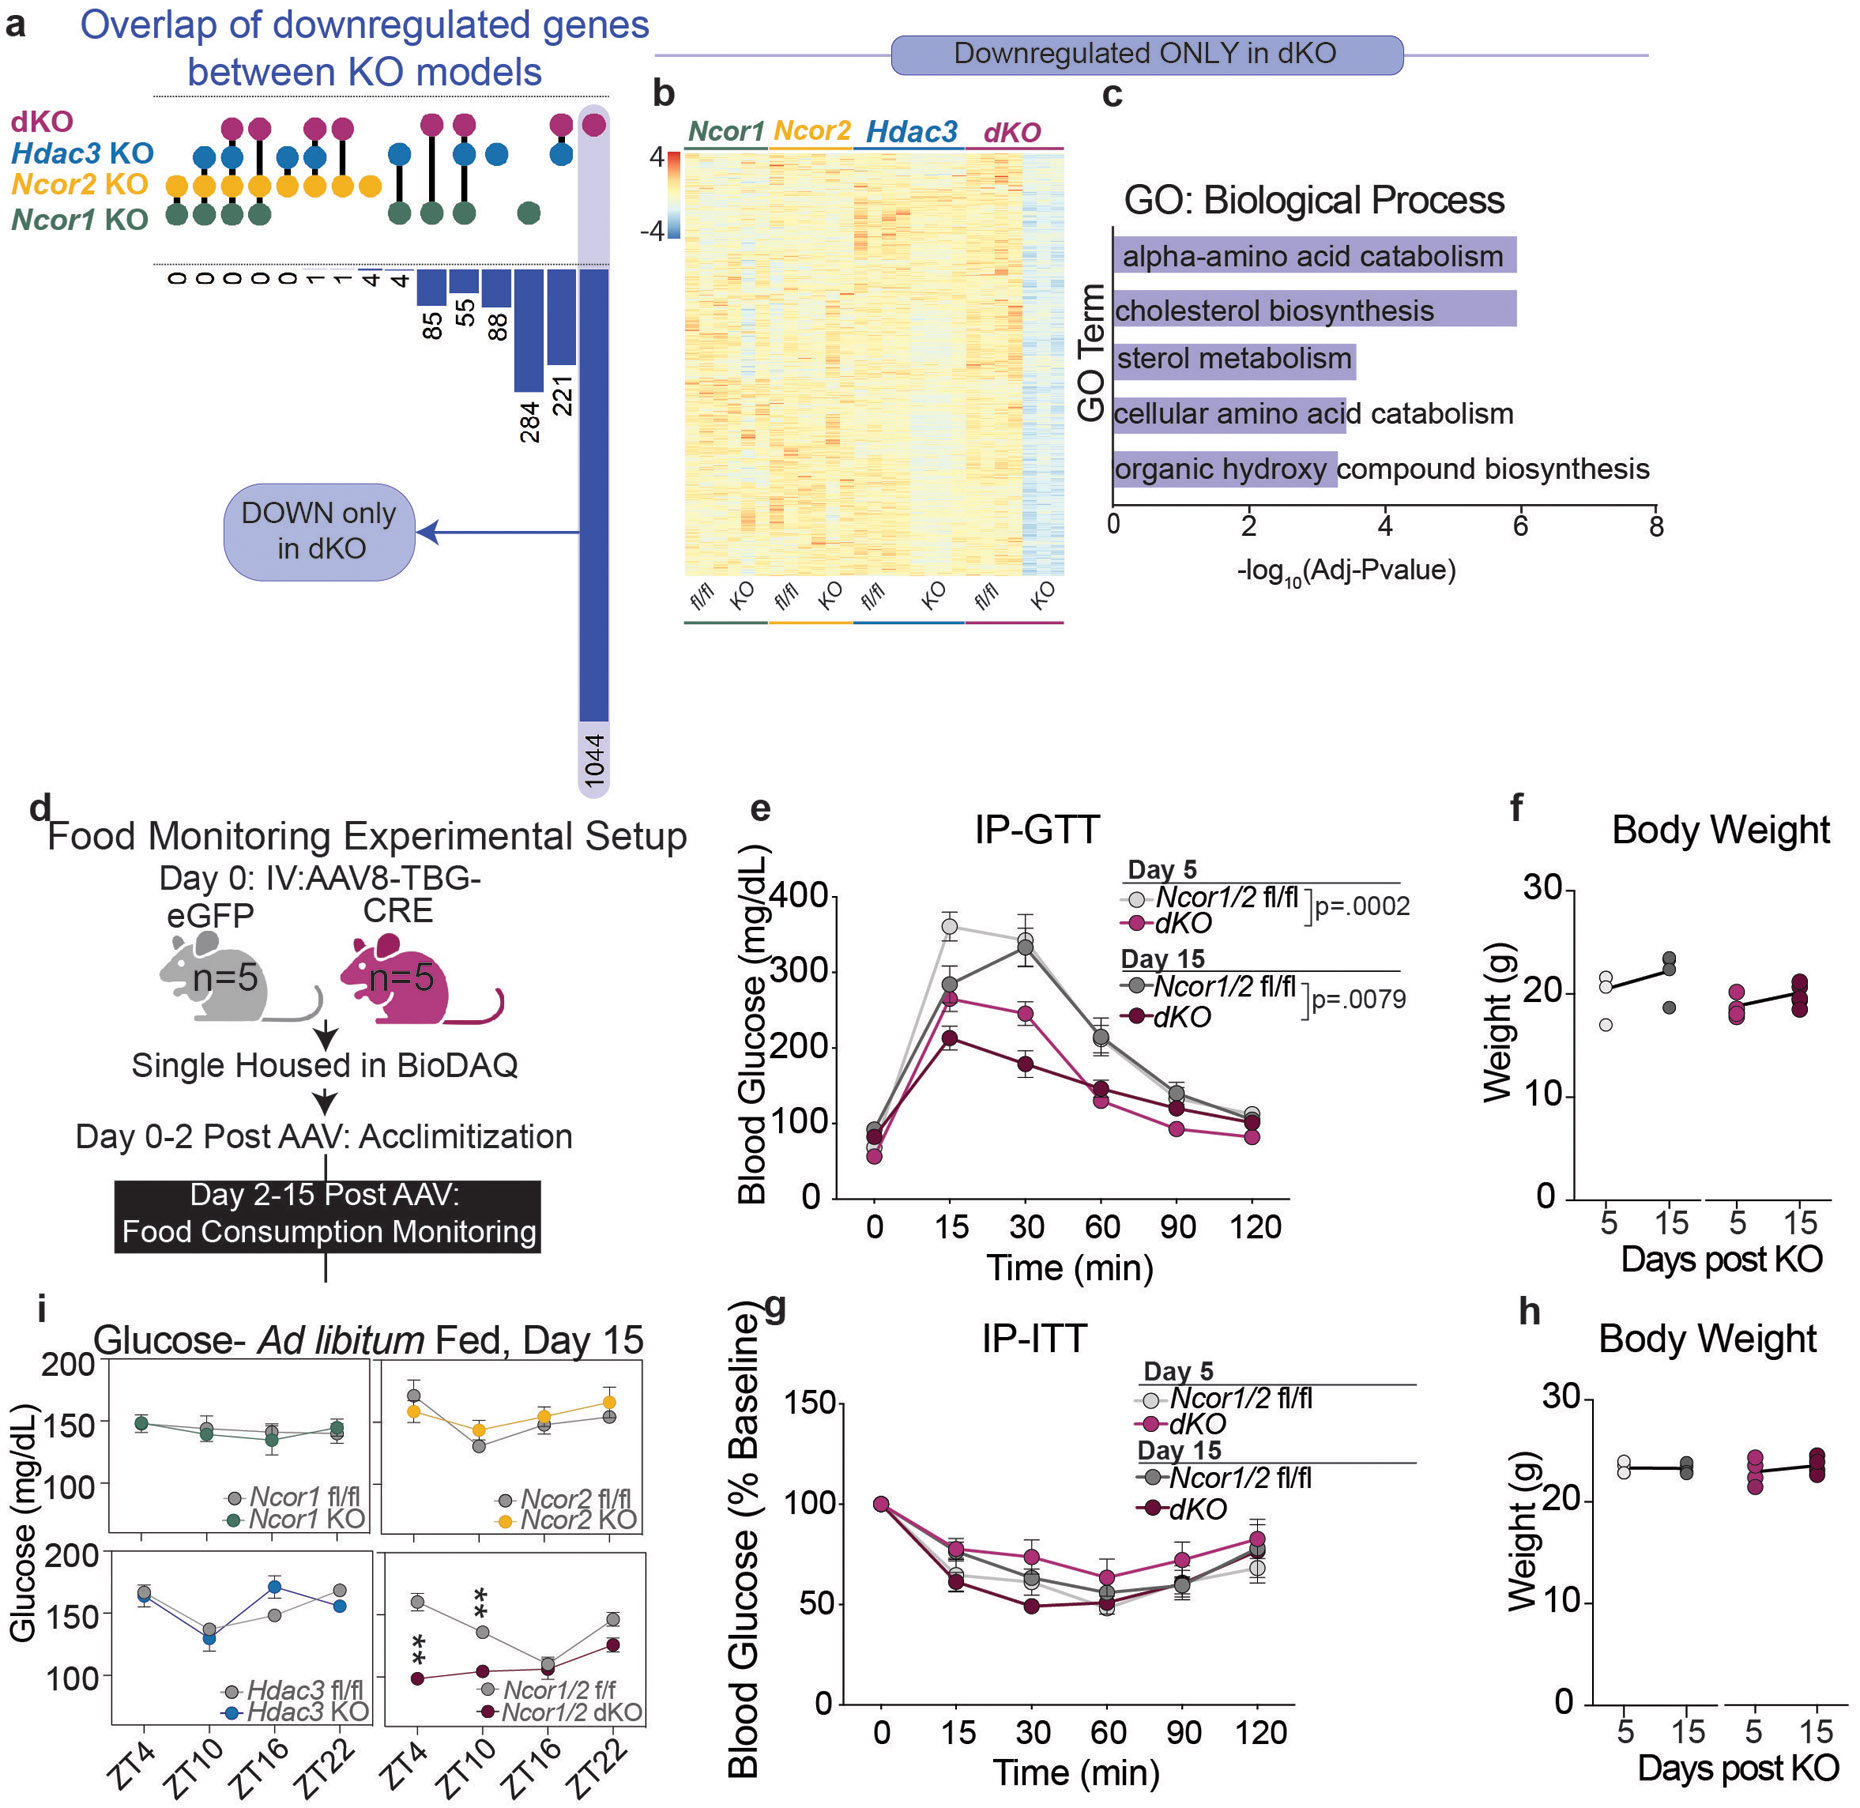
a, Upset plot showing overlap of downregulated genes (FC>1.5, p-value <.05) between each knockout model: (dKO-5day, purple dots), Hdac3 KO (blue dots), Ncor2 KO (yellow dots), and Ncor1 KO (green dots). Each linkage represents common differentially expressed genes between the indicated groups. b, Z-score normalized heatmap of all genes downregulated only in the dKO model (Adj Pvalue <.05, Fold Change >1.5). c, Top ontology terms (GO:Biological Process) for all genes downregulated only in the dKO model. d, Experimental setup for food monitoring experiment in the BioDAQ (Created with BioRender.com). e, IP-GTT of control and dKO mice (Ncor1/2 f/f, day 5 (n=4 mice), dKO day 5 (n=5 mice), Ncor1/2 f/f day 15 (n=4 mice), dKO day 15 (n=5 mice). and g, IP-ITT of control and dKO mice at day 5. n=4 mice for all groups. Data in e and g are plotted as mean value +/− S.E.M. and statistical significance calculated by RM two-way ANOVA. P-values in panel represent genotype effect: dKO GTT Day 5 (Interaction p=.0129, Genotype p=.0002, Time p<.0001), dKO GTT Day 15 (Interaction p<.0001 , Genotype p=<.0079, Time p<.0001), f, h, Body weight of GTT (n=4 for controls and n=5 for dKO mice) and ITT (n=4 mice for all groups) cohorts. i, Blood glucose in ad-libitum fed mice at 4 timepoints, 15 days post AAV. The mean +/− S.E.M of the biological replicates is plotted: Ncor1 f/f (n=5 mice), Ncor1 KO (n=5 mice), Ncor2 f/f (n=3 mice), Ncor2 KO (n=5 mice), Hdac3 f/f (n=4 mice), Hdac3 KO (n=4 mice), Ncor1/2 f/f (n=4 mice), dKO (n-4 mice).p-values were calculated by RM two-way ANOVA with Šídák’s multiple comparisons test (ZT4 p=.0023, ZT10 p=.0076).
Extended Data Figure 4. Inhibition of HDAC3 activity does not have a major effect on hepatic glucose metabolism.
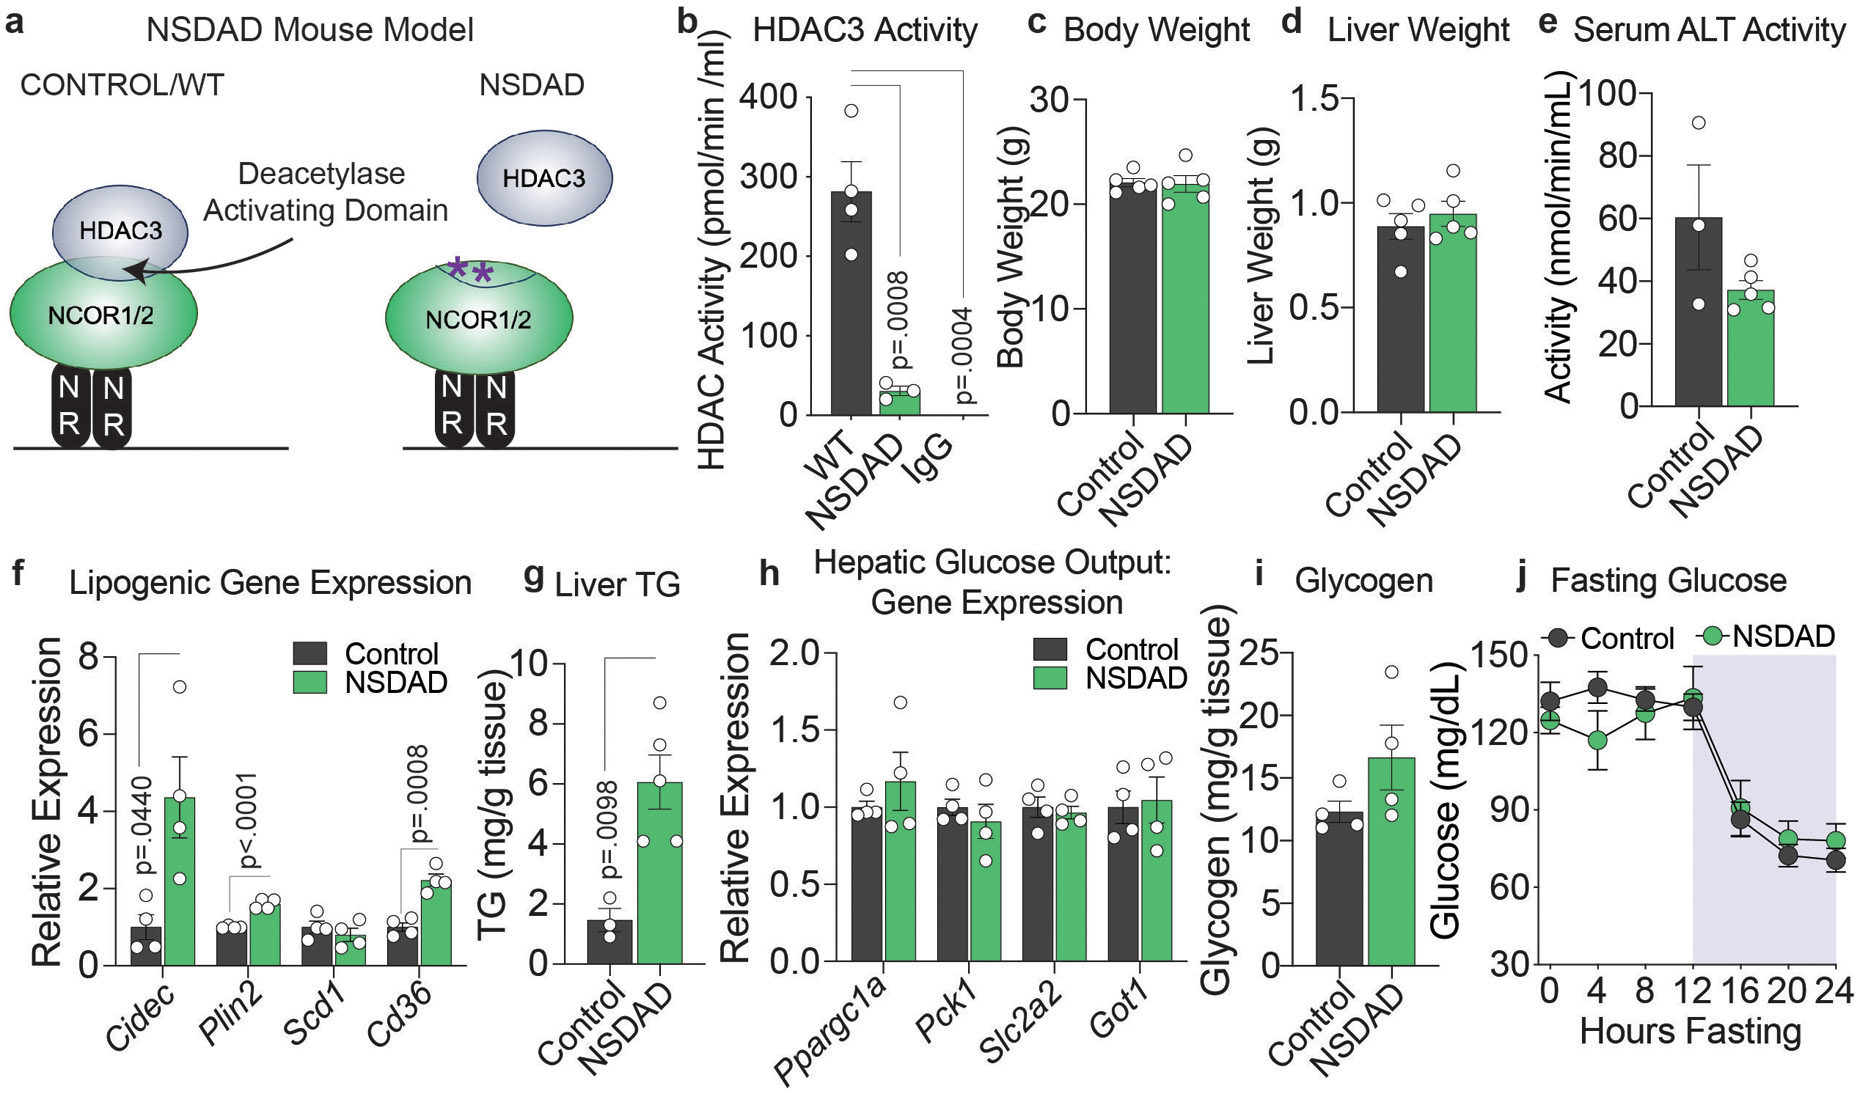
a, Schematic of NSDAD mouse model. b, HDAC activity in HDAC3 immunoprecipitates from Control (WT) (n=4 mice) and NSDAD (n=3 mice) mice. P values calculated by one-way ANOVA with Turkey’s multiple comparisons test. IP with normal rabbit IgG (IgG) in control mice is a negative control (n=3 mice). c, Body weight and d, liver weight of control (n=5 mice) and NSDAD (n=5 mice) mice. e, Serum ALT Activity (n=3 control and 5 NSDAD mice). f, RT-qPCR of Lipogenic Gene Expression relative to 36b4 (n=4 mice). P values calculated by unpaired two-tailed student’s t-test with correction for multiple comparisons using the Holm-Šídák method. g, Hepatic triglyceride levels (n=4 mice) P value calculated by unpaired two-tailed student’s t-test . h, RT-qPCR of hepatic glucose output genes relative to 36b4 (n=4 mice). i, Hepatic glycogen levels (n=4 mice). j, Glucose levels during a 24 hour fast: WT (n=6 mice), NSDAD (n=5 mice). For all panels, the mean +/− S.E.M. is plotted.
Extended Data Figure 5: NCORs are required for the hepatic fasting response.
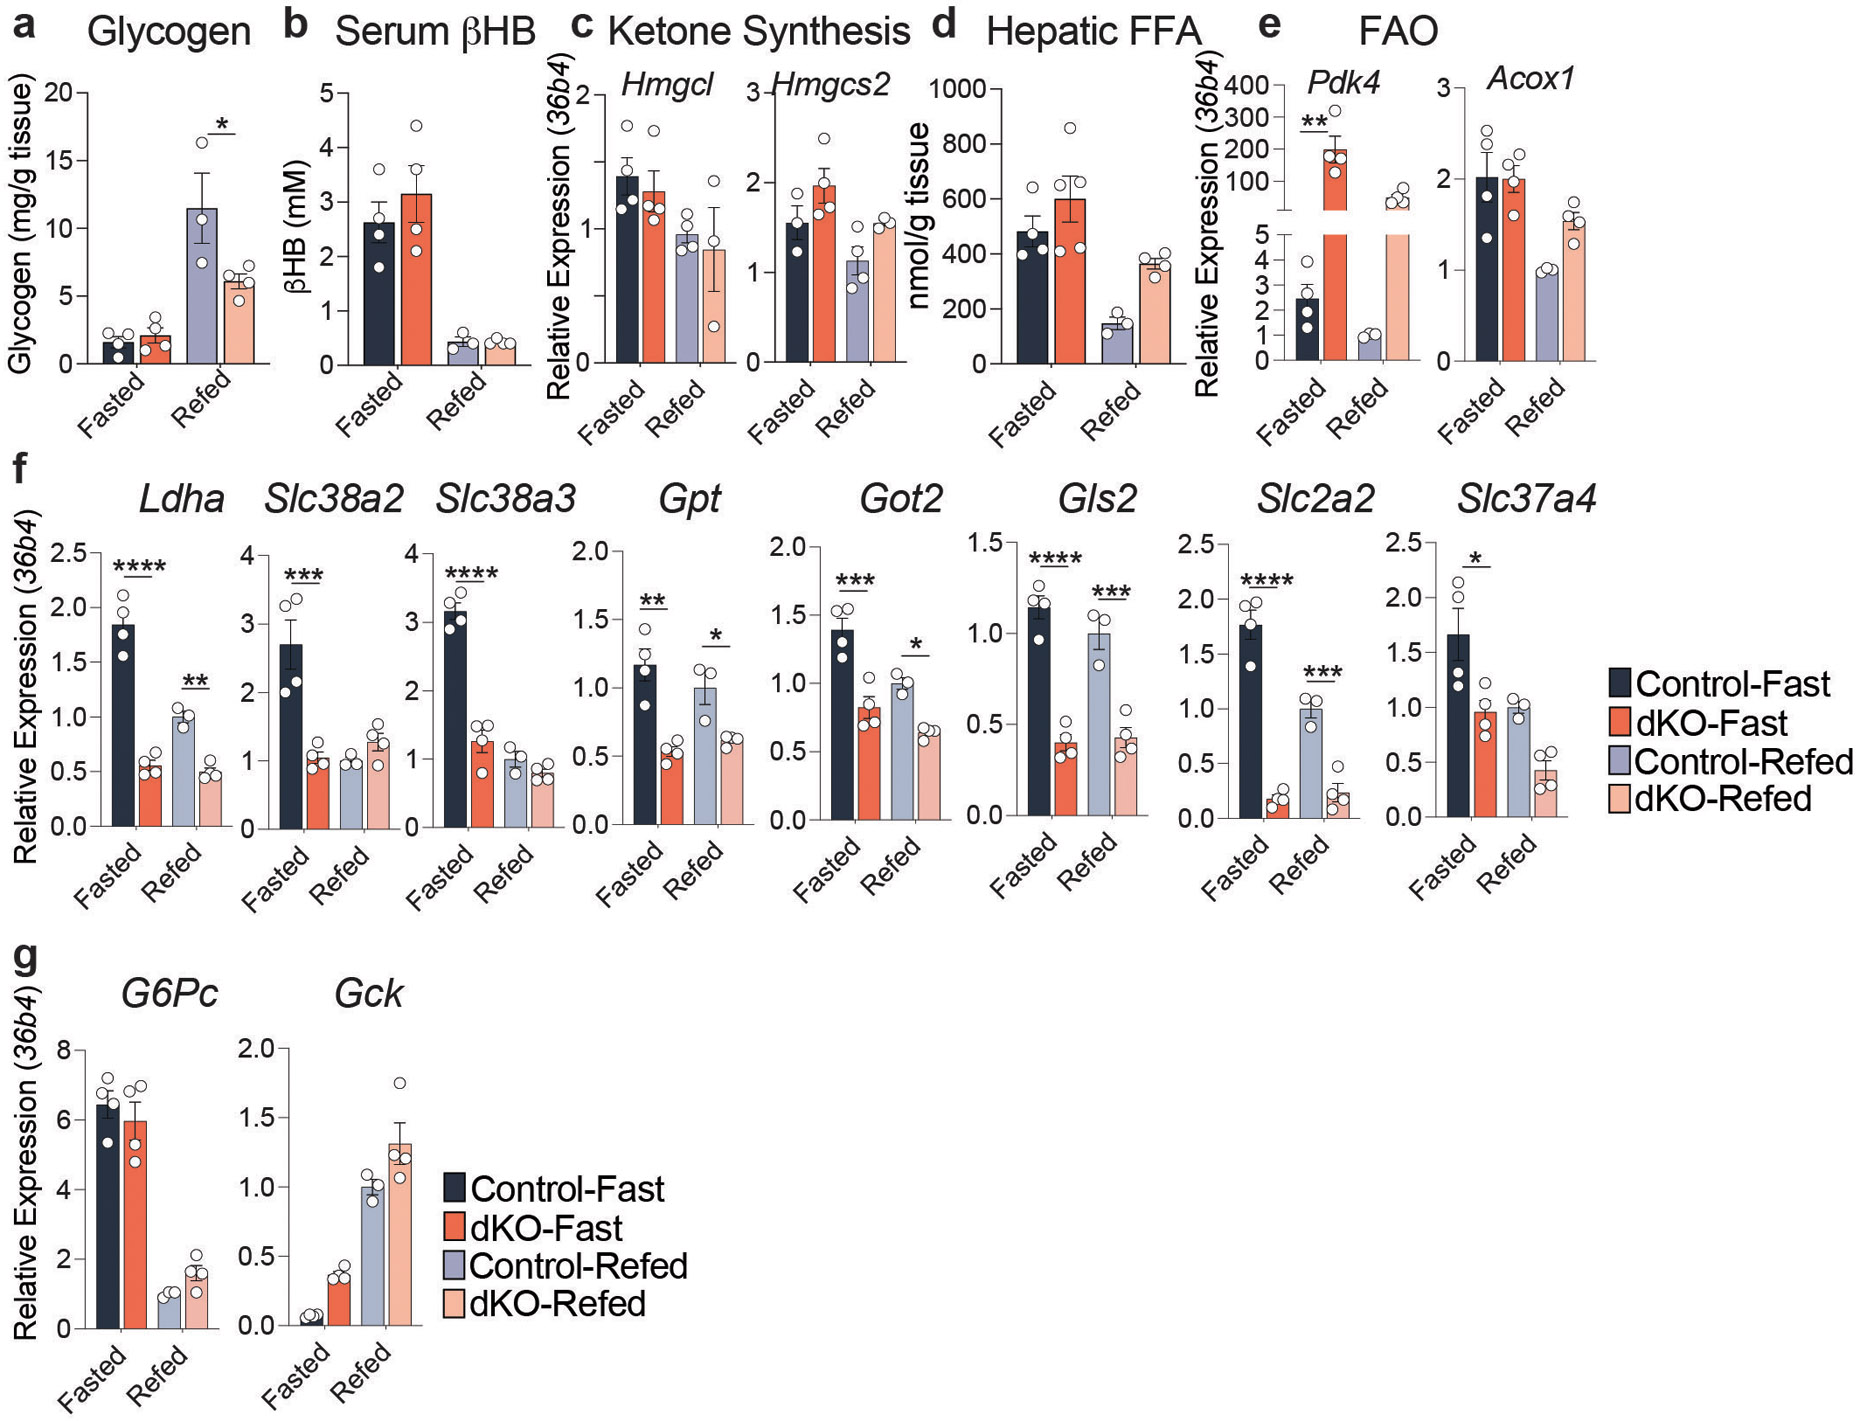
a, Liver glycogen levels in animals either fasted for 24 hours (Fasted) or fasted for 24 hours followed by a 3-hour Re-feed (Refed). Refed Control vs Refed dKO (p=.0302) b, Serum Beta-hydroxy Butyrate levels (βHB). d, RT-qPCR of Ketogenic markers and f, Fatty Acid Oxidation markers relative to 36b4. e, Hepatic free fatty acids (FFA). f,g, RT-qPCR of glucoregulatory genes relative to 36b4. RT-qPCR data represented as fold change relative to Control-Refed animals. For all panels, biological replicates are plotted (n=3-4 mice) as mean +/− S.E.M. and p-values were calculated by two-way ANOVA with Turkey’s multiple comparisons test. Panel e: Pdk4 (fasted p=.003), Panel f: Ldha (fasted p<.0001, fed p=.0041), Slc38a2 (fasted p=.0007), Slc38a3 (fasted p<.0001), Gpt (fasted p=.0007, fed p=.0366), Got2 (fasted p=.0003, fed p=.0178), Gls2 (fasted p<.0001, fed p=.0003), Slc2a2 (fasted p<.0001, fed p=.0008), Slc37a4 (fasted p=.0245). p<.05*, p<.01**, p<.001***, p<.0001****.
Extended Data Figure 6. Hepatic dKO of NCOR1 and 2 in female mice.
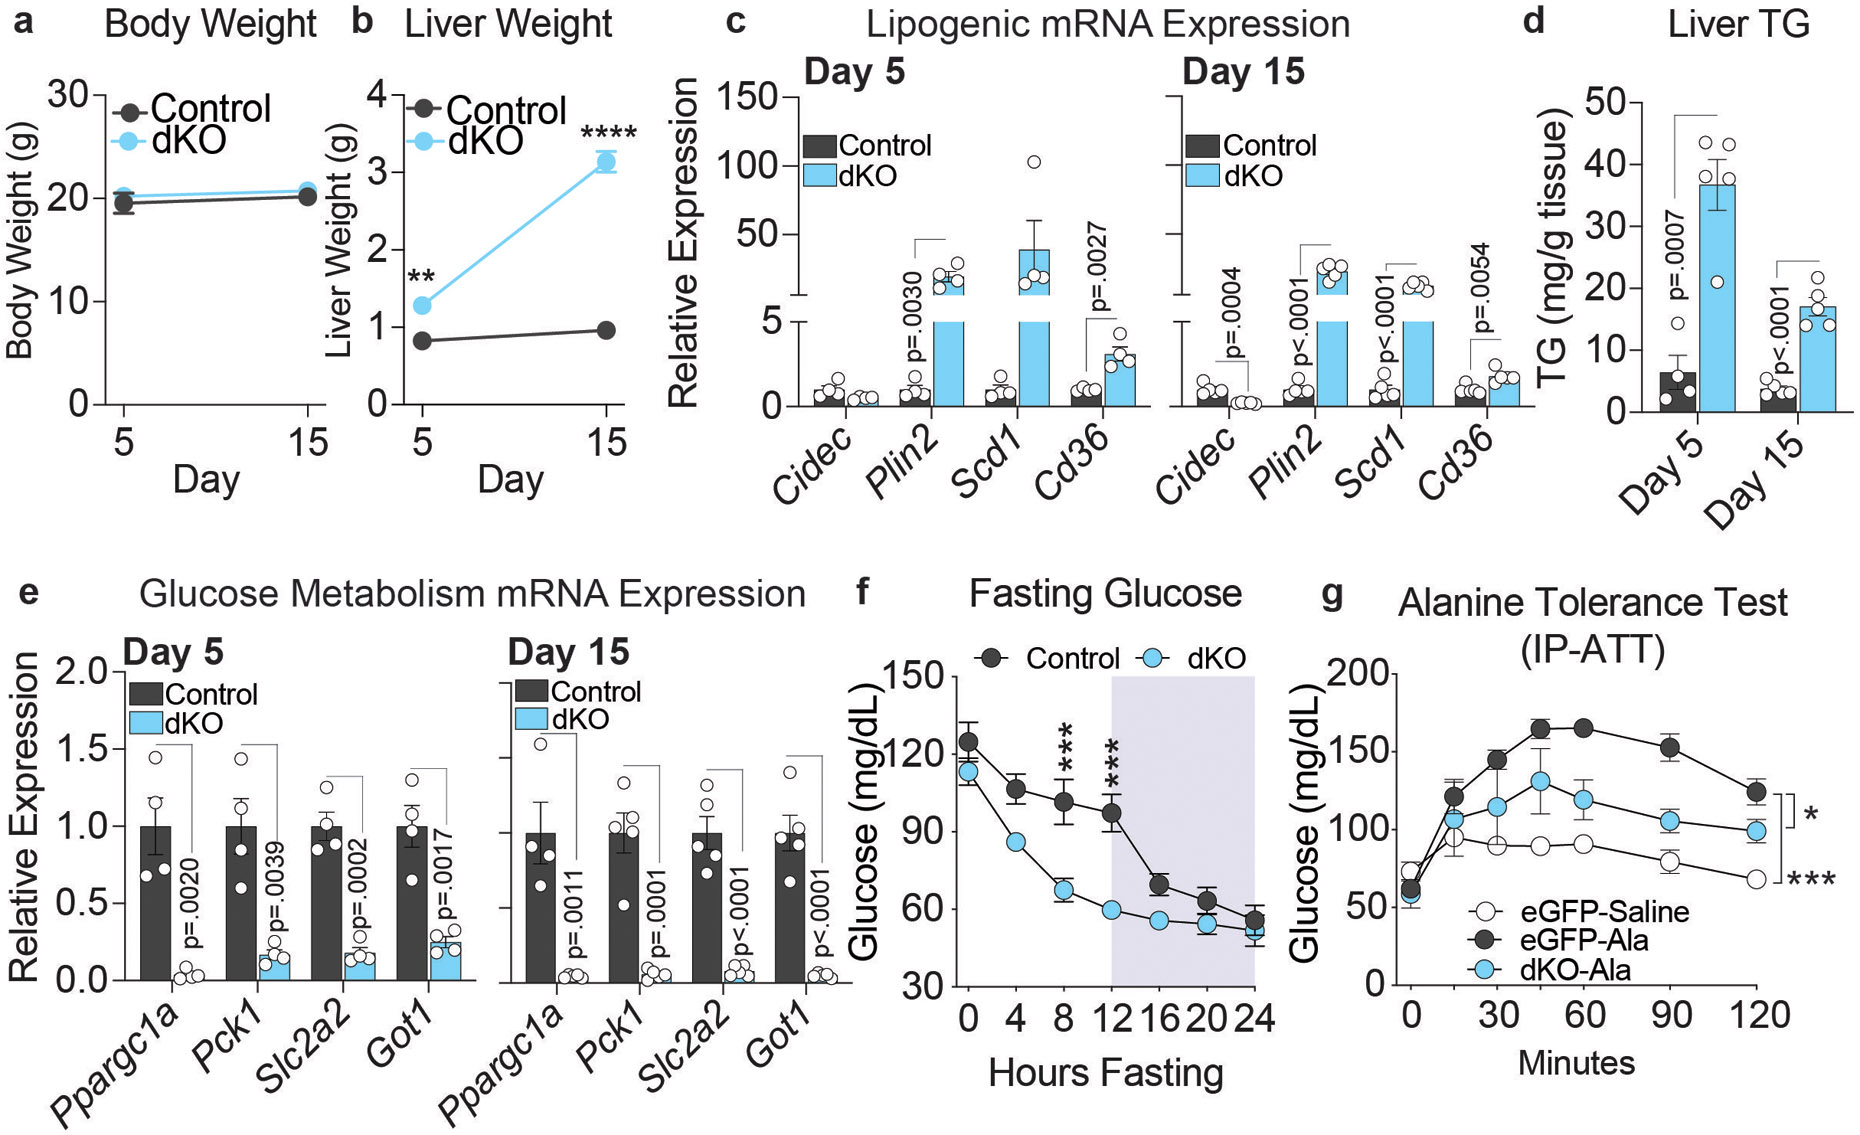
a, Body weight and b, liver weight of female control and dKO mice 5 and 15 days post dKO. Biological replicates include: Control day 5 (n=4 mice), dKO day 5 (n=5 mice), Control day 15 (n=5 mice), dKO day 15 (n=5 mice). P-values calculated by two-tailed unpaired students t-test: day 5 p=.0048, day 15 p<.0001. c, RT-qPCR of lipogenic genes (n=4 mice). P-values calculated by unpaired, two-tailed students t-test. d, Hepatic TG levels (n=4-5 mice). P-values calculated by unpaired, two-tailed students t-test e, Glucose metabolism genes in female dKO mice (n=4 mice). P-values calculated by unpaired, two-tailed students t-test. f, Glucose levels throughout a 24 hour fast in female control and dKO mice (n=5 mice per group). P-values calculated by RM two-way ANOVA with Šídák’s multiple comparisons test: ZT8 p=.0004, ZT12 p=.0001. g, IP-Alanine Tolerance Test in Vehicle Treated (-Saline n=3) or Alanine Treated (-Ala) female mice, (n=8 control mice and 4 dKO mice). P-values were calculated by RM two-way ANOVA (Control:dKO p=.0135, Control:Saline p=.0001). For all panels, biological replicates are plotted as mean +/− S.E.M. p<.05*, p<.01**, p<.001***, p<.0001****.
Extended Data Figure 7. Loss of hepatic NCORs results in decreased chromatin accessibility at enhancers of glucoregulatory genes.
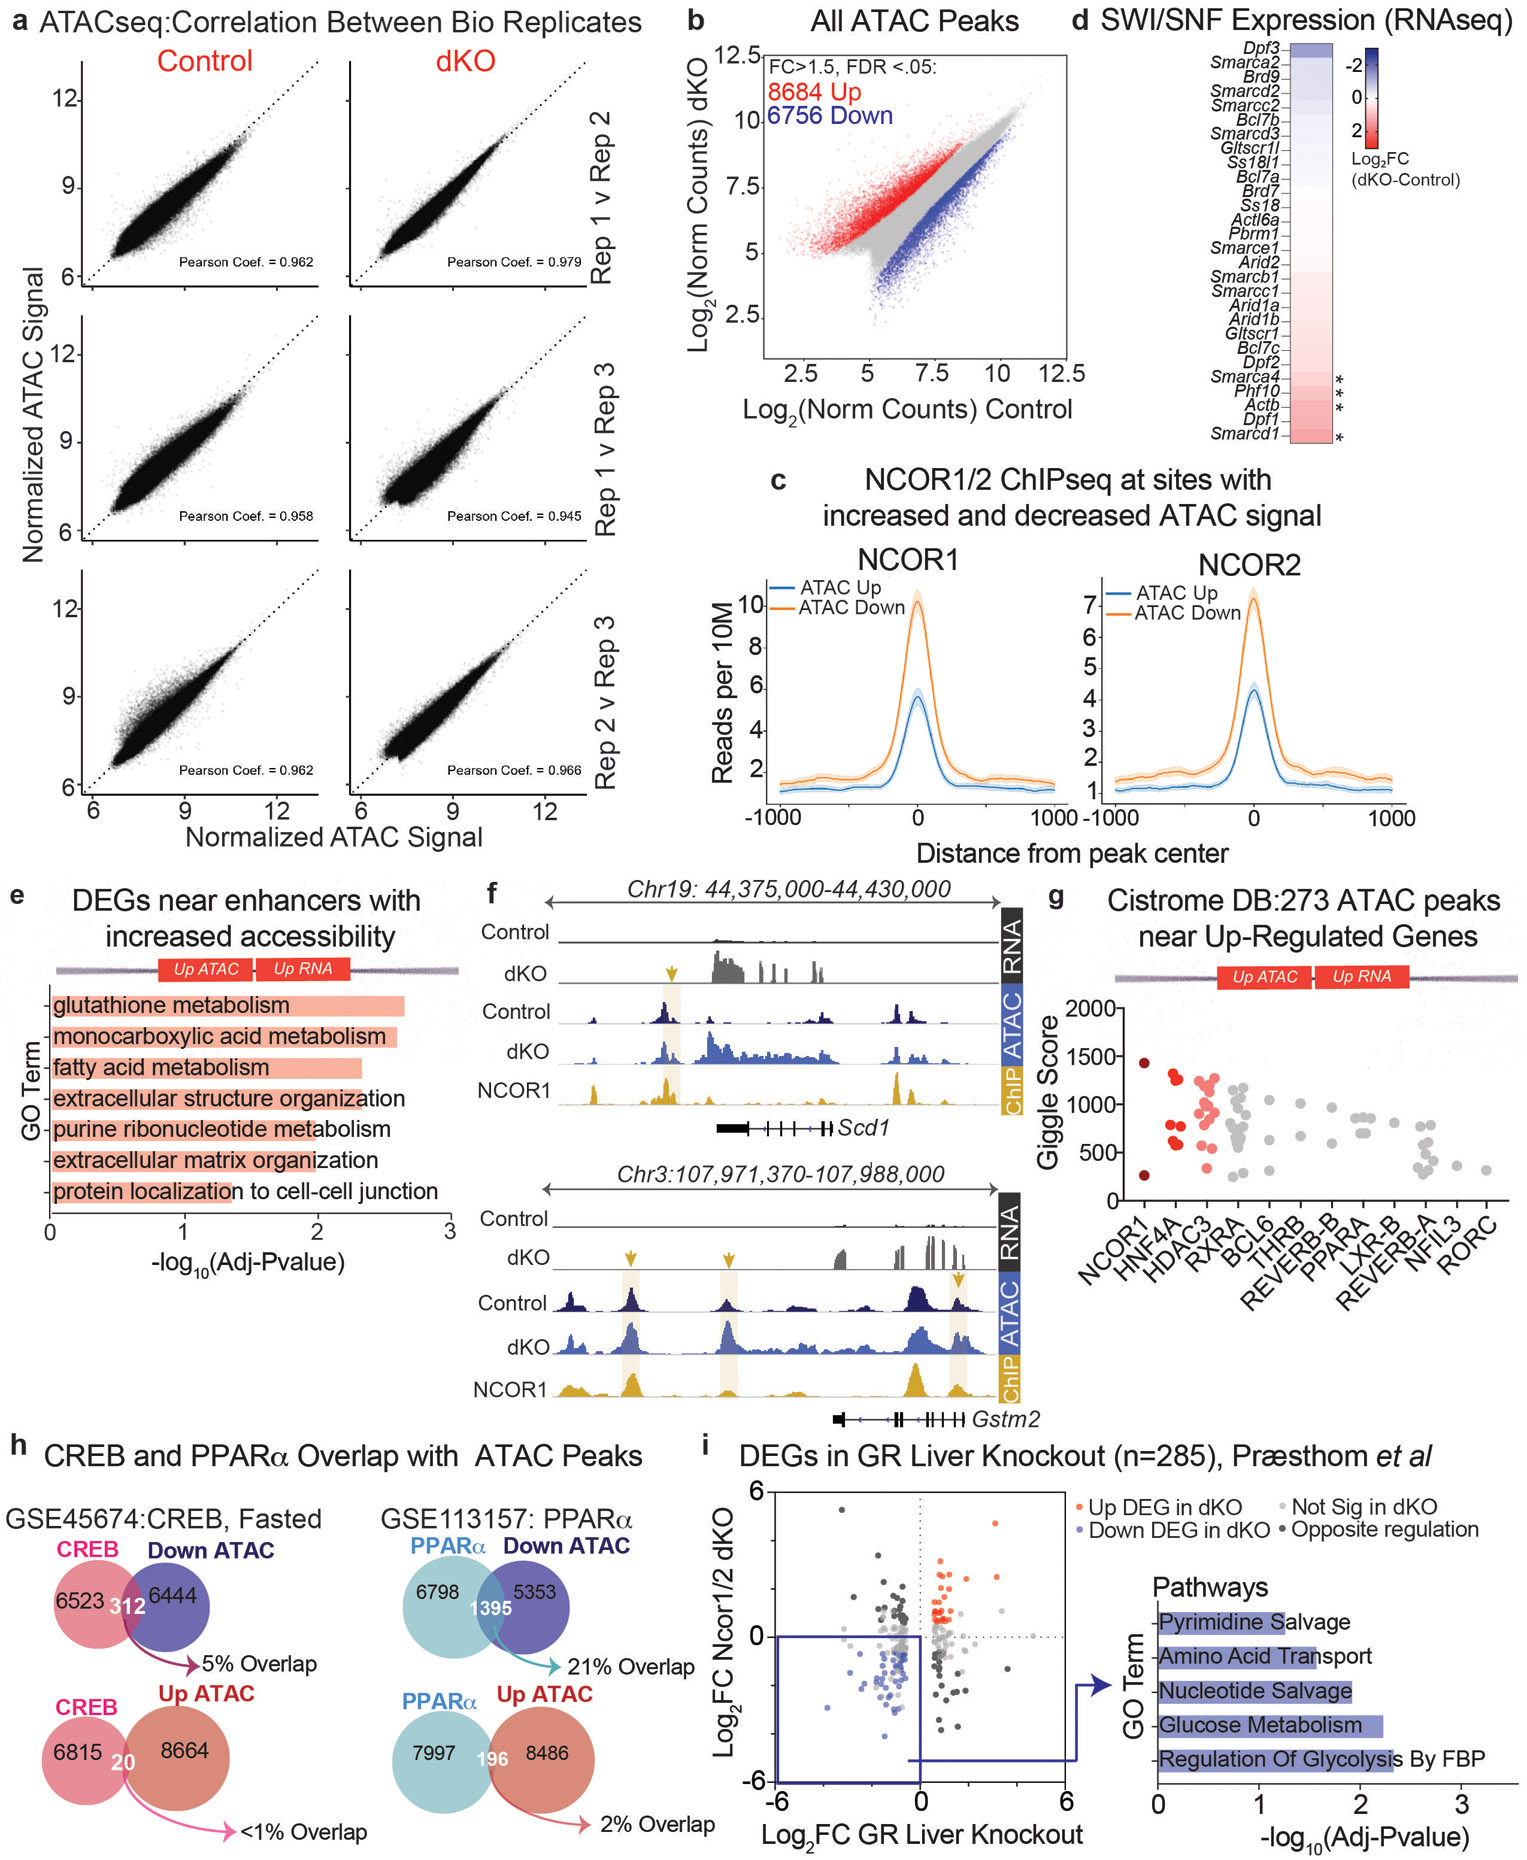
a, Correlation scatter plots of ATACseq biological replicates. b, Scatter plot of ATACseq normalized counts from hepatocytes isolated from control and dKO livers, 5 days post AAV injection. Sites of increased accessibility relative to control livers are shown in red and decreased accessibility shown in blue. Differential sites (indicated by *) exhibit a fold change>1.5 in dKO compared to control, with FDR <.05 (n=3). c, Average profiles of NCOR1 (GSM647027) and NCOR2 (GSM1236494) ChIPseq from control livers (ZT10) at sites exhibiting increased accessibility in dKO hepatocytes (blue track) vs. sites exhibiting decreased accessibility (orange track). Shading indicates 95% confidence interval. d, Heatmap showing Log2 Fold Change in gene expression (RNAseq, Day 5 dKO vs Ncor1/2 floxed contols) of SWI/SNF factors. * indicates FDR<.05 and fold change >1.5. e, FDR of Top significant terms (GO: Biological Process) of upregulated genes nearest to the 273 enhancers bound by NCOR1/2 with increased accessibility. f, Example tracks of loci with enhancers exhibiting increased accessibility and increased gene expression. RNAseq tracks (control and dKO day 5 livers, group autoscaled), ATACseq tracks (hepatocytes isolated from control and dKO day 5 livers, group autoscaled) and NCOR1 ChIPseq (control livers, ZT10, autoscaled) are shown. g, Top 12 factors, ranked by Giggle Score, with overlapping cistromes compared to 273 NCOR1/2-bound ATAC peaks near upregulated genes. h, Venn diagrams showing overlap of peaks between Liver CREB ChIPseq (GSE45674, Fasted) and PPARα (GSE113157) with differential ATAC peaks. i, Scatter plot of differentially expressed genes in GR-liver specific knockouts (Præsthom et al: GSE173723, ZT10) and 5-day dKO livers. Differentially expressed genes were filtered based on fold change greater than 1.5 relative to controls with FDR<.05. Inset indicates Top 5 Reactome Pathway terms for genes downregulated in both GR-KO and Ncor1/2 dKO livers.
Extended Data Figure 8. NCORs are required for GR binding and transcriptional activity at NCOR1/GR cobound sites.
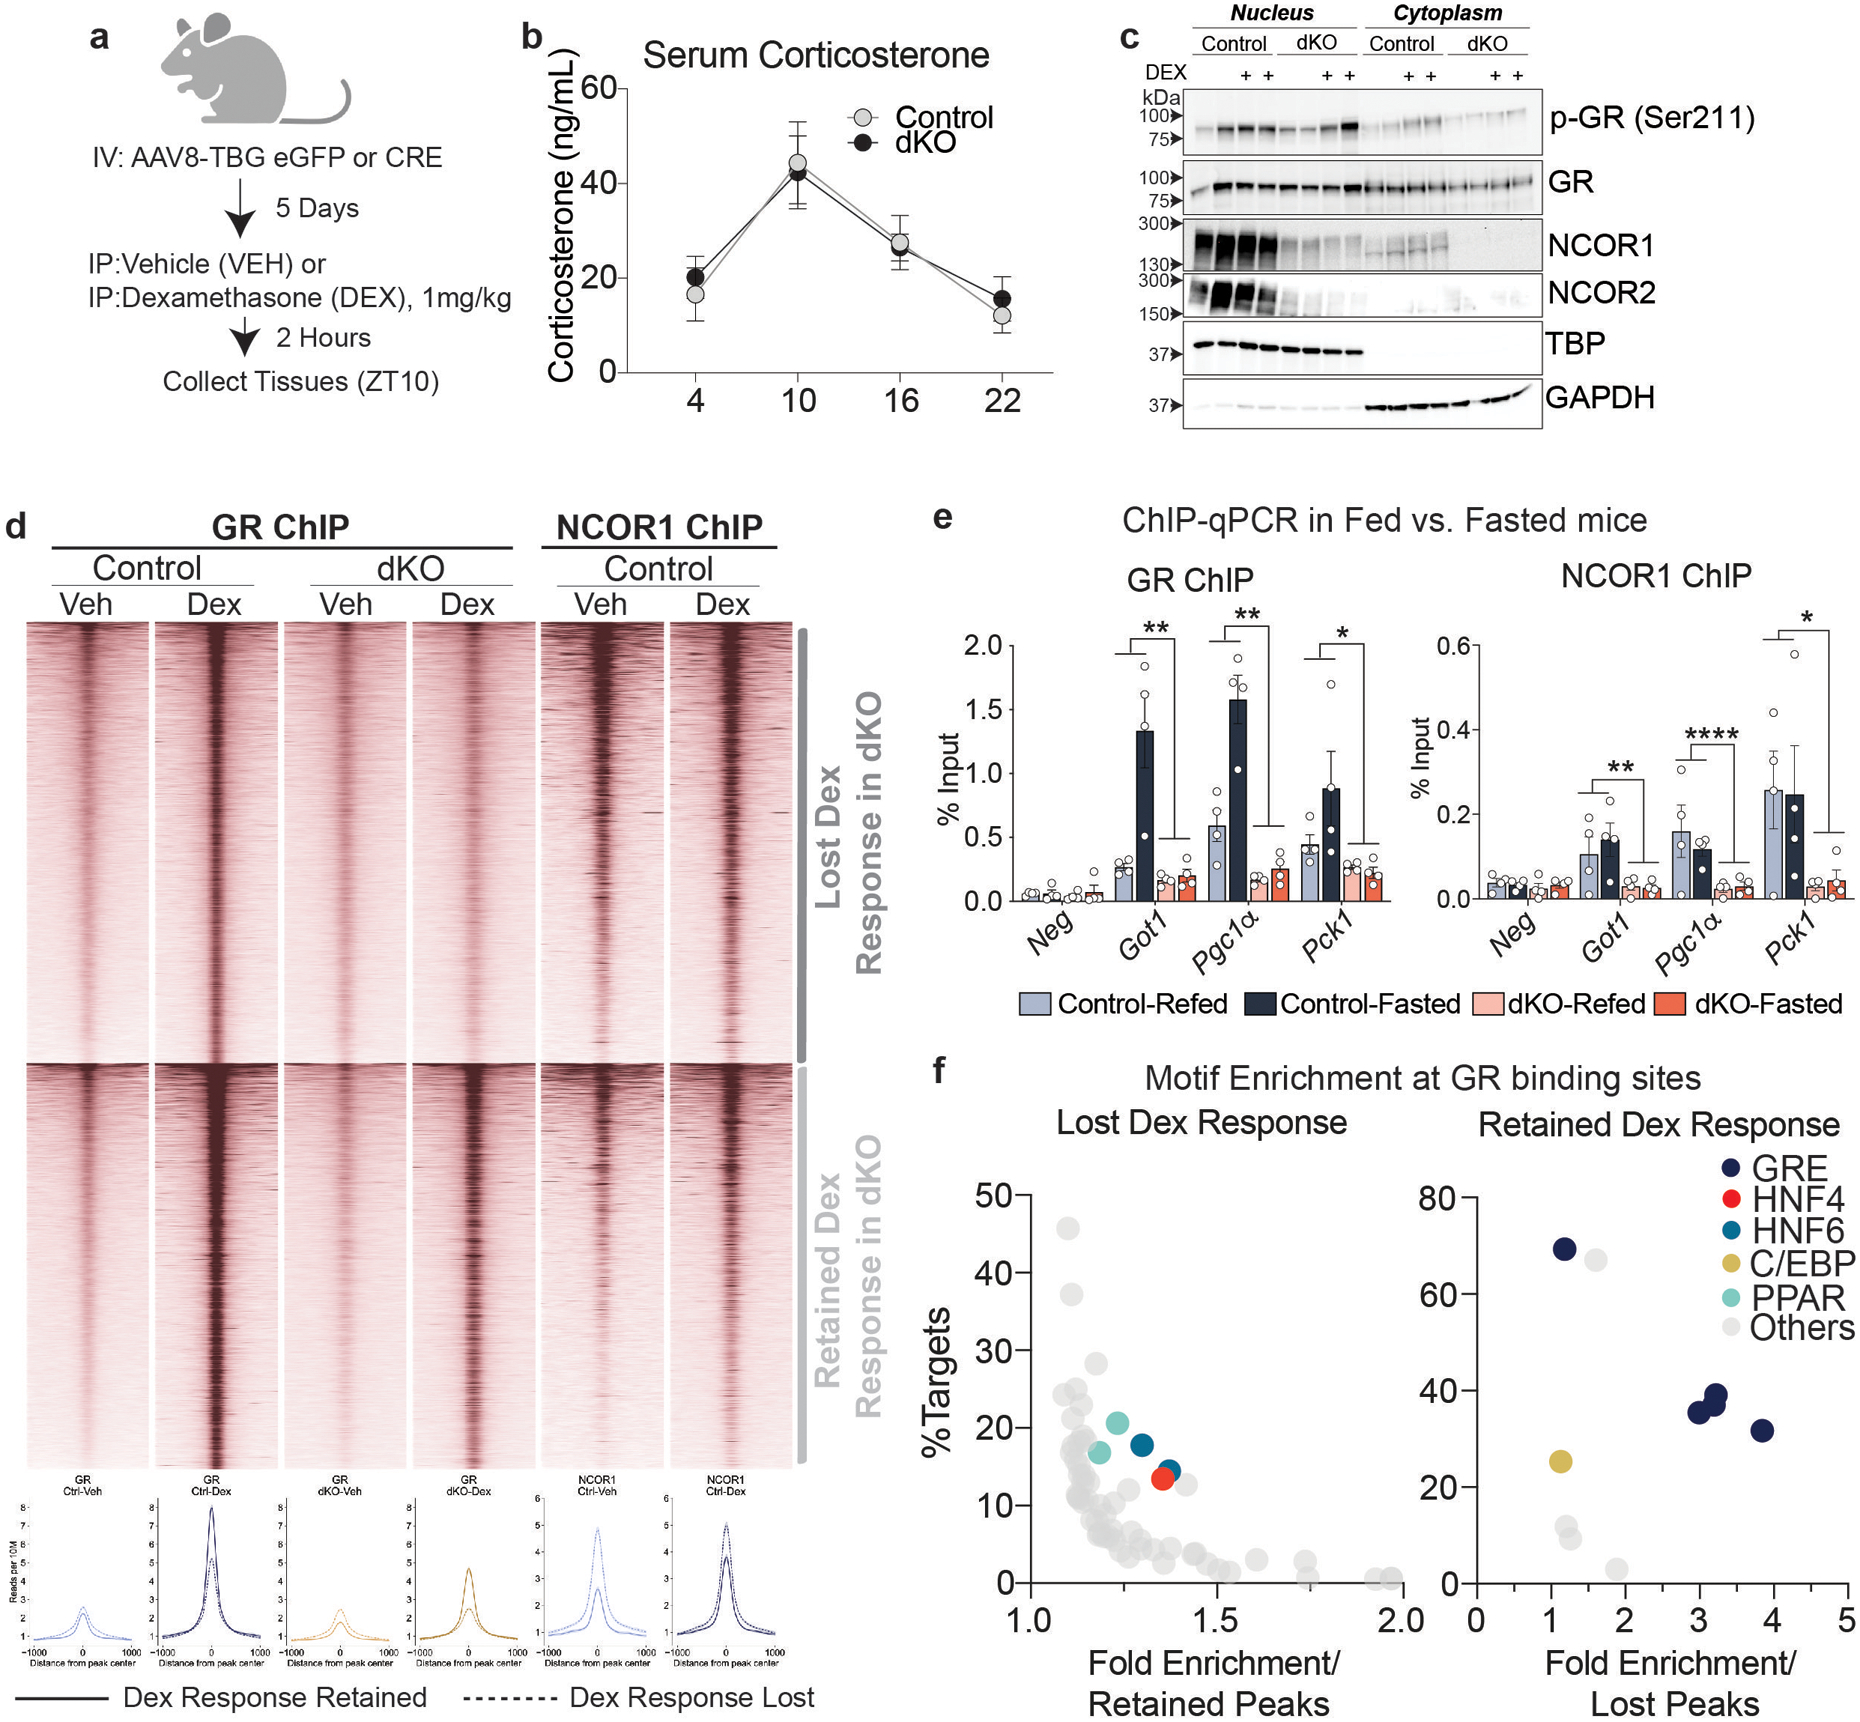
a, Experimental design (Created with BioRender.com). 5 days after AAV injection, mice were injected intraperitoneally with 1 mg/kg Dexamethasone (Dex) or vehicle (sterile saline). Mice were euthanized 2 hours after Dex administration (ZT10). b, Serum Corticosterone levels in control and dKO mice, measured serially over 24 hours (Control (n=6 mice) dKO (n=8 mice) and plotted as mean +/− S.E.M. c, Representative western blot of nuclear and cytoplasmic extracts (total of 4 samples were assayed). Samples were loaded into 3 separate gels and equal loading was confirmed by TBP and GAPDH blots on each membrane. d, Heatmap of all GR ChIP peaks induced by Dex treatment in control mice. Lower panel shows average ChIP profile of peaks with lost Dex response vs. retained Dex response GR binding. e, GR and NCOR1 ChIP-qPCR in animals fasted for 24 hours (fasted) and animals fasted for 24 hours and refed for 3 hours (Fed) at example loci exhibiting a blunted response to Dex treatment. Data shown as percent enrichment relative to input. Biological replicates are plotted (n=4 mice per group) as mean +/− S.E.M. and p-values for Genotype effect were calculated by two-way ANOVA: GR ChIP Got1 p=.0071, Pgc1α p=.0051, Pck1 p=.0137 and NCOR1 ChIP Got1 p=.0013, Pgc1α p<.0001, Pck1 p=.0174) f, Motif analysis at sites with lost Dex-induced GR binding and those with retained GR binding. X-axis indicates the fold enrichment relative to either retained or lost peaks, y-axis indicates % of peaks with that motif.
Supplementary Material
ACKNOWLEDGMENTS
We thank H.C.B. Nguyen, K. Zhu, L. Woodie, and T.R. Matsuura for valuable discussions and B.M. Krusen for assistance with mouse husbandry. We thank Yang Xiao for technical advice on ATACseq and Ronald N. Cohen (Section of Endocrinology, Diabetes, and Metabolism, Department of Medicine, The University of Chicago, 900 E 57th Street, KCBD 8126, Chicago, IL 60637, USA.) for providing the NCOR2 floxed mice. We thank the Functional Genomics Core of the Penn Diabetes Research Center (DK19525) for assistance with bioinformatics and next generation sequencing as well as Lan Cheng and the Institute for Diabetes, Obesity, and Metabolism Histology Core for assistance with slide preparation. Experimental schematics were created with BioRender.com. This work was supported by NIDDK grants R01DK43806 (M.A.L.), T32 DK007314 (A.K.H), and F32 DK122684 (A.K.H.), the Osamu Hayaishi Memorial Scholarship for Study Abroad (S.I.), the Uehara Memorial Foundation (S.I.), Leading Young Researcher Overseas Visit Program and The Cell Science Research Foundation (S.I), the Cox Medical Institute, and the JPB Foundation.
Footnotes
COMPETING INTERESTS
MAL is a member of a scientific advisory board for Pfizer, has consulted for Madrigal Pharmaceuticals, and is co-founder and scientific advisory board member for Flare Therapeutics.
DATA AVAILABILITY
The RNAseq, ATACseq, and ChIPseq datasets have been deposited in Gene Expression Ominbus (GEO), accession GSE234234. This paper also utilized publicly available ChIPseq and RNAseq data which includes: NCOR1 ChIP (GSM64702723), NCOR2 ChIP (GSM123649424), GR ChIP (GSE4567463) CREB ChIP (GSE4567463), PPARα ChIP (GSE11315749), GR ChIP in HNF4a KO (E-MTAB-1022443 ) and GR KO RNAseq (GSE173723, ZT1038).
CODE AVAILABILITY
No custom code is reported in this manuscript.
REFERENCES
- 1.DeBosscher K, Desmet SJ, Clarisse D, Estébanez-Perpiña E & Brunsveld L Nuclear receptor crosstalk - defining the mechanisms for therapeutic innovation. Nature reviews. Endocrinology 16, 363–377 (2020). [DOI] [PubMed] [Google Scholar]
- 2.Xiao Y, Kim M & Lazar MA Nuclear receptors and transcriptional regulation in non-alcoholic fatty liver disease. Molecular Metabolism 50, 101119 (2021). [DOI] [PMC free article] [PubMed] [Google Scholar]
- 3.Xiao Y, Kim M & Lazar MA Nuclear receptors and transcriptional regulation in non-alcoholic fatty liver disease. Molecular Metabolism 50, 101119 (2021). [DOI] [PMC free article] [PubMed] [Google Scholar]
- 4.Schulman IG Nuclear receptors as drug targets for metabolic disease. Adv Drug Deliver Rev 62, 1307–1315 (2010). [DOI] [PMC free article] [PubMed] [Google Scholar]
- 5.Ahmadian M. et al. PPARγ signaling and metabolism: the good, the bad and the future. Nat Med 19, 557–566 (2013). [DOI] [PMC free article] [PubMed] [Google Scholar]
- 6.Li J-X & Cummins CL Fresh insights into glucocorticoid-induced diabetes mellitus and new therapeutic directions. Nat Rev Endocrinol 18, 540–557 (2022). [DOI] [PMC free article] [PubMed] [Google Scholar]
- 7.Caratti G. et al. Glucocorticoid receptor function in health and disease. Clin Endocrinol 83, 441–448 (2015). [DOI] [PubMed] [Google Scholar]
- 8.Lonard DM & O’Malley BW Nuclear receptor coregulators: modulators of pathology and therapeutic targets. Nature reviews. Endocrinology 8, 598–604 (2012). [DOI] [PMC free article] [PubMed] [Google Scholar]
- 9.Park E-J et al. SMRTe, a silencing mediator for retinoid and thyroid hormone receptors-extended isoform that is more related to the nuclear receptor corepressor. Proc National Acad Sci 96, 3519–3524 (1999). [DOI] [PMC free article] [PubMed] [Google Scholar]
- 10.Ordentlich P. et al. Unique forms of human and mouse nuclear receptor corepressor SMRT. Proc National Acad Sci 96, 2639–2644 (1999). [DOI] [PMC free article] [PubMed] [Google Scholar]
- 11.Jepsen K. et al. Combinatorial roles of the nuclear receptor corepressor in transcription and development. Cell 102, 753–763 (2000). [DOI] [PubMed] [Google Scholar]
- 12.Jepsen K., Gleiberman AS, Shi C, Simon DI & Rosenfeld MG Cooperative regulation in development by SMRT and FOXP1. Gene Dev 22, 740–745 (2008). [DOI] [PMC free article] [PubMed] [Google Scholar]
- 13.Astapova I. et al. The nuclear corepressor, NCoR, regulates thyroid hormone action in vivo. Proc National Acad Sci 105, 19544–19549 (2008). [DOI] [PMC free article] [PubMed] [Google Scholar]
- 14.Astapova I. et al. The Nuclear Receptor Corepressor (NCoR) Controls Thyroid Hormone Sensitivity and the Set Point of the Hypothalamic-Pituitary-Thyroid Axis. Mol Endocrinol 25, 212–224 (2011). [DOI] [PMC free article] [PubMed] [Google Scholar]
- 15.Fozzatti L. et al. Resistance to thyroid hormone is modulated in vivo by the nuclear receptor corepressor (NCOR1). Proc National Acad Sci 108, 17462–17467 (2011). [DOI] [PMC free article] [PubMed] [Google Scholar]
- 16.Shimizu H. et al. NCoR1 and SMRT Play Unique Roles in Thyroid Hormone Action In Vivo. Molecular and cellular biology 35, 555–565 (2015). [DOI] [PMC free article] [PubMed] [Google Scholar]
- 17.Nofsinger RR et al. SMRT repression of nuclear receptors controls the adipogenic set point and metabolic homeostasis. Proc National Acad Sci 105, 20021–20026 (2008). [DOI] [PMC free article] [PubMed] [Google Scholar]
- 18.Reilly SM et al. Nuclear Receptor Corepressor SMRT Regulates Mitochondrial Oxidative Metabolism and Mediates Aging-Related Metabolic Deterioration. Cell metabolism 12, 643–653 (2010). [DOI] [PMC free article] [PubMed] [Google Scholar]
- 19.Zhang J, Kalkum M, Chait BT & Roeder RG The N-CoR-HDAC3 Nuclear Receptor Corepressor Complex Inhibits the JNK Pathway through the Integral Subunit GPS2. Mol Cell 9, 611–623 (2002). [DOI] [PubMed] [Google Scholar]
- 20.Wen YD et al. The histone deacetylase-3 complex contains nuclear receptor corepressors. Proceedings of the National Academy of Sciences 97, 7202–7207 (2000). [DOI] [PMC free article] [PubMed] [Google Scholar]
- 21.Li J. et al. Both corepressor proteins SMRT and N-CoR exist in large protein complexes containing HDAC3. The EMBO journal 19, 4342–4350 (2000). [DOI] [PMC free article] [PubMed] [Google Scholar]
- 22.Guenther MG et al. A core SMRT corepressor complex containing HDAC3 and TBL1, a WD40-repeat protein linked to deafness. Genes & development 14, 1048–1057 (2000). [PMC free article] [PubMed] [Google Scholar]
- 23.Feng D. et al. A circadian rhythm orchestrated by histone deacetylase 3 controls hepatic lipid metabolism. Science 331, 1315–1319 (2011). [DOI] [PMC free article] [PubMed] [Google Scholar]
- 24.Sun Z. et al. Deacetylase-independent function of HDAC3 in transcription and metabolism requires nuclear receptor corepressor. Molecular cell 52, 769–782 (2013). [DOI] [PMC free article] [PubMed] [Google Scholar]
- 25.Sun Z. et al. Hepatic Hdac3 promotes gluconeogenesis by repressing lipid synthesis and sequestration. Nature medicine 18, 934–942 (2012). [DOI] [PMC free article] [PubMed] [Google Scholar]
- 26.Jo YS et al. Phosphorylation of the nuclear receptor corepressor 1 by protein kinase B switches its corepressor targets in the liver in mice. Hepatology 62, 1606–1618 (2015). [DOI] [PMC free article] [PubMed] [Google Scholar]
- 27.Han H-S, Choi BH, Kim JS, Kang G & Koo S-H Hepatic Crtc2 controls whole body energy metabolism via a miR-34a-Fgf21 axis. Nat. Commun 8, 1878 (2017). [DOI] [PMC free article] [PubMed] [Google Scholar]
- 28.Selen ES et al. Requirement of hepatic pyruvate carboxylase during fasting, high fat, and ketogenic diet. J. Biol. Chem 298, 102648 (2022). [DOI] [PMC free article] [PubMed] [Google Scholar]
- 29.Bose SK, Hutson I & Harris CA Hepatic Glucocorticoid Receptor Plays a Greater Role Than Adipose GR in Metabolic Syndrome Despite Renal Compensation. Endocrinology 157, 4943–4960 (2016). [DOI] [PMC free article] [PubMed] [Google Scholar]
- 30.Estall JL et al. PGC-1α negatively regulates hepatic FGF21 expression by modulating the heme/Rev-Erbα axis. Proc. Natl. Acad. Sci 106, 22510–22515 (2009). [DOI] [PMC free article] [PubMed] [Google Scholar]
- 31.You S-H et al. Nuclear receptor co-repressors are required for the histone-deacetylase activity of HDAC3~in vivo. Nature structural & molecular biology 20, 182–187 (2013). [DOI] [PMC free article] [PubMed] [Google Scholar]
- 32.Zhang X, Yang S, Chen J & Su Z Unraveling the Regulation of Hepatic Gluconeogenesis. Front Endocrinol 9, 802 (2019). [DOI] [PMC free article] [PubMed] [Google Scholar]
- 33.Rui L. Energy metabolism in the liver. Comprehensive Physiology 4, 177–197 (2014). [DOI] [PMC free article] [PubMed] [Google Scholar]
- 34.Arden C. et al. Elevated Glucose Represses Liver Glucokinase and Induces Its Regulatory Protein to Safeguard Hepatic Phosphate Homeostasis. Diabetes 60, 3110–3120 (2011). [DOI] [PMC free article] [PubMed] [Google Scholar]
- 35.Bideyan L, Nagari R & Tontonoz P Hepatic transcriptional responses to fasting and feeding. Genes & development 35, 635–657 (2021). [DOI] [PMC free article] [PubMed] [Google Scholar]
- 36.Felig P. The glucose-alanine cycle. Metabolis 22, 179–207 (1973). [DOI] [PubMed] [Google Scholar]
- 37.Kuo T, McQueen A, Chen T-C & Wang J-C Glucocorticoid Signaling, From Molecules to Mice to Man. Adv Exp Med Biol 872, 99–126 (2015). [DOI] [PMC free article] [PubMed] [Google Scholar]
- 38.Præstholm SM et al. Impaired glucocorticoid receptor expression in liver disrupts feeding-induced gene expression, glucose uptake, and glycogen storage. Cell Reports 37, 109938 (2021). [DOI] [PubMed] [Google Scholar]
- 39.Opherk C. et al. Inactivation of the Glucocorticoid Receptor in Hepatocytes Leads to Fasting Hypoglycemia and Ameliorates Hyperglycemia in Streptozotocin-Induced Diabetes Mellitus. Mol Endocrinol 18, 1346–1353 (2004). [DOI] [PubMed] [Google Scholar]
- 40.Tronche F. et al. Glucocorticoid receptor function in hepatocytes is essential to promote postnatal body growth. Gene Dev 18, 492–497 (2004). [DOI] [PMC free article] [PubMed] [Google Scholar]
- 41.Quagliarini F. et al. Cistromic Reprogramming of the Diurnal Glucocorticoid Hormone Response by High-Fat Diet. Mol. Cell 76, 531–545.e5 (2019). [DOI] [PMC free article] [PubMed] [Google Scholar]
- 42.Armour SM et al. An HDAC3-PROX1 corepressor module acts on HNF4$\alpha$ to control hepatic triglycerides. Nature Communications 8, 147 (2017). [DOI] [PMC free article] [PubMed] [Google Scholar]
- 43.Hunter AL et al. HNF4A modulates glucocorticoid action in the liver. Cell Rep. 39, 110697 (2022). [DOI] [PMC free article] [PubMed] [Google Scholar]
- 44.Hörlein AJ et al. Ligand-independent repression by the thyroid hormone receptor mediated by a nuclear receptor co-repressor. Nature 377, 397–404 (1995). [DOI] [PubMed] [Google Scholar]
- 45.Sande S & Privalsky ML Identification of TRACs (T3 receptor-associating cofactors), a family of cofactors that associate with, and modulate the activity of, nuclear hormone receptors. Molecular Endocrinology 10, 813–825 (1996). [DOI] [PubMed] [Google Scholar]
- 46.Chen JD & Evans RM A transcriptional co-repressor that interacts with nuclear hormone receptors. Nature 377, 454–457 (1995). [DOI] [PubMed] [Google Scholar]
- 47.Ritter MJ et al. Nuclear Receptor CoRepressors, NCOR1 and SMRT, are required for maintaining systemic metabolic homeostasis. Molecular Metabolism 53, 101315 (2021). [DOI] [PMC free article] [PubMed] [Google Scholar]
- 48.You S-H et al. Nuclear receptor co-repressors are required for the histone-deacetylase activity of HDAC3~in vivo. Nature structural & molecular biology 20, 182–187 (2013). [DOI] [PMC free article] [PubMed] [Google Scholar]
- 49.Liang N. et al. Hepatocyte-specific loss of GPS2 in mice reduces non-alcoholic steatohepatitis via activation of PPAR^\textpm. Nature Communications 1–14 (2019) doi: 10.1038/s41467-019-09524-z. [DOI] [PMC free article] [PubMed] [Google Scholar]
- 50.Kulozik P. et al. Hepatic Deficiency in Transcriptional Cofactor TBL1 Promotes Liver Steatosis and Hypertriglyceridemia. Cell metabolism 13, 389–400 (2011). [DOI] [PubMed] [Google Scholar]
- 51.John S. et al. Chromatin accessibility pre-determines glucocorticoid receptor binding patterns. Nat. Genet 43, 264–268 (2011). [DOI] [PMC free article] [PubMed] [Google Scholar]
- 52.Emmett MJ et al. Histone deacetylase 3 prepares brown adipose tissue for acute thermogenic challenge. Nature 17, 10 (2017). [DOI] [PMC free article] [PubMed] [Google Scholar]
- 53.Abe Y. et al. RANK ligand converts the NCoR/HDAC3 co-repressor to a PGC1β- and RNA-dependent co-activator of osteoclast gene expression. Mol. Cell 83, 3421–3437.e11 (2023). [DOI] [PMC free article] [PubMed] [Google Scholar]
- 54.Nguyen HCB, Adlanmerini M, Hauck AK & Lazar MA Dichotomous engagement of HDAC3 activity governs inflammatory responses. Nature 584, 286–290 (2020). [DOI] [PMC free article] [PubMed] [Google Scholar]
- 55.Mullican SE et al. Histone deacetylase 3 is an epigenomic brake in macrophage alternative activation. Genes Dev. 25, 2480–2488 (2011). [DOI] [PMC free article] [PubMed] [Google Scholar]
- 56.Xie Z. et al. Gene Set Knowledge Discovery with Enrichr. Current protocols 1, e90 (2021). [DOI] [PMC free article] [PubMed] [Google Scholar]
- 57.Kuleshov MV et al. Enrichr: a comprehensive gene set enrichment analysis web server 2016 update. Nucleic Acids Research 44, W90–7 (2016). [DOI] [PMC free article] [PubMed] [Google Scholar]
- 58.Chen EY et al. Enrichr: interactive and collaborative HTML5 gene list enrichment analysis tool. BMC bioinformatics 14, 128–14 (2013). [DOI] [PMC free article] [PubMed] [Google Scholar]
- 59.Corces MR et al. An improved ATAC-seq protocol reduces background and enables interrogation of frozen tissues. Nature Methods 14, 959–962 (2017). [DOI] [PMC free article] [PubMed] [Google Scholar]
- 60.Ackermann AM, Wang Z, Schug J, Naji A & Kaestner KH Integration of ATAC-seq and RNA-seq identifies human alpha cell and beta cell signature genes. Molecular Metabolism 5, 233–244 (2016). [DOI] [PMC free article] [PubMed] [Google Scholar]
- 61.Zheng R. et al. Cistrome Data Browser: expanded datasets and new tools for gene regulatory analysis. Nucleic Acids Res 47, gky1094- (2018). [DOI] [PMC free article] [PubMed] [Google Scholar]
- 62.Mei S. et al. Cistrome Data Browser: a data portal for ChIP-Seq and chromatin accessibility data in human and mouse. Nucleic Acids Res 45, D658–D662 (2017). [DOI] [PMC free article] [PubMed] [Google Scholar]
- 63.Everett LJ et al. Integrative genomic analysis of CREB defines a critical role for transcription factor networks in mediating the fed/fasted switch in liver. Bmc Genomics 14, 337–337 (2013). [DOI] [PMC free article] [PubMed] [Google Scholar]
- 64.Guan D. et al. The hepatocyte clock and feeding control chronophysiology of multiple liver cell types. Science 369, 1388–1394 (2020). [DOI] [PMC free article] [PubMed] [Google Scholar]
- 65.Armour SM et al. An HDAC3-PROX1 corepressor module acts on HNF4$\alpha$ to control hepatic triglycerides. Nature Communications 8, 147 (2017). [DOI] [PMC free article] [PubMed] [Google Scholar]
- 66.Papazyan R. et al. Physiological Suppression of Lipotoxic Liver Damage by Complementary Actions of HDAC3 and\ SCAP/SREBP. Cell metabolism 24, 863–874 (2016). [DOI] [PMC free article] [PubMed] [Google Scholar]
Associated Data
This section collects any data citations, data availability statements, or supplementary materials included in this article.
Supplementary Materials
Data Availability Statement
The RNAseq, ATACseq, and ChIPseq datasets have been deposited in Gene Expression Ominbus (GEO), accession GSE234234. This paper also utilized publicly available ChIPseq and RNAseq data which includes: NCOR1 ChIP (GSM64702723), NCOR2 ChIP (GSM123649424), GR ChIP (GSE4567463) CREB ChIP (GSE4567463), PPARα ChIP (GSE11315749), GR ChIP in HNF4a KO (E-MTAB-1022443 ) and GR KO RNAseq (GSE173723, ZT1038).
No custom code is reported in this manuscript.


