Abstract
The construction of an in vitro 3D cellular model to mimic the human liver is highly desired for drug discovery and clinical applications, such as patient‐specific treatment and cell‐based therapy in regenerative medicine. However, current bioprinting strategies are limited in their ability to generate multiple cell‐laden microtissues with biomimetic structures. This study presents a method for producing hepatic‐lobule‐like microtissue spheroids using a bioprinting system incorporating a precursor cartridge and microfluidic emulsification system. The multiple cell‐laden microtissue spheroids can be successfully generated at a speed of approximately 45 spheroids min−1 and with a uniform diameter. Hepatic and endothelial cells are patterned in a microtissue spheroid with the biomimetic structure of a liver lobule. The spheroids allow long‐term culture with high cell viability, and the structural integrity is maintained longer than that of non‐structured spheroids. Furthermore, structured spheroids show high MRP2, albumin, and CD31 expression levels. In addition, the in vivo study reveals that structured microtissue spheroids are stably engrafted. These results demonstrate that the method provides a valuable 3D structured microtissue spheroid model with lobule‐like constructs and liver functions.
Keywords: 3D bioprinting, hepatic lobules, microtissues, preset extrusions, spheroids, tissue engineering
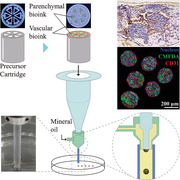
A technique for producing multicellular microtissue spheroids using bioprinting and a microfluidic emulsification system is presented. Spheroids with the biomimetic structure of liver lobules are produced with high throughput and uniform size. The spheroids with biomimetic structure show enhanced functionalities and stable structural integrity. In addition, the in vivo study reveals enhanced engraftment potential of the structured spheroids.
1. Introduction
In recent years, many studies have sought to develop 3D organ models to organize cells with physiologically relevant and specific morphologies. One major motivation driving this effort is the lack of in vitro organ‐mimetic models capable of mimicking native human organs. For example, to replicate liver functions, 2D hepatocyte culture systems are commonly used. However, hepatocytes in 2D cultures lack spatial cell‐cell and cell‐matrix interactions, which may affect phenotypic functions.[ 1 , 2 ] To date, cell‐laden 3D liver constructs have been fabricated as cell microfibers, spheroids, and sheets.[ 3 , 4 , 5 , 6 , 7 , 8 ]
The liver consists of a hepatic lobule with microscale architecture and an incorporated vascular network. As the native human liver tissue is composed of a radial structure with embedded vessels, engineering a 3D environment that recapitulates hepatic‐lobule‐like constructs and a multicellular environment is essential for functional expression.[ 9 , 10 , 11 ] In addition, the interaction between cells and the extracellular matrix together with spatial cell arrangement improves cell functions and differentiation.[ 12 , 13 , 14 ]
3D bioprinting is considered a promising technology for producing engineered organs or tissue substitutes; however, mimicking the complicated structure of human organs or tissues has remained a major hurdle due to various limitations, such as the lack of vascular structure, low resolution, and difficulty in handling heterogeneous cells.[ 15 , 16 , 17 ] We previously reported a preset extrusion bioprinting technique that facilitates the fabrication of complex 3D tissue structures and more closely mimics human tissues with high resolution and simultaneous printing of various bioinks.[ 18 , 19 ] The use of a precursor cartridge is an authentic feature of the preset extrusion. The precursor cartridge has the same cross‐sectional shape as the intended structure and is compartmentalized to prevent the mixing of multiple bioinks. Each compartment is filled with the desired bioink. The highly viscous feature of the bioinks prevents mixing during extrusion and enables the miniaturization of the cross‐sectional structure without changing the shape. We produced a tissue block that mimics the structural characteristics of the liver lobule using a preset extrusion technique.[ 19 ] Even though the printed tissue had endothelialized lumens, large‐sized tissue blocks are disadvantageous in terms of the supplementation of oxygen and nutrients and clearance of waste metabolites; therefore, it is mandatory to use bioreactors for long‐term culture.
In recent years, various types of 3D cell aggregates, such as spheroids, organoids, and tissue buds, have received increasing attention in regenerative medicine.[ 20 , 21 , 22 , 23 ] Their small diameter (60–300 µm) enables direct injection to specific sites in the body. In addition, the surface area to volume ratio is higher than that of the tissue block, and these aggregates can survive with enhanced viability and engraftment, long after injection.[ 24 ] However, many 3D cell aggregates consist of only one cell type or a homogeneous mixture of multiple cell types without spatial patterns, and it is not easy to design a structure. Therefore, there is an increasing need to develop technologies to produce structured 3D cell aggregates to enhance their functionality.
There are various spheroid production methods, such as suspension cultures using the spinner flask[ 25 ] and the rotating wall vessel,[ 26 ] the hanging drop method,[ 27 ] the low attachment microwell method,[ 28 ] the bioprinting method,[ 29 ] and the microfluidic method.[ 30 ]
Among these, microfabrication‐based methods, such as bioprinting and microfluidics, show satisfactory performance in terms of size uniformity and high throughput production. In particular, the microfluidic emulsification system is an efficient method to rapidly produce spheroids of uniform size. This technology allows continuous droplet generation, which encapsulates the cells within. The laminar flow of the aqueous solution in the microchannel is broken into droplets and encapsulated by an immiscible phase. The droplet size can be controlled by changing the flow rate of the aqueous and immiscible phases.
In the current study, we aimed to devise a technique to produce 3D structured microtissue spheroids by combining preset extrusion bioprinting and microfluidic emulsification systems. Our method produced microstructured spheroids efficiently with high speed and uniform size without any crosslinking agents. Microtissue spheroids with lobule‐like cross‐sectional structure were fabricated using the technique we developed and compared with microtissue spheroids without structure both in vitro and in vivo. The structured microtissue spheroids showed improved protein secretion and enzyme expression. Furthermore, the structured microtissue spheroids were advantageous in terms of maintaining structural integrity due to the wrapping of endothelial cells.
2. Results and Discussion
2.1. Principles of Structured Microtissue Spheroid Production
Figure 1A shows a schematic representation of the research strategy. First, a precursor cartridge, which is compartmentalized as the intended cross‐section, was produced and each compartment was filled with individual bioinks. The bioink‐loaded precursor cartridge was placed into the syringe and the syringe was installed on the dispensing system of the 3D bioprinter (3DX bioprinter; T&R Biofab, Siheung, Gyeonggi, Republic of Korea). The cross‐section of the precursor cartridge was the same as the cross‐section of the microtissue spheroid and it was compartmentalized into parenchymal and vascular sections to mimic liver lobule‐like structures.
Figure 1.
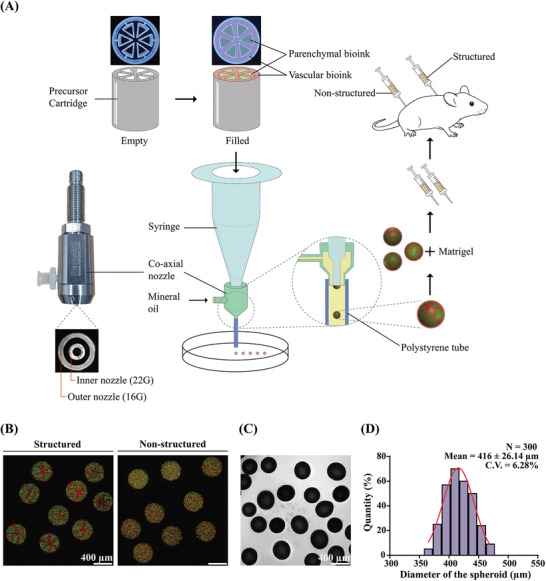
A) Schematic representation of the research strategy. Microtissue spheroids are fabricated by combining preset extrusion bioprinting with a microfluidic emulsification system. The microtissue spheroids with or without biomimetic structure are used for the in vivo Matrigel plug assay. B) Fluorescence image of the fabricated microparticle with (left) or without (right) structure. Green‐ and red‐fluorescent particles are used for demonstration. The intended structure is observed in “structured” particles. C) Shadowgraphic microscopy image of the fabricated particles. D) Size distribution of the fabricated microparticles. The diameter is 416 ± 26.14 µm. Coefficient of variation: 6.28%; number of samples (N): 300.
Bioinks loaded in the precursor cartridge were extruded through the inner nozzle (gauge 22) of the coaxial nozzle. A polystyrene tube (inner diameter: 1.6 mm, outer diameter: 3.2 mm) was connected at the end of the outer nozzle of the coaxial nozzle and acted as the main channel. Highly viscous atelocollagen‐based bioink (Figure S1, Supporting Information) was used in this study; therefore, the Reynolds number generated during extrusion was very low because of the high viscosity of the bioink and the small diameter of the nozzle. Due to the non‐mixing characteristic of the low Reynolds number flow, the cross‐section was maintained during extrusion. A hydrophobic liquid (mineral oil) was flowed through the outer nozzle (gauge 16) of the coaxial nozzle, and a droplet of bioinks with the same cross‐section of the precursor cartridge was generated. This is an application of axisymmetric co‐flow drop formation.[ 31 , 32 ] The interface of the dispersed phase (bioinks extruded through the inner nozzle) was stretched and broken into droplets by viscous stress created by the continuous phase (mineral oil, Figure S2A, Supporting Information). The size of the droplet was determined by the diameter of the inner nozzle and flow rate of the dispersed and continuous phases when the liquid for the dispersed and continuous phases was fixed. The optimal flow rates of the continuous and dispersed phases were investigated using red‐dyed collagen and mineral oil (Figure S2B, Supporting Information). The flow rate of the continuous phase was fixed at Q c = 840 µL min−1, and the flow rates of the dispersed phase (Q d) were altered at 3, 8, 70, and 150 µL min−1. Droplets formed stably when Q d = 8 µL min−1. However, low flow rates resulted in randomly generated droplets that were very small (Q d = 3 µL min−1), and plug‐shaped droplets, whose length to width ratio was greater than 1, occupied the entire area of the main channel with a high flow rate (Q d = 70, 150 µL min−1). The shape of the plug‐shaped droplets changed into spheres as they exited the main channel because of surface tension (Figure S2C,D, Supporting Information).
Before we fabricated microtissue spheroids using bioinks, the design of the structure implemented was confirmed using red‐ and green‐fluorescent particles (2 µm diameter each; Thermo Fisher Scientific, Fremont, CA, USA) instead of cells (Figure 1B). The left panel depicts the droplets generated with the precursor cartridge and shows that the cross‐section of the precursor cartridge is implemented as intended. In contrast, no sign of lobule‐like structure was observed in the right panel of the figure, which is a photograph of droplets generated without precursor cartridge. The generated droplets maintained their shape and structure stable upon application of only thermal gelation (37 °C for ≈20 min) without any chemical or physical crosslinking, which is potentially hazardous for cells. Figure 1C,D show the size distribution of the droplets generated after the gelation of collagen. The mean diameter was approximately 416 µm, regardless of whether the precursor cartridge was used. The droplets can be continuously generated until the bioinks loaded in the precursor cartridge are totally extruded at a speed of approximately 45 droplets min−1 (Movie S1, Supporting Information).
2.2. Production of Structured Microtissue Spheroids
Microtissue spheroids were fabricated using the conditions described in Section 2.1. HepG2/C3A and EA.hy926, which are immortalized human umbilical vein endothelial cell lines, were used for fabricating parenchymal and vascular parts, respectively. As shown in Figure 2A, the initial diameter of the fabricated microtissue spheroids was markedly similar to that of the structured microdroplets without cells; however, this diameter decreased considerably within approximately 10 h of culture. This was only observed when the bioinks were used and not in structured microdroplets with fluorescent particles. This can be interpreted as the effect of a contractile force as the cells settle and grow in the 3D microenvironment in spheroids.
Figure 2.
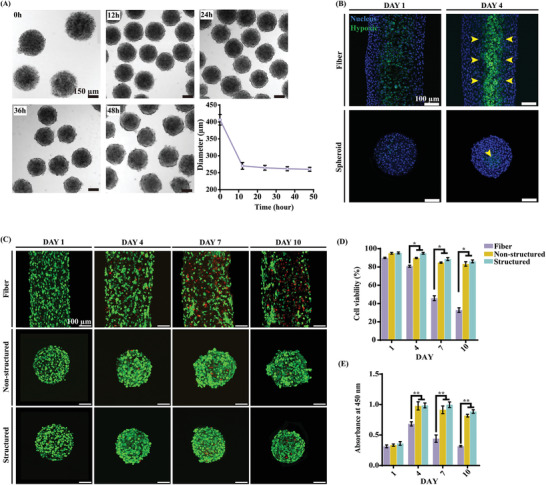
Properties and characteristics of microtissue spheroids. A) Change in the diameter of microtissue spheroids. B) ROS activity in the microtissue fiber and microtissue unit. The yellow arrows indicate ROS‐positive cells. C–E) Cell viability of the microtissue fiber and microtissue spheroids (structured and non‐structured) on days 1, 4, 7, and 10. The green‐fluorescent cells are alive, while the red‐fluorescent cells are dead. D–E) The asterisks indicate a significant difference between the microtissue fiber and spheroid (structured and non‐structured) on the same day (*p < 0.05, **p < 0.01).
Reactive oxygen species (ROS) activity in cells inside the microtissue fiber (upper panels) and spheroids (lower panels) was observed using the 2“,7”‐dichlorofluorescin assay (Figure 2B). Hypoxic conditions induce ROS production due to oxygen level limitations.[ 33 , 34 ] Note that the diameters of the microtissue fibers and spheroids are different because the diameter of microtissue spheroids decreased more drastically than that of microtissue fibers. In 3D culture, the hypoxic conditions can be significantly affected by the diameter of the structure and cell density; therefore, it is not appropriate to directly compare the two samples. However, as expected, cells along the core line of the microtissue fiber showed ROS activity on days 1 and 4 (Figure 2B, upper panels). On the contrary, in the case of the microtissue spheroids, ROS‐positive cells were observed only at the center point of the spheroid on either day 1 or 4 (Figure 2B, lower panels, yellow arrow). This is the characteristic of diffusion in cylindrical and spherical geometries, and it is expected that the microtissue spheroid is more advantageous than the fiber in terms of diffusion.
The viability of the cells inside the fabricated structured microtissue fiber and structured and non‐structured microtissue spheroids are shown in Figure 2C,D. The mineral oil, used as the continuous phase, has been widely used in various studies,[ 35 ] however, there are concerns of using oil for biological samples owing to potential toxicity of the oil.[ 36 , 37 ] We washed the samples 2–3 times with fresh media to remove residual oils, but applying an aqueous two‐phase system could be an appropriate alternative to avoid this concern.[ 38 , 39 ] The results of the live/dead assay of the mid‐section through the microtissue showed that the cell viability of the microtissue fiber decreased gradually over time. In particular, the core of the microtissue showed relatively lower viability than the outer part. Cell proliferation measured using the Cell Counting Kit‐8 assay was in agreement with the results of the live/dead assay (Figure 2E). However, microtissue spheroids, regardless of the presence of a lobule‐like structure, showed enhanced cell viability (Figure 2C–E). The presence of a lobule‐like structure might not affect the cell viability, even though the structured spheroids showed slightly improved (not statistically significant) cell viability and proliferation.
Figure 3 shows the detailed observation of microtissue spheroids with and without a lobule‐like structure. The first and third columns show the mid‐section of microtissue spheroids without and with a lobule‐like structure, respectively, and the second and fourth columns represent the surface of the microtissue spheroids without and with a lobule‐like structure, respectively. Endothelial cells (EA.hy926 cells, shown in red) covered the entire surface of the structured spheroid; however, the surface of the non‐structured spheroids showed a random distribution of EA.hy926 and HepG2/C3A cells (shown in green). Although both the structured and non‐structured microtissue spheroids exhibited comparable cell viability, there was a significant deviation in general morphology between the two by day 10. We believe that the structured allocation and full encapsulation of the parenchymal section by endothelial cells may have contributed to the maintenance of the morphology of the structured spheroids, as demonstrated by the confocal image of the cross‐section on day 10, which we believe is comparable to the spatial pattern of the initial precursor cartridge. The width of the vascular structure was approximately 20 µm on day 4, which is much smaller than the resolution of the conventional extrusion‐based 3D bioprinting. In contrast, non‐structured microtissue spheroids showed transitory morphogenic shift by day 7 as budding and surface localization of endothelial cells occurred because of the self‐organization of hepatic multicellular spheroids, as previously reported.[ 40 , 41 ] The cross‐section of the structured microtissue spheroid showed a clear pattern and difference with the outer surface. As shown in Figure 3, the designed structure was implemented in microtissue spheroids and maintained for at least 10 days. However, the cross‐section of the non‐structured spheroid was markedly similar to that of the surface and showed no sign of lobule‐like structure.
Figure 3.
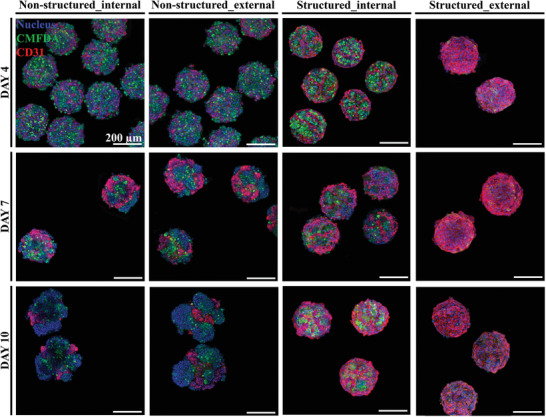
Morphology of structured and non‐structured microtissue spheroids. External and internal structures of microtissue spheroids on days 4, 7, and 10. The hepatic‐lobule‐like structure is expressed as intended, and the structural integrity is maintained longer in the structured group than in the non‐structured group.
2.3. Functions of Microtissue Spheroids
To evaluate the intracellular signaling pathway and properties of the hepatic lobule tissue, western blot analysis, enzyme‐linked immunosorbent assay (ELISA), and enzyme activity assessment were conducted. To confirm the presence of hepatic proteins (MRP2 and albumin) and endothelial protein (CD31), protein density was evaluated using western blotting (Figure 4A–D). Comparison of the expression of MRP2 and albumin between structured and non‐structured microtissue spheroids revealed that the overall structured spheroid protein density was higher than that of non‐structured spheroids. Albumin expression was significantly increased in both models and was higher in the structured than that in the non‐structured spheroids (Figure 4B–C). In addition, the expression of CD31 associated with vascularization was measured. CD31 expression was maintained in the structured spheroids from days 4 to 10, but decreased in the non‐structured spheroids during the same period (Figure 4D). Moreover, to confirm the intracellular signaling pathway, the expression of β‐catenin and P‐β‐catenin, which are both key molecules of the canonical Wnt signaling pathway, was evaluated using western blotting (Figure 4A,E,F). β‐catenin expression was significantly increased in both structured and non‐structured spheroids and was higher in the structured spheroids than that in the non‐structured ones (Figure 4E). The level of P‐β‐catenin showed a tendency to gradually decrease, whereas that of β‐catenin gradually increased (Figure 4F). It was assumed that structured spheroids had a more mature organization than that of the non‐structured ones as the presence of canonical Wnt signaling was confirmed in the former. The Wnt signaling pathway is widely known to be involved in cell differentiation and tissue maturation.[ 42 ]
Figure 4.
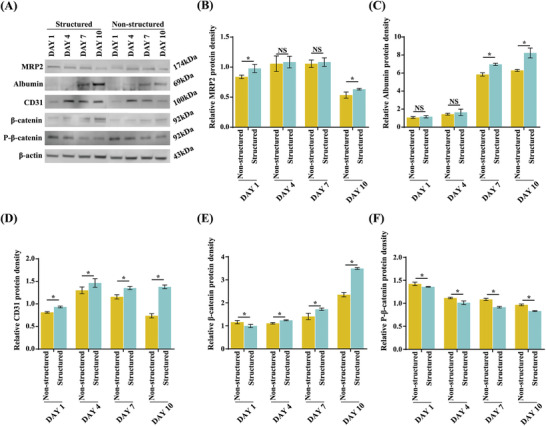
Western blot analysis of the micro hepatic lobule tissue on days 1, 4, 7, and 10. A) Bands specific to MRP2, albumin, CD31, β‐catenin, and P‐β‐catenin are visualized. The β‐actin‐specific band is used as a standard. B–F) The relative band density is measured compared to that of β‐actin. The asterisks indicate a significant difference between the structured and non‐structured groups on the same day.
Further, we analyzed albumin and alpha‐1 antitrypsin (AAT) secretion and urea production. In particular, albumin and AAT secretion gradually increased in the structured spheroids and was the highest on day 10 (Figure 5A–C). Urea production was maintained in the structured spheroids from days 4 to 10, whereas it decreased in the non‐structured spheroids (Figure 5B). These results suggest that structured spheroids synthesized more functional hepatic proteins than non‐structured ones.
Figure 5.
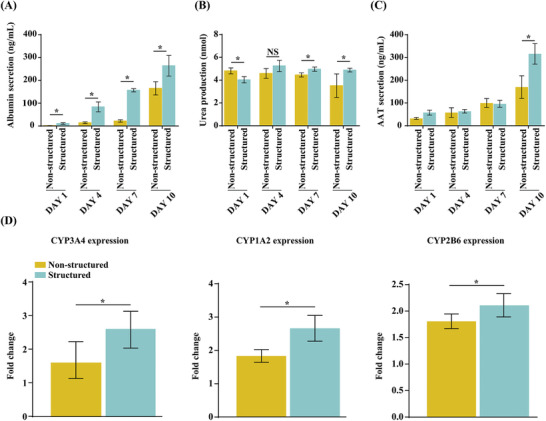
Evaluation of the hepatic function of non‐structured and structured hepatic lobules. A–C) Analysis of albumin (A), urea (B), and AAT (C) secretion using ELISA. D) CYP3A4 and CYP2B6 enzyme activity induced by rifampicin and CYP1A2 enzyme activity induced by omeprazole for 24 h. The asterisks indicate a significant difference between the structured and non‐structured groups (p < 0.05).
To measure the potential utility of the microhepatic lobule tissues for drug metabolism, we characterized human enzyme activity in each spheroid. Each major hepatic drug metabolism pathway was expressed in the microhepatic lobule tissue, including cytochrome P450 enzymes. We assessed the enzyme activity of CYP3A4 and CYP2B6 induced by rifampicin (50 × 10−6 m) and CYP1A2 induced by omeprazole (50 × 10−6 m) in each sample on day 10 after incubation for 24 h. Structured spheroids showed higher CYP3A4, CYP1A2, and CYP2B6 expression than that of non‐structured ones (Figure 5D). These results strongly suggest that structured microtissue spheroids showed better liver function against toxicity than that of non‐structured spheroids.
2.4. In Vivo Angiogenesis of the Matrigel Plug Assay
To investigate the difference between the angiogenic properties and engraftment ability of structured and non‐structured microtissue spheroids, an in vivo Matrigel plug angiogenic assay was performed. For this assay, 100 µL of Matrigel mixed with structured or non‐structured microtissue spheroids was injected subcutaneously into BALB/c nude mice (Figure 6A). Two weeks later, Matrigel plugs were recovered after euthanasia. As shown in Figure 6B, the Matrigel plugs were white in the negative control. In contrast, blood vessel formation was observed in the structured and non‐structured spheroid samples (black arrow), and Matrigel plugs appeared red, demonstrating the formation of functional vessels. Figure 6C shows the Matrigel plug immunohistochemical staining for alpha‐smooth muscle actin (α‐SMA) and CD31. Unlike in non‐structured spheroids, α‐SMA and CD31 were stained (black arrowhead), and the cell density was higher inside the structured samples (Figure 6C, Figure S3A, Supporting Information). These results showed that the structural integrity of the structured microtissue spheroid was more stable than that of the non‐structured ones and in agreement with the in vitro results. Furthermore, results of hematoxylin and eosin (H&E) staining and TUNEL assay for detecting apoptotic cells confirmed that the cells in the structured samples survived, whereas, in the non‐structured samples, cell death occurred resulting in a TUNEL‐positive signal (white arrowhead) (Figure 6D,E, and Figure S3B, Supporting Information). This indicates that the structured samples, which maintain a stable structure, have better engraftment and survival characteristics in the Matrigel than non‐structured samples after transplantation.
Figure 6.
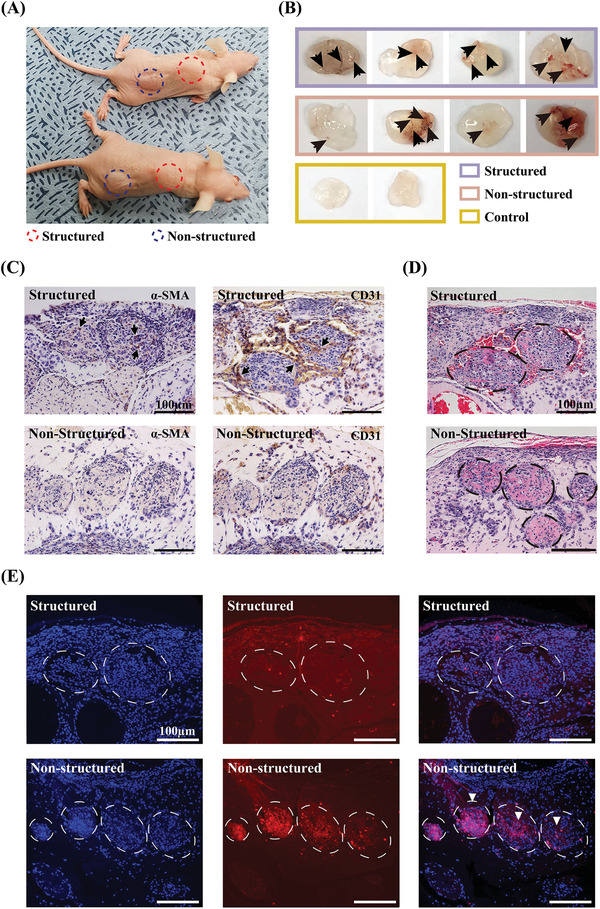
In vivo Matrigel plug assay of structured and non‐structured samples. A) Matrigel‐injected BALB/c‐nude mice. Structured or non‐structured spheroids encapsulated in Matrigel are injected subcutaneously. B) Aspect of the Matrigel plugs and blood vessel formation (black arrow). C) Immunohistochemical images of α‐SMA and CD31 in the Matrigel sections of structured and non‐structured spheroids. The black arrowheads indicate vessel growth inside the spheroids. D) Matrigel sections stained with H&E. E) TUNEL assay of Matrigel sections. Cell nuclei (DAPI) and condensed pyknotic nuclei (red) are merged indicating apoptotic cells (white arrowheads). Scale bars represent 100 µm.
In this study, we used HepG2/C3A because of its easy availability and stable phenotype. Although HepG2/C3A is a suitable choice for in vitro study of hepatic microtissues, it has the major drawback of low levels of metabolic activities.[ 43 ] Use of cells with potential clinical applicability is our goal of future study and developed technique is expected to enhance the stability of structural integrity and engraftment.
3. Conclusion
We have used preset extrusion bioprinting and droplet‐based microfluidics to generate biomimetically structured microtissue spheroids. Preset extrusion bioprinting enables the fabrication of complex structures with a resolution higher than that of conventional bioprinting methods, and can be successfully combined with microfluidic emulsification systems for fabricating hepatic‐lobule‐like structured multicellular spheroids of uniform size. The resolution of conventional bioprinting is closely related to the nozzle size; however, preset extrusion bioprinting can have a higher resolution than that of conventional bioprinting with the same nozzle size because smaller structures can be generated inside the nozzle. As a result of this advantage, approximately 20 µm structures can be successfully implemented. The technique is also advantageous because of the simple printing system and short printing time for multiple bioinks. To use multiple bioinks simultaneously, a printer with multiple printing heads for individual bioinks is needed, and the heads must be exchanged during printing. However, our technique allows the use of a single head to print multiple bioinks; therefore, a single‐head printer can be used, and thus, high‐throughput production of multicellular structured spheroids is possible. Moreover, all the results were obtained without using chemical or physical crosslinking and only thermal gelation was applied. Fabricated multicellular structured spheroids showed improved functionality and structural integrity. In particular, the in vivo Matrigel plug assay showed that the structured spheroid was more stably maintained and engrafted than the non‐structured spheroids after transplantation.
4. Experimental Section
Production and Cell Culture of Structured Microtissue Spheroids
The precursor cartridge was designed using the CAD program (SolidWorks 3D CAD software, Dassault System, France). The designed 3D file of the precursor cartridge was converted into an STL file format, which was loaded into a 3D printing system for fabrication (ProJet 6000, 3D Systems, Circle Rock Hill, SC, USA). The precursor cartridge fabricated was immersed in 70% ethanol for 15 min and then placed under ultraviolet light for 12 h for sterilization.
To prepare a 4% (w/v) neutral collagen solution, the collagen sponge (Atellocollagen type 1; MS Bio Inc, Jungwon‐gu, Seongnam‐si, Gyeonggi‐do, Republic of Korea) was dissolved in 25 mL 10−3 n HCl (pH 3.0). Subsequently, the collagen solution was mixed in 10× minimal essential medium (MEM; Life Technologies Co., Grand Island, NY, USA) with 50% (v/v) fetal bovine serum (FBS; Life Technologies Co.) and reconstituted in buffer (2.2 g of NaHCO3, 4.77 g of 200 × 10−3 m HEPES, 0.2 g of 0.05 n NaOH in 100 mL distilled water) at a 8:1:1 volume ratio.
HepG2/C3A (CRL‐10741; ATCC, Washington, DC, USA) and EA.hy 926 (CRL‐2922; ATCC) cells were separately cultured in Dulbecco's modified Eagle medium (DMEM; Life Technologies Co.) supplemented with 10% (v/v) FBS (Life Technologies Co.) and 1% (v/v) penicillin‐streptomycin solution (Life Technologies Co.) in an incubator at 37 °C with 5% CO2. For encapsulation, HepG2/C3A and EA.hy 926 cells were harvested using trypsin–EDTA (Life Technologies Co.) and mixed in fresh DMEM at a concentration of 5 × 10⁷ cells mL−1.
To prepare bioinks, HepG2/C3A and EA.hy 926 cells (each 5 × 10⁷ cells mL−1) were mixed with the 4% neutral collagen solution. Subsequently, the bioinks (i.e., cell‐laden neutral collagen) were centrifuged at 447 relative centrifugal force for 10 min to remove bubbles.
The bioinks were loaded into a specific compartment of the precursor cartridge and then injected into the inner nozzle of the coaxial nozzle system (NanoNc, Seoul, Republic of Korea) as a disperse phase. Mineral oil (330 760; Sigma‐Aldrich, St. Louis, MO, USA) with 2% v/v Span 80 (85 548; Sigma‐Aldrich) was injected into the outer nozzle as a continuous phase. Finally, the microtissue spheroids were collected in a prewarmed culture dish and placed in a 37 °C incubator for gelation. To remove the mineral oil from the microtissue spheroids, additional culture medium was added to the culture dish, and the upper layer of mineral oil was removed. A single nozzle was used to prepare the microtissue fiber. The bioink was loaded into the precursor cartridge and extruded through a pneumatic pump. The microtissue fibers were collected in prewarmed culture dishes and placed in a 37 °C incubator for gelation.
In Vitro Liver Function Analysis
For immunofluorescence analysis, microtissue spheroids were stained with CellTracker (C7025; Life Technologies Co., Eugene, OR, USA) and DAPI (H‐1200‐10; Vector Laboratories, Burlingame, CA, USA), and the live/dead assay kit was used (L3224; Life Technologies Co.). The samples were imaged using a confocal microscope (Olympus, Tokyo, Japan). Hypoxia was detected using the Image‐iTTM Green Hypoxia reagent (I14833; Life Technologies Co.). β‐Actin, albumin, CD31, MRP2, β‐catenin, and P‐β‐catenin levels were qualitatively determined using western blotting. To measure hepatic function, the production of albumin, α‐1 AAT, and urea was detected using ELISA for 1, 4, 7, and 10 days. To analyze cytochrome activity, CYP3A4, CYP1A2, and CYP2B6 were measured using the P450‐Glo Assay kit (Promega, Madison, WI, USA). The samples were exposed to 50 × 10−6 m rifampicin (Sigma‐Aldrich) and 50 × 10−6 m omeprazole (Sigma‐Aldrich). The luminescent reaction was measured using a GloMax navigator microplate luminometer (Promega).
Spheroid Parameters
3D microtissue spheroids were fabricated under various pneumatic conditions for optimization. The pneumatic pressure of the continuous phase (mineral oil) was fixed at 20 kPa and that of the disperse phase (collagen solution) was gradually changed under various pneumatic conditions (3, 8, 15, and 30 kPa). The diameters of the spheroids were measured using an inverted microscope with the Image J program. The optimization of the fabrication conditions of the spheroids was determined using a microscope and ImageJ software (NIH).
In Vivo Matrigel Plug Angiogenesis Assay
Six‐week‐old BALB/c nude mice were purchased from Orient Bio (Seongnam, Gyeonggi‐do, Republic of Korea). All experiments with mice were performed according to the guidelines of the Konkuk University Institutional Animal Care and Use Committee (KKU‐IACUC, Approval No. KU21047). All animals were maintained in a 12 h light/dark cycle at 23 ± 1 °C and 50 ± 10% relative humidity with free access to food and water. The Matrigel plug assay was performed as previously described.[ 44 ] Briefly, 500 spheroids per structured or non‐structured sample were suspended and embedded into 100 µL of Matrigel (356 237, Matrigel matrix basement membrane; Corning, NY, USA). Mice were anesthetized with isoflurane, and the sample and Matrigel mixture were subcutaneously injected into the back (structured samples) and dorsal flank area (non‐structured samples), respectively. Matrigel with PBS alone was injected into the flank as a negative control. Fourteen days later, mice were euthanized, and the Matrigel plugs obtained were fixed in 4% paraformaldehyde overnight at 20–22 °C prior to staining. Fixed Matrigel plugs were dehydrated in a graded series of ethanol (70%, 80%, 90%, and 100%), transferred to xylene, and maintained overnight prior to paraffin infiltration. Paraffin blocks were prepared using a Tissue‐Tek TEC5 Tissue embedding console system (Sakura Finetek, Tokyo, Japan). The blocks were sectioned using the Microm HM 340E microtome (Thermo Scientific, Walldorf, Germany) at a thickness of 5 µm. The tissue slices were placed on a glass slide (Marienfeld, Lauda‐Königshofen, Germany) and stained with H&E. For immunohistochemical analysis, sectioned tissues were deparaffinized and incubated at 90 °C for 15 min with Trilogy (920P‐06; Cell Marque, Rocklin, CA, USA) for antigen retrieval. After cooling to 20–22 °C, the sections were incubated at 4 °C overnight with anti‐α‐SMA (ab5694; Abcam, Cambridge, UK) or anti‐CD31 antibody (ab9498; Abcam). The following day, DAB staining was performed using EnVision Detection Systems Peroxidase/DAB (K5007; Dako, Glostrup, Denmark). Finally, the sections were counterstained with hematoxylin. To detect apoptotic cells, a TUNEL assay was performed using the Click‐iT Plus TUNEL Assay for In Situ Apoptosis Detection kit (C10617; Life Technologies) following the manufacturer's instructions. Paraffin sections, 5 µm in diameter, were used, and the slides were observed under a Nikon Eclipse Ti fluorescence microscope (Nikon Instruments Inc., Melville, NY, USA).
Statistical Analyses
All results were presented as the mean ± standard deviation. For statistical analysis, the Kruskal‐Wallis H test and the Mann–Whitney test were performed. Statistical analysis was performed using SPSS statistics 25 software (IBM, USA). Differences in results were considered significant at p < 0.05 and p < 0.01.
Conflict of Interest
W.‐S.Y., J.‐H.S., and S.J. are shareholders of T&R Biofab. The remaining authors declare no conflicts of interest.
Supporting information
Supporting Information
Supplemental Movie 1
Acknowledgements
G.H. and J.K. are contributed equally to this work. This research was supported by a National Research Foundation of Korea (NRF) grant funded by the Ministry of Science and ICT (NRF‐2020R1A2B5B01002716) and the Ministry of Education (NRF‐2017R1A6A1A03015562).
Hong G., Kim J., Oh H., Yun S., Kim C. M., Jeong Y.‐M., Yun W.‐S., Shim J.‐H., Jang I., Kim C.‐Y., Jin S., Production of Multiple Cell‐Laden Microtissue Spheroids with a Biomimetic Hepatic‐Lobule‐Like Structure. Adv. Mater. 2021, 33, 2102624. 10.1002/adma.202102624
Data Availability Statement
Research data are not shared.
References
- 1. Jin M., Yi X., Liao W., Chen Q., Yang W., Li Y., Li S., Gao Y., Peng Q., Zhou S., Stem Cell Res. Ther. 2021, 12, 84. [DOI] [PMC free article] [PubMed] [Google Scholar]
- 2. Cipriano M., Freyer N., Knöspel F., Oliveira N. G., Barcia R., Cruz P. E., Cruz H., Castro M., Santos J. M., Zeilinger K., Miranda J. P., Arch. Toxicol. 2017, 91, 1815. [DOI] [PubMed] [Google Scholar]
- 3. Liu H., Wang Y., Chen W., Yu Y., Jiang L., Qin J., Mater. Sci. Eng., C 2019, 104, 109705. [DOI] [PubMed] [Google Scholar]
- 4. Yu Y., Shang L., Guo J., Wang J., Zhao Y., Nat. Protoc. 2018, 13, 2557. [DOI] [PubMed] [Google Scholar]
- 5. Chen S., Wang J., Ren H., Liu Y., Xiang C., Li C., Lu S., Shi Y., Deng H., Shi X., Cell Res. 2020, 30, 95. [DOI] [PMC free article] [PubMed] [Google Scholar]
- 6. Jin Y., Kim J., Lee J. S., Min S., Kim S., Ahn D.‐H., Kim Y.‐G., Cho S.‐W., Adv. Funct. Mater. 2018, 26, 1801954. [Google Scholar]
- 7. Ohashi K., Yokoyama T., Yamato M., Kuge H., Kanehiro H., Tsutsumi M., Amanuma T., Iwata H., Yang J., Okano T., Nakajima Y., Nat. Med. 2007, 13, 880. [DOI] [PubMed] [Google Scholar]
- 8. Kim K., Ohashi K., Utoh R., Kano K., Okano T., Biomaterials 2012, 33, 1406. [DOI] [PubMed] [Google Scholar]
- 9. Barrs R. W., Jia J., Silver S. E., Yost M., Mei Y., Chem. Rev. 2020, 120, 10887. [DOI] [PMC free article] [PubMed] [Google Scholar]
- 10. Cui J., Wang H., Zheng Z., Shi Q., Sun T., Huang Q., Fukuda T., Biofabrication 2019, 11, 015016. [DOI] [PubMed] [Google Scholar]
- 11. Levato R., Jungst T., Scheuring R. G., Blunk T., Groll J., Malda J., Adv. Mater. 2020, 32, 1906423. [DOI] [PMC free article] [PubMed] [Google Scholar]
- 12. Fonović M., Turk B., Biochim. Biophys. Acta, Gen. Subj. 2014, 1840, 2560. [DOI] [PubMed] [Google Scholar]
- 13. Chernousov M. A., Yu W.‐M., Chen Z. L., Carey D. J., Strickland S., Glia 2008, 56, 1498. [DOI] [PubMed] [Google Scholar]
- 14. Aszódi A., Legate K. R., Nakchbandi I., Fässler R., Annu. Rev. Cell Dev. Biol. 2006, 22, 591. [DOI] [PubMed] [Google Scholar]
- 15. Zhang Z., Wang B., Hui D., Qiu J., Wang S., Composites, Part B 2017, 123, 279. [Google Scholar]
- 16. Murphy S. V., Atala A., Nat. Biotechnol. 2014, 32, 773. [DOI] [PubMed] [Google Scholar]
- 17. Ozbolat I. T., Hospodiuk M., Biomaterials 2016, 76, 321. [DOI] [PubMed] [Google Scholar]
- 18. Kang D., Ahn G., Kim D., Kang H.‐W., Yun S., Yun W.‐S., Shim J.‐H., Jin S., Biofabrication 2018, 10, 035008. [DOI] [PubMed] [Google Scholar]
- 19. Kang D., Hong G., An S., Jang I., Yun W.‐S., Shim J.‐H., Jin S., Small 2020, 16, 1905505. [DOI] [PubMed] [Google Scholar]
- 20. Glorioso J. M., Mao S. A., Rodysill B., Mounajjed T., Kremers W. K., Elgilani F., Hickey R. D., Haugaa H., Rose C. F., Amiot B., Nyberg S. L., J. Hepatol. 2015, 63, 388. [DOI] [PMC free article] [PubMed] [Google Scholar]
- 21. Hofer M., Lutolf M. P., Nat. Rev. Mater. 2021, 6, 402 [DOI] [PMC free article] [PubMed] [Google Scholar]
- 22. Brandenberg N., Hoehnel S., Kuttler F., Homicsko K., Ceroni C., Ringel T., Gjorevski N., Schwank G., Coukos G., Turcatti G., Lutolf M. P., Nat. Biomed. Eng. 2020, 4, 863. [DOI] [PubMed] [Google Scholar]
- 23. Takebe T., Enomura M., Yoshizawa E., Kimura M., Koike H., Ueno Y., Matsuzaki T., Yamazaki T., Toyohara T., Osafune K., Nakauchi H., Yoshikawa H. Y., Taniguchi H., Cell Stem Cell 2015, 16, 556. [DOI] [PubMed] [Google Scholar]
- 24. Nicolas C. T., Hickey R. D., Allen K. L., Du Z., Guthman R. M., Kaiser R. A., Amiot B., Bansal A., Pandey M. K., Suksanpaisan L., DeGrado T. R., Nyberg S. L., Lillegard J. B., Surgery 2018, 164, 473. [DOI] [PMC free article] [PubMed] [Google Scholar]
- 25. Amit M., Laevsky I., Miropolsky Y., Shariki K., Peri M., Itskovitz‐Eldor J., Nat. Protoc. 2011, 6, 572. [DOI] [PubMed] [Google Scholar]
- 26. Barrila J., Radtke A. L., Crabbé A., Sarker S. F., Herbst‐Kralovetz M. M., Ott C. M., Nickerson C. A., Nat. Rev. Microbiol. 2010, 8, 791. [DOI] [PubMed] [Google Scholar]
- 27. Frey O., Misun P. M., Fluri D. A., Hengstler J. G., Hierlemann A., Nat. Commun. 2014, 5, 4250. [DOI] [PubMed] [Google Scholar]
- 28. Kim C.‐H., Suhito I. R., Angeline N., Han Y., Son H., Luo Z., Kim T.‐H., Adv. Healthcare Mater. 2020, 9, 1901751. [DOI] [PubMed] [Google Scholar]
- 29. Jeon S., Heo J.‐H., Kim M. K., Jeong W., Kang H.‐W., Adv. Funct. Mater. 2020, 30, 2005324. [Google Scholar]
- 30. Sart S., Tomasi R. F.‐X., Amselem G., Baroud C. N., Nat. Commun. 2017, 8, 469. [DOI] [PMC free article] [PubMed] [Google Scholar]
- 31. Takeuchi S., Garstecki P., Weibel D. B., Whitesides G. M., Adv. Mater. 2005, 17, 1067. [Google Scholar]
- 32. Lee J. M., Choi J. W., Ahrberg C. D., Choi H. W., Ha J. H., Mun S. G., Mo S. J., Chung B. G., Microsyst. Nanoeng. 2020, 6, 52. [DOI] [PMC free article] [PubMed] [Google Scholar]
- 33. Azimi I., Petersen R. M., Thompson E. W., Roberts‐Thomson S. J., Monteith G. R., Sci. Rep. 2017, 7, 15140. [DOI] [PMC free article] [PubMed] [Google Scholar]
- 34. Chandel N. S., Maltepe E., Goldwasser E., Mathieu C. E., Simon M. C., Schumacker P. T., Proc. Natl. Acad. Sci. USA 1998, 95, 11715. [DOI] [PMC free article] [PubMed] [Google Scholar]
- 35. Phan D.‐T., Nguyen N.‐T., Appl. Phys. Lett. 2014, 104, 084104. [Google Scholar]
- 36. Morbeck D. E., Khan Z., Barnidge D. R., Walker D. L., Fertil. Steril. 2010, 94, 2747. [DOI] [PubMed] [Google Scholar]
- 37. Fan R., Naqvi K., Patel K., Sun J., Wan J., Biomicrofluidics 2015, 9, 052602. [DOI] [PMC free article] [PubMed] [Google Scholar]
- 38. Mashayekhi F., Meyer A. S., Shiigi S. A., Nguyen V., Kamei D. T., Biotechnol. Bioeng. 2009, 102, 1613. [DOI] [PubMed] [Google Scholar]
- 39. Atefi E., Joshi R., Mann J. A. Jr., Tavana H., ACS Appl. Mater. Interfaces 2015, 7, 21305. [DOI] [PubMed] [Google Scholar]
- 40. Hafiz E. O. A., Bulutoglu B., Mansy S. S., Chen Y., Abu‐Taleb H., Soliman S. A. M., El‐Hindawi A. A. F., Yarmush M. L., Uygun B. E., Biotechnol. Bioeng. 2021, 118, 17. [DOI] [PMC free article] [PubMed] [Google Scholar]
- 41. Timmins N. E., Dietmair S., Nielsen L. K., Angiogenesis 2004, 7, 97. [DOI] [PubMed] [Google Scholar]
- 42. Davidson K. C., Adams A. M., Goodson J. M., McDonald C. E., Potter J. C., Berndt J. D., Biechele T. L., Taylor R. J., Moon R. T., Proc. Natl. Acad. Sci. USA 2012, 109, 4485. [DOI] [PMC free article] [PubMed] [Google Scholar]
- 43. Ooka M., Lynch C., Xia M., Int. J. Mol. Sci. 2020, 21, 8182. [DOI] [PMC free article] [PubMed] [Google Scholar]
- 44. Qi C., Li B., Yang Y., Yang Y., Li J., Zhou Q., Wen Y., Zeng C., Zheng L., Zhang Q., Li J., He X., Zhou J., Shao C., Wang L., Sci. Rep. 2016, 6, 27819. [DOI] [PMC free article] [PubMed] [Google Scholar]
Associated Data
This section collects any data citations, data availability statements, or supplementary materials included in this article.
Supplementary Materials
Supporting Information
Supplemental Movie 1
Data Availability Statement
Research data are not shared.


