Abstract
Background: Clear cell renal cell carcinoma (ccRCC) is the most common kidney cancer. The crosstalk between tumor tissue and adjacent adipose tissue has been appreciated recently. This study examines the predictive usefulness of brown adipocyte-related genes (BARGs) in ccRCC. Methods: The transcriptome and clinical data of ccRCC patients were obtained from TCGA-KIRC and USA-ccRCC cohorts (848 tumor samples; 72 normal samples). Lasso-Cox methods were used to construct the risk prognostic signature model. We used Kaplan-Meier survival analysis to evaluate the prognostic significance of the risk model with ROC curves ascertaining prediction accuracy. The differences in immune cell infiltrates and signature risk scores between different risk categories were analyzed. Finally, biological experiments were performed to explore the functions of candidate genes. Results: TCGA-KIRC patients were classified into two clusters that differed significantly regarding overall survival (OS) and tumor microenvironment. After screening BARGs candidates, a signature consisting of PPP1R1A, DPYSL3, and PTPRM was created to calculate risk score. Patients were assigned to the high or low-risk group, and the high-risk group had a significantly worse prognosis. Consistent trend was validated in external USA-ccRCC cohort. Meanwhile, the signature risk score affected immune cell infiltrates within the ccRCC microenvironment, positively correlated with the infiltration of CD4+ T cells, CD8+ T cells, CD56dim, CD56bright NK cells, MDSCs, and macrophage cells, while negatively correlated with neutrophil, iDCs, mast cells, and eosinophil. Finally, knockdown of PPP1R1A and DPYSL3 in renal cancer cells showed impairment in tumor proliferation ability of ccRCC in vitro and in vivo. Conversely, knockdown of PTPRM exhibited a promotive effect. Conclusion: We developed a predictive BARGs-related risk signature for early diagnosis and classifying ccRCC patients, which offers potential targets for individualized treatment of ccRCC.
Keywords: Prognostic model, clear cell renal cell carcinoma, the brown adipocytes-related genes, browning, risk score signature
Introduction
Although medical technology has evolved, cancer remains the leading cause of mortality worldwide, accounting for approximately 15% of all fatalities [1]. Clear cell renal cell carcinoma (ccRCC), one of the most lethal urologic cancers with insidious onset, is highly aggressive and has a poor prognosis, even in patients diagnosed at an early stage and treated by nephrectomy [1]. Due to available prognostic models and the developments in medical technologies, the survival outcome of ccRCC patients has shown significant improvement, but many still risk the recurrence and death [2,3]. Considering the heterogeneity and homogeneity of ccRCC tumorigenesis, there is an urgent need for accurate biomarkers for prognosis prediction.
Tumor progression also depends on the bidirectional communication between tumor epithelial cells and adjacent stromal cells [4,5]. Obesity is a well-established risk factor for ccRCC [6]. The kidneys are surrounded by perinephric adipose tissue (PAT), a complex endocrine organ consisting of white adipocytes and dormant and active brown adipocytes [7,8]. The crosstalk between adipose tissue and ccRCC has been gradually appreciated recently. Cancer cells require high demand for nutritional metabolism to supply energy and biomass for cell proliferation and metastasis [9,10]. Adipose tissue influences systemic metabolism, through its function in glucose and lipid synthesis as well endocrine function for secreting free fatty acids, hormones, cytokines, adipokines, and growth factors. Mammals have three basic types: white, beige and brown adipose tissue [7]. White adipose tissue (WAT) is specialized to store excess energy as triglycerides and release it when needed to maintain the balance of systemic energy demand. Beige and brown adipose tissue (BAT) takes charge of the breakdown of glucose and fatty acids from being converted into heat [11]. Adipose tissue is also highly plastic [7]. In 1984, Young first reported that WAT could differentiate into beige adipocytes, termed browning or beiging, under certain stimulus conditions [12].
It is evident that several kinds of cancers hijack adjacent adipocytes differentiation towards a browning phenotype and release metabolites to promote tumor proliferation and metastasis [13-16]. Qi Wu found breast cancer cells remodel metabolism in resident adipocytes and exhibit an increased browning differentiation state to facilitate tumor progression [17]. PAT surrounding renal tumor displayed a pronounced browning phenotype and exerted a pro-tumorigenic function through the induction of EMT in ccRCC [18]. A seminal study by Wei et al. highlighted the essential impact of ccRCC cells stimulating PAT browning by releasing PTHrP, causing thermogenic adipocytes to release lactate and promote ccRCC progression. Particularly, tyrosine kinase inhibitors (TKI) often used to treat ccRCC, such as sunitinib, have been shown to activate adipocytes browning, and the combination therapy of TKI plus browning inhibitor presents a more-complete suppression of ccRCC [19]. The interaction between adipocytes and cancer cells implies a vicious circle, in which renal cancer cells transform adipocytes, resulting in worse perioperative outcomes and a poor prognosis [20].
A growing number of observations demonstrate PAT actually infiltrates cancer lesions and differentiate browning, associated with poorer prognosis in ccRCC. Thus, there is a need to systematically establish more biomarkers related to exploring the brown adipocytes-related genes (BARGs) in ccRCC. Identifying distinct clustering profiles and establishing BARGs-related signatures may be a viable method for predicting prognosis in ccRCC patients.
In this study, we select 101 BARGs and explored the expression in TCGA-KIRC datasets. Furthermore, we identified brown adipocytes-related-genes prognostic signature (risk score) composed of three brown adipocytes related-genes, and this signature was correlated with the survival of ccRCC. Moreover, the prognostic predictive efficacy of risk score was confirmed in an independent USA-ccRCC cohort. Thus, our investigation identified a new predictive characteristic for ccRCC prognosis.
Materials and methods
Data collection and preprocessing
The gene expression data (RNA-FPKM) and corresponding clinicopathological data of 537 ccRCC patients and 72 normal tissues were downloaded from The Cancer Genome Atlas (TCGA)-KIRC cohort (https://portal.gdc.cancer.gov/) (Table 1). Patients with incomplete clinical information about survival time, age, and tumor stage were excluded in further analyses. Meanwhile, we downloaded the RNA-sequencing data for the external ccRCC validation cohort (n = 311, Table 2) from the Nat Med. 2020 Jun; 26 (6): 909-918 [21]. Fragments per kilobase million (FPKM) were transformed into transcripts per kilobase million (TPM); then, the data could be comparable between cohorts. The previous adipose research found 102 genes encoding 101 brown adipocytes-secreted proteins (Supplementary Table 1) [22]. We defined these genes as the brown adipocytes-related genes BARGs. The “limma” package was used to identify differentially expressed BARGs between ccRCC and normal tissue. Thresholds were set to FDR < 0.05 and |log2(Fold change)| > 1. The “limma” package matches distributions of gene counts across samples to normalize expression. To better understand the genomic profiles of BARGs, we obtained mutation annotation formats (MAF) of ccRCC patients from the TCGA database and calculated the tumor mutational burden (TMB) with the “maftools” R package. We also depicted copy number and somatic mutations from the UCSC Xena database (https://xena.ucsc.edu/) to create Circos plots with the “RCircos” R package. The public datasets don’t require Ethical Review Committee approval and informed consent.
Table 1.
Clinical pathological features of ccRCC patients (n = 537) from TCGA database
| Characteristic | Group | No. of cases | (%) |
|---|---|---|---|
| Age (year) | ≤ 60 | 266 | 49.53 |
| > 60 | 271 | 50.47 | |
| Gender | Male | 346 | 64.43 |
| Female | 191 | 35.57 | |
| Survival status | Alive | 360 | 67.04 |
| Dead | 177 | 32.96 | |
| Grade | G1-G2 | 244 | 45.44 |
| G3-G4 | 285 | 53.07 | |
| GX | 5 | 0.93 | |
| Unknow | 3 | 0.56 | |
| Pathological T | T1-T2 | 344 | 64.06 |
| T3-T4 | 193 | 35.94 | |
| Pathological M | M0 | 426 | 79.33 |
| M1 | 79 | 14.71 | |
| MX | 30 | 5.59 | |
| Unknow | 2 | 0.37 | |
| Pathological N | N0 | 240 | 44.69 |
| N1 | 17 | 3.17 | |
| NX | 280 | 52.14 | |
| Stage | Stage I-II | 326 | 60.71 |
| Stage III-IV | 208 | 38.73 | |
| Unknow | 3 | 0.56 |
Table 2.
Clinical pathological features of ccRCC patients (n = 311) from USA-ccRCC cohort
| Characteristic | Group | No. of cases | (%) |
|---|---|---|---|
| Age (year) | ≤ 60 | 133 | 42.77 |
| > 60 | 176 | 56.59 | |
| Gender | Male | 229 | 73.63 |
| Female | 82 | 26.37 | |
| Survival status | Alive | 80 | 25.72 |
| Dead | 231 | 74.28 | |
| Tumor type | Primary | 225 | 72.35 |
| Metastasis | 84 | 27.01 | |
| NA | 2 | 0.64 | |
| MSKCC (Memorial Sloan-Kettering Cancer Center) | Favorable risk | 100 | 32.15 |
| Intermediate risk | 135 | 43.41 | |
| Poor riak | 60 | 19.29 | |
| NA | 16 | 5.14 | |
| IMDC (International Metastatic Renal CellCarcinoma Database Consortium) | Favorable risk | 45 | 14.47 |
| Intermediate risk | 145 | 46.62 | |
| Poor riak | 56 | 18.01 | |
| NA | 65 | 20.90 | |
| Benefit | CB (Clinical benefit) | 89 | 28.62 |
| ICB (Intermediate clinical benefit) | 120 | 38.59 | |
| NCB (No clinical benefit) | 102 | 32.80 |
Establishment of BARGs clusters
Using the “ConsensusClusterPlus” package’s k-means unsupervised clustering, ccRCC patients were molecularly typed [23]. The clusterAlg was set to “pam”, and the distance function was set to “uclidean”. This test was repeated 1000 times. This test was repeated 1000 times. Then, the optimum clustering result was determined by calculating consistent cumulative distribution function (CDF) graphs. The results of consensus matrix heatmaps were illustrated by the heatmap package. Kaplan-Meier curve was used to compare OS between clusters utilizing “survival” and “survminer” R packages. PCA was performed to explore the transcriptomic differences within 2 clusters using the R package “ggplot2”.
Functional and pathway enrichment analysis
Gene Set Enrichment Analysis (GSEA) and Gene Set Variation Analysis (GSVA) were performed among the BARGs clusters to investigate the differences in biological significance and ascertain the hallmark pathways. The hallmark gene set “c2.cp.kegg.v2023.1.Hs.symbols.gmt” was downloaded from the MSigDB database. Afterward, we performed GO enrichment and KEGG signaling pathway analyses through the R package “cluster profile”. The threshold was set at p value < 0.05 and q value < 0.05.
Estimation of immune cell infiltration
The tumor-infiltrating immune cells dataset was downloaded at TIMER 2.0 (http://timer.cistrome.org). Single-sample gene set enrichment analysis (ssGSEA) scored 23 immune cell types in accordance with the 667 metagenes. A box plot representing the immune cell abundance between the BARGs clusters was generated using “ggplot2” package of R.
Construction and validation of the BARGs associated prognostic signature
Based on the previously obtained differential expression brown adipocyte-related genes, we developed the BARGs-based prognostic model. We employed the “caret” R package to randomly allocate the ccRCC patients into training and testing groups. First, univariate Cox regression analysis was done on the 28 BARGs associated with OS of train-group patients (P < 0.05) to find the 3 prognostic BARGs using the “glmnet” R package. Second, the optimal value with minimum deviation was calculated by Lasso regression analysis after a 10-fold cross-validation. Ultimately, a 3-gene-based risk-predictive model was constructed. The BARGs associated risk score was calculated as follows: “risk score = Σ (Expi × coefi), where coefi and Expi represent each gene’s expression and risk factor, respectively. The median risk score divided TCGA training set patients into high and low risk subgroups. The Kaplan-Meier curve analysis and the log-rank test were then condemned on each group. Time-dependent ROC curves were utilized to examine the model’s accuracy for prognostic prediction. We also validated the signature using the TCGA testing group and 311 USA-ccRCC cohort as the in vivo and in vitro validation groups.
Using univariate and multivariate analysis, we further tested whether the risk score and clinical features were independent prognostic indicators. Kaplan-Meier survival analysis was then performed on each group. CIBERSORT algorithm from the tumor immune estimation resource (TIMER) database was used to analyze the correlation between the risk score and the infiltration degree of immune cells.
External analysis of the prognostic signature
To get a deeper understanding of the tumor characteristics of the three genes, we compared the BARGs expression at the protein level between normal and ccRCC tissues by analyzing the immunohistochemistry (IHC) staining images retrieved from the Human Protein Atlas (HPA) (https://www.proteinatlas.org/).
Cell culture and transfection
The human renal cancer cell line 786-O was obtained from American Type Culture Collection (ATCC, CRL-1932™). 786-O cells were cultured in Dulbecco’s modified Eagle’s medium (DMEM) (Gibco, United States) with 10% fetal bovine serum (Gibco) and maintained at 37°C with 5% CO2 supply. Transient gene knockdown was achieved by transfecting cells with specific small-interfering RNAs using the Lipofectamine® RNAiMAX Transfection Reagent (Invitrogen, United States). The siRNAs sequences were as follow: siDPYSL3-1 5’-GCAGAAUCGUCAAUGAUGAUC-3’, siDPYSL3-2 5’-GUAUCAAGUAUCUAACACAGA-3’, siDPYSL3-3 5’-GGCUUAUAAGGAU UUGUAUCA-3’; siPTPRM-1 5’-GAAUUCCGGACGCUAAACAUG-3’, siPTPRM-2 5’-CAGAUACGGGAAUAUCAUUGC-3’, siPTPRM-3 5’-CAAAUCUCGGCAAA UCACUAU-3’; siPPP1R1A-1 5’-GACAACAGCCCCCGAAAGAUC-3’, siPPP1R1A-2 5’-GAUCACACCCACAAUGAAAGA-3’, siPPP1R1A-3 5’-GCAGAAUGCAUC CCUAAAACU-3’.
Western blot
Cells were lysed in SDS lysis buffer (Beyotime, China) for 10 min. After measuring the protein concentration by BCA Assay Kit (Beyotime, China), then proteins were separated by 12% SDS-PAGE gels and transferred onto PVDF membranes. After blocking with 5% skimmed milk in TBST for 60 min, membranes were incubated with primary antibodies at 4°C overnight. PTPRM (ER61845, HUABIO), PPP1R1A (sc-515553, Santa cruz), DPYSL3 (HA500030, HUABIO) and Tubulin (10094-1-AP, Proteintech) were used as primary antibodies. Anti-rabbit or anti-mouse IgG conjugated to horseradish peroxidase (HRP) (Proteintech) was used as the secondary antibody. Bands were visualized by Bio-Rad Image Lab Software next day.
Cell counting kit-8 assays
The proliferation ability of renal cancer cells was monitored by cell counting kit-8 (Bimake). 786-O cells (5 × 10³/well) were seeded in the 96-well plates. The Optical Density (OD450) were determined on 0, 24, 48, 72 and 96 h.
Transwell assays
Transwell assays were performed to examine the migratory invasive capacity of renal cancer cells. 5 × 10⁴ cells in serum-free media were seeded in the upper chamber of a 24-well transwell culture plate (Corning, United States); Then, 600 μl of complete medium was added to the lower chamber. After 24 h, migrated cells on the bottom of the membrane were fixed with 4% paraformaldehyde for 30 min and stained with crystal violet for 15 min. Then, stained cells were counted under the microscope.
Colony formation assay
Cells (5 × 10³/well) were seeded in six-well plates and cultured for about 7 days to allow single clones to form, then the cells were fixed with 4% paraformaldehyde and stained with crystal violet. The colonies were photographed under the microscope.
Mouse xenograft assay
Six-week-old BALB/c mice were purchased from Hunan SJA Laboratory Animal Co., Ltd. All mice lived in a pathogen-free condition with a 12 h light/dark cycle and were fed sterilized food and water at the Department of Laboratory Animals, Central South University. Mouse care and use protocols were approved by the Animal Care and Use Committees of the Laboratory Animal Research Center of Central South University. The mice were randomly assigned into 4 groups. The xenograft model was established by subcutaneous injection of 786-O cells (5 × 10⁶ cells in 100 μL) with negative control or stable gene knockdown (PPP1R1A, DPYSL3 or PTPRM). The shRNA sequences are referred from siRNAs. Tumor size was measured with calipers in two perpendicular diameters every two days. Tumor volume (V) was calculated according to the formula V = 0.5 × length × width2.
Statistical analysis
The statistical analyses were mainly performed using the R language (version 4.2.2). Student’s t-test and One-way ANOVA were performed to compare differences among groups. Survival analysis used LASSO regression to determine the correlation between the characteristics and overall survival. The Kaplan-Meier (K-M) survival curves analysis was conducted to estimate survival distributions. BARGs related signature prognostic value was assessed using Cox regression and time ROC curve analysis. In this study, P < 0.05 was considered statistically significant.
Results
Differential expression and genetic variation patterns of brown adipocytes-related genes
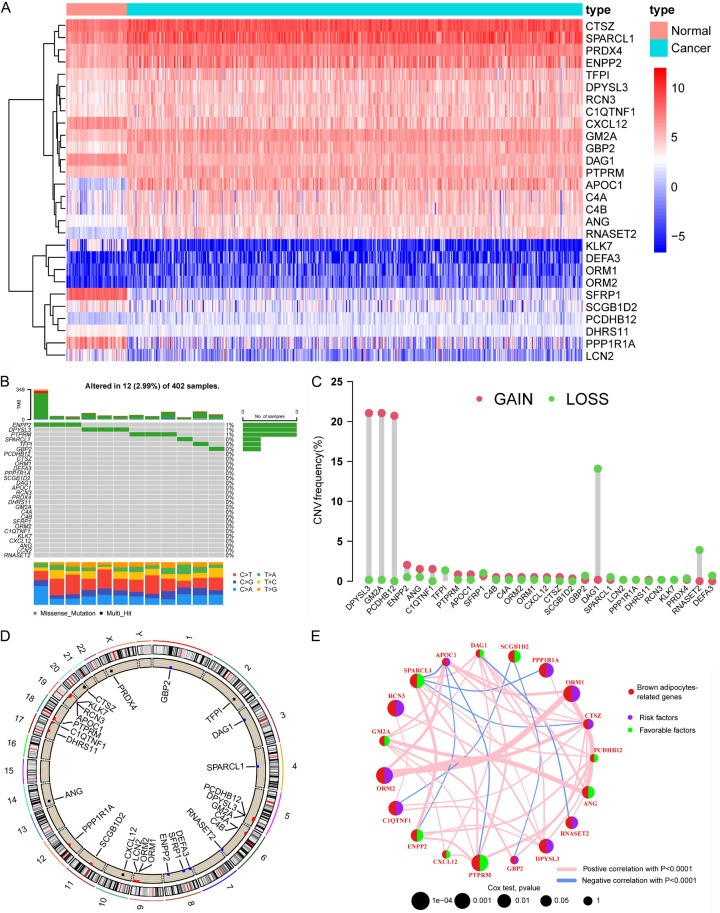
First, we performed differential expression analysis of 101 BARGs between ccRCC and normal samples with a p-value < 0.05 and absolute log2Fold Change > 1. The heat map exhibited the 28 differentially expressed BARGs (Figure 1A). Most BARGs expression was upregulated in ccRCC, probably because renal cancer tissues promoted adipocytes browning. To comprehensively understand the 28 differential expression BARGs, we explored the characteristics of the single-nucleotide variation (SNV) and copy number variation (CNV) across ccRCC. The waterfall plot in Figure 1B shows that 12 of the 402 samples (2.99%) had mutations in the BARGs. The highest frequency of ENPP2 mutations was found (1%). The overall frequency of mutations in BARGs was extremely low. As depicted in Figure 1C, DPYSL3 and GM2A had the most significant copy number increase, while DAG1 had the most significant copy number deletion. Figure 1D shows the position of these BARGs, which are distributed on several chromosomes. Finally, to understand the potential regulatory role of these differential 28 BARGs, univariate Cox analysis (P < 0.2) and Kaplan-Meier survival analysis (P < 0.05) were employed to select 19 BARGs that were prognostically significant for ccRCC (Supplementary Table 2). Ten genes (PPP1R1A; DPYSL3; ORM1; ORM2; RCN3; CIQTNF1; RNASET2; CTSZ; APOC1 and GBP2) are independent risk factors and the rest nine genes are favorable factors for ccRCC. Figure 1E shows the interaction and prognostic impact of BARGs in ccRCC, suggesting the potential of the gene list for prognostic prediction.
Figure 1.
Expression and mutation of brown adipocytes-related genes (BARGs) in ccRCC. (A) Heat map of 28 differential expression of BARGs between tumor and normal tissues. (B) SNV and (C) CNV frequencies of 28 BARGs in 402 ccRCC patients in the TCGA cohort. (D) The genome location of 28 BARGs on 23 human chromosomes. (E) Network plot showing the correlation of 19 prognosis-related BARGs in ccRCC and the impact on prognosis.
Construction of BARGs clusters by clustering analysis in ccRCC
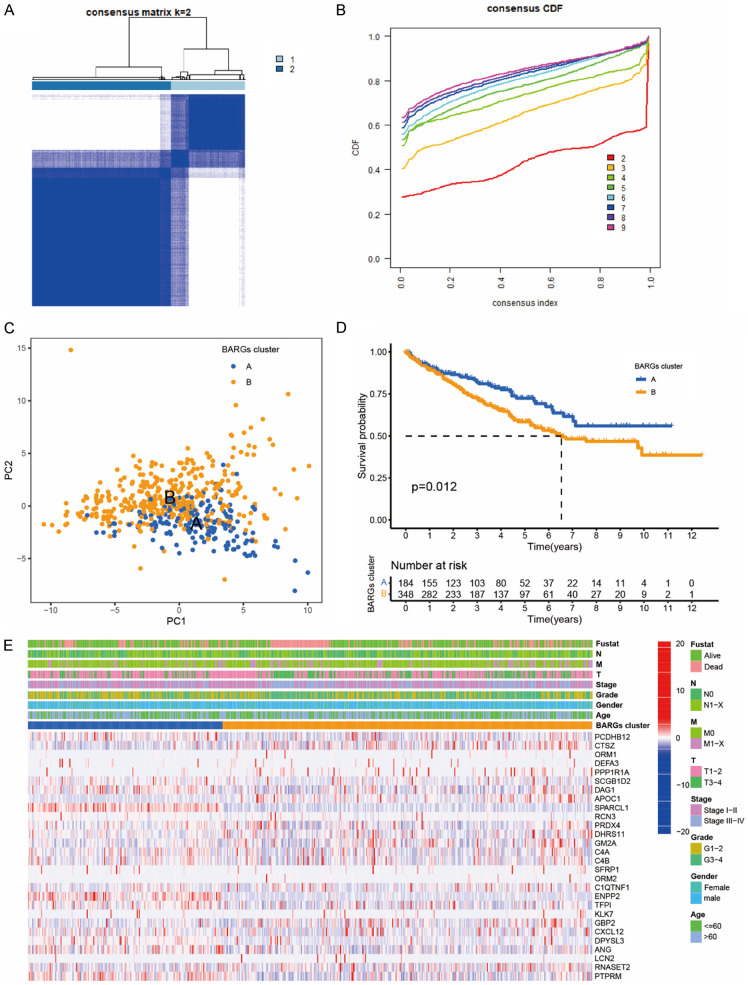
Molecular subtyping may reveal tumor biology for potential prognostic targets. This section explored whether BARGs could be used in molecular subtyping for ccRCC. A consensus clustering technique based on 28 BARGs expression levels categorized TCGA-KIRC patients into subtypes. The integration cohort was divided into 2 BARGs clusters optimally, following the CDF (Cumulative Distribution Function) curve (Figure 2A, 2B), and PCA (principal component analysis) showed the credible robustness of the analysis (Figure 2C). We then evaluated if the two ccRCC subgroups have distinct prognoses. The Kaplan-Meier analysis showed that BARGs cluster A had a better prognosis than cluster B in the TCGA cohorts (Figure 2D). The significant OS difference confirmed the importance of brown adipocyte-related genes for ccRCC. We then analyzed the expression difference of the BARGs between these 2 clusters and found elevated expressions of some genes in cluster B than in cluster A, such as PPP1R1A, POC1, and CTSZ (Figure 2E).
Figure 2.
Clinicopathological characteristics and survival of ccRCC patients in 2 BARGs clusters. A. All samples from the TCGA-KIRC cohort were divided into 2 clusters using a consensus clustering algorithm (k = 2). B. The cumulative distribution function (CDF) for k = 2 to 9. C. Principal component analysis (PCA) analyses of patients in 2 BARGs clusters. D. Kaplan-Meier curves show the different overall survival (OS) rates between the 2 BARGs clusters. E. Heatmap shows different clinicopathologic features between the two clusters.
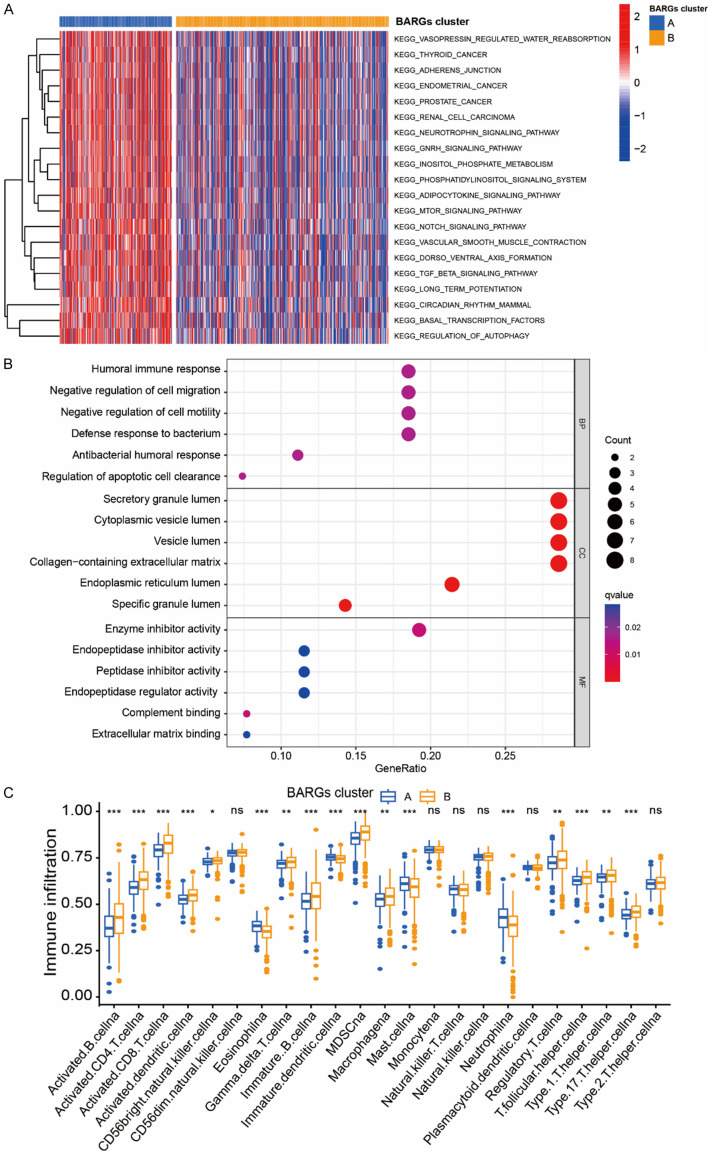
In the KEGG pathway analysis (Figure 3A), the differential genes were mainly involved in the adipocytokine signaling pathway and renal cell cancer, as well as adherens junction, regulation of autophagy, mTOR signaling pathway, Notch signaling pathway and TGFβ signaling pathway. Interestingly, GO analysis indicated that the most enriched terms in biological process (BP), molecular function (MF), and cellular component (CC) were strongly correlated with immune terms, mainly enriched in humoral immune response, defense response to bacterium, antibacterial humoral response, and complement binding (Figure 3B). To further investigate the role of BARGs in the tumor microenvironment, we evaluated the correlation between the 2 clusters and immune cell subpopulations. Compared to cluster A, cluster B possessed a higher immune cell infiltration, except for Eosinophil, Mast cell and Neutrophil (Figure 3C).
Figure 3.
Biological pathways and the immune microenvironment analyses of 2 BARGs clusters in ccRCC. (A) GSVA and (B) GO analyses of biological pathways between two clusters. (C) The abundance of 23 infiltrating immune cell species in two BARGs clusters. *P <0.05; **P < 0.01; ***P < 0.001; ns, no significance.
Construction of BARGs related prognostic signature
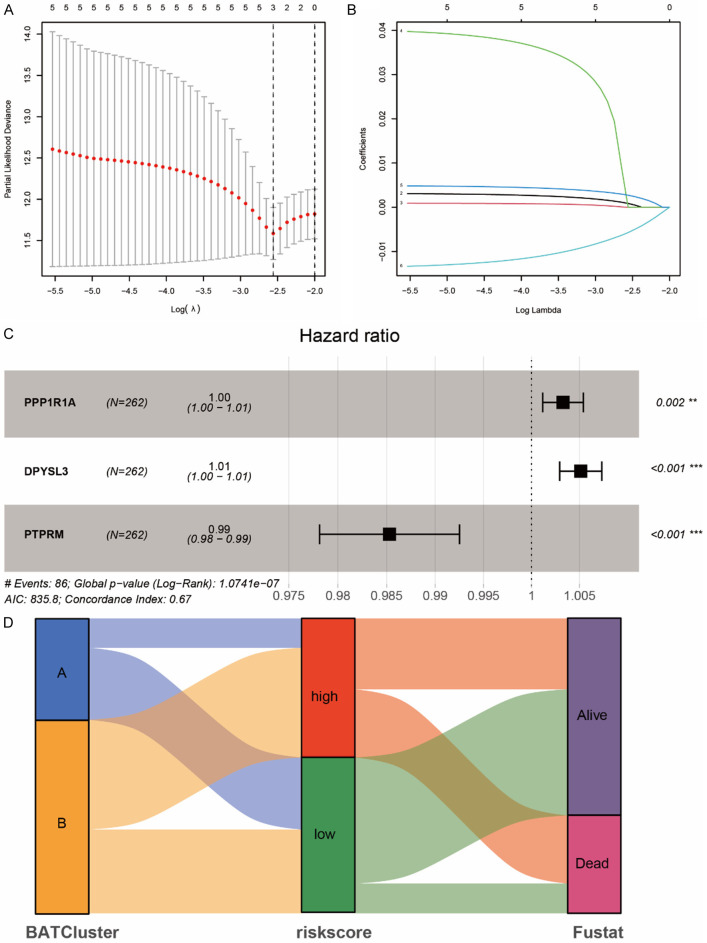
Based on the aforementioned 28 differential expression BARGs, we further examined the prognostic value of brown adipocytes-secreted proteins in ccRCC patients. A risk model was created to estimate the risk for each patient with ccRCC. First, 524 TCGA ccRCC patients were randomly assigned to the training group (n = 262) and the testing group (n = 262). In the TCGA training group, suitable risk models were built using LASSO and multivariate Cox regression analysis. LASSO regression analysis screened 3 potential genes using the least partial likelihood of deviance (Figure 4A, 4B). Multivariate Cox regression then screened out a risk model composed of 3 prognosis-related genes, PPP1R1A, DPYSL3 and PTPRM (Figure 4C). We calculated the BARGs risk score of each patient based on the formula: Risk score = (0.003281186 × PPP1R1A expression) + (0.00513181 × DPYSL3 expression) - (0.014815237 × PTPRM expression). Patients in the TCGA training group were split into high and low risk groups according to the median scores. Sankey Diagram showed that the BRAGs cluster A with better prognosis mostly corresponded to the low-risk group with more likely to be alive (Figure 4D).
Figure 4.
Prognostic signature was established based on three prognostic brown adipocytes-related genes. A. Cross-validation for tuning parameter screening in the LASSO regression model using 28 BARGs. B. The coefficient profiles of the LASSO regression model. C. The three prognostic genes’ hazard ratios (HRs) by univariate Cox regression analysis. D. Sankey Diagram show the distribution of patients in 2 BRAGs clusters, 2 risk groups, and their survival status.
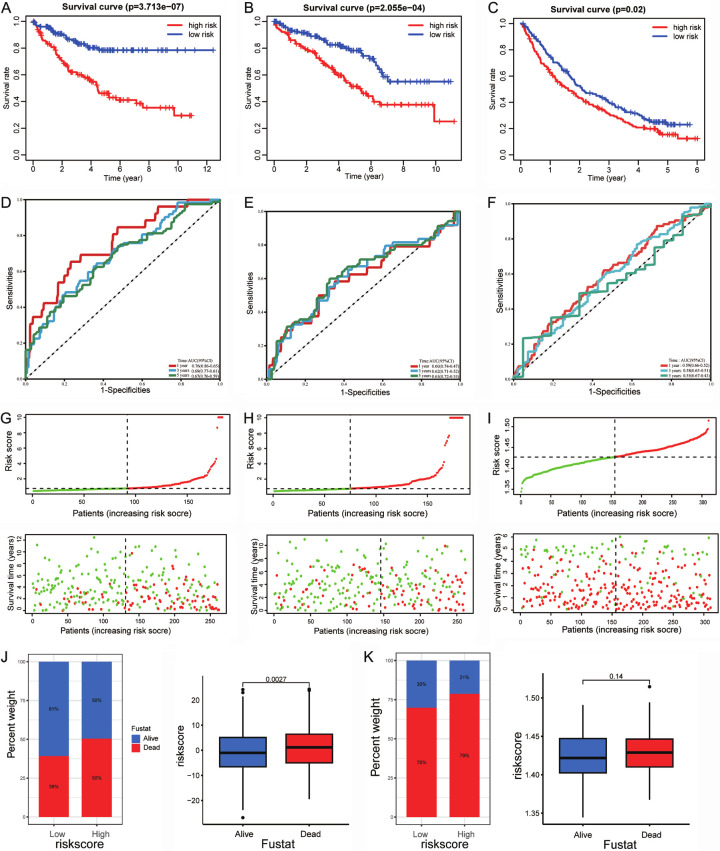
Notably, the low-risk TCGA training group had a greater OS rate than the high-risk group (P < 0.001, Figure 5A). For the TCGA testing group, patients in the low-risk group also had better OS (P < 0.001, Figure 5B). Moreover, the USA-ccRCC cohort (n = 311) validated the risk model prognostic predictive value (Figure 5C). The area under the ROC curves also confirmed the high sensitivity and specificity of the BARGs prognostic model. The AUC scores for the TCGA training group were 0.76, 0.69, and 0.67 at 1, 3, and 5 years (Figure 5D). Meanwhile, the predictive power of the BARGs prognostic model was also validated in vivo and in vitro validation cohort (Figure 5E, 5F). With increasing risk scores, the mortality rate of patients in the TCGA-KIRC and USA-ccRCC cohorts gradually increased (Figure 5G-I). In the high-risk group, the percentage of death was higher. Likewise, the risk score was higher among dead patients (Figure 5J, 5K). These results show that the prognostic model is accurate and specific.
Figure 5.
Validation of the prognostic signature for ccRCC patients. Kaplan-Meier curves show OS differences stratified by the risk score in the training cohort (A), vivo validation cohort (B) and vitro validation cohort (C). ROC curves of the signature for overall survival rates at 1, 3, and 5 years in the training cohort (D), vivo validation cohort (E) and vitro validation cohort (F). Distribution of the risk score and overall survival in the training cohort (G), vivo validation cohort (H) and vitro validation cohort (I). Relationship between risk score and survival status in (J) TCGA-KIRC cohort and (K) USA-ccRCC cohort.
Association between BARGs risk score and clinical characteristic
After deleting samples with inadequate clinical information, we counted 524 specimens from TCGA-KIRC cohort to investigate the correlation of risk models with the clinical feature. Based on different clinical characteristics, we assigned all ccRCC into several different subgroups, including age ≤ 60 (n = 260), age > 60 (n = 264); male (n = 340), female (n = 184); grade I-II (n = 239), grade III-X (n = 285); stage I-II subgroup (n = 318), stage III-IV (n = 206); T I-II (n = 336), T III-IV (n = 188); M0 (n = 418), M1-X (n = 106); N0 (n = 239), and N1-X (n = 285). In the total TCGA database, K-M survival analyses were performed in patients stratified by age, sex, tumor Grade, Stage, and Pathological T, M, N. The results indicated that patients with higher risk score had inferior outcome in each subgroup (P < 0.05, Supplementary Figure 1A-G). The results revealed the risk model might predict ccRCC patients with diverse clinical characteristics and brown adipocyte-related signature may serve as an independent predictor for the poor prognosis of ccRCC.
Correlation of BARGs risk score with immune cell infiltrates
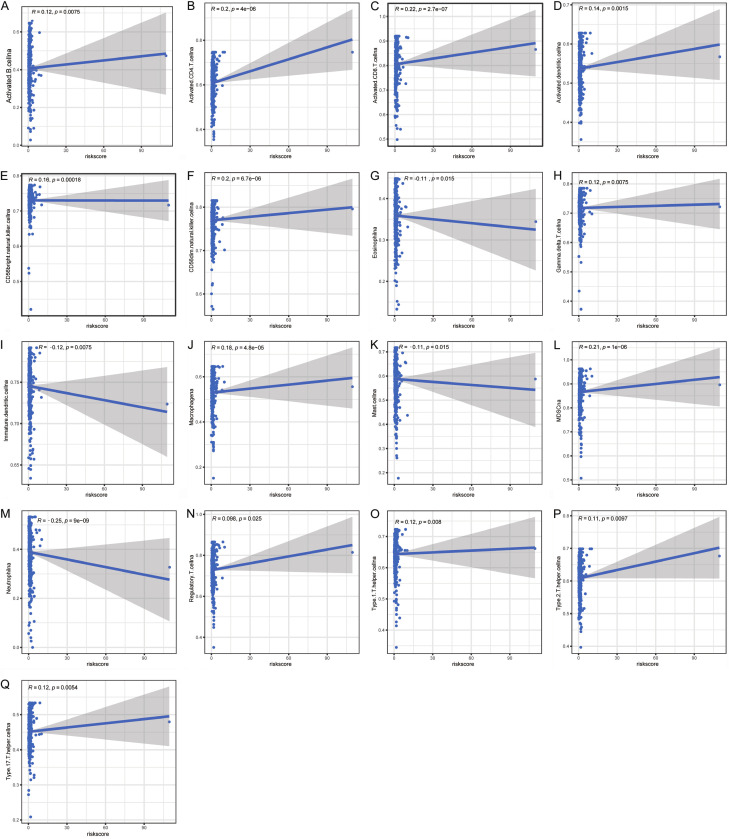
To determine if the brown adipocytes-related genes signature affects immune cell infiltrates, we examined the relationship between the risk score and immune cell infiltration in TCGA datasets. As shown in Figure 6A-Q, the risk score was positively correlated with the infiltration of CD4+ T cells, CD8+ T cells, CD56dim NK cells, CD56bright NK cells, MDSCs, and macrophage cell. In contrast, it was negatively correlated with neutrophil, iDCs, mast cell, and eosinophil. The findings validated the correlation between the risk model and the immune microenvironment of ccRCC.
Figure 6.
Correlation of immune cell infiltrates with the risk score in ccRCC. (A) activated B cell, (B) CD4+ T cells, (C) CD8+ T, (D) activated dendritic cell, (E) CD56bright NK cell, (F) CD56dim NK cell, (G) eosinophil, (H) γδ T cell, (I) iDC, (J) macrophage cell, (K) mast cell, (L) MDSC, (M) neutrophil, (N) Treg cell, (O) Th1 cell, (P) Th2 cell, and (Q) Th17 cell.
Expression differences and survival curves
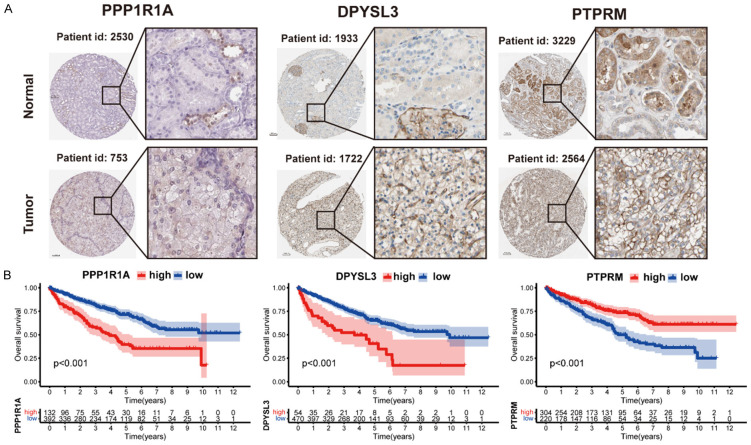
Furthermore, we explored the protein levels of the three brown adipocytes-related genes in the HPA database. Tumor tissues had higher PPP1R1A and DPYSL3 expression than normal tissues. However, PTPRM had no difference (Figure 7A). A survival analysis of the three genes for OS was also performed. Patients with high PPP1R1A and DPYSL3 levels had a worse OS, while those with high PTPRM expression had a better OS rate (Figure 7B).
Figure 7.
Analysis of the protein expression and survival of the genes in the prognostic signature. A. Immunohistochemistry staining data in ccRCC tumor tissues and normal tissues from The Human Protein Atlas. B. Survival curves of three genes involved in the prognostic signature.
The biological function verification of three BARGs
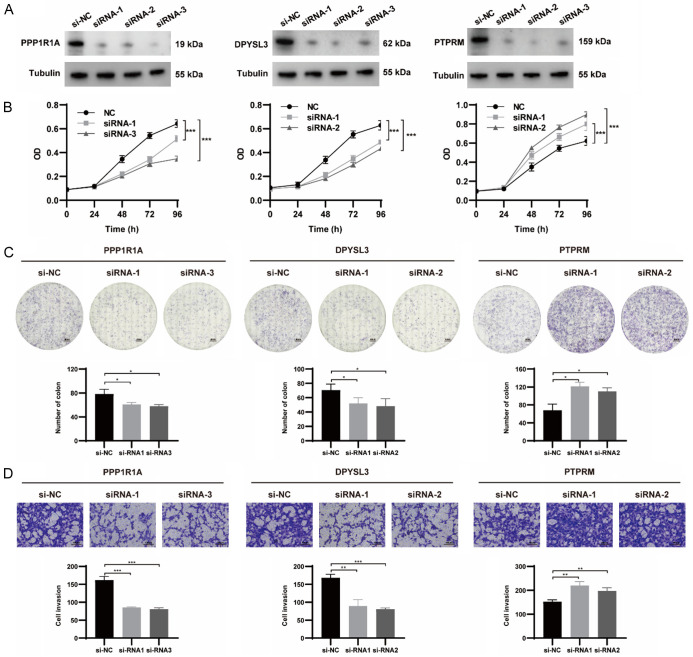
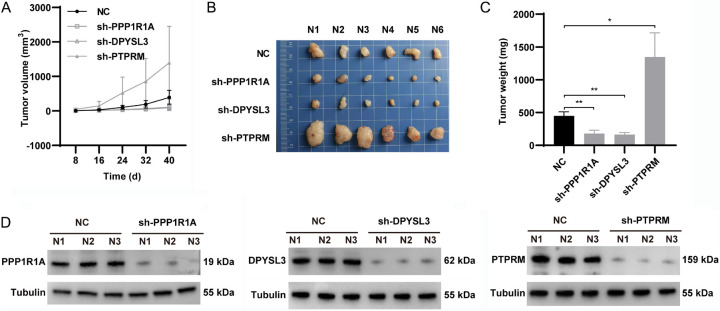
We chose the three genes that make up the risk model for our experimental study. For validation of our predicted tumor promoting role of PPP1R1A and DPYSL3, as well suppressor role of PTPRM in the risk score, we designed 3 siRNAs for each gene and selected the 2 with the highest knockdown efficiency through western blot for functional validation experiments in 786-O cells (Figure 8A). The CCK-8 assays and colony formation assays demonstrated that the inhibition of PPP1R1A and DPYSL3 significantly inhibited the proliferation ability of renal cancer cells. Meanwhile, the results of transwell assays showed that the repression of PPP1R1A and DPYSL3 remarkably reduced migratory cells (Figure 8B-D). As expected, we found that genetic inhibition of PTPRM significantly promoted cell proliferation, colony formation and migration. We further examined the effect of the 3 BARGs on tumor formation and growth in vivo.
Figure 8.
The biological functions of three BARGs, including PPP1R1A, DPYSL3 and PTPRM, were analyzed in renal cancer cells. A. Knockdown efficiency of siRNA was assessed by western blot. B. The results of CCK-8 assays of 786-O cells transfected siRNA or NC. C. Reduced colony numbers in PPP1R1A- and DPYSL3-silenced cells and increased colony numbers in PTPRM-silenced cells compared with control cells. The scale bar was 4 mm. D. Different migration capacities of 786-O cells transfected siRNA or NC. The scale bar was 100 μm.
Consistent with the in vitro results, PPP1R1A or DPYSL3 knockdown significantly retarded tumor growth, as shown by the reduction in sizes and volumes of the sh-PPP1R1A and sh-DPYSL3 groups. In addition, tumor volume and weight in the sh-PTPRM group were significantly increased (Figure 9A-C). The knockdown efficiency of the shRNAs were confirmed by western blot in tumors (Figure 9D). These results indicated that inhibitor of PPP1R1A and DPYSL3 and/or activator of PTPRM may be a novel approach for ccRCC treatments.
Figure 9.
Regulating effects of BARGs silencing on subcutaneous tumor growth in mice. A. Tumors growth and volume were showed every 8 days. B. Isolated xenograft tumors were showed. C. Xenograft tumor weights were measured from different groups. D. Knockdown efficiencies of shRNA were assessed by western blot.
Discussion
ccRCC, the fifth most common type of cancer worldwide, has high recurrence and mortality rates. It is crucial that patients can be diagnosed and prognostic early at present. Gene signatures, a biological function pattern identified by the expression of several genes, can be utilized to identify and prognosticate multiple tumors. Tumor proliferation and differentiation require a bidirectional crosstalk between cancer cells and the surrounding environment. Perinephric adipose tissue is the most abundant cell population around the renal. PAT infiltrating into tumor tissue and browning worsens ccRCC patients’ prognoses. A study of 174 ccRCC patients found that greater PAT is related to worse progression-free survival [24]. The outsized adipose tissue can provide growth factors, cytokines, adipokines, or extracellular matrix scaffolding through autocrine and paracrine, stimulating cancer cell growth. Moreover, PAT infiltration during ccRCC tumor development was a marker for aggressive tumor behaviors and an independent worse prognostic factor in ccRCC patients [25,26]. Previous reports have demonstrated that perinephric adipocytes undergo a phase of browning generated locally by tumor adaptation. Meanwhile, brown adipocytes can stimulate tumor growth and metastasis in return. Gang Wei and colleagues conclude that renal tumors enhance and hijack reprogramming of adjacent PAT for browning, resulting in BAT specific release of lactate to “feed” cancer cells [19,27]. Upregulated expression of uncoupling protein 1 (UCP1) to activate the uncoupling of the oxidative phosphorylation from adenosine triphosphate (ATP) is a typical marker of adipocytes browning, specific expression in mitochondria of BAT [28]. In this perspective, a higher UCP1 expression in PAT is considered a negative prognostic factor in ccRCC patients [29]. Those indications indicate that genes associated with brown adipocytes may play crucial roles in ccRCC. Therefore, this study aimed to delve into the prognostic value of BARGs and reveal the immune profiles of different BRAGs-associated clusters in ccRCC, to find potential targets for diagnosing and evaluating ccRCC patients.
In this study, TCGA-KIRC transcriptome profiling was used to screen 28 different expressed BARGs. Then, ccRCC patients were classified into two clusters according to the 28 BARGs expression, and we found a significant difference in prognosis between the 2 clusters (P < 0.05). We found that cluster B affected immune cell infiltration of ccRCC. 524 patients were randomly divided into training and in vivo testing cohort. In the training cohort, three genes, PPP1R1A, DPYSL3 and PTPRM, were constructed for the prognostic risk model by using LASSO regression and Cox regression analyses. We calculated risk scores for each ccRCC patient using three gene expression levels and correlation coefficients. We divided them into high- and low-risk groups based on the median risk score in the training and validation cohorts. Moreover, the risk score could distinctly distinguish overall survival, with the low-risk group displaying a more positive prognosis. Besides, K-M survival analysis in each subgroup suggested that the risk score model for ccRCC patients may be an independent prognostic indicator. The prognostic performance of Risk Score in the TCGA-KIRC stratified analysis again validated this risk model’s hidden values and broadened its scope of use.
Among these three genes, the DPYSL3, a member of the dihydropyrimidinase-like proteins, is highly expressed in renal, colon and prostate tumor tissues [30,31]. DPYSL3 is involved in cell differentiation, migration, neurogenesis, and neurodegeneration, and high expression was correlated with poor prognosis in ccRCC [32]. Another bioinformatic analysis found DPYSL3 might be regulated by miR-451a in RCC cells [33]. These findings were consistent with our functional experiment in 786-O cells. PPP1R1A is recognized as a protein phosphatase 1 regulatory subunit [34]. Recently a study found PPP1R1A as one of seven prognostic-related gene signatures in ccRCC [35]. We found that knockdown of the DPYSL3 and PPP1R1A could significantly reduce the proliferation and migration of renal cancer cell lines in vitro and inhibited the tumor growth rate in vivo. PTPRM, a protein tyrosine phosphatase (PTP), has been little studied in ccRCC development. Moreover, the upregulation of PTPRM expression has been proved to promote tumor growth and metastasis, as well as positively correlated with poor prognosis in cervical cancer [36]. The present study of these three genes provided a partial clue to increasing prognostic value. Herein, our in vitro and in vivo experimental results showed that PTPRM suppressed the proliferation and migration of renal cancer cells. However, their potential mechanisms in ccRCC development need further investigation.
Our study does contain some flaws; that is a fact. First, we analyzed the model mostly with bioinformatics and lacked experimental evidence. Second, we verified the prognostic risk model using TCGA-KIRC cohort and another independent USA-ccRCC cohort, which inevitably degraded the prediction performance because of the sample size limitation when performing model training and validation. Lastly, the prognostic risk model was constructed on gene expression data while ignoring the influence of epigenetic modifications and other factors; therefore, it may have an inherent flaw.
Conclusion
In conclusion, we were the first to systematically elucidate the diagnostic and prognostic value of BARGs, and identify crosstalk between brown adipocytes and ccRCC tissue. Through prognostic BARGs, patients in distinct clusters could be investigated molecular subtyping and immune cell infiltrate. Functional analyses suggested that three BARGs were tightly correlated with renal cancer cell proliferation and migration in vitro. In this study, we established useful signatures for prognosis evaluation for ccRCC.
Acknowledgements
The authors would like to thank the Central South University, Institute of Clinical Pharmacology for the technical and platform support.
Disclosure of conflict of interest
None.
Supporting Information
References
- 1.Siegel RL, Miller KD, Fuchs HE, Jemal A. Cancer statistics, 2022. CA Cancer J Clin. 2022;72:7–33. doi: 10.3322/caac.21708. [DOI] [PubMed] [Google Scholar]
- 2.Aldin A, Besiroglu B, Adams A, Monsef I, Piechotta V, Tomlinson E, Hornbach C, Dressen N, Goldkuhle M, Maisch P, Dahm P, Heidenreich A, Skoetz N. First-line therapy for adults with advanced renal cell carcinoma: a systematic review and network meta-analysis. Cochrane Database Syst Rev. 2023;5:CD013798. doi: 10.1002/14651858.CD013798.pub2. [DOI] [PMC free article] [PubMed] [Google Scholar]
- 3.Ljungberg B, Albiges L, Abu-Ghanem Y, Bedke J, Capitanio U, Dabestani S, Fernández-Pello S, Giles RH, Hofmann F, Hora M, Klatte T, Kuusk T, Lam TB, Marconi L, Powles T, Tahbaz R, Volpe A, Bex A. European association of urology guidelines on renal cell carcinoma: the 2022 update. Eur Urol. 2022;82:399–410. doi: 10.1016/j.eururo.2022.03.006. [DOI] [PubMed] [Google Scholar]
- 4.Himbert C, Delphan M, Scherer D, Bowers LW, Hursting S, Ulrich CM. Signals from the adipose microenvironment and the obesity-cancer link-a systematic review. Cancer Prev Res (Phila) 2017;10:494–506. doi: 10.1158/1940-6207.CAPR-16-0322. [DOI] [PMC free article] [PubMed] [Google Scholar]
- 5.de Visser KE, Joyce JA. The evolving tumor microenvironment: from cancer initiation to metastatic outgrowth. Cancer Cell. 2023;41:374–403. doi: 10.1016/j.ccell.2023.02.016. [DOI] [PubMed] [Google Scholar]
- 6.Maurits JSF, Sedelaar JPM, Mulders PFA, Aben KKH, Kiemeney LALM, Vrieling A. Skeletal muscle radiodensity and visceral adipose tissue index are associated with survival in renal cell cancer - a multicenter population-based cohort study. Clin Nutr. 2022;41:131–143. doi: 10.1016/j.clnu.2021.11.012. [DOI] [PubMed] [Google Scholar]
- 7.Sakers A, De Siqueira MK, Seale P, Villanueva CJ. Adipose-tissue plasticity in health and disease. Cell. 2022;185:419–446. doi: 10.1016/j.cell.2021.12.016. [DOI] [PMC free article] [PubMed] [Google Scholar]
- 8.Liu Y, Liu Y, Hu J, He Z, Liu L, Ma Y, Wen D. Heterogeneous miRNA-mRNA regulatory networks of visceral and subcutaneous adipose tissue in the relationship between obesity and renal clear cell carcinoma. Front Endocrinol (Lausanne) 2021;12:713357. doi: 10.3389/fendo.2021.713357. [DOI] [PMC free article] [PubMed] [Google Scholar]
- 9.Nieman KM, Kenny HA, Penicka CV, Ladanyi A, Buell-Gutbrod R, Zillhardt MR, Romero IL, Carey MS, Mills GB, Hotamisligil GS, Yamada SD, Peter ME, Gwin K, Lengyel E. Adipocytes promote ovarian cancer metastasis and provide energy for rapid tumor growth. Nat Med. 2011;17:1498–1503. doi: 10.1038/nm.2492. [DOI] [PMC free article] [PubMed] [Google Scholar]
- 10.Wen YA, Xing X, Harris JW, Zaytseva YY, Mitov MI, Napier DL, Weiss HL, Mark Evers B, Gao T. Adipocytes activate mitochondrial fatty acid oxidation and autophagy to promote tumor growth in colon cancer. Cell Death Dis. 2017;8:e2593. doi: 10.1038/cddis.2017.21. [DOI] [PMC free article] [PubMed] [Google Scholar]
- 11.Reguero M, Gómez de Cedrón M, Wagner S, Reglero G, Quintela JC, Ramírez de Molina A. Precision nutrition to activate thermogenesis as a complementary approach to target obesity and associated-metabolic-disorders. Cancers (Basel) 2021;13:866. doi: 10.3390/cancers13040866. [DOI] [PMC free article] [PubMed] [Google Scholar]
- 12.Young P, Arch JR, Ashwell M. Brown adipose tissue in the parametrial fat pad of the mouse. FEBS Lett. 1984;167:10–14. doi: 10.1016/0014-5793(84)80822-4. [DOI] [PubMed] [Google Scholar]
- 13.Elattar S, Dimri M, Satyanarayana A. The tumor secretory factor ZAG promotes white adipose tissue browning and energy wasting. FASEB J. 2018;32:4727–4743. doi: 10.1096/fj.201701465RR. [DOI] [PMC free article] [PubMed] [Google Scholar]
- 14.Kir S, White JP, Kleiner S, Kazak L, Cohen P, Baracos VE, Spiegelman BM. Tumour-derived PTH-related protein triggers adipose tissue browning and cancer cachexia. Nature. 2014;513:100–104. doi: 10.1038/nature13528. [DOI] [PMC free article] [PubMed] [Google Scholar]
- 15.Zhang H, Zhu L, Bai M, Liu Y, Zhan Y, Deng T, Yang H, Sun W, Wang X, Zhu K, Fan Q, Li J, Ying G, Ba Y. Exosomal circRNA derived from gastric tumor promotes white adipose browning by targeting the miR-133/PRDM16 pathway. Int J Cancer. 2019;144:2501–2515. doi: 10.1002/ijc.31977. [DOI] [PubMed] [Google Scholar]
- 16.Ye J, Wu S, Pan S, Huang J, Ge L. Risk scoring based on expression of long non-coding RNAs can effectively predict survival in hepatocellular carcinoma patients with or without fibrosis. Oncol Rep. 2020;43:1451–1466. doi: 10.3892/or.2020.7528. [DOI] [PMC free article] [PubMed] [Google Scholar]
- 17.Wu Q, Li J, Li Z, Sun S, Zhu S, Wang L, Wu J, Yuan J, Zhang Y, Sun S, Wang C. Exosomes from the tumour-adipocyte interplay stimulate beige/brown differentiation and reprogram metabolism in stromal adipocytes to promote tumour progression. J Exp Clin Cancer Res. 2019;38:223. doi: 10.1186/s13046-019-1210-3. [DOI] [PMC free article] [PubMed] [Google Scholar] [Retracted]
- 18.Ferrando M, Bruna FA, Romeo LR, Contador D, Moya-Morales DL, Santiano F, Zyla L, Gomez S, Lopez-Fontana CM, Calvo JC, Carón RW, Toneatto J, Pistone-Creydt V. Renal peritumoral adipose tissue undergoes a browning process and stimulates the expression of epithelial-mesenchymal transition markers in human renal cells. Sci Rep. 2022;12:8687. doi: 10.1038/s41598-022-12746-9. [DOI] [PMC free article] [PubMed] [Google Scholar]
- 19.Wei G, Sun H, Dong K, Hu L, Wang Q, Zhuang Q, Zhu Y, Zhang X, Shao Y, Tang H, Li Z, Chen S, Lu J, Wang Y, Gan X, Zhong TP, Gui D, Hu X, Wang L, Liu J. The thermogenic activity of adjacent adipocytes fuels the progression of ccRCC and compromises anti-tumor therapeutic efficacy. Cell Metab. 2021;33:2021–2039. e2028. doi: 10.1016/j.cmet.2021.08.012. [DOI] [PubMed] [Google Scholar]
- 20.Wu Y, Li X, Li Q, Cheng C, Zheng L. Adipose tissue-to-breast cancer crosstalk: comprehensive insights. Biochim Biophys Acta Rev Cancer. 2022;1877:188800. doi: 10.1016/j.bbcan.2022.188800. [DOI] [PubMed] [Google Scholar]
- 21.Braun DA, Hou Y, Bakouny Z, Ficial M, Sant’ Angelo M, Forman J, Ross-Macdonald P, Berger AC, Jegede OA, Elagina L, Steinharter J, Sun M, Wind-Rotolo M, Pignon JC, Cherniack AD, Lichtenstein L, Neuberg D, Catalano P, Freeman GJ, Sharpe AH, McDermott DF, Van Allen EM, Signoretti S, Wu CJ, Shukla SA, Choueiri TK. Interplay of somatic alterations and immune infiltration modulates response to PD-1 blockade in advanced clear cell renal cell carcinoma. Nat Med. 2020;26:909–918. doi: 10.1038/s41591-020-0839-y. [DOI] [PMC free article] [PubMed] [Google Scholar]
- 22.Deshmukh AS, Peijs L, Beaudry JL, Jespersen NZ, Nielsen CH, Ma T, Brunner AD, Larsen TJ, Bayarri-Olmos R, Prabhakar BS, Helgstrand C, Severinsen MCK, Holst B, Kjaer A, Tang-Christensen M, Sanfridson A, Garred P, Privé GG, Pedersen BK, Gerhart-Hines Z, Nielsen S, Drucker DJ, Mann M, Scheele C. Proteomics-based comparative mapping of the secretomes of human brown and white adipocytes reveals EPDR1 as a novel batokine. Cell Metab. 2019;30:963–975. e967. doi: 10.1016/j.cmet.2019.10.001. [DOI] [PubMed] [Google Scholar]
- 23.Wilkerson MD, Hayes DN. ConsensusClusterPlus: a class discovery tool with confidence assessments and item tracking. Bioinformatics. 2010;26:1572–1573. doi: 10.1093/bioinformatics/btq170. [DOI] [PMC free article] [PubMed] [Google Scholar]
- 24.Huang H, Chen S, Li W, Wu X, Xing J. High perirenal fat thickness predicts a poor progression-free survival in patients with localized clear cell renal cell carcinoma. Urol Oncol. 2018;36:157.e151–157.e156. doi: 10.1016/j.urolonc.2017.12.011. [DOI] [PubMed] [Google Scholar]
- 25.Shah PH, Lyon TD, Lohse CM, Cheville JC, Leibovich BC, Boorjian SA, Thompson RH. Prognostic evaluation of perinephric fat, renal sinus fat, and renal vein invasion for patients with pathological stage T3a clear-cell renal cell carcinoma. BJU Int. 2019;123:270–276. doi: 10.1111/bju.14523. [DOI] [PubMed] [Google Scholar]
- 26.Lee H, Lee M, Lee SE, Byun SS, Kim HH, Kwak C, Hong SK. Outcomes of pathologic stage T3a renal cell carcinoma up-staged from small renal tumor: emphasis on partial nephrectomy. BMC Cancer. 2018;18:427. doi: 10.1186/s12885-018-4338-1. [DOI] [PMC free article] [PubMed] [Google Scholar]
- 27.Maguire OA, Ackerman SE, Szwed SK, Maganti AV, Marchildon F, Huang X, Kramer DJ, Rosas-Villegas A, Gelfer RG, Turner LE, Ceballos V, Hejazi A, Samborska B, Rahbani JF, Dykstra CB, Annis MG, Luo JD, Carroll TS, Jiang CS, Dannenberg AJ, Siegel PM, Tersey SA, Mirmira RG, Kazak L, Cohen P. Creatine-mediated crosstalk between adipocytes and cancer cells regulates obesity-driven breast cancer. Cell Metab. 2021;33:499–512. e496. doi: 10.1016/j.cmet.2021.01.018. [DOI] [PMC free article] [PubMed] [Google Scholar]
- 28.Yin X, Chen Y, Ruze R, Xu R, Song J, Wang C, Xu Q. The evolving view of thermogenic fat and its implications in cancer and metabolic diseases. Signal Transduct Target Ther. 2022;7:324. doi: 10.1038/s41392-022-01178-6. [DOI] [PMC free article] [PubMed] [Google Scholar]
- 29.Li X, Wang G, Liu J, Ding G. Increased UCP1 expression in the perirenal adipose tissue of patients with renal cell carcinoma. Oncol Rep. 2019;42:1972–1980. doi: 10.3892/or.2019.7306. [DOI] [PMC free article] [PubMed] [Google Scholar]
- 30.Tsai YM, Wu KL, Chang YY, Hung JY, Chang WA, Chang CY, Jian SF, Tsai PH, Huang YC, Chong IW, Hsu YL. Upregulation of Thr/Tyr kinase increases the cancer progression by neurotensin and dihydropyrimidinase-like 3 in lung cancer. Int J Mol Sci. 2020;21:1640. doi: 10.3390/ijms21051640. [DOI] [PMC free article] [PubMed] [Google Scholar]
- 31.Tan F, Wahdan-Alaswad R, Yan S, Thiele CJ, Li Z. Dihydropyrimidinase-like protein 3 expression is negatively regulated by MYCN and associated with clinical outcome in neuroblastoma. Cancer Sci. 2013;104:1586–1592. doi: 10.1111/cas.12278. [DOI] [PMC free article] [PubMed] [Google Scholar]
- 32.Ma CG, Xu WH, Xu Y, Wang J, Liu WR, Cao DL, Wang HK, Shi GH, Zhu YP, Qu YY, Zhang HL, Ye DW. Identification and validation of novel metastasis-related signatures of clear cell renal cell carcinoma using gene expression databases. Am J Transl Res. 2020;12:4108–4126. [PMC free article] [PubMed] [Google Scholar]
- 33.Yamada Y, Arai T, Sugawara S, Okato A, Kato M, Kojima S, Yamazaki K, Naya Y, Ichikawa T, Seki N. Impact of novel oncogenic pathways regulated by antitumor miR-451a in renal cell carcinoma. Cancer Sci. 2018;109:1239–1253. doi: 10.1111/cas.13526. [DOI] [PMC free article] [PubMed] [Google Scholar]
- 34.Wu X, Wang Y, Yang M, Wang Y, Wang X, Zhang L, Liao L, Li N, Mao M, Guan J, Ye F. Exploring prognostic value and regulation network of PPP1R1A in hepatocellular carcinoma. Hum Cell. 2022;35:1856–1868. doi: 10.1007/s13577-022-00771-9. [DOI] [PubMed] [Google Scholar]
- 35.Chen L, Xiang Z, Chen X, Zhu X, Peng X. A seven-gene signature model predicts overall survival in kidney renal clear cell carcinoma. Hereditas. 2020;157:38. doi: 10.1186/s41065-020-00152-y. [DOI] [PMC free article] [PubMed] [Google Scholar]
- 36.Liu P, Zhang C, Liao Y, Liu J, Huang J, Xia M, Chen M, Tan H, He W, Xu M, Liu T, Ooi S, Du Q, Qin S, Zhu Y, Zou Q, Wang W, Yao S. High expression of PTPRM predicts poor prognosis and promotes tumor growth and lymph node metastasis in cervical cancer. Cell Death Dis. 2020;11:687. doi: 10.1038/s41419-020-02826-x. [DOI] [PMC free article] [PubMed] [Google Scholar]
Associated Data
This section collects any data citations, data availability statements, or supplementary materials included in this article.


