

Abstract
The prevention and treatment strategies for cervical cancer patients undergoing spinal epidural anesthesia have increasingly focused on early screening for high-risk factors associated with potential hypotension. We analyze the general conditions and preoperative examination results of 312 cervical cancer patients who received spinal epidural anesthesia, in order to identify independent risk factors for hypotension, assess their predictive efficacy, and construct a nomogram. 312 patients with cervical cancer received spinal epidural anesthesia were included in this study. Among them, 164 patients with hypotension after hysterectomy with spinal epidural anesthesia were in a hypotension group. Important risk predictors of hypotension after hysterectomy with spinal epidural anesthesia were identified using univariate and multivariate analyses, then a clinical nomogram was constructed. The predictive accuracy was assessed by unadjusted concordance index (C-index) and calibration plot. Univariate and multivariate regression analysis identified basal HR (≥95) (95% CI 0.831-0.900; P = 0.000) and basal PVI (95% CI 0.679-0.877; P = 0.000) were the independent risk factors for hypotension in cervical cancer patients with spinal epidural anesthesia. Those risk factors were used to construct a clinical predictive nomogram. The regression equation model based on the above factors was logit (P) = -6.820 + 0.216 * basal HR + basic PVI * 0.312. The calibration curves for hypotension risk revealed excellent accuracy of the predictive nomogram model. Decision curve analysis showed that the predictive model could be applied clinically when the threshold probability was 20 to 75%. We surmised that the basal HR values and PVI values are the independent risk factors for hypotension in cervical cancer patients with spinal epidural anesthesia. The construction of nomograms is beneficial in predicting the risk of hypotension in these patients.
Keywords: Heart rate, pulse perfusion variability index, hypotension, cervical cancer, spinal epidural anesthesia, predictive effect, nomogram
Introduction
Cervical cancer is a common tumor in the female reproductive system and can occur at any age, with incidence peaking in women at the ages of 35 to 39 and 60 to 64. It is a malignant tumor that is prone to occur in women after breast cancer and rectal cancer. According to data in 2023, there are 110,000 new cases of cervical cancer and 60,000 death cases in China, posing a serious threat [1,2]. Research has shown that persistent high-risk human papilloma virus (HPV) infection is closely related to the occurrence of cervical cancer [3]. Hysterectomy is the most common surgical treatment method in clinical cervical cancer [4]. Spinal anesthesia combined with epidural anesthesia is a common anesthesia method for cervical cancer surgery [5]. However, one potential complication of this type of anesthesia is postoperative hypotension [6], which can have a significant impact on patients. Postoperative hypotension, or low blood pressure, can occur as a result of the anesthesia affecting the body’s autonomic nervous system. This can lead to a decrease in blood flow to vital organs, including the heart and brain [7]. Low blood pressure can result in symptoms such as dizziness, lightheadedness, and fainting, which can be especially dangerous for patients recovering from surgery. In severe cases, hypotension can lead to organ damage or even be life-threatening [8,9].
Hypotension in clinical intravertebral anesthesia for hysterectomy is not resulted from a single factor, but the dominant factors causing hypotension vary from patient to patient [10]. It has been shown that various factors such as vasodilation, fluid shifts, medications, pre-existing conditions, autonomic dysfunction, and hypovolemia may contribute to an increased incidence of hypotension [11]. Douglas [12] et al. found that epidural anesthesia was a risk factor for postoperative pheochromocytoma and/or paraganglioma (HR = 3.49 (95% CI: 1.25-9.76), P = 0.017). Kuok et al. [13] investigated the relationship between abdominal girth and uterine compression of the inferior vena cava, as well as the plane of sensory block, during lumbar anesthesia with low-dose, heavy bupivacaine in pregnant women undergoing cesarean delivery. Their study aimed to determine whether abdominal girth could predict the incidence of hypotension during cesarean delivery. The pulse perfusion variability index (PVI), which reflects the respiratory variability of the wave amplitude in pulse volume tracing, is highly sensitive to changes in preload [14,15]. Previous studies have shown that a higher basal PVI before anesthesia is associated with an increased likelihood of hypotension following spinal epidural anesthesia [16,17]. Additionally, Frolich et al. [18] demonstrated that women with a higher basal heart rate (HR) are more likely to develop hypotension after intrathecal block.
In our study, we present a tool for more targeted monitoring and intervention strategies, aimed at improving the safety and quality of anesthesia management. Furthermore, the development of a nomogram prediction model offers clinicians a practical and visual tool for making predictions and informed decisions, which facilitates individualized treatment plans and enhances patient outcomes. This approach also contributes to advancing anesthesia research and clinical practice in cervical cancer patients, paving the way for improved patient care and the reduction of potential complications related to hypotension.
The prevention and treatment strategies for cervical cancer patients undergoing spinal epidural anesthesia have increasingly focused on early screening for high-risk factors associated with potential hypotension. However, monitoring indicators such as cerebral oxygen saturation and HR variability are not widely adopted in clinical practice due to the limitations of monitoring equipment or the complexity of calculation methods. As a result, there remains a need for effective, rapid, reliable, and user-friendly predictors. The purpose of this paper is to analyze the general conditions and preoperative examination results of 312 cervical cancer patients who received spinal epidural anesthesia, in order to identify independent risk factors for hypotension, assess their predictive efficacy, and construct a nomogram. The goal is to provide a theoretical basis for improving the prevention of hypotension following hysterectomy with spinal epidural anesthesia in clinical practice.
Methods and materials
Study design and ethics
This retrospective analysis included patient data between January 2019 and December 2021 from General Hospital of Taiyuan Iron & Steel (Group) Co., Ltd. The patient selection process is shown in the Figure 1. This study has been reviewed and approved by the medical ethics committee of General Hospital of Taiyuan Iron & Steel (Group) Co., Ltd.
Figure 1.

Flow diagram detailing the selection of patients.
Inclusion criteria
(1) Patients with age over 22 years; (2) Patients with cervical cancer who underwent hysterectomy under spinal epidural anesthesia; (3) Patients in good maternal health condition; (4) Patients with complete case records; (5) Patients with a confirmed diagnosis of cervical cancer.
Exclusion criteria
(1) Patients with abnormal liver or kidney function; (2) Pregnant females; (3) Patients requiring fluid or blood transfusion for volume expansion during hysterectomy; (4) Patients with allergic reactions to anesthetic drugs; (5) Patients with incomplete case records.
Diagnosis and grouping
Hypotension was defined as a systolic blood pressure (SBP) of ≤80 mmHg, a decrease of more than 20% from baseline, or a mean arterial pressure (MAP) of ≤60 mmHg, accompanied by symptoms such as nausea, vomiting, chest tightness, dizziness, and sweating [19]. Based on these criteria, the 312 women in the study were divided into two groups: a normal blood pressure group and a hypotension group. Of these, 148 women (47.4%) were in the normal blood pressure group, while 164 women (52.6%) were classified in the hypotension group.
Intoxication methods
No preoperative medication was administered to any of the women, and the operating room temperature was maintained at 22°C. The women were placed with the right hip elevated and in a 15° left-leaning supine position. An anesthesiologist continuously monitored HR, SBP, diastolic blood pressure (DBP), MAP, oxygen saturation (SpO2), and electrocardiogram (ECG). A peripheral vein in the right hand was accessed without pre-expansion. Initially, 500 mL of hydroxyethyl starch was infused at a rate of 0.2 ml/kg/min, followed by an infusion of sodium lactate compound at the same rate until the end of the procedure. The patient was positioned in the left lateral position for combined spinal-epidural anesthesia, with the puncture site at the L3-4 interspace. A 16G needle was used to access the epidural space utilizing the saline resistance loss method. After confirming entry into the epidural space, a 25G lumbar puncture needle was advanced through the lumen of the epidural needle to puncture the subarachnoid space. The presence of cerebrospinal fluid was confirmed by its outflow. Next, 10 mg (2 mL) of heavy bupivacaine was diluted with cerebrospinal fluid to a total volume of 2.5 mL and injected over 15-30 seconds. After the bupivacaine was administered, an epidural catheter was placed and secured. The patient was then repositioned to a 15° left-leaning supine position, and oxygen was administered via a nasal cannula.
Hypovolemia was defined as an SBP below 80% of the baseline value, and in such cases, the patient was treated with oxygen administered through a nasal cannula. Hypotension was also defined in this context and treated with 100 μg of intravenous phenylephrine as needed. If severe bradycardia occurs (HR <50 beats/min), the patient was treated with 0.5 mg of intravenous atropine. If the level of sensory blockade did not reach the T6 level within 10 minutes, the block was considered insufficient, and the patient was excluded from the study. In cases of incomplete blockade, 5 to 10 mL of 1% lidocaine was injected through the epidural catheter.
Data collection and measurement
We collected various clinical data, including maternal basal HR, SBP, body mass index (BMI), method of anesthesia, puncture site, duration of preoperative fasting, and the volume of pre-anesthesia fluid administration. Additionally, we gathered other relevant clinical information. The PVI, which reflects the respiratory variability of the wave amplitude in pulse volume tracing, was monitored using the Masimo Radical-7 device. Basal values for HR, PVI, SBP, DBP, and MAP were recorded three times at 3-minute intervals before anesthesia and again 5 minutes after stabilization. Following anesthesia, HR, PVI, SBP, DBP, and MAP were recorded every minute for 10 minutes. Additionally, the temperature measured by an alcohol swab was recorded at 10 minutes after the start of anesthesia, along with the total volume of fluid administered.
Statistical analysis
IBM SPSS 17.0 statistical software was used for data analysis. The Kolmogorov-Smirnov (K-S) test was employed to assess the normality of the data. Data with a normal distribution were presented as mean ± standard deviation (SD). For comparisons between multiple groups, one-way ANOVA was used, with the Least Significant Difference (LSD) test applied for pairwise comparisons. Data not normally distributed were described using median (P25, P75), and comparisons between groups were conducted using nonparametric tests, specifically the Kruskal-Wallis test for multiple groups. Categorical variables were expressed as frequencies (percentages), and comparisons between groups were performed using the chi-square test. Identified risk factors were entered into R software (version 3.6.3) to construct a nomogram model for predicting the risk of hypotension after hysterectomy with spinal epidural anesthesia. The variables and regression coefficients from the model were determined, and the receiver operating characteristic (ROC) curve was generated for validation. The ROC curve was used to evaluate the diagnostic performance of the nomogram model.
Results
Clinical characteristics of hypotension and normotensive group
The characteristics of the two groups, including age, BMI, ASA level, first pregnancy time, fasting time, preoperative infusion volume, dosage of bupivacaine, sensory blockade time, highest level of anesthesia, and past medical history, were similar (P>0.05). However, there was a significant difference in hypoproteinemia between the two groups (P<0.05) (Table 1).
Table 1.
Comparison of clinical characteristics between hypotension and normotensive group
| Hypotension group (n = 164) | Normotensive group (n = 148) | t/x2 | P | |
|---|---|---|---|---|
| Age (years) | 30.5±5.0 | 30.25±5.6 | 0.386 | 0.700 |
| BMI | 21.9±1.2 | 21.7±1.5 | 0.836 | 0.404 |
| ASA Level | 2.719 | 0.099 | ||
| I | 84 (51.2%) | 86 (58.1%) | ||
| II | 80 (48.8%) | 62 (41.9%) | ||
| Fasting time (<16 h) | 132 (80.5%) | 118 (79.7%) | 0.028 | 0.867 |
| Preoperative infusion volume | 382.2±161.4 | 387.9±115.4 | 0.353 | 0.724 |
| Diabetes | 32 (19.5%) | 26 (17.6%) | 0.087 | 0.985 |
| Hypertension | 14 (8.5%) | 10 (6.8%) | 0.347 | 0.556 |
| Coronary heart disease | 32 (19.5%) | 30 (20.2%) | 0.028 | 0.867 |
| Anemia | 78 (47.6%) | 62 (41.9%) | 1.011 | 0.315 |
| Hypoproteinemia | 83 (50.6%) | 58 (39.2%) | 4.097 | 0.043 |
| Electrolyte disturbance | 85 (51.8%) | 73 (49.3%) | 0.195 | 0.659 |
| Dosage of bupivacaine (ml) | 11.1±1.3 | 11.1±1.1 | 0.527 | 0.599 |
| Sensory blockade time (min) | 116.6±20.2 | 116.1±13.4 | 0.256 | 0.798 |
| The highest level of anesthesia | T7.9±0.6 | T7.8±0.6 | 1.443 | 0.150 |
Comparison of general vital signs
As shown in Table 2, the hypotension group had significantly higher basal values for HR and PVI compared to the normotensive group (P<0.05). Specifically, the basal HR was significantly faster and the basal PVI was significantly higher in women with hypotension (P<0.05). However, the differences in basal values for maternal SBP, DBP, and MAP between the two groups were not statistically significant (P>0.05).
Table 2.
Comparison of general vital signs
| Hypotension group (n = 164) | Normotensive group (n = 148) | t | P | |
|---|---|---|---|---|
| Basal HR | 99.06±7.71 | 79.50±15.34 | 14.380 | 0.000 |
| Basal SBP | 124.92±8.19 | 125.18±7.72 | -0.287 | 0.774 |
| Basal PVI | 19.51±2.62 | 17.19±2.50 | 7.932 | 0.000 |
| Basal DBP | 69.98±4.61 | 69.91±4.50 | 0.142 | 0.887 |
| Basal MAP | 80.57±4.47 | 80.14±6.07 | 0.710 | 0.478 |
Note: HR, heart rate; SBP, systolic blood pressure; PVI, pulse perfusion variability index; DBP, diastolic blood pressure; MAP, mean artery pressure.
Univariate and multivariate analysis
Univariate and multivariate analyses identified risk factors associated with hypotension after hysterectomy with spinal epidural anesthesia (Tables 3 and 4). The independent risk factors included basal HR (95% CI 0.831-0.900; P = 0.000) and basal PVI (95% CI 0.679-0.877; P = 0.000).
Table 3.
Binary logistic regression analysis
| Factor | Hypotension group (n = 164) | Normotensive group (n = 148) | x2 | P |
|---|---|---|---|---|
| Age | 2.673 | 0.102 | ||
| <35 years | 114 (69.5%) | 115 (77.7%) | ||
| ≥35 years | 50 (30.5%) | 33 (22.3%) | ||
| BMI | 0.031 | 0.860 | ||
| ≥20 | 129 (78.7%) | 123 (83.1%) | ||
| <20 | 35 (21.3%) | 25 (16.9%) | ||
| Fasting time | 0.028 | 0.867 | ||
| <16 h | 132 (80.5%) | 118 (79.7%) | ||
| ≥16 h | 32 (19.5%) | 30 (20.3%) | ||
| Preoperative infusion volume | 2.380 | 0.123 | ||
| <400 | 93 (56.7%) | 71 (48.0%) | ||
| ≥400 | 71 (43.3%) | 77 (52.0%) | ||
| Diabetes | 0.087 | 0.985 | ||
| Had | 32 (19.5%) | 12 (8.1%) | ||
| No | 132 (80.5%) | 136 (91.9%) | ||
| Hypertension | 0.347 | 0.556 | ||
| Had | 14 (8.5%) | 10 (6.8%) | ||
| No | 150 (91.5%) | 138 (93.2%) | ||
| Coronary heart disease | 1.011 | 0.315 | ||
| Had | 32 (19.5%) | 30 (20.2%) | ||
| No | 132 (80.5%) | 114 (79.8%) | ||
| Anemia | 0.798 | 0.373 | ||
| Had | 78 (47.6%) | 62 (41.9%) | ||
| No | 86 (52.4%) | 86 (58.1%) | ||
| Hypoproteinemia | 4.097 | 0.043 | ||
| Had | 83 (50.6%) | 58 (39.2%) | ||
| No | 81 (49.4%) | 90 (60.8%) | ||
| Electrolyte disturbance | 0.195 | 0.659 | ||
| Had | 85 (51.8%) | 73 (49.3%) | ||
| No | 79 (48.2%) | 75 (50.7%) | ||
| Basal HR | 113.57 | 0.000 | ||
| ≥95 | 122 (74.4%) | 21 (14.2%) | ||
| <95 | 42 (25.6%) | 127 (85.8%) | ||
| Basal SBP | 0.251 | 0.617 | ||
| ≥125 | 80 (48.8%) | 68 (45.9%) | ||
| <125 | 84 (51.2%) | 80 (54.1%) | ||
| Basal PVI | 23.043 | 0.000 | ||
| ≥19 | 100 (61.0%) | 50 (33.8%) | ||
| <19 | 64 (39.0%) | 98 (66.2%) | ||
| Basal DBP | 0.275 | 0.600 | ||
| ≥70 | 78 (47.6%) | 66 (44.6%) | ||
| <70 | 86 (52.4%) | 82 (55.4%) | ||
| Basal MAP | 0.020 | 0.888 | ||
| ≥80 | 94 (57.3%) | 86 (58.1%) | ||
| <80 | 70 (43.7%) | 62 (41.9%) |
Note: HR, heart rate; SBP, systolic blood pressure; PVI, pulse perfusion variability index; DBP, diastolic blood pressure; MAP, mean artery pressure.
Table 4.
Multivariate regression analysis
| Factor | β | SE | Wald | P | OR | 95% CI |
|---|---|---|---|---|---|---|
| Basal HR | -0.145 | 0.020 | 51.588 | 0.000 | 0.865 | 0.831-0.900 |
| Basal PVI | -0.260 | 0.065 | 15.777 | 0.000 | 0.771 | 0.679-0.877 |
| Constant | 17.861 | 2.001 | 79.641 | 0.000 | - | - |
Note: HR, heart rate; PVI, pulse perfusion variability index.
Clinical characteristics of the training set and the validation set
The characteristics of the training set and the validation set were similar to those observed in the hypotension and normotensive groups. Specifically, factors such as age, BMI, ASA level, first pregnancy time, fasting time, preoperative infusion volume, dosage of bupivacaine, sensory blockade time, highest level of anesthesia, and past medical history were comparable between the two groups (P>0.05). However, there was a significant difference in hypoproteinemia between the two groups (P<0.05) (Table 5).
Table 5.
Clinical baseline characteristics of the training set and the validation set
| Training set (n = 218) | Validation set (n = 94) | t/x2 | P | |
|---|---|---|---|---|
| Age | 1.921 | 0.166 | ||
| <35 years | 152 (69.7%) | 58 (61.7%) | ||
| ≥35 years | 66 (30.3%) | 36 (38.3%) | ||
| BMI | 0.590 | 0.443 | ||
| ≥22 | 171 (78.4%) | 70 (74.5%) | ||
| <22 | 47 (21.6%) | 24 (25.5%) | ||
| Fasting time | 0.010 | 0.921 | ||
| <16 h | 175 (80.1%) | 75 (74.5%) | ||
| ≥16 h | 43 (19.9%) | 19 (25.5%) | ||
| Preoperative infusion volume | 1.704 | 0.192 | ||
| <500 | 164 (75.2%) | 64 (68.1%) | ||
| ≥500 | 54 (24.8%) | 30 (31.9%) | ||
| Diabetes | 0.016 | 0.899 | ||
| Had | 45 (20.6%) | 20 (21.3%) | ||
| No | 173 (79.4%) | 74 (78.7%) | ||
| Hypertension | 0.456 | 0.499 | ||
| Had | 18 (8.3%) | 6 (6.4%) | ||
| No | 190 (91.7%) | 88 (93.6%) | ||
| Coronary heart disease | 0.010 | 0.921 | ||
| Had | 43 (19.9%) | 19 (20.2%) | ||
| No | 175 (80.1%) | 75 (79.8%) | ||
| Anemia | 0.702 | 0.402 | ||
| Had | 104 (47.7%) | 40 (42.6%) | ||
| No | 114 (52.3%) | 54 (57.4%) | ||
| Hypoproteinemia | 3.901 | 0.048 | ||
| Had | 110 (50.5%) | 36 (38.3%) | ||
| No | 108 (49.5%) | 58 (61.7%) | ||
| Electrolyte disturbance | 0.156 | 0.692 | ||
| Had | 112 (51.4%) | 46 (48.9%) | ||
| No | 106 (48.6%) | 48 (51.1%) | ||
| Basal HR | 3.583 | 0.060 | ||
| ≥95 | 162 (74.3%) | 79 (84%) | ||
| <95 | 56 (25.7%) | 15 (16%) | ||
| Basal SBP | 0.293 | 0.588 | ||
| ≥125 | 107 (49.1%) | 43 (45.7%) | ||
| <125 | 111 (50.9%) | 51 (54.3%) | ||
| Basal PVI | 0.686 | 0.407 | ||
| ≥19 | 133 (61.0%) | 62 (66.0%) | ||
| <19 | 85 (39.0%) | 32 (34.0%) | ||
| Basal DBP | 0.241 | 0.623 | ||
| ≥70 | 104 (47.7%) | 42 (44.7%) | ||
| <70 | 114 (52.3%) | 52 (55.3%) | ||
| Basal MAP | 0.898 | 0.343 | ||
| ≥80 | 124 (56.9%) | 48 (51.1%) | ||
| <80 | 94 (43.1%) | 46 (48.9%) |
Note: HR, heart rate; SBP, systolic blood pressure; PVI, pulse perfusion variability index; DBP, diastolic blood pressure; MAP, mean artery pressure.
Development of nomogram model
The risk predictors for hypotension after hysterectomy with spinal epidural anesthesia were included in a prediction model established using R software (version 3.6.3). The risk value for hypotension was determined by the sum of the integrals of each factor, as illustrated in Figure 2. The regression equation model based on these predictors was: logit (P) = -6.820 + 0.216 * basal HR + basal PVI * 0.312.
Figure 2.
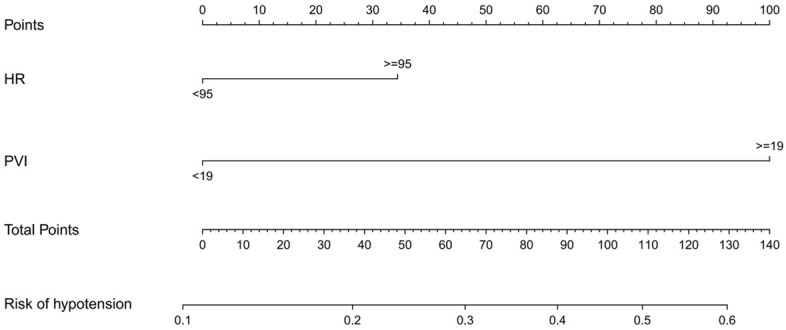
The nomogram for predicting the risk of hypotension after hysterectomy with spinal epidural anesthesia. HR, heart rate; PVI, pulse perfusion variability index.
Validation of a nomogram model
The unadjusted concordance index (C-index) for the training set was 0.892 (95% confidence interval (CI), 0.715-0.984), while for the validation set, it was 0.882 (95% CI, 0.733-0.994). These values indicate strong discriminatory ability of the model. The calibration plots for both the training set and validation set are shown in Figure 3, demonstrating the model’s accuracy in predicting hypotension risk. The area under the curve (AUC) for the training set was 0.8356 (Figure 4A), and for the validation set, it was 0.7876 (Figure 4B). These AUC values suggest that the nomogram model exhibits good discrimination and consistency in predicting the risk of hypotension in cervical cancer patients undergoing spinal epidural anesthesia.
Figure 3.

The calibration curves for predicting the risk of hypotension after hysterectomy with spinal epidural anesthesia. (A) The training set, (B) The validation set.
Figure 4.

ROC curves for the predicting the risk of hypotension after hysterectomy with spinal epidural anesthesia. (A) The training set, (B) The validation set.
Decision curve analysis (DCA)
DCA indicated that the model’s validity increased when the threshold probability for hypotension was set between 20% and 75% (Figure 5). This suggests that the model provides a clinically useful prediction within this range of threshold probabilities.
Figure 5.

Decision curve analysis for the nomogram.
ROC curve analysis
Based on the results of the regression analysis, we performed ROC curve analysis to evaluate the predictive value for hypotension following hysterectomy with spinal epidural anesthesia. The results showed that the AUC values for HR, and PVI were 0.887 and 0.735, respectively. All AUC values were greater than 0.5 (Figure 6 and Table 6), indicating that HR and PVI have good diagnostic value for predicting hypotension.
Figure 6.
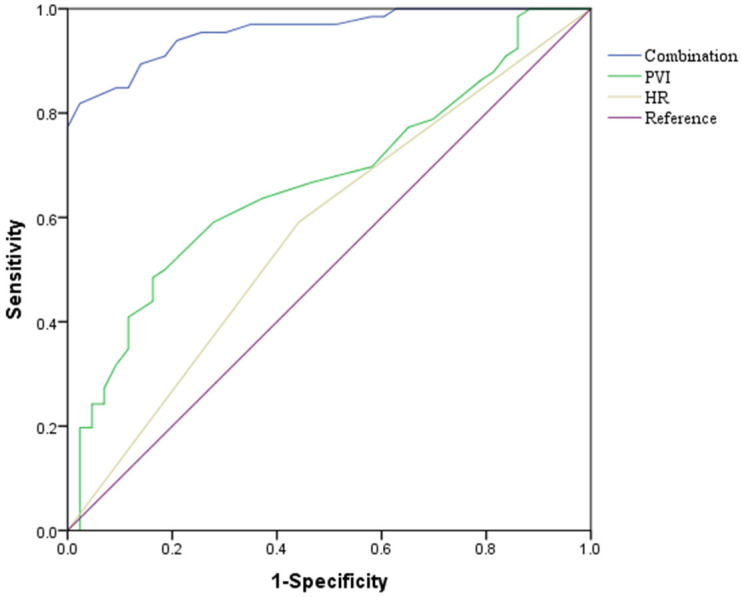
ROC curve. HR, heart rate; PVI, pulse perfusion variability index.
Table 6.
The predictive value of HR and PVI for the risk of hypotension
| Sensitivity | Specificity | AUC (95% CI) | p | Cut-off | |
|---|---|---|---|---|---|
| HR | 79.30 | 85.80 | 0.887 (0.851-0.922) | 0.000 | 94.04 |
| PVI | 34.10 | 53.52 | 0.735 (0.681-0.788) | 0.000 | 20.99 |
Note: HR, heart rate; PVI, pulse perfusion variability index.
Discussion
This study identified basal HR (≥95) (95% CI, 0.831-0.900; P = 0.000) and basal PVI (≥19) (95% CI, 0.679-0.877; P = 0.000) as independent risk factors for hypotension following hysterectomy with spinal epidural anesthesia. We developed a predictive nomogram model to estimate the risk of hypotension in these patients. The calibration plot showed that the nomogram model demonstrated good accuracy and clinical applicability, supported by a high C-index and AUC. Additionally, the DCA confirmed the clinical usefulness of the nomogram in predicting hypotension risk. This model facilitates early identification of high-risk patients, thereby enhancing preventive measures and improving patient outcomes.
Multivariate logistic regression analysis revealed that the risk of hypotension after hysterectomy with spinal epidural anesthesia was 1.916 times higher in patients with a basal HR greater than 95 beats per minute compared to those with a basal HR between 60 and 95 beats per minute (P<0.05). This indicates that a higher basal HR is an independent risk factor for hypotension following the procedure. A faster HR typically reflects increased sympathetic nervous system activity. Consequently, women with faster HRs may rely more on sympathetic tone to maintain blood pressure before anesthesia [20,21]. Conversely, hypotension induced by spinal anesthesia can affect the cardiovascular system through sympathetic blockade. Research has shown a correlation between changes in basal HR and the occurrence of hypotension, with elevated HR associated with increased risk [22].
During a hysterectomy with spinal epidural anesthesia, the body is already under stress from the surgical procedure itself. An elevated HR in this context can exacerbate the drop in blood pressure commonly observed after anesthesia is administered. This increased risk of postoperative hypotension can lead to symptoms such as dizziness, lightheadedness, and even fainting [23]. Therefore, it is crucial for healthcare providers to closely monitor the patient’s HR throughout the surgery and take appropriate measures if it becomes elevated. This may include administering medications to stabilize HR and blood pressure, as well as providing fluids to enhance blood volume and improve circulation. By addressing the elevated HR, healthcare providers can help mitigate the risk of postoperative hypotension and support a smoother recovery for the patient.
Hypotension resulting from spinal anesthesia primarily occurs due to a reduction in peripheral vascular resistance following sympathetic blockade [24]. Spinal anesthesia induces vasodilation at the site of the block, leading to a decrease in MAP [25-27]. Consequently, factors such as preoperative sympathetic tone [28-30] and intravascular volume can affect the extent of hypotension. In this diagnostic evaluation, HR and PVI were used together. HR reflects intravascular volume, with an HR ≥95 indicating high sympathetic activity, while PVI reflects sympathetic tone, with a PVI ≥19 suggesting insufficient intravascular volume. Patients exhibiting either of these conditions are considered at high risk for hypotension following hysterectomy with spinal epidural anesthesia.
The advantages of monitoring HR and PVI compared to supine stress tests and transinfrared cerebral SpO2 include their low cost, noninvasiveness, and ease of use. These features make HR and PVI practical for routine clinical application, enabling effective screening of patients at high risk for post-spinal anesthesia hypotension. This approach allows for more targeted administration of vasoactive drugs to prevent hypotension while minimizing the risk of developing hypertension.
Our findings indicate that hypotension is likely to occur in cervical cancer patients undergoing spinal epidural anesthesia if their predicted risk value (ŷ) from the model exceeds 0.6, and they have a (HR) greater than 95 beats per minute and a PVI of 19 or higher. Conversely, hypotension is unlikely to occur in patients if their predicted risk value (ŷ) is less than 0.1, and they have an HR less than 95 beats per minute and a PVI below 19.
This study has several limitations. First, being a retrospective study, it is subject to inherent biases and limitations. Additionally, since the research population is derived from a single hospital, the generalizability of the prediction model to other populations remains uncertain. Thus, further validation through multicenter, large-scale studies is needed. Second, the underlying mechanisms explaining the prognostic effect of the nomogram require further investigation to fully understand its predictive accuracy and applicability.
In conclusion, our study identified basal HR ≥95 beats/min and PVI ≥19% as independent risk predictors for hypotension following hysterectomy with spinal epidural anesthesia. Additionally, we developed a predictive nomogram model that demonstrates good accuracy and clinical applicability. This model can assist in assessing the risk of hypotension in patients undergoing hysterectomy with spinal epidural anesthesia, potentially improving risk management and patient outcomes.
Disclosure of conflict of interest
None.
References
- 1.Wang L, Chang R, Chen X. Impact of intraspinal nerve block anesthesia on intrapartum fever and the neonate. Evid Based Complement Alternat Med. 2022;2022:2600755. doi: 10.1155/2022/2600755. [DOI] [PMC free article] [PubMed] [Google Scholar] [Retracted]
- 2.Shimada T, Cohen B, Shah K, Mosteller L, Bravo M, Ince I, Esa WAS, Cywinski J, Sessler DI, Ruetzler K, Turan A. Associations between intraoperative and post-anesthesia care unit hypotension and surgical ward hypotension. J Clin Anesth. 2021;75:110495. doi: 10.1016/j.jclinane.2021.110495. [DOI] [PubMed] [Google Scholar]
- 3.Lato K, Bekes I, Widschwendter P, Friedl TWP, Janni W, Reister F, Froeba G, Friebe-Hoffmann U. Hypotension due to spinal anesthesia influences fetal circulation in primary caesarean sections. Arch Gynecol Obstet. 2018;297:667–674. doi: 10.1007/s00404-017-4641-0. [DOI] [PubMed] [Google Scholar]
- 4.Humphries A, Mirjalili SA, Tarr GP, Thompson JMD, Stone P. The effect of supine positioning on maternal hemodynamics during late pregnancy. J Matern Fetal Neonatal Med. 2019;32:3923–3930. doi: 10.1080/14767058.2018.1478958. [DOI] [PubMed] [Google Scholar]
- 5.Hauptman PJ, Schwartz PJ, Gold MR, Borggrefe M, Van Veldhuisen DJ, Starling RC, Mann DL. Rationale and study design of the increase of vagal tone in heart failure study: INOVATE-HF. Am Heart J. 2012;163:954–962. e1. doi: 10.1016/j.ahj.2012.03.021. [DOI] [PubMed] [Google Scholar]
- 6.Keskin K, Çiftçi S, Öncü J, Melike Doğan G, Çetinkal G, Sezai Yıldız S, Sığırcı S, Orta Kılıçkesmez K. Orthostatic hypotension and age-related sarcopenia. Turk J Phys Med Rehabil. 2021;67:25–31. doi: 10.5606/tftrd.2021.5461. [DOI] [PMC free article] [PubMed] [Google Scholar]
- 7.Tebbani F, Oulamara H, Agli A. Factors associated with low maternal weight gain during pregnancy. Rev Epidemiol Sante Publique. 2019;67:253–260. doi: 10.1016/j.respe.2019.03.121. [DOI] [PubMed] [Google Scholar]
- 8.Yonezaki S, Nagasaki K, Kobayashi H. Ultrasonographic findings in fat embolism syndrome. Clin Pract Cases Emerg Med. 2021;5:263–264. doi: 10.5811/cpcem.2021.2.51270. [DOI] [PMC free article] [PubMed] [Google Scholar]
- 9.Xiao J, Zhang C, Zhang Y, Zhao F, Yang J, Li G, Zhou X. Ultrasonic manifestations and clinical analysis of 25 uterine rupture cases. J Obstet Gynaecol Res. 2021;47:1397–1408. doi: 10.1111/jog.14666. [DOI] [PubMed] [Google Scholar]
- 10.Sastry R, Sufianov R, Laviv Y, Young BC, Rojas R, Bhadelia R, Boone MD, Kasper EM. Chiari I malformation and pregnancy: a comprehensive review of the literature to address common questions and to guide management. Acta Neurochir (Wien) 2020;162:1565–1573. doi: 10.1007/s00701-020-04308-7. [DOI] [PubMed] [Google Scholar]
- 11.Kawarazaki W, Fujita T. Kidney and epigenetic mechanisms of salt-sensitive hypertension. Nat Rev Nephrol. 2021;17:350–363. doi: 10.1038/s41581-021-00399-2. [DOI] [PubMed] [Google Scholar]
- 12.Wiseman D, McDonald JD, Patel D, Kebebew E, Pacak K, Nilubol N. Epidural anesthesia and hypotension in pheochromocytoma and paraganglioma. Endocr Relat Cancer. 2020;27:519–527. doi: 10.1530/ERC-20-0139. [DOI] [PMC free article] [PubMed] [Google Scholar]
- 13.Kuok CH, Huang CH, Tsai PS, Ko YP, Lee WS, Hsu YW, Hung FY. Preoperative measurement of maternal abdominal circumference relates the initial sensory block level of spinal anesthesia for cesarean section: an observational study. Taiwan J Obstet Gynecol. 2016;55:810–814. doi: 10.1016/j.tjog.2015.04.009. [DOI] [PubMed] [Google Scholar]
- 14.Liu T, Xu C, Wang M, Niu Z, Qi D. Reliability of pleth variability index in predicting preload responsiveness of mechanically ventilated patients under various conditions: a systematic review and meta-analysis. BMC Anesthesiol. 2019;19:67. doi: 10.1186/s12871-019-0744-4. [DOI] [PMC free article] [PubMed] [Google Scholar]
- 15.Chu H, Wang Y, Sun Y, Wang G. Accuracy of pleth variability index to predict fluid responsiveness in mechanically ventilated patients: a systematic review and meta-analysis. J Clin Monit Comput. 2016;30:265–274. doi: 10.1007/s10877-015-9742-3. [DOI] [PubMed] [Google Scholar]
- 16.Sano H, Seo J, Wightman P, Cave NJ, Gieseg MA, Johnson CB, Chambers P. Evaluation of pulse pressure variation and pleth variability index to predict fluid responsiveness in mechanically ventilated isoflurane-anesthetized dogs. J Vet Emerg Crit Care (San Antonio) 2018;28:301–309. doi: 10.1111/vec.12728. [DOI] [PubMed] [Google Scholar]
- 17.Akuji M. Cardiac arrest following the use of hydrogen peroxide’ time to reconsider its use. Anaesthesia. 2014;69:11–88. [Google Scholar]
- 18.Frolich MA. Obstetric anesthesia. Morgan & Mikhail’s Clinical Anesthesiology. 2013;2013:843–904. [Google Scholar]
- 19.Rivasi G, Fedorowski A. Hypertension, hypotension and syncope. Minerva Med. 2022;113:251–262. doi: 10.23736/S0026-4806.21.07562-5. [DOI] [PubMed] [Google Scholar]
- 20.Coss RG, Keller CM. Transient decreases in blood pressure and heart rate with increased subjective level of relaxation while viewing water compared with adjacent ground. J Environ Psychol. 2022;81:101794. [Google Scholar]
- 21.Zawadka-Kunikowska M, Rzepiński Ł, Tafil-Klawe M, Klawe JJ, Zalewski P, Słomko J. Association of cardiac autonomic responses with clinical outcomes of myasthenia gravis: Short-term analysis of the heart-rate and blood pressure variability. J Clin Med. 2022;11:3697. doi: 10.3390/jcm11133697. [DOI] [PMC free article] [PubMed] [Google Scholar]
- 22.Li L, Li H, He L, Chen H, Li Y. Study on the relationship between orthostatic hypotension and heart rate variability, pulse wave velocity index, and frailty index in the elderly: a retrospective observational study. Front Cardiovasc Med. 2020;7:603957. doi: 10.3389/fcvm.2020.603957. [DOI] [PMC free article] [PubMed] [Google Scholar]
- 23.Zheng Q, Xie W, Lückemeyer DD, Lay M, Wang XW, Dong X, Limjunyawong N, Ye Y, Zhou FQ, Strong JA, Zhang JM, Dong X. Synchronized cluster firing, a distinct form of sensory neuron activation, drives spontaneous pain. Neuron. 2022;110:209–220. e6. doi: 10.1016/j.neuron.2021.10.019. [DOI] [PMC free article] [PubMed] [Google Scholar]
- 24.Wei H, Tu HK, Yao SL, Wu X. Regional tissue oxygen saturation as a predictor of post-spinal anesthesia hypotension for cesarean delivery. Chin Med J (Engl) 2021;134:2353–2355. doi: 10.1097/CM9.0000000000001647. [DOI] [PMC free article] [PubMed] [Google Scholar]
- 25.Tatikonda CM, Rajappa GC, Rath P, Abbas M, Madhapura VS, Gopal NV. Effect of intravenous ondansetron on spinal anesthesia-induced hypotension and bradycardia: a randomized controlled double-blinded study. Anesth Essays Res. 2019;13:340–346. doi: 10.4103/aer.AER_22_19. [DOI] [PMC free article] [PubMed] [Google Scholar]
- 26.Vats A, Marbaniang MJ. The principles and conduct of anaesthesia. Surg. 2019;37:441–449. [Google Scholar]
- 27.Kim E, Cho MR, Byun SH, A Lim J, Chae S, Choi WK, Kim I, Kim J. Sympathetic predominance before tourniquet deflation is associated with a reduction in arterial blood pressure after tourniquet deflation during total knee arthroplasty. Physiol Res. 2021;70:401–412. doi: 10.33549/physiolres.934639. [DOI] [PMC free article] [PubMed] [Google Scholar]
- 28.Yeh PH, Chang YJ, Tsai SE. Observation of hemodynamic parameters using a non-invasive cardiac output monitor system to identify predictive indicators for post-spinal anesthesia hypotension in parturients undergoing cesarean section. Exp Ther Med. 2020;20:168. doi: 10.3892/etm.2020.9298. [DOI] [PMC free article] [PubMed] [Google Scholar]
- 29.Kim HJ, Choi YS, Kim SH, Lee W, Kwon JY, Kim DH. Predictability of preoperative carotid artery-corrected flow time for hypotension after spinal anaesthesia in patients undergoing caesarean section: a prospective observational study. Eur J Anaesthesiol. 2021;38:394–401. doi: 10.1097/EJA.0000000000001376. [DOI] [PubMed] [Google Scholar]
- 30.Nasution MP, Fitriati M, Veterini AS, Kriswidyatomo P, Utariani A. Preoperative perfusion index as a predictor of post-anaesthetic shivering in caesarean section with spinal anaesthesia. J Perioper Pract. 2022;32:108–114. doi: 10.1177/1750458920979263. [DOI] [PubMed] [Google Scholar]