Abstract
Cancer of unknown primary (CUP) is a type of cancer that cannot be traced back to its primary site and accounts for 3–5% of all cancers. Established targeted therapies are lacking for CUP, leading to generally poor outcomes. We developed OncoNPC, a machine learning classifier trained on targeted next-generation sequencing data from 36,445 tumors across 22 cancer types from three institutions. OncoNPC achieved a weighted F1 score of 0.942 for high confidence predictions (≥ 0.9) on held-out tumor samples, which made up 65.2% of all the held-out samples. When applied to 971 CUP tumors collected at the Dana-Farber Cancer Institute, OncoNPC predicted primary cancer types with high confidence in 41.2% of the tumors. OncoNPC also identified CUP subgroups with significantly higher polygenic germline risk for the predicted cancer types and significantly different survival outcomes. Importantly, CUP patients who received first palliative intent treatments concordant with their OncoNPC-predicted cancers had significantly better outcomes (H.R. 0.348, 95% C.I. 0.210 – 0.570, p-value 2.32×10⁻⁵). Furthermore, OncoNPC enabled a 2.2-fold increase in CUP patients who could have received genomically-guided therapies. OncoNPC thus provides evidence of distinct CUP subgroups and offers the potential for clinical decision support for managing patients with CUP.
Introduction
When a standardized diagnostic work-up, including radiology and pathology assessments, fails to locate the primary site of a metastatic cancer, it is diagnosed as a cancer of unknown primary (CUP). CUP represents about 3–5% of all cancers worldwide [1] and is characterized by aggressive progression and poor prognosis (survival of 6 to 16 months [2]). The hidden nature of the primary sites limits treatment options since clinical responses to some treatments are known to vary based on patients’ tumor types (e.g., identical BRAF V600 mutations targetable in melanoma but not in colorectal cancer[3]). Emerging cancer treatments targeting actionable molecular alterations are typically developed for specific cancer types (e.g., HER2 in breast cancer and EGFR mutation or ALK/ROS1 rearrangement in Non-small cell lung cancer [4]), and are thus inaccessible to patients with CUP. Accurately identifying the latent primary site for CUP tumors and demonstrating clinical benefit from site-specific therapies may thus open many existing treatment options for patients with CUP.
Pathology assessment plays a key role in determining primary cancer types of malignant tumors based on immunohistochemistry (IHC) results as well as tumor morphology and clinical findings; however, pathological diagnosis can be challenging for highly metastatic or poorly differentiated tumors. For known cancer types, prior studies showed that an IHC-based diagnostic work-up correctly identified 77 – 86% of primary tumors, which further decreased to 60 – 71% for metastatic tumors [5]. For patients with CUP, IHC results suggestive of a single primary diagnosis account for only 25% of tumors [2]. The subjective nature of pathological interpretation and guidelines, as well as the variability in IHC staining techniques across institutions thus makes it challenging to establish consistent protocols for CUP diagnosis [6].
Molecular tumor profiling has been proposed as an alternative for primary site classification, potentially for CUP tumors, due to its quantitative nature and high accuracy on tumors with known cancer types [7–12]. Such tools rely on microarray DNA methylation [7], whole genome sequencing (WGS) [8, 11], RNA sequencing data [10], or gene expression profiling [12, 13]. However, despite their effectiveness, these sequencing techniques have not been integrated into the standard of care and are often cost-prohibitive. In a recent study by Penson et al. [9], it was demonstrated that accurate primary cancer type classifications could be made from next generation sequencing (NGS) of targeted panels now routinely collected at many cancer centers and applicable to hundreds of thousands of tumors [14]. However, its clinical utility in diagnosing and aiding treatment for patients with CUP was not systematically investigated.
Several recent studies have investigated the potential clinical benefit of molecular CUP classification, in non-randomized prospective studies [15–17] as well as the randomized clinical trials [18]. These trials have often struggled to recruit a sufficient number of representative patients and explore the full range of available therapies. A recent randomized phase II trial [18] did not find significant improvement in 1-year survival for the treatment group receiving site-specific therapy guided by molecular profiling. However, this study was limited by a small number of patients (n = 101) recruited over 7 years, with few common solid tumor types and well-established therapies [19]. Assessing the clinical benefits of molecular CUP classification thus poses both an opportunity for precision medicine and a major challenge for conventional randomized studies.
Retrospective EHR data, despite potential biases, can capture a larger and more heterogeneous patient population compared to prospective trials. When paired with tumor sequencing, this data can offer insights into the molecular workings of CUP tumors and how they relate to patient outcomes. As panel sequencing is often part of the standard of care, such insights also have the potential to assist diagnostic efforts and clinical management within existing molecular workflows. Here, we utilized multi-center, Next Generation Sequencing (NGS) targeted panel sequencing data from 36,445 tumor samples with known primary cancers to train and evaluate a machine learning classifier predicting a primary cancer type of a given tumor sample. We applied this classifier, named OncoNPC (Oncology NGS-based Primary cancer type Classifier), to 971 patients with CUP with clinical follow up at the Dana-Farber Cancer Institute (DFCI). Using the OncoNPC cancer type predictions, we identified CUP subgroups that shared specific characteristics with their corresponding predicted primaries including significant differences in clinical outcomes and elevated germline risk. Furthermore, we showed that site-specific treatments concordant with the OncoNPC cancer type predictions led to longer survival than those discordant with the cancer type predictions. Finally, OncoNPC predictions yielded a 2.2-fold increase in the number of CUP patients who could have received genomically-guided therapies. Our findings suggest that many CUP tumors can be classified into meaningful subgroups with the potential to aid clinical decision making.
Results
OncoNPC accurately classifies 22 known cancer types
We developed OncoNPC (Oncology NGS-based Primary cancer type Classifier), a molecular cancer type classifier trained on multicenter targeted panel sequencing data (Fig. 1). OncoNPC utilized somatic alterations including mutations (single nucleotide variants and indels), mutational signatures, copy number alterations, as well as patient age at the time of sequencing and sex to jointly predict cancer type using a XGBoost algorithm [20] (see Methods and Supplementary Note 1 for more details on choosing input features). OncoNPC was trained and validated on the processed data consisting of 29,176 primary and metastasis tumor samples from 22 known cancer types collected at the DFCI, MSK, and VICC (see Table 1 for details regarding patient demographics, modeled cancer types, and their corresponding abbreviations). Across all 22 cancer types, OncoNPC achieved a weighted F1 score of 0.784 on the held-out test tumor samples consisting of 7,289 tumor samples (weighted precision and recall: 0.789 and 0.791, respectively). Across 13 cancer groups (grouped by sites and treatment options; see Table 1), OncoNPC achieved an overall weighted F1 score of 0.806 (weighted precision and recall: 0.810 and 0.809, respectively). Despite the evident class imbalance across cancer types, OncoNPC showed well-balanced precision across the cancer types (Fig. 2a) and cancer groups (Fig. 2b; see Extended Data Fig. 1 for more performance details).
Figure 1: Overview of model development and analysis workflow.
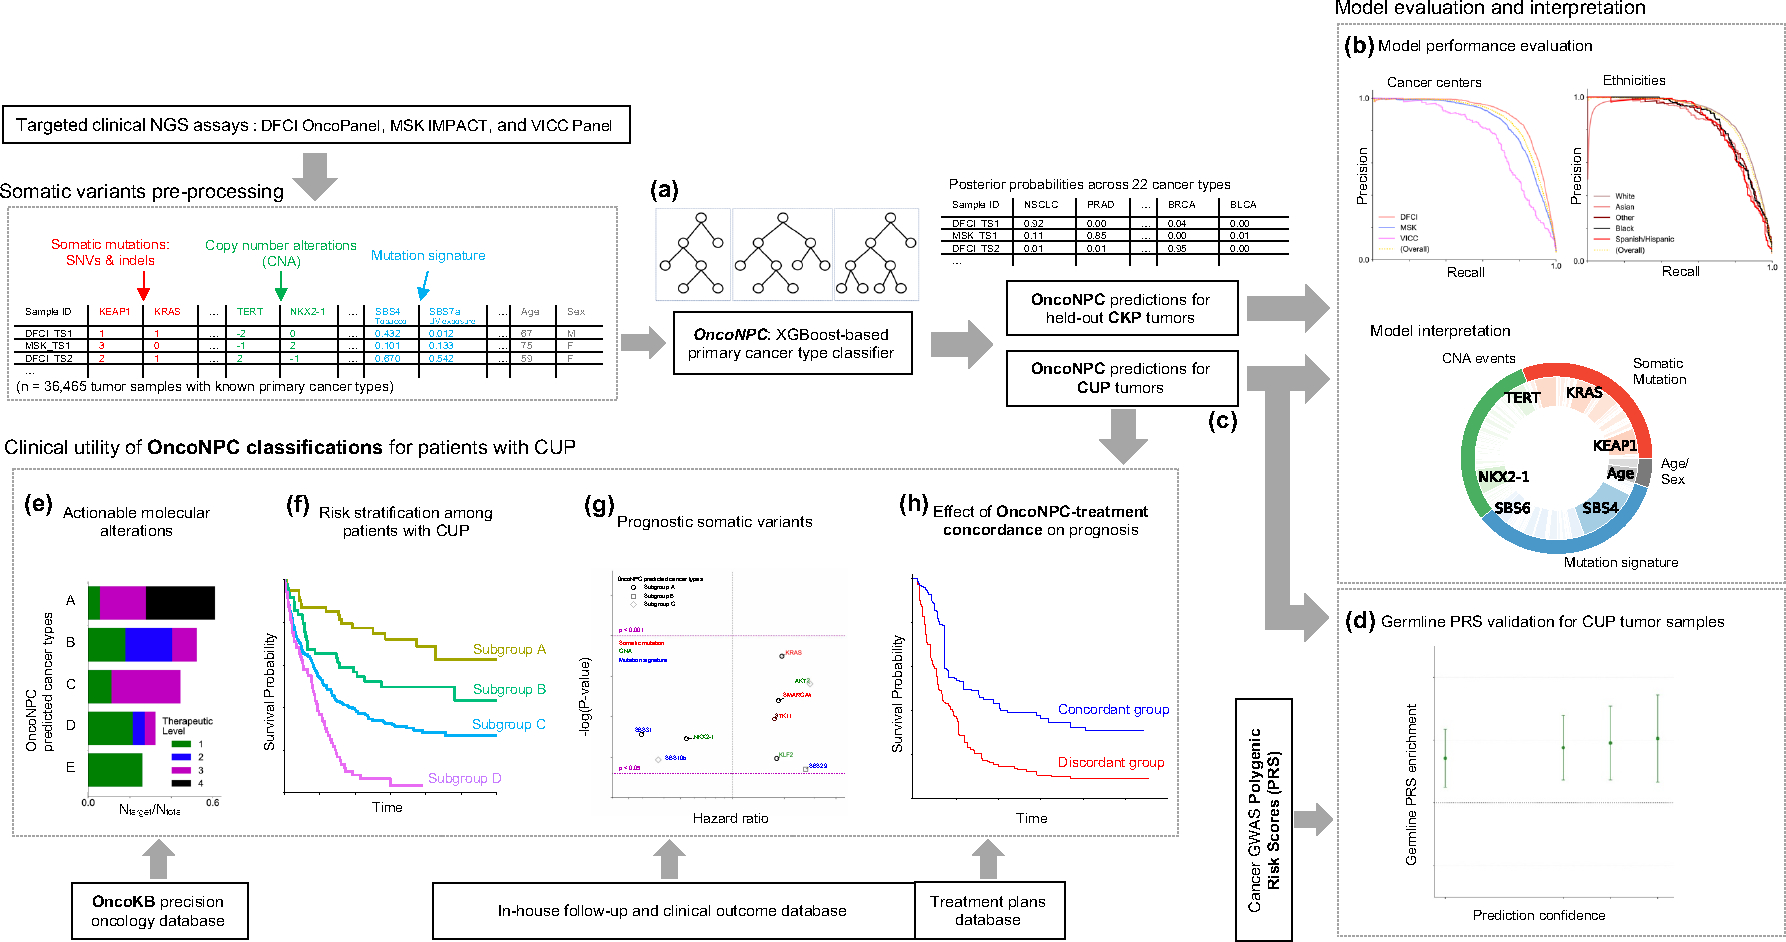
(a) OncoNPC, a XGBoost-based classifier, was trained and evaluated using 36,729 Cancers of Known Primary (CKP) tumor samples across 22 cancer types collected from three different cancer centers. (b) OncoNPC performance was evaluated on the held-out tumor samples (n = 7,289). (c) OncoNPC was applied to 971 CUP tumor samples at a single institution to predict primary cancer types. OncoNPC predicted CUP subgroups were then investigated for association with: (d) elevated germline risk, (e) actionable molecular alterations, (f) overall survival, and (g) prognostic somatic features. (h) A subset of CUP patients with detailed treatment data were evaluated for treatment-specific outcomes.
Table 1:
Demographic information of the patients and tumor samples across DFCI, MSK, and VICC.
| DFCI | MSK | VICC | DFCI CUP | ||
|---|---|---|---|---|---|
|
| |||||
| Number of patients | 18,106 | 15,151 | 1,310 | 962 | |
| Patients age at sequence (95 % C.I.) | 60.7 (60.5 – 60.9) | 60.2 (60.0 – 60.4) | 58.3 (57.6 – 59.0) | 61.9 (61.1 – 62.7) | |
| Sex; male-female ratio | 43.8 – 56.2 | 43.5 – 56.5 | 44.5 – 55.5 | 50.0 – 50.0 | |
|
| |||||
| Patients ethnicity (proportion %) | |||||
|
| |||||
| White | 16,105 (88.9 %) | 11,575 (76.4 %) | 1,089 (83.1 %) | 853 (88.7 %) | |
| Black | 538 (3.0 %) | 866 (5.7 %) | 72 (5.5 %) | 38 (4.0 %) | |
| Asian | 554 (3.1 %) | 956 (6.3 %) | 17 (1.3 %) | 34 (3.5 %) | |
| Hispanic | 379 (2.1 %) | 744 (4.9 %) | 14 (1.1 %) | 15 (1.6 %) | |
| Others | 530 (2.9 %) | 1010 (6.7 %) | 118 (9.0 %) | 22 (2.2 %) | |
|
| |||||
| Sequenced Tumor Samples | |||||
|
| |||||
| Total number of samples | 18,816 | 16,294 | 1,335 | 971 | |
|
| |||||
| Panel version (proportion %; 95% sequence date range) | |||||
|
| |||||
| v1 | OncoPanel v1 1,924 (10.2 %; 2013–8–20 – 2014–8–17) | MSK-IMPACT341 1,803 (11.1 %; Not available) | VICC-01-T5A 307 (23.0 %; Not available) | OncoPanel v1 47 (4.8 %; 2013–9–8 – 2014–8–12) | |
| v2 | OncoPanel v2 5,304 (28.2 %; 2014–9–28 – 2016–10–5) | MSK-IMPACT410 6,917 (42.5 %; Not available) | VICC-01-T7 1,028 (77.0 %; Not available) | OncoPanel v2 203 (20.9 %; 2014–11–5 – 2016–10–5) | |
| v3 | OncoPanel v3 11,588 (61.6 %; 2016–11–11 – 2021–1–6) | MSK-IMPACT468 7,574 (46.5 %; Not available) | OncoPanel v3 721 (74.3 %; 2016–12–14 – 2020–12–23) | ||
|
| |||||
| Biopsy site type | |||||
|
| |||||
| Primary | 11,662 (62.0 %) | 9,576 (58.8 %) | 622 (46.6 %) | ||
| Metastatic recurrence | 5,737 (30.5 %) | 6,718 (41.2 %) | 637 (47.7 %) | ||
| Local recurrence | 673 (3.6 %) | Not available | 64 (4.8 %) | ||
| Unspecified/others | 744 (4.0 %) | Not available | 12 (0.9 %) | ||
|
| |||||
| Cancer group | Cancer type | Predicted cancer type | |||
|
| |||||
| Lung (Thoracic) | Non-Small Cell Lung Cancer (NSCLC) | 3,489 (18.5 %) | 3,183 (19.5 %) | 137 (10.3 %) | 280 (28.8 %) |
| Pleural Mesothelioma (PLMESO) | 258 (1.4 %) | 118 (0.7 %) | 2 (0.1 %) | 9 (0.9 %) | |
|
| |||||
| Invasive Breast Carcinoma (BRCA) | 2,558 (13.6 %) | 3,113 (19.1 %) | 274 (20.5 %) | 85 (8.8 %) | |
|
| |||||
| Colorectal Adenocarcinoma (COADREAD) | 2,525 (13.4 %) | 1,919 (11.8 %) | 232 (17.4 %) | 63 (6.5 %) | |
|
| |||||
| Upper Gastrointestinal | Esophagogastric Adenocarcinoma (EGC) | 988 (5.3 %) | 495 (3.0 %) | 59 (4.4 %) | 69 (7.1 %) |
| Pancreatic Adenocarcinoma (PAAD) | 772 (4.1 %) | 980 (6.0 %) | 53 (4.0 %) | 85 (8.8 %) | |
| Cholangiocarcinoma (CHOL) | 241 (1.3 %) | 338 (2.1 %) | 44 (3.3 %) | 33 (3.4 %) | |
|
| |||||
| Neuro | Diffuse Glioma (DIFG) | 2,041 (10.8 %) | 1,069 (6.6 %) | 47 (3.5 %) | 25 (2.6 %) |
| Meningothelial Tumor (MNGT) | 179 (1.0 %) | 42 (0.3 %) | 15 (1.1 %) | 4 (0.4 %) | |
|
| |||||
| Gynecologic | Ovarian Epithelial Tumor (OVT) | 1,213 (6.4 %) | 525 (3.2 %) | 81 (6.1 %) | 58 (6.0 %) |
| Endometrial Carcinoma (UCEC) | 703 (3.7 %) | 703 (4.3 %) | 34 (2.5 %) | 18 (1.9 %) | |
|
| |||||
| Urothelial | Renal Cell Carcinoma (RCC) | 457 (2.4 %) | 497 (3.1 %) | 39 (2.9 %) | 24 (2.5 %) |
| Bladder Urothelial Carcinoma (BLCA) | 550 (2.9 %) | 505 (3.1 %) | 41 (3.1 %) | 21 (2.2 %) | |
|
| |||||
| Prostate Adenocarcinoma (PRAD) | 601 (3.2 %) | 1,222 (7.5 %) | 27 (2.0 %) | 27 (2.8 %) | |
|
| |||||
| Melanoma (MEL) | 729 (3.9 %) | 619 (3.8 %) | 187 (14.0 %) | 43 (4.4 %) | |
|
| |||||
| Head and Neck | Head and Neck Squamous Cell Carcinoma (HNSCC) | 473 (2.5 %) | 285 (1.7 %) | 20 (1.5 %) | 52 (5.4 %) |
| Well-Differentiated Thyroid Cancer (WDTC) | 166 (0.9 %) | 166 (1.0 %) | 8 (0.6 %) | 1 (0.1 %) | |
|
| |||||
| Neuroendocrine | Gastrointestinal Neuroendocrine Tumors (GINET) | 219 (1.2 %) | 76 (0.5 %) | 18 (1.3 %) | 46 (4.7 %) |
| Pancreatic Neuroendocrine Tumor (PANET) | 121 (0.6 %) | 133 (0.8 %) | 12 (0.9 %) | 23 (2.4 %) | |
|
| |||||
| Gastrointestinal Stromal Tumor (GIST) | 273 (1.5 %) | 217 (1.3 %) | 5 (0.4 %) | 3 (0.3 %) | |
|
| |||||
| Hematologic | Acute Myeloid Leukemia (AML) | 150 (0.8 %) | 1 (0.0 %) | 0 (0.0 %) | 1 (0.1 %) |
| Non-Hodgkin Lymphoma (NHL) | 110 (0.6 %) | 88 (0.5 %) | 0 (0.0 %) | 1 (0.1 %) | |
Figure 2: Cancer type classification performance of OncoNPC.
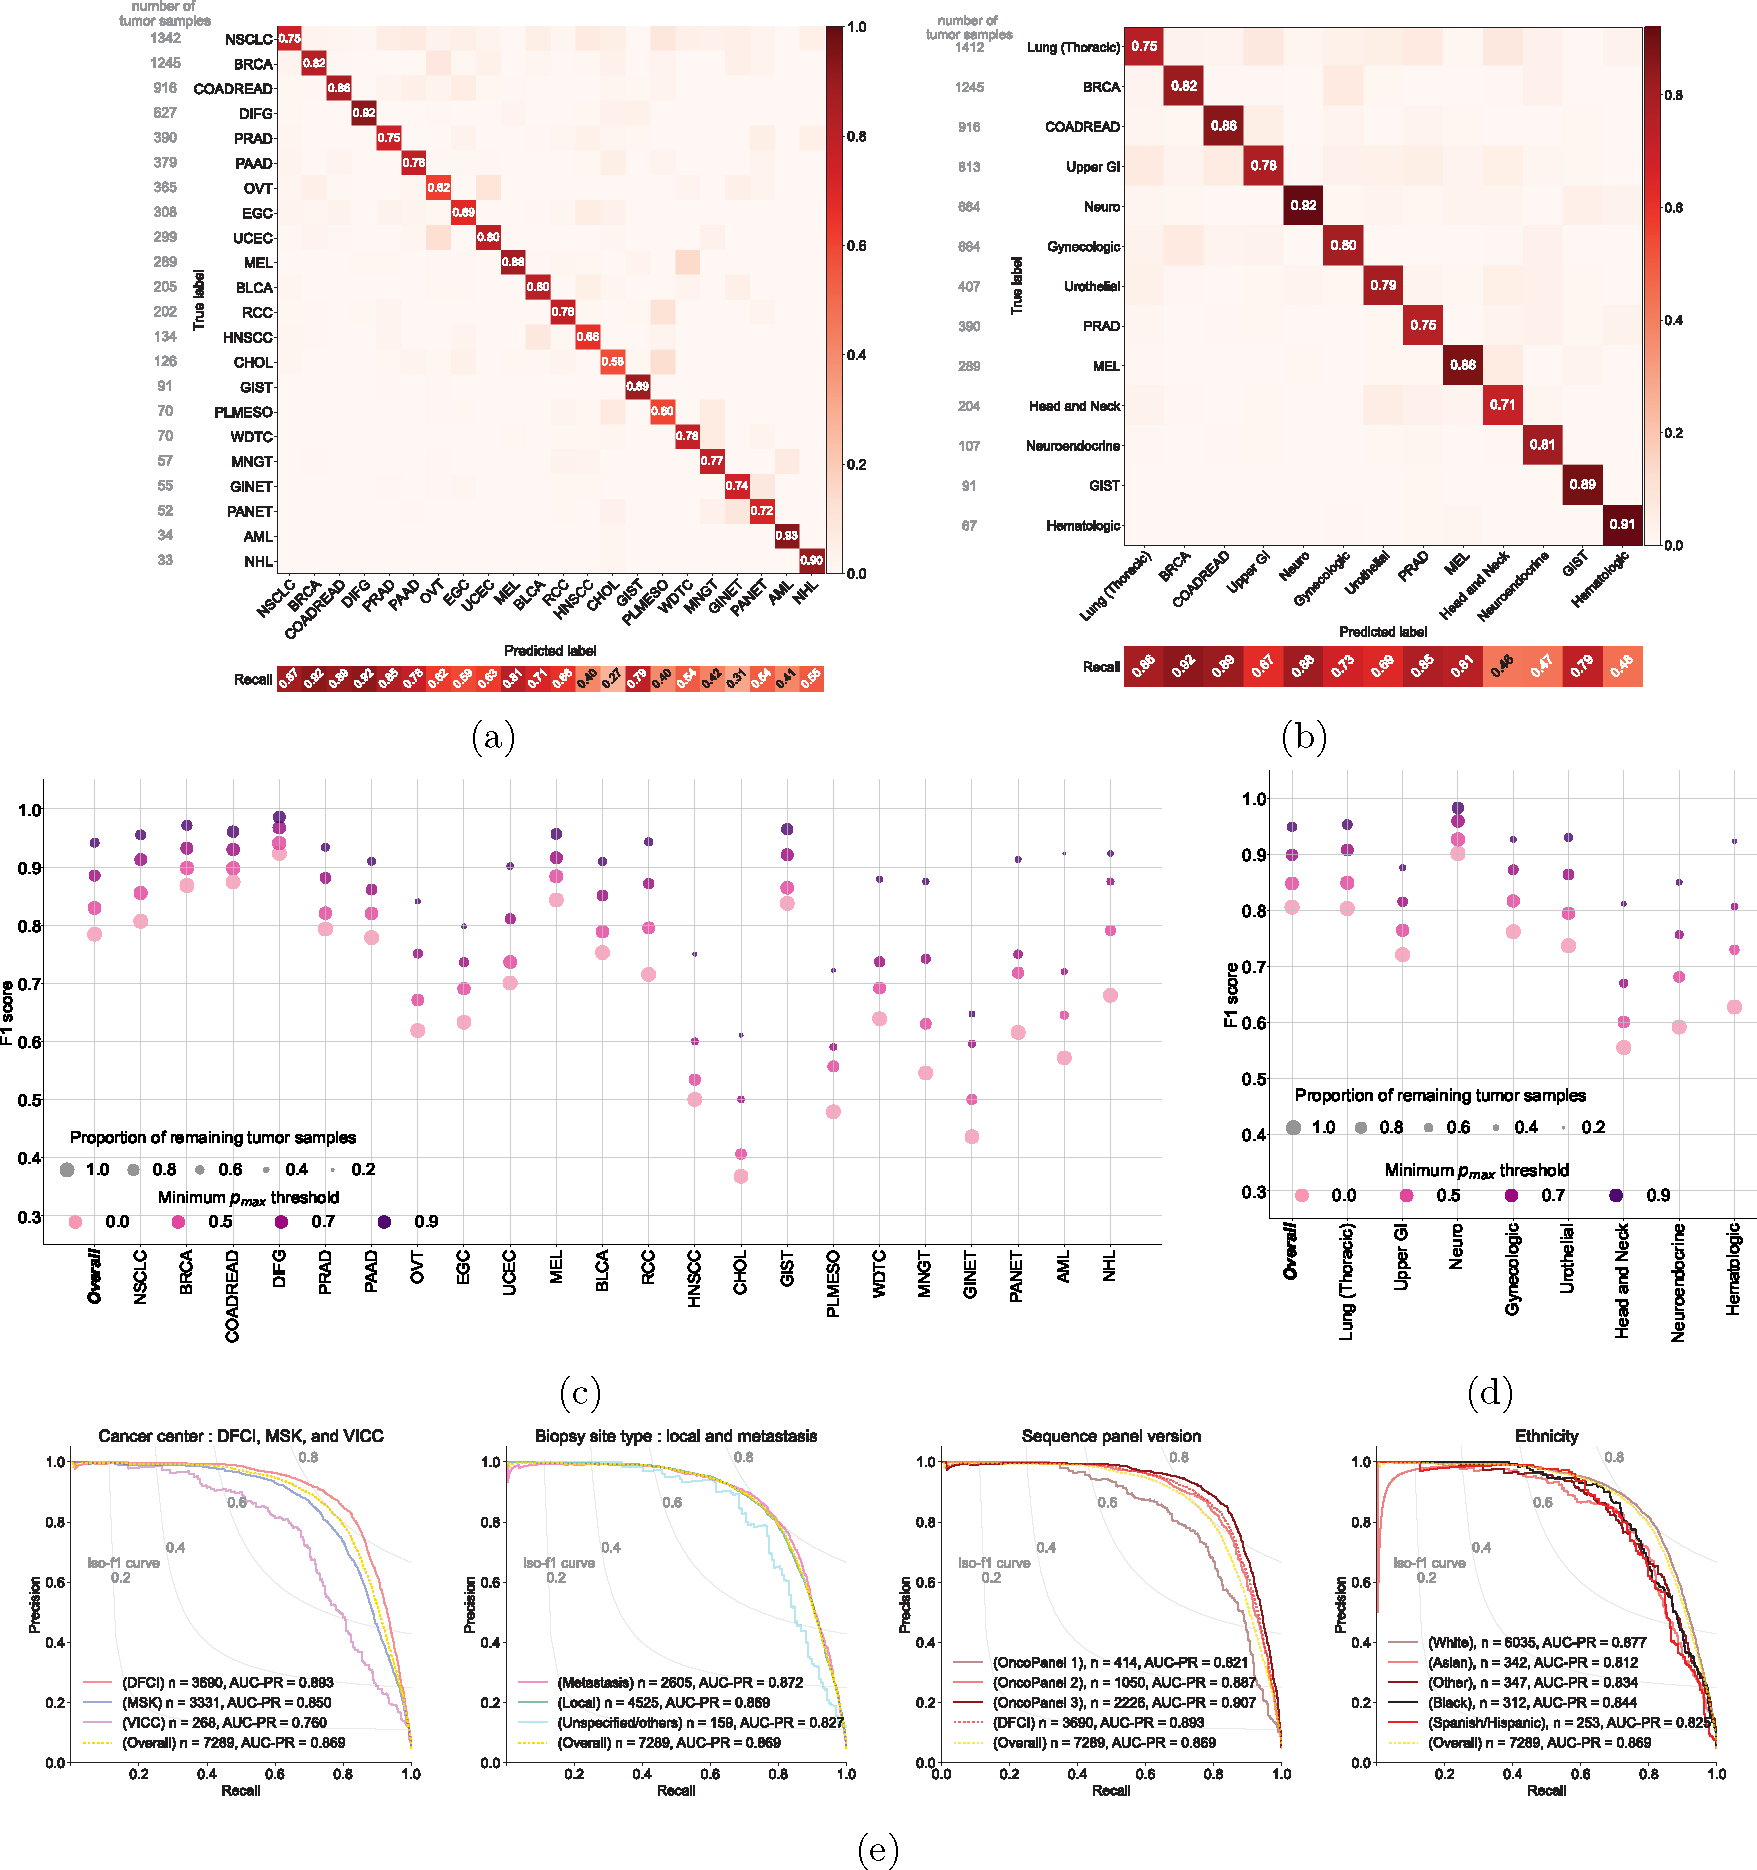
The normalized confusion matrix of OncoNPC classification performance on the held-out test set (n = 7,289) for (a) 22 detailed cancer types and (b) 13 cancer groups (see Table 1). Each confusion matrix displays precision for each cancer type or group on its diagonal. Below the matrix, the recall for each cancer type or group is shown, and the sample size is displayed to the left of the matrix for reference. The performance of OncoNPC in F1 score on the test set across cancer types (c) and groups (d) at 4 different pmax (i.e., prediction confidence) thresholds. Each dot size is scaled by the proportion of tumor samples retained. Note that in (d), we only considered cancer groups that have more than one cancer type. Overall F1 scores were weighted according to the number of confirmed cases across cancer types and cancer groups, respectively. (e) The precision-recall curves showing OncoNPC’s performance on the test set when grouped by cancer center, biopsy site type, sequence panel version, and ethnicity. The yellow dotted curve represents the baseline performance across the entire test set.
We evaluated the performance of OncoNPC at four distinct prediction confidence levels based on pmax (i.e, the maximum predictive probability across 22 cancer types): 0.0 (encompassing all samples), 0.5, 0.7, and 0.9 (see Supplementary Note 2 for an alternative approach using a cancer type-specific threshold). Applying a threshold based on pmax resulted in further performance improvement: weighted F1 score of 0.830 with 91.6 % remaining samples at pmax ≥ 0.5 and 0.942 with 65.2% remaining samples at pmax ≥ 0.9 (Fig. 2c, 2d). While rarer cancer types had generally lower overall performance, increasing the pmax threshold reduced this difference between common/rare cancer types. At pmax ≥ 0, common cancer types in the upper quartile in terms of the number of tumor samples (NSCLC, BRCA, COADREAD, DIFG, PRAD, and PAAD) had a mean F1 of 0.841 while rare cancer types in the lower quartile (WDTC, MNGT, GINET, PANET, AML, and NHL) had a mean F1 of 0.581, whereas at pmax ≥ 0.9, common and rare cancer had a mean F1 of 0.953 and 0.860, respectively. Furthermore, OncoNPC demonstrated robust performance against potential real-world dataset shifts due to the factors including cancer center, biopsy site type, sequence panel version, and patient ethnicity (Fig. 2e and Extended Data Fig. 2a; see Supplementary Note 3 for more details on OncoNPC’s performance regarding real-world dataset shifts and difficult-to-predict cancer types such as CHOL and HNSCC). Finally, a feature ablation study demonstrated that OncoNPC continues to achieve high performance with only the top 50% of genomic features retained (overall weighted F1 score of 0.757 vs. 0.777 at pmax threshold of 0, and 0.950 vs. 0.960 at pmax threshold of 0.9; see Supplementary Note 4 and Extended Data Fig. 3).
Applying OncoNPC to CUP tumor samples
We applied OncoNPC to classify 971 CUP tumors from patients who were admitted to DFCI and sequenced as part of routine clinical care. OncoNPC classifications for CUPs had prediction probabilities lower than those of 3,690 held-out Cancer with Known Primary (CKP) tumors at DFCI in average (0.764 vs. 0.881), but comparable to those of 8,025 CKPs at DFCI, including tumors with cancer types not modeled in OncoNPC (0.769). This indicates that CUP tumors may contain other rare cancer types (see Supplementary Note 5 and Extended Data Fig. 2b). Nevertheless, 41.2% of the CUP tumors (400 out of 971) could still be classified with high confidence (i.e., pmax ≥ 0.9), and multiple classified cancer types including NSCLC, BRCA, PAAD, and PRAD had distributions of predictive probabilities comparable to their corresponding CKPs (Fig. 3a). Interestingly, CUPs with predicted GINET were highly confident, despite their small number of tumor samples in the training cohort (n = 359; 0.99% of the training cohort), suggesting some rarer cancer types may nevertheless be confidently identifiable. As shown in Fig. 3b, the most common CUP cancer types were NSCLC, PAAD, BRCA, EGC, and COADREAD. NSCLC, BRCA, and COADREAD were also the top-3 most common CKP types. These rates are broadly consistent with prior findings that the most frequently revealed underlying primary cancers for CUPs by autopsy include lung, large bowel, and pancreas cancers [21]. Finally, comparable rates were observed upon applying OncoNPC to 581 CUP tumors at MSK Cancer Center (Supplementary Fig. S4).
Figure 3: Application of OncoNPC to CUP tumors, germline PRS-based validation, and interpretation of OncoNPC cancer type predictions.
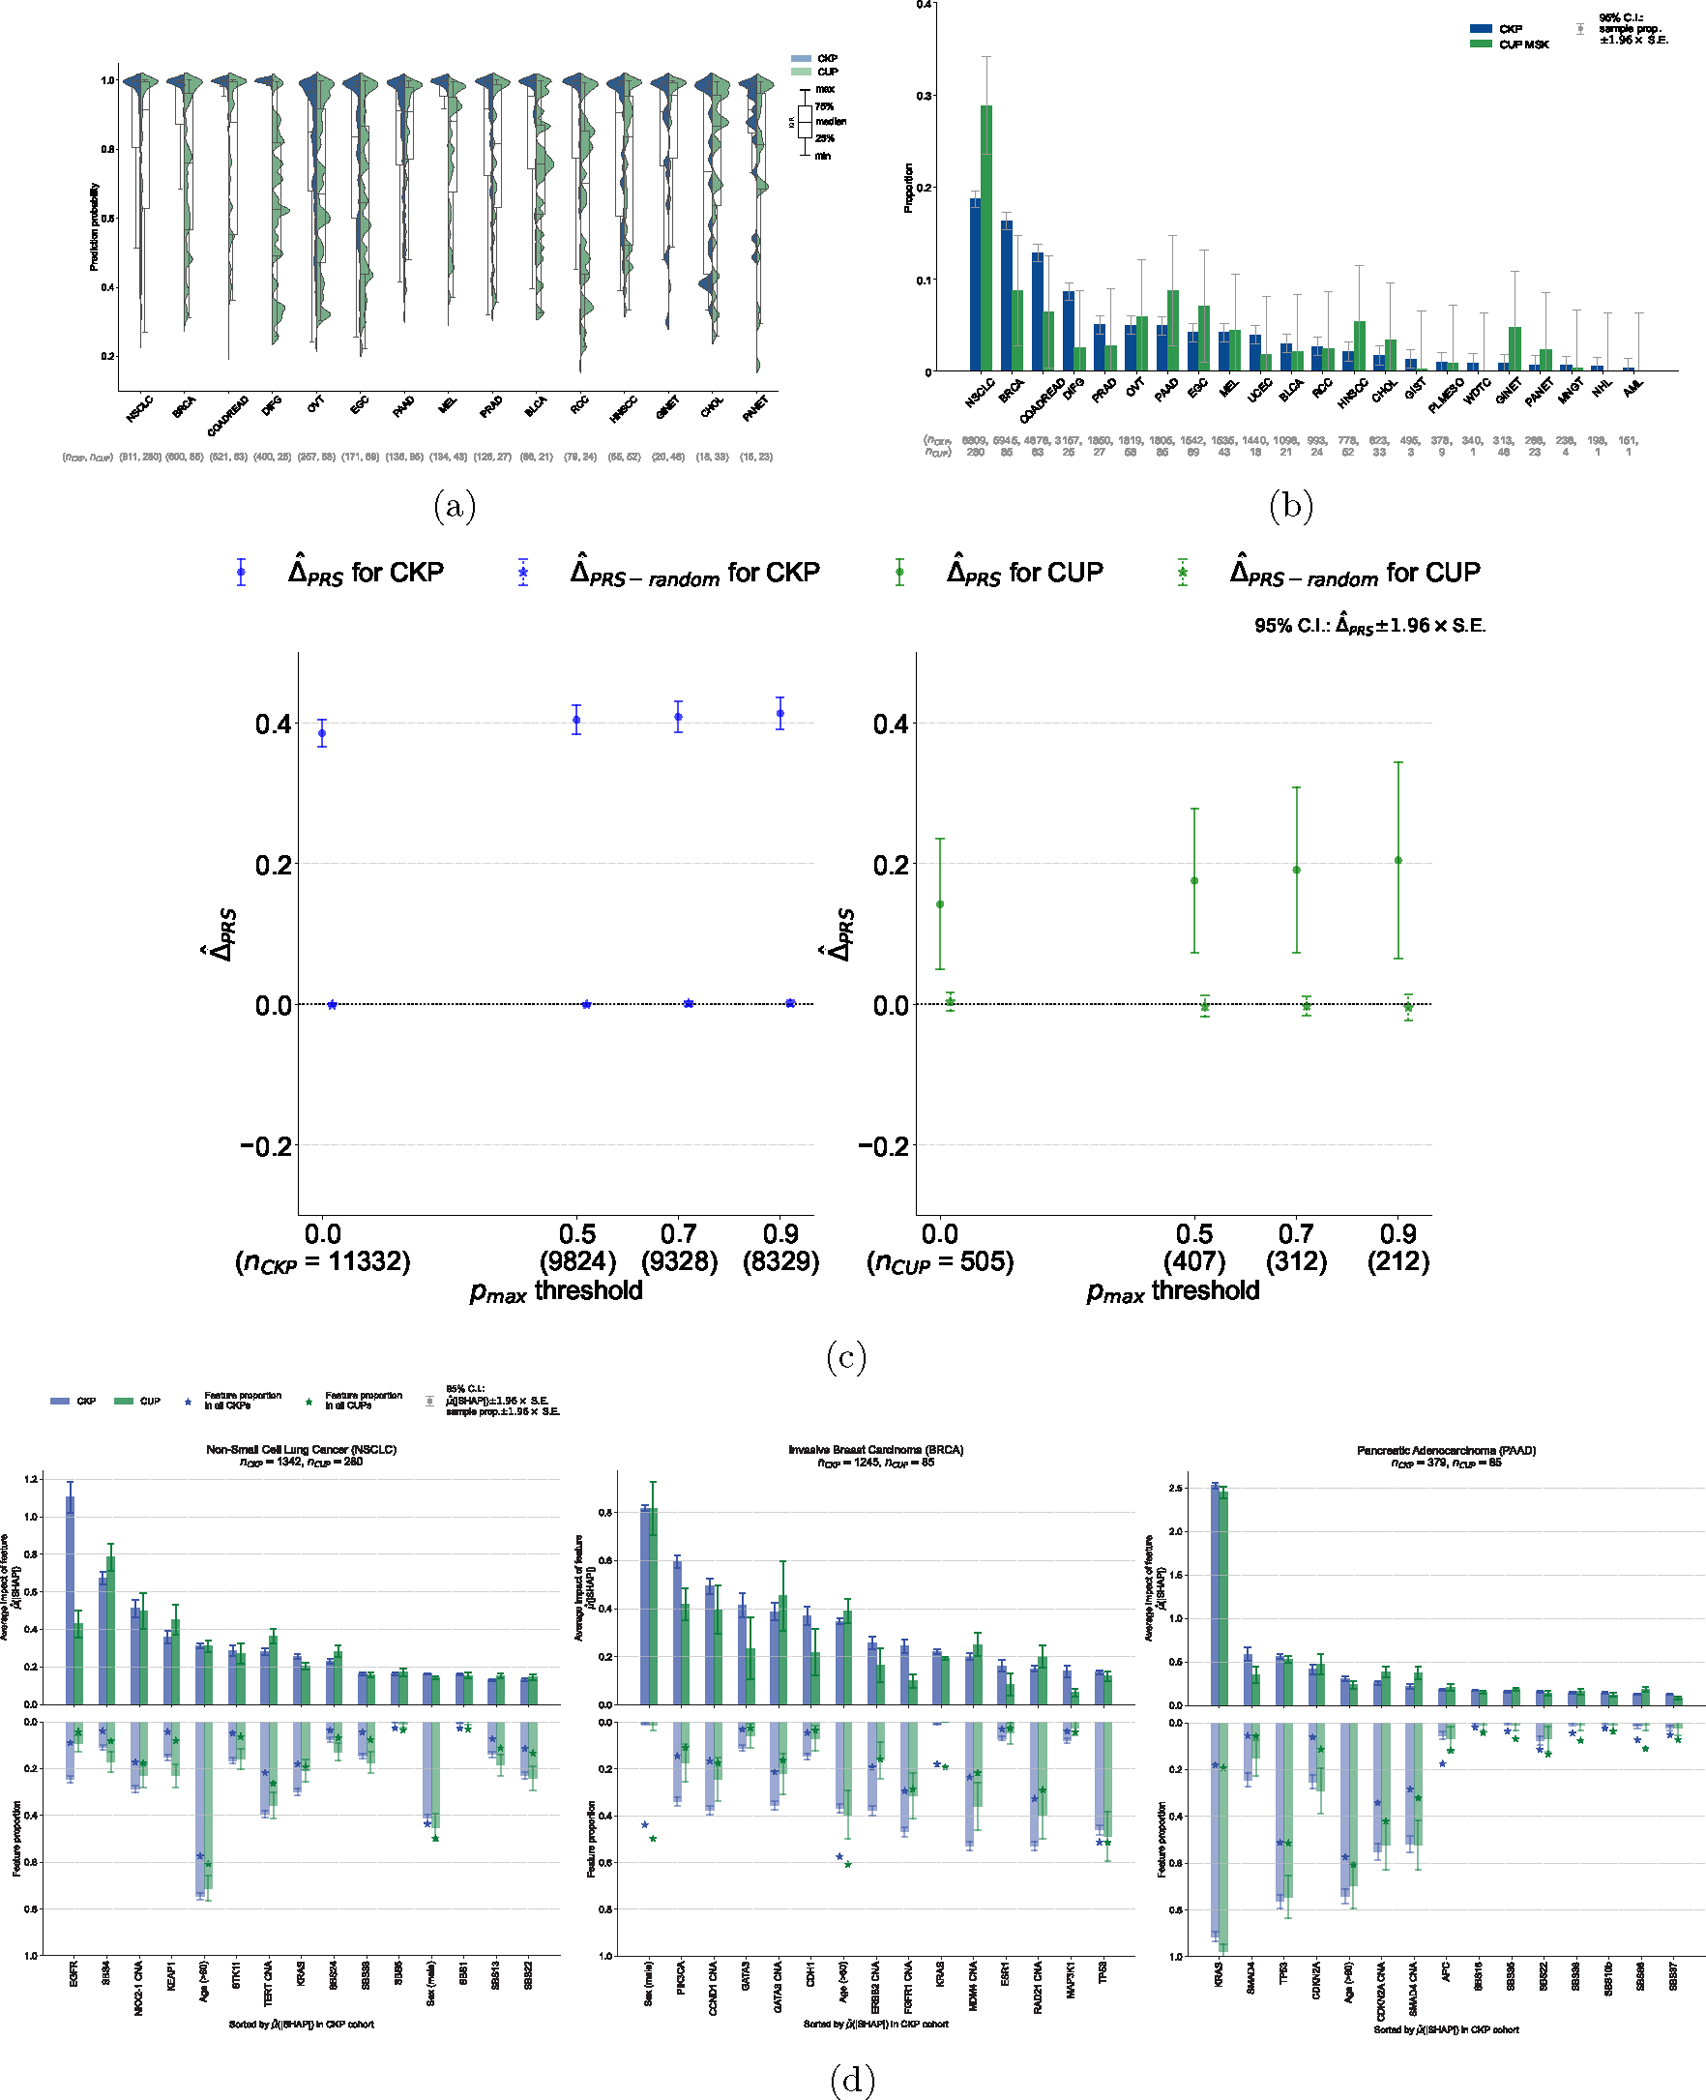
(a) Empirical distributions of prediction probabilities for correctly predicted, held-out CKP tumor samples (n = 3,429) and CUP tumor samples (n = 934) across CKP cancer types (blue) and their corresponding OncoNPC predicted cancer types for CUP tumors (green). Only OncoNPC classifications with at least 20 CUP tumor samples are shown. (b) Proportion of each CKP cancer type and the corresponding OncoNPC predicted CUP cancer type. All training CKP tumor samples (n = 36,445) and all held-out CUP tumor samples (n = 971) are included. For both (a) and (b), the cancer types (x-axis) are ordered by the number of CKP tumor samples in each cancer type. (c) Germline Polygenic Risk Score (PRS) enrichment of the CKP tumor samples (n = 11,332) and CUP tumor samples with available PRS data (n = 505) averaged across 8 cancer types. The magnitude of the enrichment is quantified by : the mean difference between the concordant (i.e., OncoNPC matching) cancer type PRS and mean of PRSs of discordant cancer types (see Methods). is shown for CKPs in blue (for reference) and CUPs in green. As a negative control, is also shown after permuting the OncoNPC labels. (d) Top 15 most important features based on mean absolute SHAP values (i.e., ) for the top 3 most frequently predicted cancer types in the CUP cohort: Non-Small Cell Lung Cancer (NSCLC), Invasive Breast Carcinoma (BRCA), and Pancreatic Adenocarcinoma (PAAD). The feature proportion (i.e., carrier rate) for each feature in corresponding CKP and CUP cancer cohorts as well as the entire CKP and CUP cohorts are shown as bars going downwards and star-shaped markers, respectively. For mutation signature features that have continuous values, individuals with feature values one standard deviation above the mean were treated as positives and the rest as negative. For age, individuals above the population mean were treated as positives and the rest as negatives. 95% confidence intervals were determined using the standard error of the sample mean for and the standard error of the sample proportion for the carrier rate. These intervals are centered at the respective sample values.
Explaining OncoNPC cancer type predictions
OncoNPC learns complex non-linear relationships between input somatic variants and clinical features and provides interpretable primary cancer type predictions, where impact of each input feature on a prediction is quantified as a SHAP value [22]. We investigated the most impactful features in predicting each cancer type across the CKP and CUP cohorts to evaluate face validity of OncoNPC (see Fig. 3d for the top 3 most frequently predicted cancer types in the CUP cohort: NSCLC, BRCA, and PAAD, and Supplementary Fig. S5 and S6 for other cancer types). For NSCLC, the most important features were EGFR mutation and SBS4, a tobacco smoking-associated mutation signature [23], for both CKP tumor samples and CUP with NSCLC predicted tumor samples, consistent with the known etiology of lung cancer. Somatic mutation in the EGFR gene is frequently observed in NSCLC tumors and the gene itself is a well-known therapeutic target for patients with NSCLC [24, 25]. Carcinogens in tobacco smoke have been known to cause lung cancer [26]. For BRCA, the most important feature for both CKP and CUP tumor samples was sex, as expected, followed by somatic mutation in PIK3CA and CNA event in CCND1 gene, known drivers and prognostic indicators in breast cancer [27, 28]. For PAAD, KRAS mutation was significantly more common than the population averages and by far the most important somatic feature. Mutations in the KRAS gene occur frequently among patients with pancreatic cancer and are known to have prognostic significance [29, 30]. OncoNPC provides intuitive visualizations to explain individual-level predictions. As an example, we show how OncoNPC explained the classification of a tumor sample from a 76 year-old male patient with CUP (see Extended Data Fig. 4). The feature interpretation analysis showed that OncoNPC was able to capture cancer-specific signals in somatic mutations and clinical features, both at the individual and cohort level.
Germline PRS-based validation on CUP tumor samples
We hypothesized that, if OncoNPC was accurately identifying latent primary cancers, the classified CUP cancer types would exhibit increased germline risk for the corresponding cancers. To that end, we imputed common germline variation for each CUP patient and quantified their polygenic risk scores (PRS) across 8 common cancers using external cancer GWAS data (see Methods). PRSs are a continuous estimate of the underlying germline liability for a given cancer and orthogonal from the somatic data used to train OncoNPC. As hypothesized, patients with CUP had a significantly higher mean germline PRS for the OncoNPC predicted cancers (Fig. 3c and see Extended Data Fig. 5 for cancer type-specific analysis) compared to other cancer types. The magnitude of the difference (i.e., ) increased for more confident OncoNPC predictions ( C.I. 0.0494 – 0.235, two-sided Wald test p-value: 2.66×10⁻³ at threshold of 0.0 and C.I. 0.0655 – 0.344, two-sided Wald test p-value: 3.98 × 10⁻³ at threshold of 0.9). As a negative control, the same analysis, conducted with randomly shuffled OncoNPC labels, showed no enrichment. As a positive control, the same analysis conducted on CKPs, with available imputed PRS (n = 11,332), also demonstrated a highly significant germline enrichment, as expected. Notably, the enrichment for CUP tumors was in between that of CKPs and tumors with randomly shuffled labels, suggesting that while OncoNPC classified CUP tumors are genetically correlated with CKPs, they still exhibit additional heterogeneity.
OncoNPC-based risk stratification among patients with CUP
To demonstrate clinical utility of OncoNPC, we examined if OncoNPC cancer type predictions with moderately high confidence (≥ 0.5), a threshold consistently applied in subsequent clinical analyses, can stratify overall survival among patients with CUP. We identified subgroups which had significant prognostic differences in median survival based on the OncoNPC predictions (Chi-squared test, p-value: 4.90 × 10⁻¹⁴; see Fig. 4a). Overall, the poorest prognosis was observed in patients with CUP predicted to be EGC and PAAD: median survival 8.44 months for the combined cohort (95% C.I. 5.39 – 10.5, n = 107). The most favorable prognosis was observed in patients with CUP predicted to be HNSCC, GINET, and PANET: median survival 48.2 months for HNSCC (95% C.I. 19.6 - not estimable, n = 41) and not estimable median survival (i.e., the estimated survival curve never reached the median) for the combined GINET and PANET cohort (n = 57), respectively. Our identified favorable subgroups are consistent with established favorable CUP subtypes such as poorly or well differentiated neuroendocrine carcinomas of unknown primary and squamous cell carcinoma of non-supraclavicular cervical lymph nodes [31]. Furthermore, median survival times were significantly correlated across cancer types between CUP-metastatic CKP pairs (Spearman’s : 0.964, p-value: 4.54×10⁻⁴), as detailed in Supplementary Note 7 and Fig. 4b. This suggests that genetics-based OncoNPC predictions capture prognostic signals specific to each predicted cancer type. Consequently, OncoNPC subgroups can be leveraged to meaningfully stratify the survival of patients with CUP. In an exploratory analysis, we also identified prognostic somatic variants common to both predicted CUP cancer groups and their corresponding metastatic CKP groups (see Supplementary Note 8).
Figure 4: OncoNPC-based risk stratification among patients with CUP and median survival comparison between CUP and CKP metastatic cases.
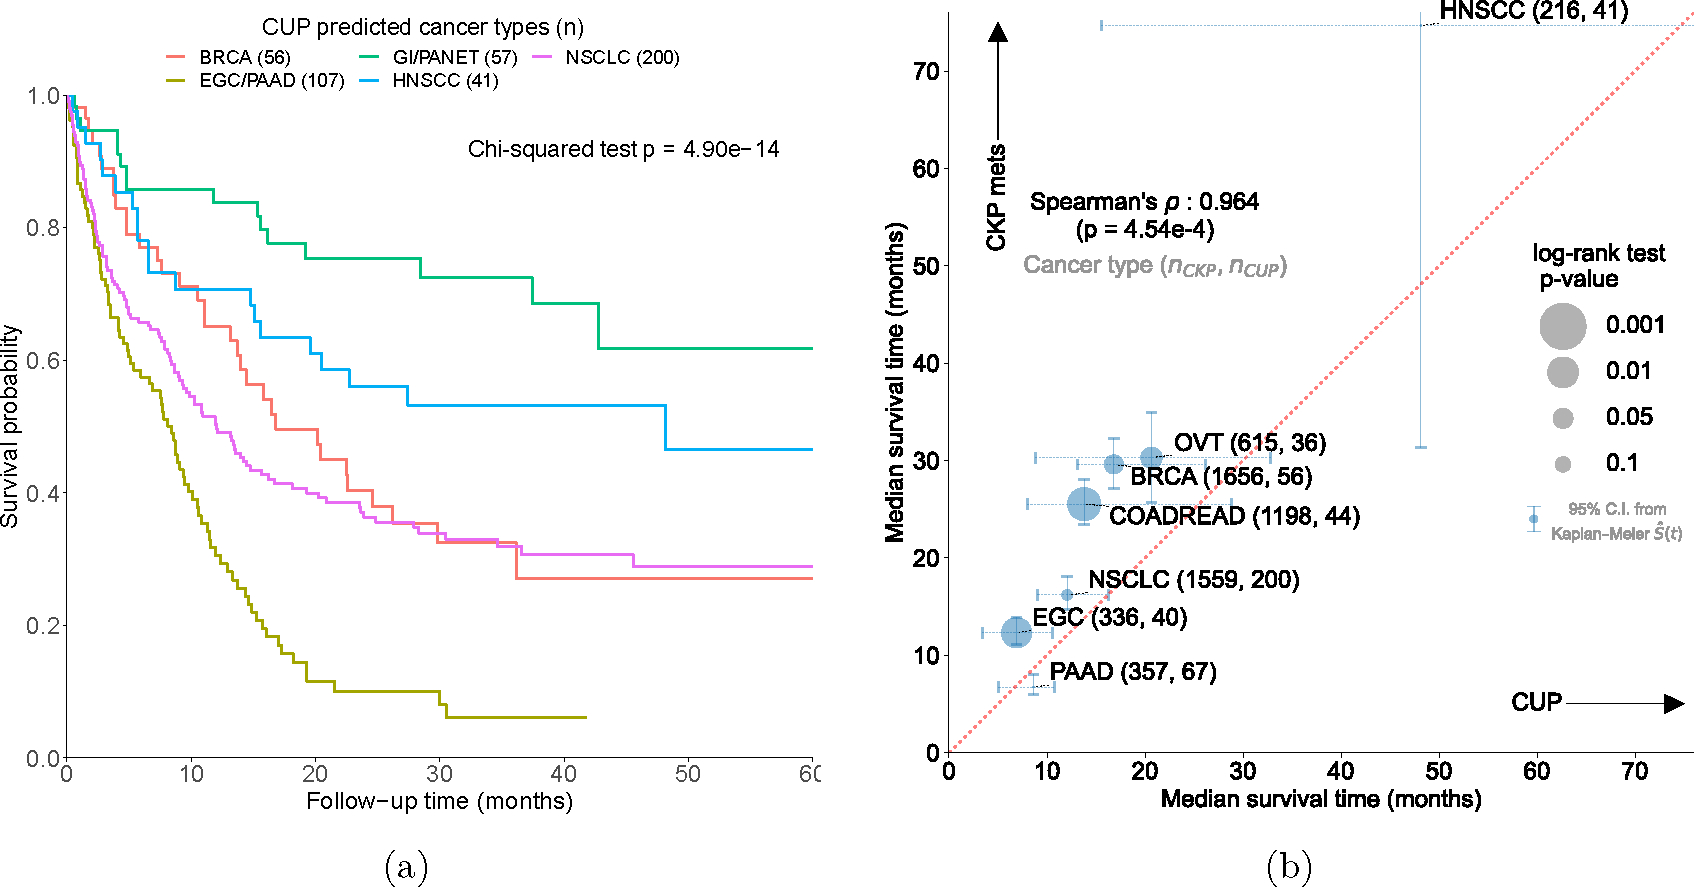
(a) Survival stratification for patients with CUP based on their OncoNPC predicted cancer types. The Kaplan-Meier estimator was used to estimate survival probability for each predicted cancer type over the follow-up time of 60 months from sequence date, with the statistical significance assessed by Chi-square test. (b) Median survival comparison between patients with CUP (across predicted cancer types in x-axis) and patients with CKP metastatic cancer (across corresponding cancer types in y-axis): Spearman’s rho 0.964 (p-value: 4.54 × 10⁻⁴). The size of each dot reflects the p-value of the log-rank test for significant difference in median survival between CUP-metastatic CKP pairs. Only cancer types with at least 30 CUP tumor samples having OncoNPC prediction probabilities greater than 0.5 are shown. 95% confidence intervals were obtained non-parametrically using Kaplan-Meier estimated survival function .
Survival benefit from OncoNPC-concordant treatments
We performed retrospective survival analysis to investigate whether patients with CUP achieved clinical benefit when treated in concordance with their OncoNPC predictions. We restricted to a cohort of 158 patients with CUP, who received first treatment at DFCI with a palliative intent (see the exclusion criteria in Extended Data Fig. 6 and demographic details in Extended Data Table 1). Each case was then manually chart reviewed by a certified oncologist to determine whether the treatment administered was concordant with the OncoNPC prediction per National Comprehensive Cancer Network (NCCN) guidelines or standard of care (see Supplementary Note 9). We used two estimation strategies to minimize potential bias and estimate the impact of treatment concordance on patient survival: multivariable Cox regression and Inverse Probability of Treatment Weighted (IPTW) Kaplan-Meier estimator, which have recently been utilized to emulate estimates from randomized trials [32, 33]. By applying these methods, we adjusted for baseline covariates including sex, age, OncoNPC prediction uncertainty, metastasis sites, and pathological histology (see Methods). Notably, patients with CUP who received first palliative treatments concordant with their OncoNPC predicted cancer types exhibited significantly better survival than those who received discordant treatments as shown in Fig. 5a and 5b (multivariable Cox regression: H.R. 0.348, 95% C.I. 0.210 – 0.570, p-value 2.32 × 10⁻⁵, Proportional Hazard assumption test [34]: Chi-squared test with 17 degrees of freedom p-value 0.156, IPTW Kaplan-Meier estimator: weighted log-rank test p-value 1.97×10⁻⁶). Furthermore, after stratifying by OncoNPC predicted cancer groups and repeating the IPTW Kaplan-Meier analysis, we found that the treatment concordant group had improved survival across the cancer groups (breast, GI, and others), with the exception of the lung cancer group (Extended Data Fig. 7). The concordant treatment group achieved better survival outcomes even after restricting to a subset of patients (n = 33) who received their initial treatments after the OncoPanel sequencing results were available for clinical assessment (weighted log-rank test p-value 1.50 × 10⁻⁸; see Extended Data Fig. 8). Finally, the multivariable Cox regression (Fig. 5a) and the IPTW Kaplan-Meier analysis likewise identified significant hazardous and protective associations of several baseline covariates with survival and treatment concordance, respectively (see Supplementary Note 10).
Figure 5: Potential clinical decision support for patients with CUP based on OncoNPC predictions of their tumors.
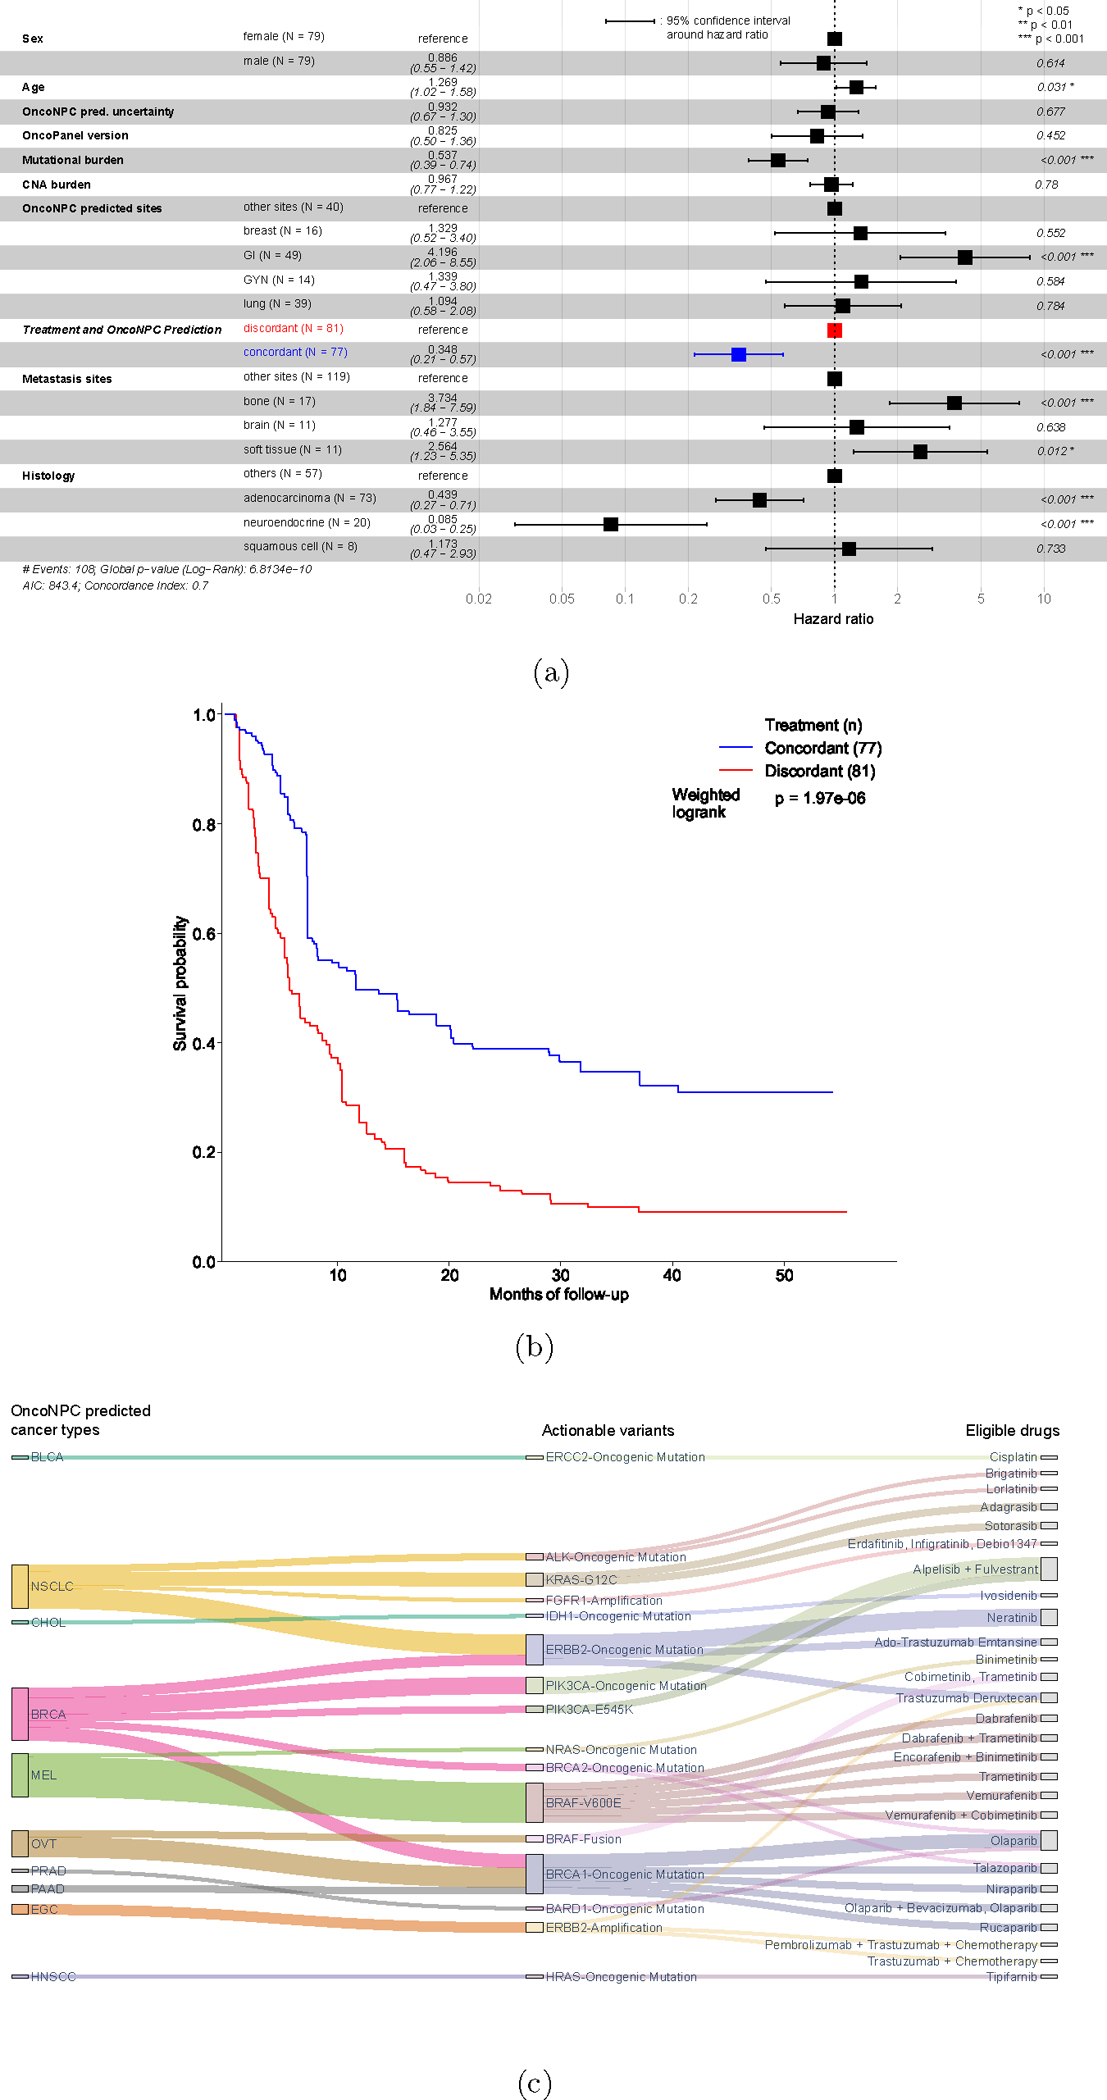
(a) Forest plot of a multivariable Cox Proportional Hazards Regression on patients in the CUP cohort with first-line palliative treatment records at DFCI (n = 158; see Extended Data Fig. 6 for the exclusion criteria). Treatment concordance (colored in blue), encoded as 1 when the first palliative treatment a patient received at DFCI is concordant with their corresponding OncoNPC prediction and 0 otherwise, was significantly associated with overall survival of patients in the cohort (H.R. 0.348, 95% C.I. 0.210 – 0.570, p-value 2.32 × 10⁻⁵). (b) Estimated survival curves for patients with CUP in the concordant treatment group (shown in blue) and discordant treatment group (shown in red), respectively. To estimate the survival function for each group, we utilized Inverse Probability of Treatment Weighted (IPTW) Kaplan-Meier estimator while adjusting for left truncation until time of sequencing (see Methods). Statistical significance of the survival difference between the two groups was estimated by a weighted log-rank test. (c) Sankey diagram showing the OncoNPC predicted cancer types, corresponding actionable variants, and eligible drugs for 24 patients with CUP, which represented 15.2% of the patients in the treatment concordance analysis cohort (n = 158). These patients were identified as having the potential to receive genomically-guided treatments based on their OncoNPC predicted cancer types and actionable variants.
Improving access to targeted treatments in patients with CUP
Based on a comprehensive review of the medical record for 158 patients with CUP by a certified oncologist, we identified 20 patients (12.7%) who received genomically-guided treatments, split evenly between concordant and discordant groups. We utilized the OncoKB knowledge base [35] to link actionable variants with their respective targeted treatments (see Methods). Notably, we found that 24 additional patients in the cohort (representing a 2.2-fold total increase; 13 in the treatment concordant group and 11 in the discordant group) could have been eligible for genomically-guided treatments based on OncoNPC predictions. Specifically, actionable somatic variants, combined with the predicted cancer types, led to 28 eligible drugs under Level 1 to 3, where Level 1 corresponds to FDA-approved drugs, Level 2 corresponds to Standard Care, and Level 3 corresponds to Biological Evidence [35]. Fig. 5c illustrates the OncoNPC predicted cancer types, corresponding actionable variants, and eligible drugs. Within a broader cohort of CUP tumors that were not chart reviewed (n = 794), we similarly found that 22.8% had potentially actionable somatic variants per their respective OncoNPC cancer type predictions (see Supplementary Note 11 and Extended Data Fig. 9).
Discussion
We developed OncoNPC, a machine learning model, for the molecular classification of tumor samples using multicenter NGS panel data. OncoNPC provided robust and interpretable predictions in held-out multicenter test data. Applied to CUP tumor samples, OncoNPC CUP subgroups showed significantly higher germline PRS risk for their predicted cancers; the first evidence of germline genetic correlation between CUP tumors and corresponding CKP tumors, to our knowledge. Furthermore, OncoNPC CUP subgroups showed significant survival differences, consistent with those observed in the corresponding CKP cancer types. In the retrospective survival analysis, patients with CUP treated in a consistent manner with their OncoNPC predictions achieved significantly longer survival than those treated in an inconsistent manner. Finally, OncoNPC predictions enabled a 2.2-fold increase in CUP patients who could have received genomically-guided therapies. Our findings suggest that CUP tumors share a genetic and prognostic architecture with known cancer types, and may benefit from molecular classification.
While prior studies have demonstrated accurate classification of known tumors using a variety of platforms [7–13, 36, 37], they typically applied algorithms to metastatic tumors of known types and did not investigate the clinical implications for CUP tumors at large scale. Notably, Moran et al. [7] observed a nominally significant difference in survival between patients with CUP who received site-specific treatments concordant with their molecular primary site predictions and those who received empiric treatments. However, this difference may be explained by systematically worse outcomes for the empirically treated group, which is typically a more challenging patient population [38]. To explicitly distinguish these scenarios, our analysis instead restricted to a CUP cohort wherein all patients received site-specific treatments as the first palliative-intent therapy and estimated a significant survival benefit of concordant treatment vs. discordant treatment (excluding the empirically treated group) to mimic clinical trials in Real World data [32, 33]. Although we cannot rule out potential biases from unmeasured confounders, the proposed intervention (concordant treatment vs. discordant treatment) is particularly challenging to ethically evaluate through RCTs, necessitating the use of retrospective causal inference.
Our study has several limitations. Firstly, although we utilized multicenter data for training and evaluation of OncoNPC predictions, retrospective EHR data was only available from a single institution for downstream clinical analyses. Secondly, the majority of our cohort with panel sequencing data consists of white patients (83.2% in the training cohort), which may explain why OncoNPC performed better for the held-out tumors from white patients. Nevertheless, OncoNPC achieved an AUC-PR over 0.8 across all ethnicities. Thirdly, we considered only the 22 most common cancer types in the cohort as classification labels (68.1 % of all tumor samples at DFCI, and 69.9 % across all three centers). As a result, if a CUP tumor sample harbors a distinct yet not modeled primary cancer type, then the tumor sample will likely have high uncertainty in the prediction, which we confirmed empirically (see Supplementary Note 5). Nevertheless, prior work has shown that the majority of resolvable primary sites of CUP tumor samples were from common cancers (e.g., lung, pancreas, and GI) [21], consistent with our findings. Fourthly, our classifier and analyses relied on data from panel sequencing assays targeting 300–500 genes, which are inherently only sensitive to coding mutations and deep copy number alterations in the targeted genes. Other molecular features may thus improve classification performance (see Supplementary Note 12). Our focus in this work was on assays that are in routine clinical use as those are linked to Real World clinical data and offer the most immediate translational potential. Notably, OncoNPC may still be effective with even more limited sequencing panels (see Supplementary Note 4). Lastly, we stress that OncoNPC subgroups are still algorithmically defined and should not be considered true molecular subtypes without further molecular validation and independent replication.
Our findings suggest that routinely collected targeted tumor panel sequencing data have clinical utility in assisting diagnostic work-up and prognosis, and may additionally inform treatment decisions. Through our pathology-based evaluation, we discovered that 51.9% (67 out of 129 cases) of CUP cases in the cohort had agreement between OncoNPC predictions and at least one pathology-based suspected primary (see Supplementary Note 13). Despite being substantially higher than expected by chance (19.9%, 95% C.I. 19.7% - 20.1%), this relatively low agreement underscores the challenge that highly metastatic or poorly differentiated tumors pose to pathological diagnosis [2, 5]. In several cases, we found that OncoNPC predictions could have been helpful where multiple primaries were pathologically suspected (see Supplementary Note 13). Due to the difficulty in diagnosing CUP cases, oncologists often resort to empiric treatment regimens [21, 39], even when targeted therapies would otherwise be the standard of care for a corresponding known primary. Upon retrospective chart review, we found that only 12.7% of patients with CUP (20 out of 158) received genomically-guided targeted treatments, which could have potentially increased to 44 (27.8%) patients based on OncoNPC predictions. In future work, we envision a multimodal foundational framework that incorporates molecular sequencing together with patient pathology images [37], longitudinal physiological data [40], and clinical notes [41] to directly predict optimal treatment regiments rather than just cancer types. We believe that our work paves a way for incorporating routine panel sequencing data into clinical decision support tools for clinically challenging cancers.
Methods
Our research complies with all relevant ethical regulations. Tumors samples at DFCI were selected and sequenced from patients who were consented under institutional review board (IRB)-approved protocol 11–104 and 17–000 from the Dana-Farber/Partners Cancer Care Office for the Protection of Research Subjects. Participants in this study provided written informed consent before being included. The secondary analyses of preexisting data were conducted with approval from the Dana-Farber IRB under protocols 19–033 and 19–025. Waivers for Health Insurance Portability and Accountability Act (HIPAA) authorization were granted for both protocols.
Patients and tumor samples
We used the next generation sequencing (NGS) targeted panel sequencing data collected at three institutions in routine clinical care as part of the AACR project GENIE [1]: Dana-Farber Cancer Institute (DFCI, n=18,816), Memorial Sloan Kettering Cancer (MSK, n=16,294) center, and Vanderbilt-Ingram Cancer Center (VICC, n=1,335). The collected tumor samples represented 22 different cancer types and included 971 total samples from cancer of unknown primary (CUP). National Death Index (NDI) and clinical death and last clinical appointment records were available for 20,281 DFCI patients (n = 16,376 for CKP and n = 838 for CUP). Demographic details of the patients and tumor samples can be found in Table 1.
The cancer centers, DFCI, MSK, and VICC, were chosen because of similar genomic data characterization of their sequence panels in terms of coverage and alteration types [1]. DFCI samples were sequenced using a custom, hybridization-based panel called OncoPanel which targeted exons of 304–447 genes across three panel versions [1, 2]. MSK samples were sequenced using a custom panel called MSK-IMPACT which targeted 341–468 genes across 3 panel versions [1, 3]. VICC samples were sequenced using custom panels called VICC-01-T5A and VICC-01-T7, which targeted 322 and 429 genes, respectively [1]. All panels were capable of detecting single nucleotide variants (SNVs), small indels, copy number alterations, and structural variants [1]. Additionally, we have provided Supplementary File onconpc_feature_genes_targeted_across_panels.csv that lists all the genes used to develop the OncoNPC classifier, categorized by the targeted genes across panels.
The DFCI CUP cohort consisted of 971 sequenced tumor samples (from 962 patients) with a cancer diagnosis of CUP and the following detailed cancer type: Adenocarcinoma, Not Otherwise Specified (NOS) (n = 345), Cancer of Unknown Primary, NOS (n = 194), Squamous Cell Carcinoma, NOS (n = 114), Poorly Differentiated Carcinoma, NOS (n = 118), Neuroendocrine Tumor/Carcinoma, NOS (n = 170), Small Cell Carcinoma of Unknown Primary (n = 16), Undifferentiated Malignant Neoplasm (n = 12), and Mixed Cancer Types (n = 2). For downstream clinical analyses, we applied additional exclusion criteria, described in Extended Data Fig. 6.
Developing OncoNPC cancer type classifier
We used a gradient tree boosting framework (XGBoost [4]) to develop OncoNPC for predicting cancer types from molecular features. In this framework, decision trees for the input features are sequentially added to an existing ensemble of the trees, such that the algorithm fits the new tree to the residuals from the ensembles with regularization on the tree structure. As the trees (i.e., weak learners) are added, the model learns optimal weights to combine their predictions and produces the improved outcome from the combined ensemble [4]. Owing to its high performance and scalability, the XGBoost method has been used across a wide range of applications in the healthcare space [5–7].
OncoNPC was trained and evaluated using tumors from 22 known cancer types split into 29,176 training samples and 7,289 test samples. Hyper-parameter selection was conducted using random search [8] with 10-fold cross validation within the training set while utilizing weighted F1 score as an evaluation metric. The optimal hyper-parameters were then selected and the model was evaluated on the held-out test set (n = 7,289). To predict primary sites of CUP tumors, the model was then re-trained on all CKP tumor samples and applied to the CUP tumors to estimate posterior probabilities across the 22 different cancer labels. For each tumor sample, a cancer type with the highest probability was chosen as the predicted primary site.
Feature selection and OncoNPC model interpretation
The OncoNPC model was trained on somatic variant features from tumor sequencing data, as well as patient age at the time of sequencing and sex. In order to avoid bias towards known cancers or creating performance disparities across patient subgroups, OncoNPC did not consider other aspects of tumor characteristics, pathology, or patient demographics (see Supplementary Note 1 for more details). Somatic variant features included mutations (i.e., single nucleotide variants (SNV) and indels), Copy Number Alteration (CNA) events, and mutational signatures [9]. For each gene, the total count of a somatic mutation (i.e., single nucleotide variants and indels) was encoded as a positive integer feature. The presence of a CNA event for each gene was encoded as a categorical variable with 5 levels: −2 (deep loss), −1 (single-copy loss), 0 (no event), 1 (low-level gain), and 2 (high-level amplification). Note that CNA events data for tumor samples from MSK and VICC were encoded as −2 (deep loss), 0 (no event), and 2 (high-level amplification). Each of 60 different mutation signatures was inferred as the dot product of the weights derived from [9] and 96 single base substitutions in a trinucleotide context. The single base substitutions were computed using the deconstructSigs v1.8.0 R library [10]. See Supplementary File onconpc_features.csv for the full set of features.
To identify important features in the OncoNPC’s predictions, we used the recently proposed feature interpretation tool for tree-based models, called TreeExplainer [11] (Python shap v0.41.0). TreeExplainer uses an efficient polynomial time algorithm : number of trees, : number of leaves, : maximum depth) to approximate Shapley values which capture the impact of each feature on each individual model prediction. The Shapley value assigned to each feature is modeled as the average change in the model’s conditional expectation function over all possible feature orderings when introducing the corresponding feature into the model. It is formulated as , where is the set of features, is a random variable for the feature to perturb, and do notation [12] reflects the causal feature perturbation formulation. See [11] for more details on the algorithm and its properties.
Using TreeExplainer, we obtained local explanations for each OncoNPC prediction on a total of 7,289 CKP held-out and 971 CUP tumor samples. By combining local explanations for each cancer type, we characterized the cancer type in terms of the most important or predictive features based on their Shapley values, which provided insights into the somatic variants and clinical features most relevant to the classification of each cancer type.
Germline PRS-based validation on CUP tumor samples
To validate the OncoNPC predictions for CUP tumor samples (which do not otherwise have a ground truth), we utilized germline Polygenic Risk Scores (PRS) which were never available to OncoNPC for training. Germline imputation from the off-target tumor sequencing data was conducted as previously described in [13]. We limited our cohorts to individuals of European ancestry since the imputation model for germline variants and GWAS data for PRS was trained on a European population. Using weights from external GWAS data, we imputed PRS for Non-Small Cell Lung Cancer (NSCLC), Invasive Breast Carcinoma (BRCA), Colorectal Adenocarcinoma (COADREAD), Diffuse Glioma (DIFG), Melanoma (MEL), Ovarian Epithelial Tumor (OVT), Renal Cell Carcinoma (RCC), and Prostate Adenocarcinoma (PRAD). Pearson correlation between the PRS from off-target tumor data versus matched germline SNP array was previously shown to be higher than 0.9 without observable outliers [13]. See Supplementary Note 6 for details on the accuracy of germline imputation in our cohorts.
We hypothesized that germline PRS specific to the underlying primary cancer type of a CUP tumor sample would be enriched in a manner similar to how the PRS specific to CKP tumor sample with the same primary cancer type is enriched. To that end, given the set of 8 different cancer types we have the imputed PRS available for, we first restricted the cohort of CUP tumor samples to those with OncoNPC predictions in . Then, we obtained standardized germline PRS values for the chosen CUP tumor samples over all the cancer types in . Finally, we defined as the estimated mean difference between the PRS specific to the predicted primary cancer type (i.e. concordant PRS; ) and average of PRSs corresponding to the rest of the cancer types (i.e. discordant PRS; , where ) as follows
| (1) |
As a true positive reference, we repeated the above procedure for the CKP tumor samples. Finally, as a true negative reference, we estimated , where the concordant cancer type was randomly assigned. We then repeated the random assignment 100 times to obtain estimated mean and standard errors.
Survival function estimation
National Death Index (NDI) and in-house clinical records were available for 20,281 DFCI patients (n = 16,376 for CKP and n = 838 for CUP). A patient’s lost to follow-up date was determined at either the last NDI update date (12/31/2020) or their corresponding last contact date from the in-house records, whichever date is later. A patient’s death date was determined from the in-house records, or the NDI data if the patient was lost to follow-up.
OncoNPC-based risk stratification among patients with CUP
To identify OncoNPC CUP subgroups with significant prognostic differences, we estimated survival functions for 7 common OncoNPC subgroups with more than 35 CUP patients: NSCLC, PAAD, BRCA, HNSCC, EGC, GINET, and Pancreatic Neuroendocrine Tumor (PANET). Patients that were lost to follow up at time of sequencing were again excluded, as were CUPs with an OncoNPC prediction probability lower than 0.5 (see Extended Data Fig. 6). We merged subgroups with similar morphology and estimated survival functions: PAAD and EGC, and GINET and PANET. To statistically test survival differences between these 5 groups, we utilized Chi-squared test with 4 degrees of freedom.
Estimating impacts of treatment concordance on survival of patients with CUP
We estimated the impact of the concordance between treatment and OncoNPC CUP predictions on a mortality outcome in a retrospective survival analysis. We utilized the in-house patient follow-up and treatment data to identify patients with CUP who received first treatment at DFCI with a palliative intent (see Extended Data Fig. 6 for the exclusion criteria). Each patient was reviewed by a trained oncologist to determine whether the OncoNPC predicted cancer type was concordant or discordant with the first line of treatment received, per National Comprehensive Cancer Network (NCCN) guidelines or standard of care, in most reasonable situations, and within the clinical context delineated in the medical record (see Supplementary Note 9). Refer to Supplementary File patient_info_treatment_analysis.csv for more details on clinical information of patients with CUP in the analysis, including primary cancer diagnosis, biopsy site, and first chemotherapy plan at DFCI.
As we were interested in the counterfactual causal impact of the OncoNPC-treatment concordance, we utilized the principles of causal inference to account for potential patient heterogeneity and confounding. Specifically, we estimated the effect of treatment concordance specified by the indicator variable, , which was 1 when the first palliative treatment for a patient with CUP was concordant with the corresponding OncoNPC prediction and 0 otherwise. Our analyses make the following identifiability assumptions:
Conditional ignorability : , where . It means that given patient ’s a set of covariates , the patient’s treatment concordance is as good as random.
Consistency : , which means that a counterfactual outcome for patient is the observed outcome for the patient with a treatment concordance .
Overlap : where , which means all patients have a strictly positive probability for receiving concordant treatment .
In addition to the above identifiability assumptions, we made independent censoring (i.e. ) and independent entry assumption given the covariates (i.e. ).
We adopted two different estimation strategies to obtain the impact of treatment concordance: semi-parametric Cox Proportional Hazard estimator adjusted with a set of measured confounders [14] and non-parametric Kaplan Meier estimator adjusted with Inverse Probability Treatment Weighting (IPTW). We formulated an IPTW, for each sample as [15] and estimated non-parametrically and using a logistic regression model (R stats v4.0.2 [16]) in a 10-fold cross-fitting. A set of measured confounders (i.e., ) included patients’ sex, age, OncoNPC prediction uncertainty (in entropy), sequencing panel (i.e., OncoPanel) version, mutational burden, CNA burden, subsets of OncoNPC predicted cancer types and metastasis sites, and finally pathological histology (e.g., adenocarcinoma tumor or neuroendocrine tumor). Since patients with CUP who met the treatment criteria but did not receive clinical panel sequencing (i.e., entry criterion) could not be included in the analysis, we adjusted for the left truncation by defining the risk set at time , which corresponds to the set of patients followed up in the analysis up to time as follows
, where is the entry time of patient . With the independent entry assumption as stated before, we obtained survival function from Kaplan-Meier estimator as follows
In this formulation, each individual is weighted by the corresponding IPTW, , and we obtained two different survival functions for the treatment concordant and discordant groups. The adjusted Kaplan-Meier estimator provides a consistent estimate of the survival function for each group under the assumptions stated above [15]. Once we obtained the survival estimates for the two groups, we used a weighted log-rank test [15] to test for a significant difference in survival.
In the Cox proportional hazard regression framework, we estimated the hazard function of patient as follows: , where and is the number of measured confounders). Under the above identifiability assumptions and validity of the estimation model, is the hazard ratio capturing the causal effect of the treatment concordance . Finally, under the assumption of no ties between event times across the patients, the parameters and are estimated by maximizing the following partial likelihood
[14].
Actionable somatic variants in CUP tumors
We estimated the frequency of known, actionable somatic alterations in each OncoNPC CUP subgroups using the OncoKB knowledge base [17]. We considered 3 different types for somatic variants: oncogenic mutations such as indels, missense mutations, and splice site mutations, amplifications such as high-level amplifications, and finally fusions such as gene-gene and gene-intergenic fusions as specified in OncoKB. For each actionable somatic variant, we assigned one of the four therapeutic levels: level 1 for FDA-approved drugs, level 2 for standard care drugs, level 3 for drugs supported by clinical evidence, and level 4 for drugs supported by biological evidence. Refer to Supplementary File patient_info_treatment_analysis.csv for more details on actionable variants and corresponding genomically-guided treatments.
Extended Data
Extended Data Figure 1: OncoNPC classification performance: confusion matrix, and precision and recall.
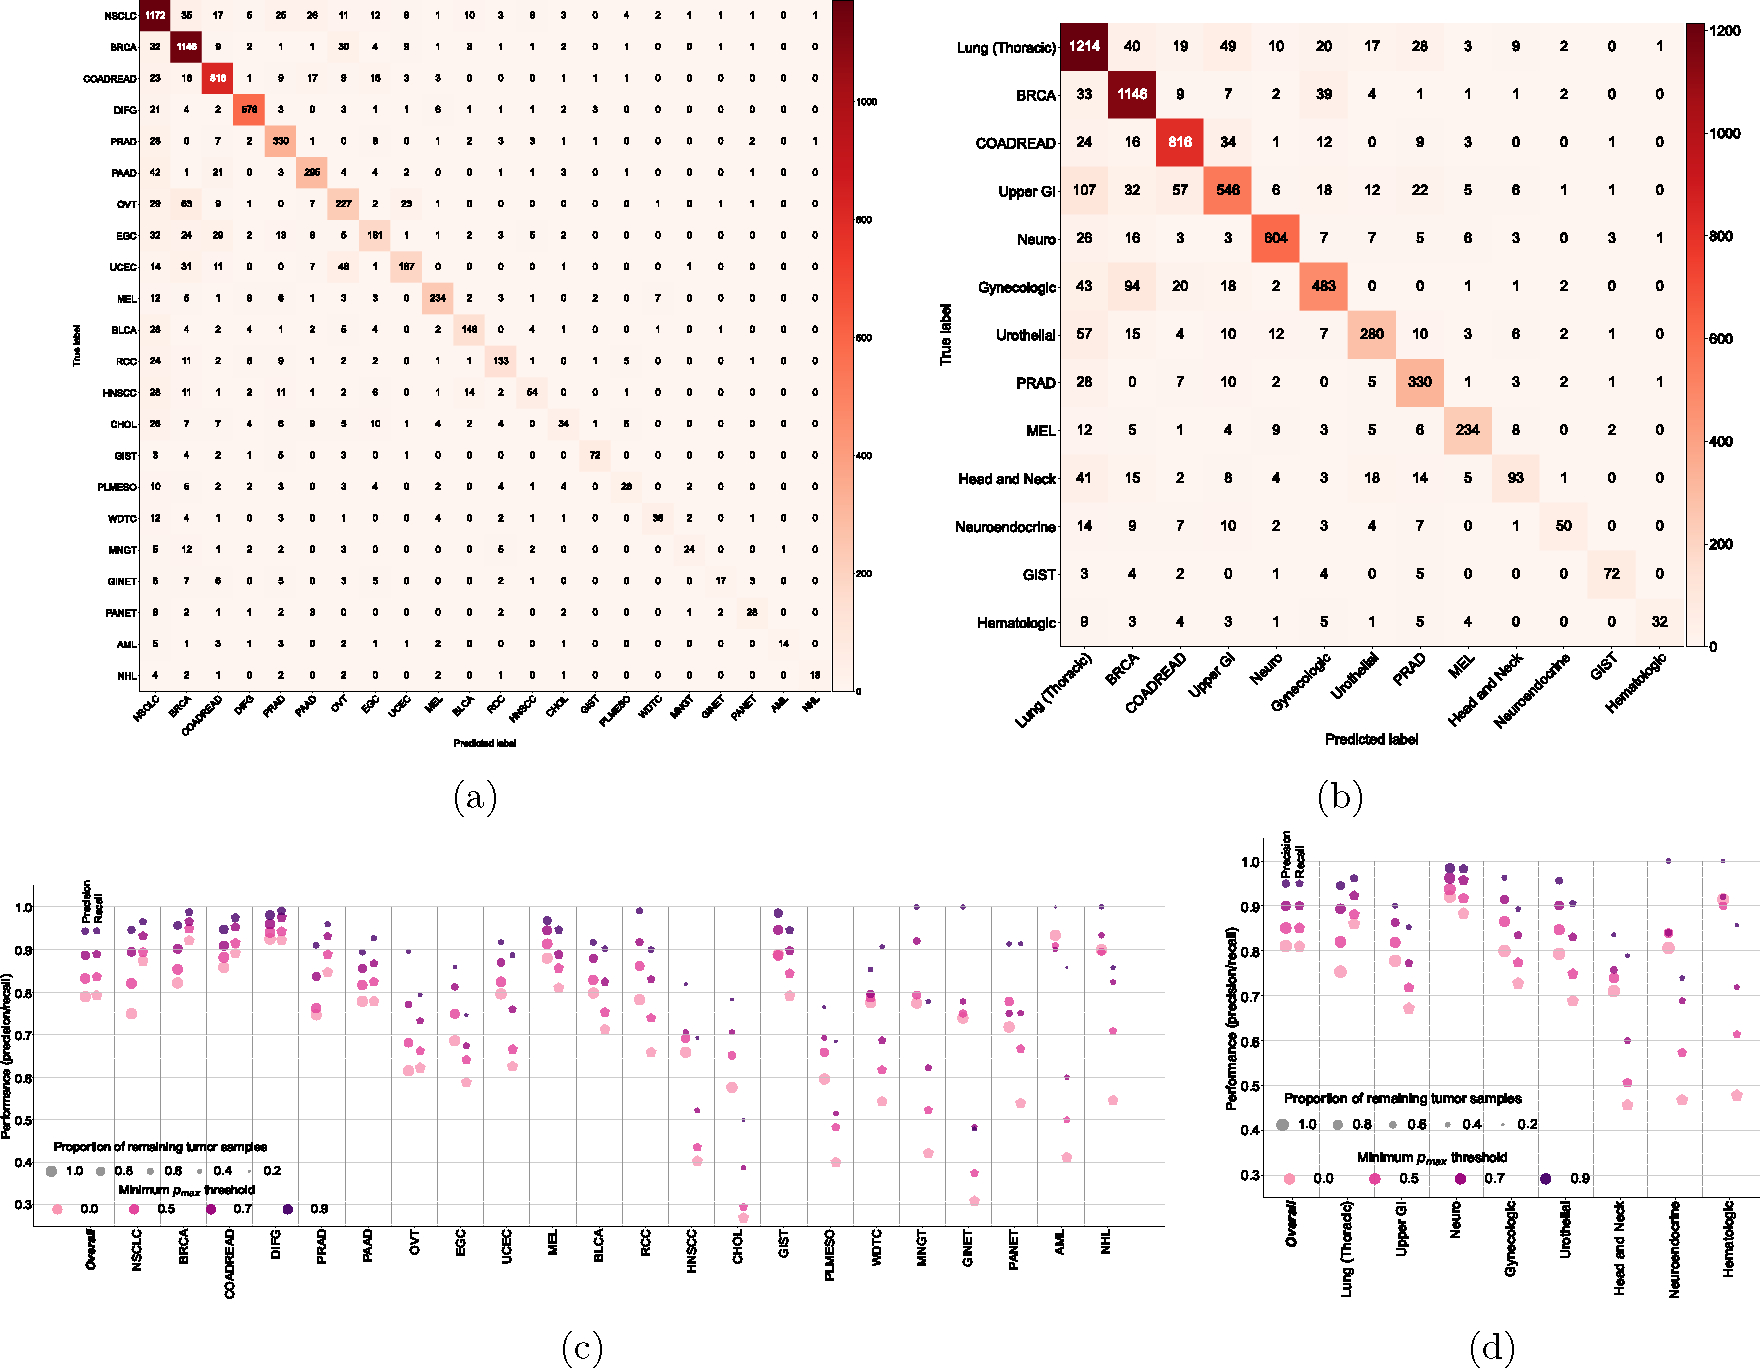
Confusion matrices on the held-out test set (n = 7,289) for (a) 22 detailed cancer types and (b) 13 cancer groups (see Table 1). (c), (d) OncoNPC performance in precision and recall on the test set across (c) cancer types and (d) cancer groups at 4 different prediction confidences using pmax as a threshold. Each dot size is scaled by the proportion of tumor samples retained. In (d), we only considered cancer groups that have more than one cancer type. Overall scores were weighted according to the number of confirmed cases across cancer types and cancer groups, respectively.
Extended Data Figure 2: OncoNPC prediction performance and prediction confidence levels (i.e., pmax) across different cohorts and centers.
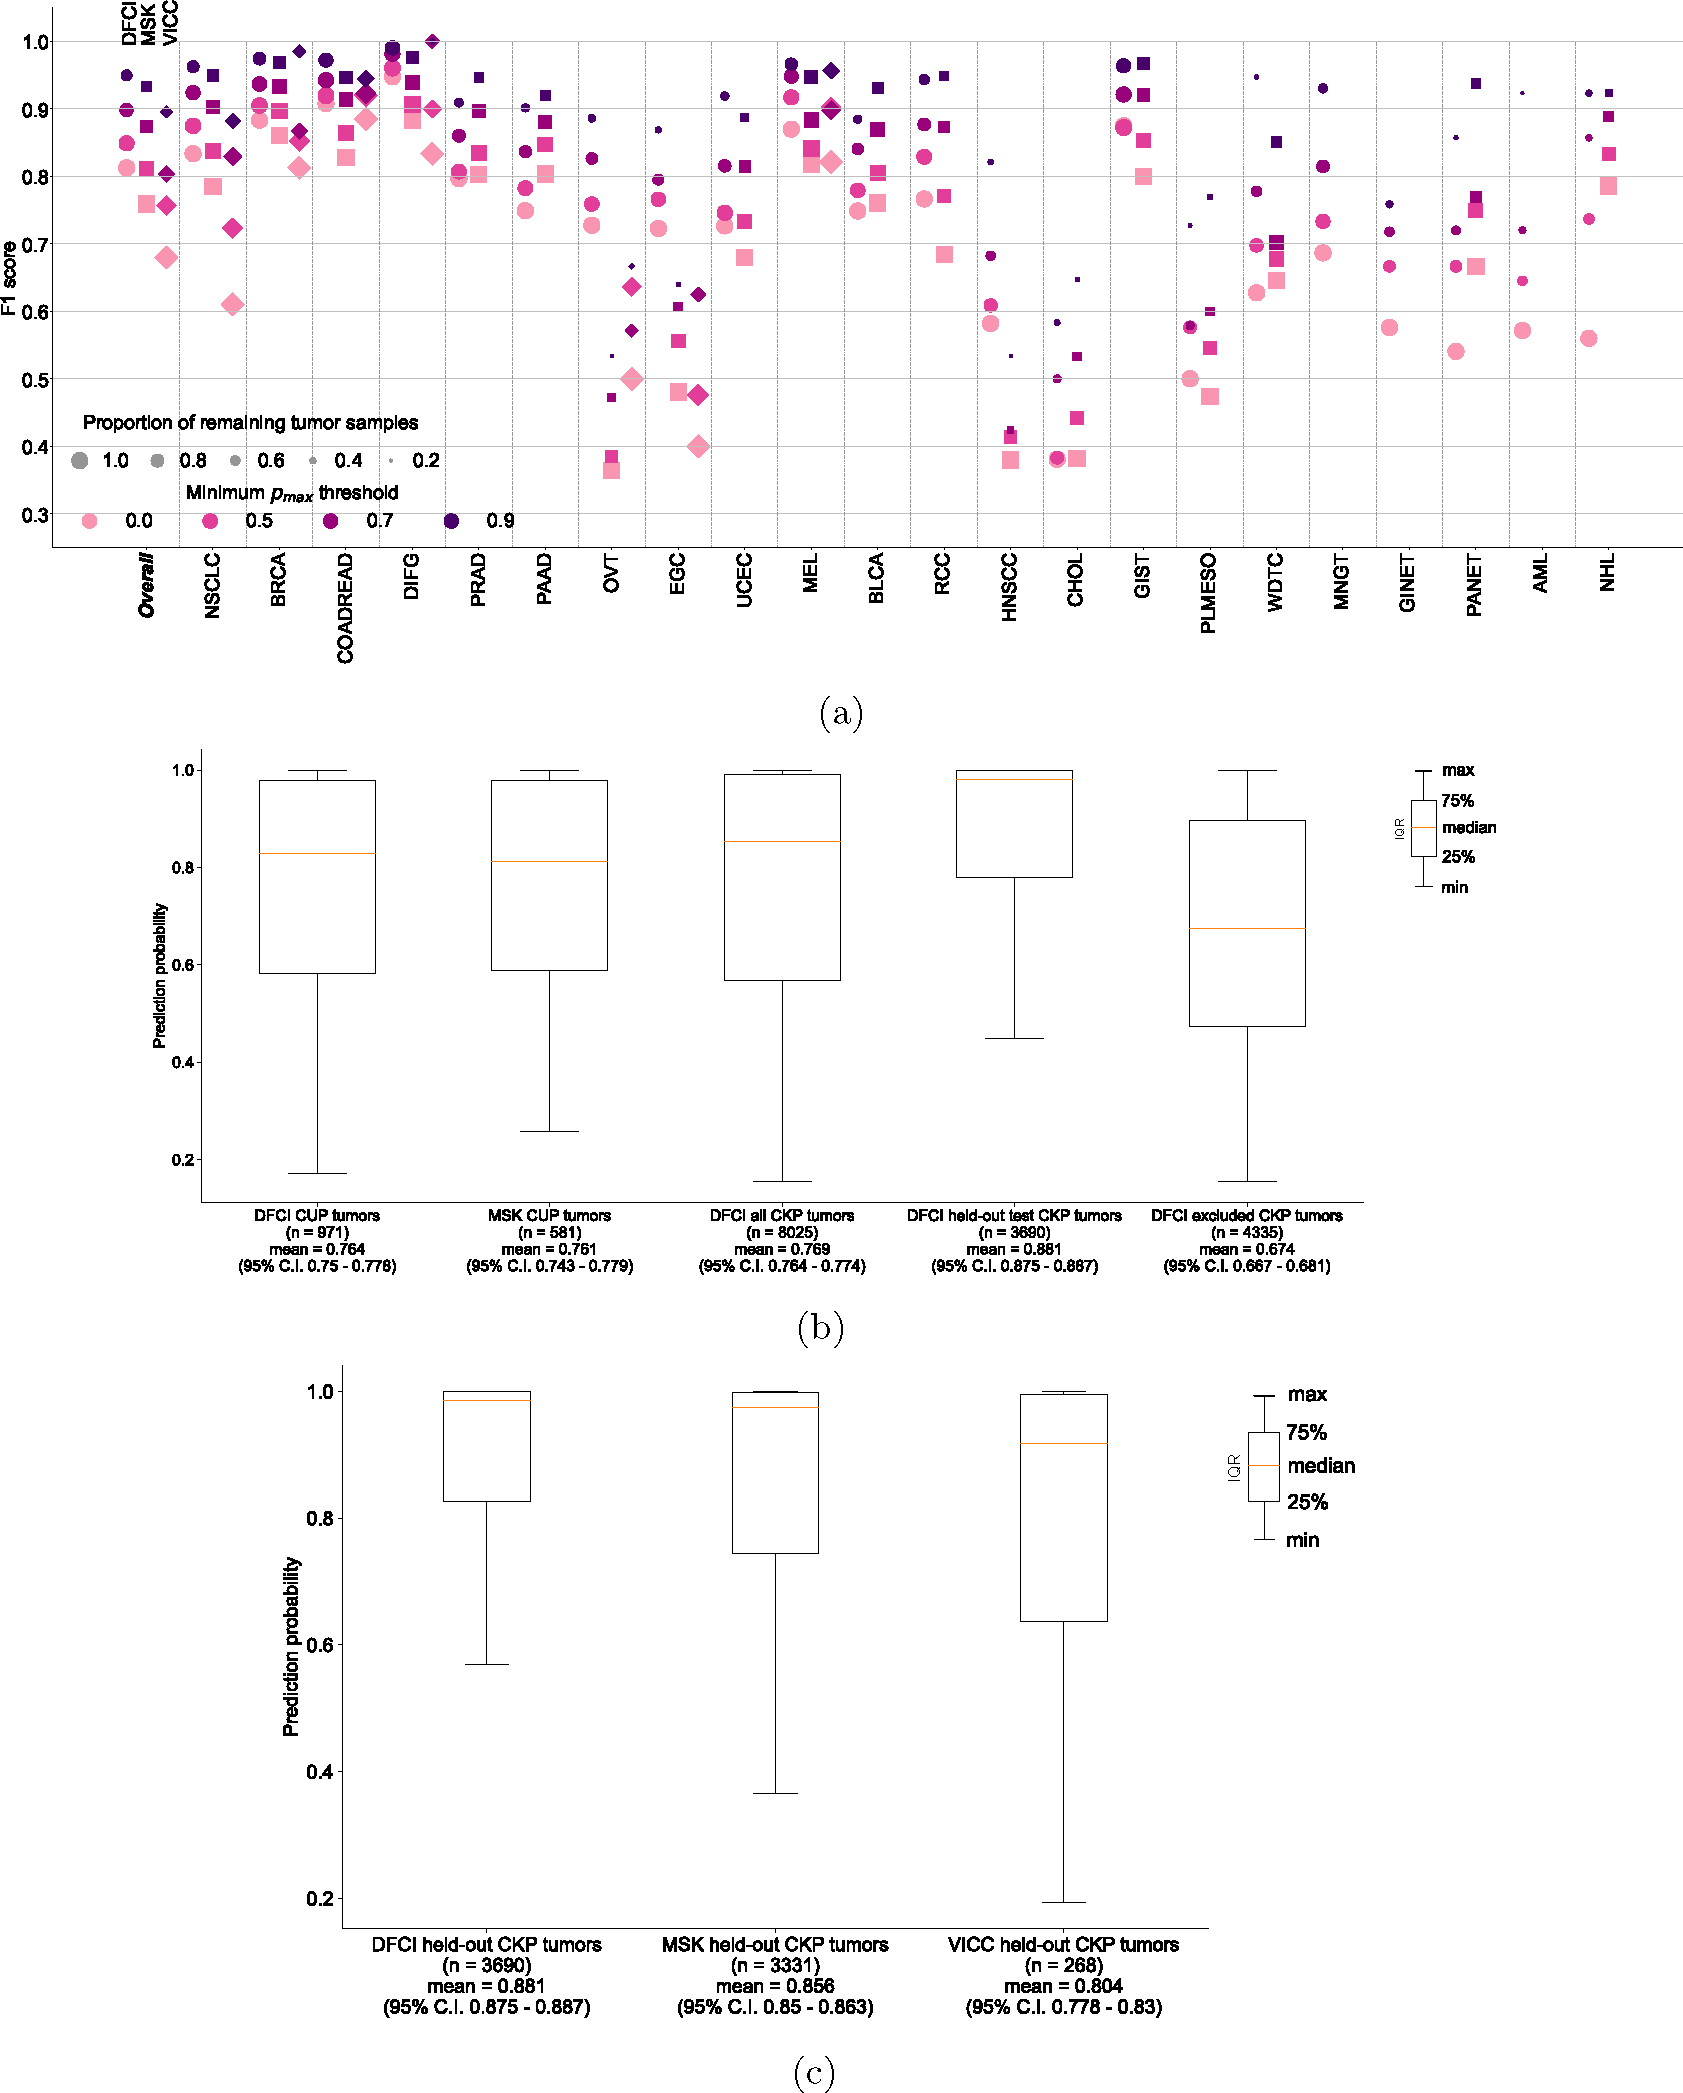
(a) Center-specific OncoNPC performance (in F1) on the test CKP tumor samples (n = 7,289). The figure is a breakdown of Main Fig. 2c based on cancer center (DFCI: ◯, MSK: ◻, VICC: ◇). The performance was evaluated at 4 different prediction confidences (i.e., minimum pmax thresholds). Each dot size is scaled by the proportion of tumor samples retained. See Supplementary Table S3 for the center-specific number of test CKP tumor samples broken down by cancer types and prediction confidence thresholds. (b), (c) Box plots of prediction confidences (pmax) across (b) DFCI CUP tumors, MSK CUP tumors, all DFCI CKP tumors (including those with cancer types not modeled in OncoNPC), DFCI held-out CKP tumors, and DFCI excluded CKP tumors (specifically those with cancer types not modeled in OncoNPC), and (c) DFCI held-out CKP tumors, MSK held-out CKP tumors, and VICC held-out CKP tumors. Note that DFCI excluded CKP tumors refers to the cohort of the rare CKP tumors whose cancer types were not considered during the development of OncoNPC. All cohorts in the analysis for (b) and (c) were not seen by OncoNPC during the model training
Extended Data Figure 3: Robustness of OncoNPC performance with respect to input genomics features.
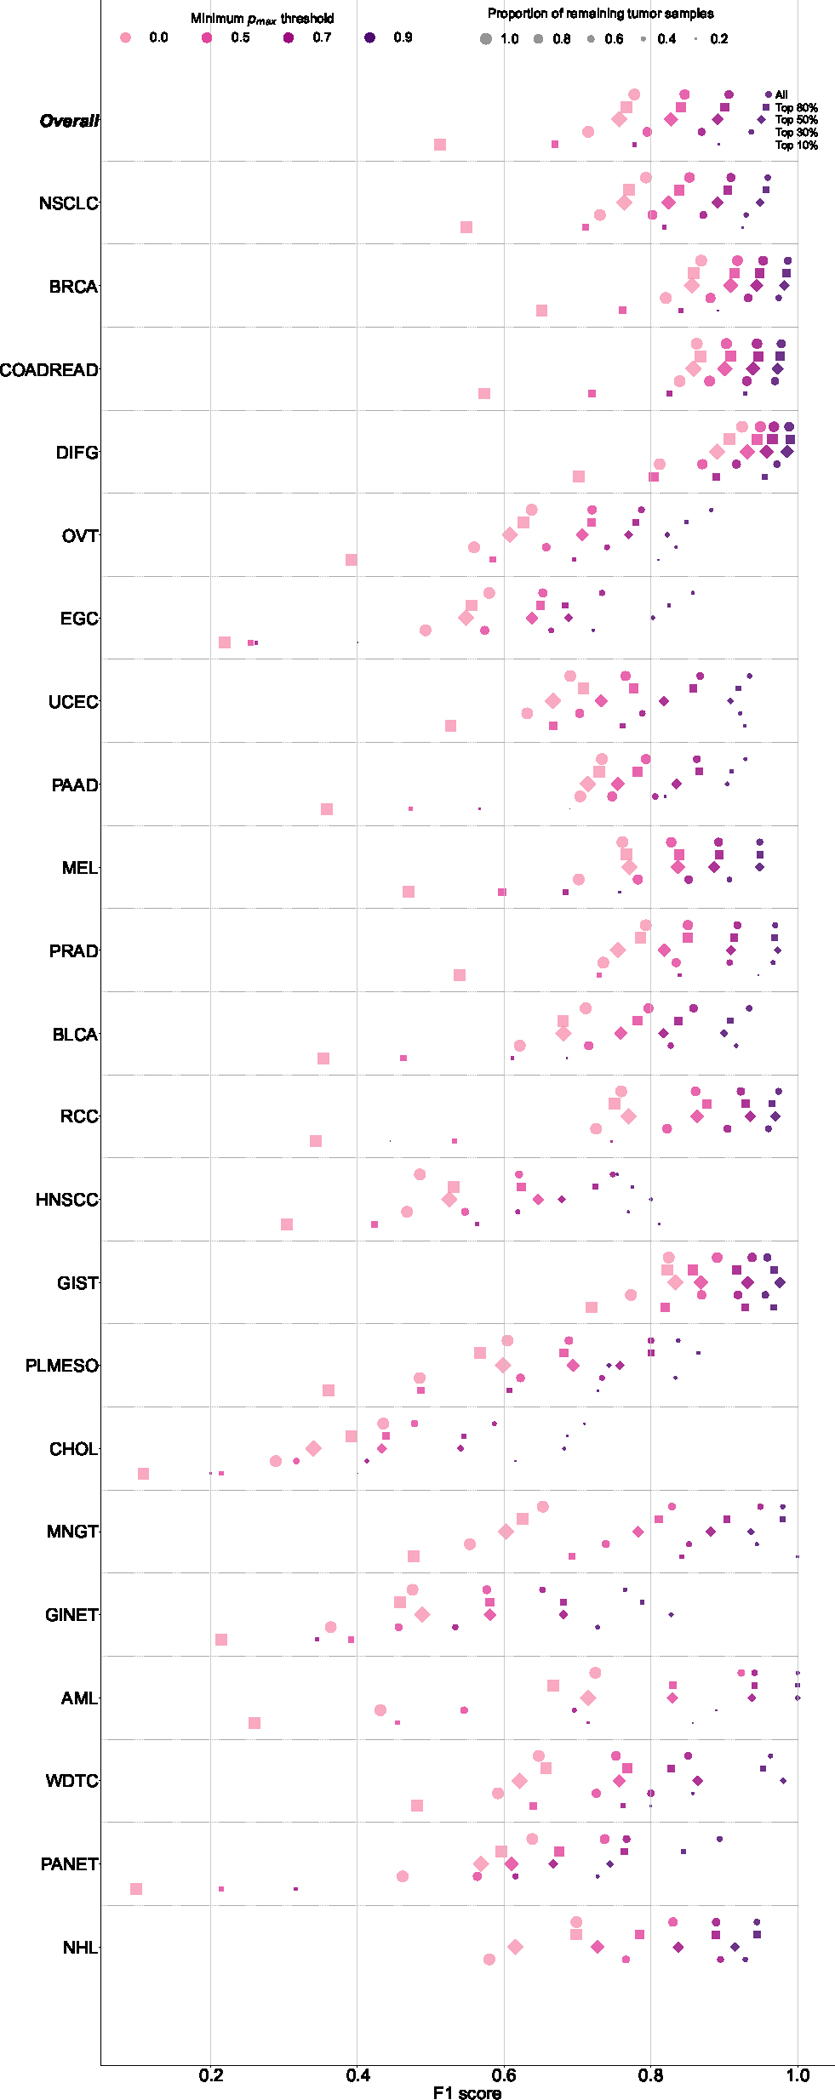
The figure shows the breakdown of OncoNPC performance in F1 score by 22 cancer types across increasing prediction confidence. The cancer types on the y-axis are sorted in a decreasing order of the number of tumor samples. In order to investigate the impact of input genomics features on OncoNPC’s robustness, we performed a feature ablation study, where we chose the most important genes based on their aggregated SHAP values and gradually reduced them from all 846 features associated with those genes, as well as age and sex, to only the top 10% (i.e., top 29 features). In each feature configuration, we re-trained the model with the same set of hyperparameters and evaluated its performance on the held-out CKP tumor samples (n = 7,289), which were utilized throughout this work. Supplementary File features_in_each_config_ablation_study.csv, provides a list of input features that correspond to the selected genes in each configuration.
Extended Data Figure 4: Explanation of OncoNPC prediction for a patient with CUP.
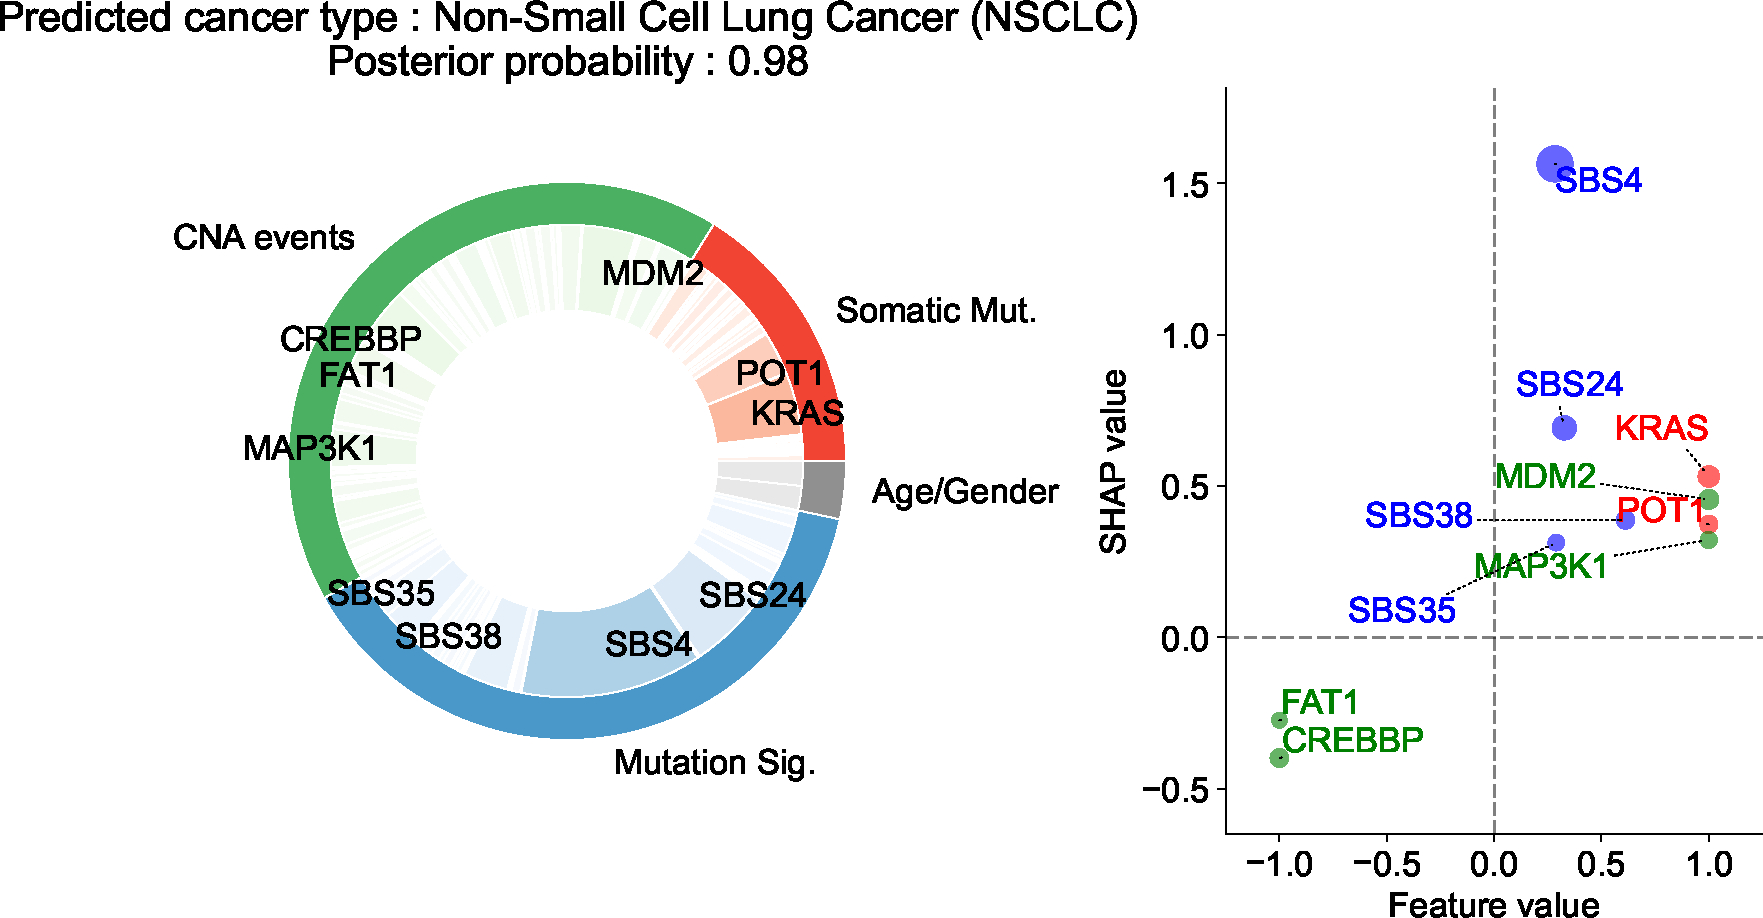
The patient is a 76 year-old male with a tumor biopsy from the liver. The pie chart on the left shows the Top 10 important features across three different feature categories (i.e., CNA events, somatic mutation, and mutation signatures), and the scatter plot on the right shows their SHAP values and feature values. The size of each dot is scaled by corresponding absolute SHAP value. From the chart review, we found that the patient reported a 60-pack year smoking history, as well as having lived near a tar and chemical factory as a child. Despite the CUP diagnosis, OncoNPC confidently classified the primary site as NSCLC with posterior probability of 0.98. SBS4, a tobacco smoking-associated mutation signature, was significantly enriched in the patient’s tumor sample, which has, by far, the most impact on the prediction, followed by SBS24 mutation signature associated with known exposures to aflatoxin, and KRAS mutation.
Extended Data Figure 5: Germline Polygenic Risk Score (PRS) enrichment of CKP tumor samples and CUP tumor samples, broken down by 8 different cancer types.
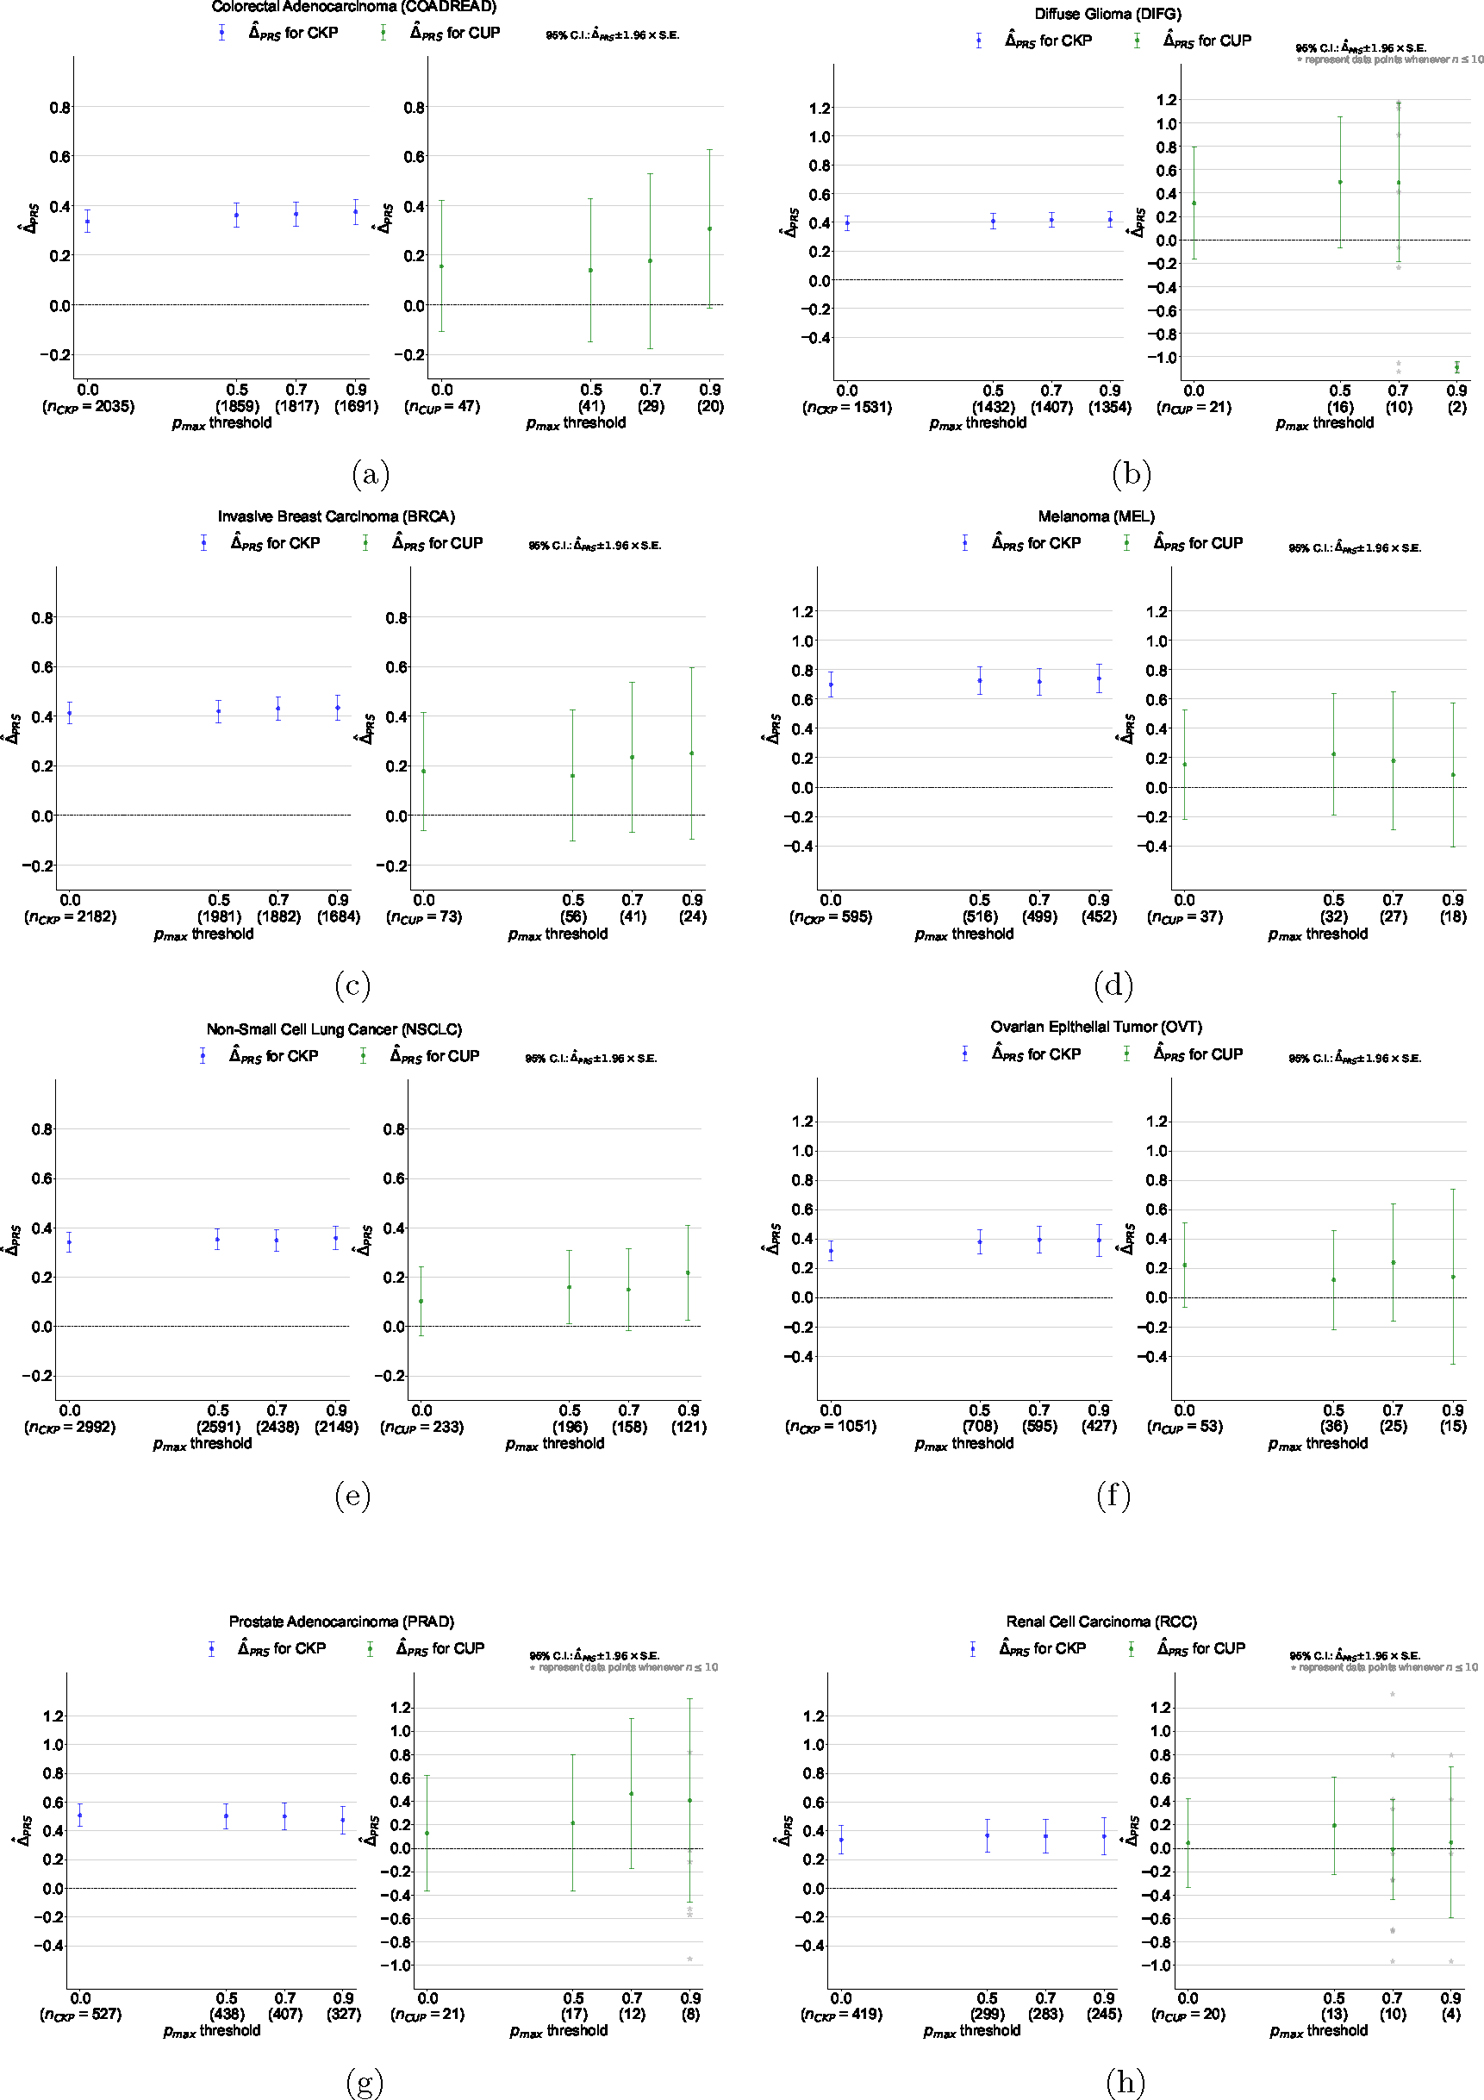
(a) Colorectal Adenocarcinoma (COADREAD), (b) Diffuse Glioma (DIFG), (c) Invasive Breast Carcinoma (BRCA), (d) Melanoma (MEL), (e) Non-Small Cell Lung Cancer (NSCLC), (f) Ovarian Epithelial Tumor (OVT), (g) Prostate Adenocarcinoma (PRAD), and (h) Renal Cell Carcinoma (RCC). The magnitude of the enrichment is quantified by : the mean difference between the concordant (i.e. OncoNPC matching) cancer type PRS and mean of PRSs of discordant cancer types (see Methods). is shown for CKPs in blue (for reference) and CUPs in green.
Extended Data Figure 6: Exclusion criteria for downstream clinical analyses.
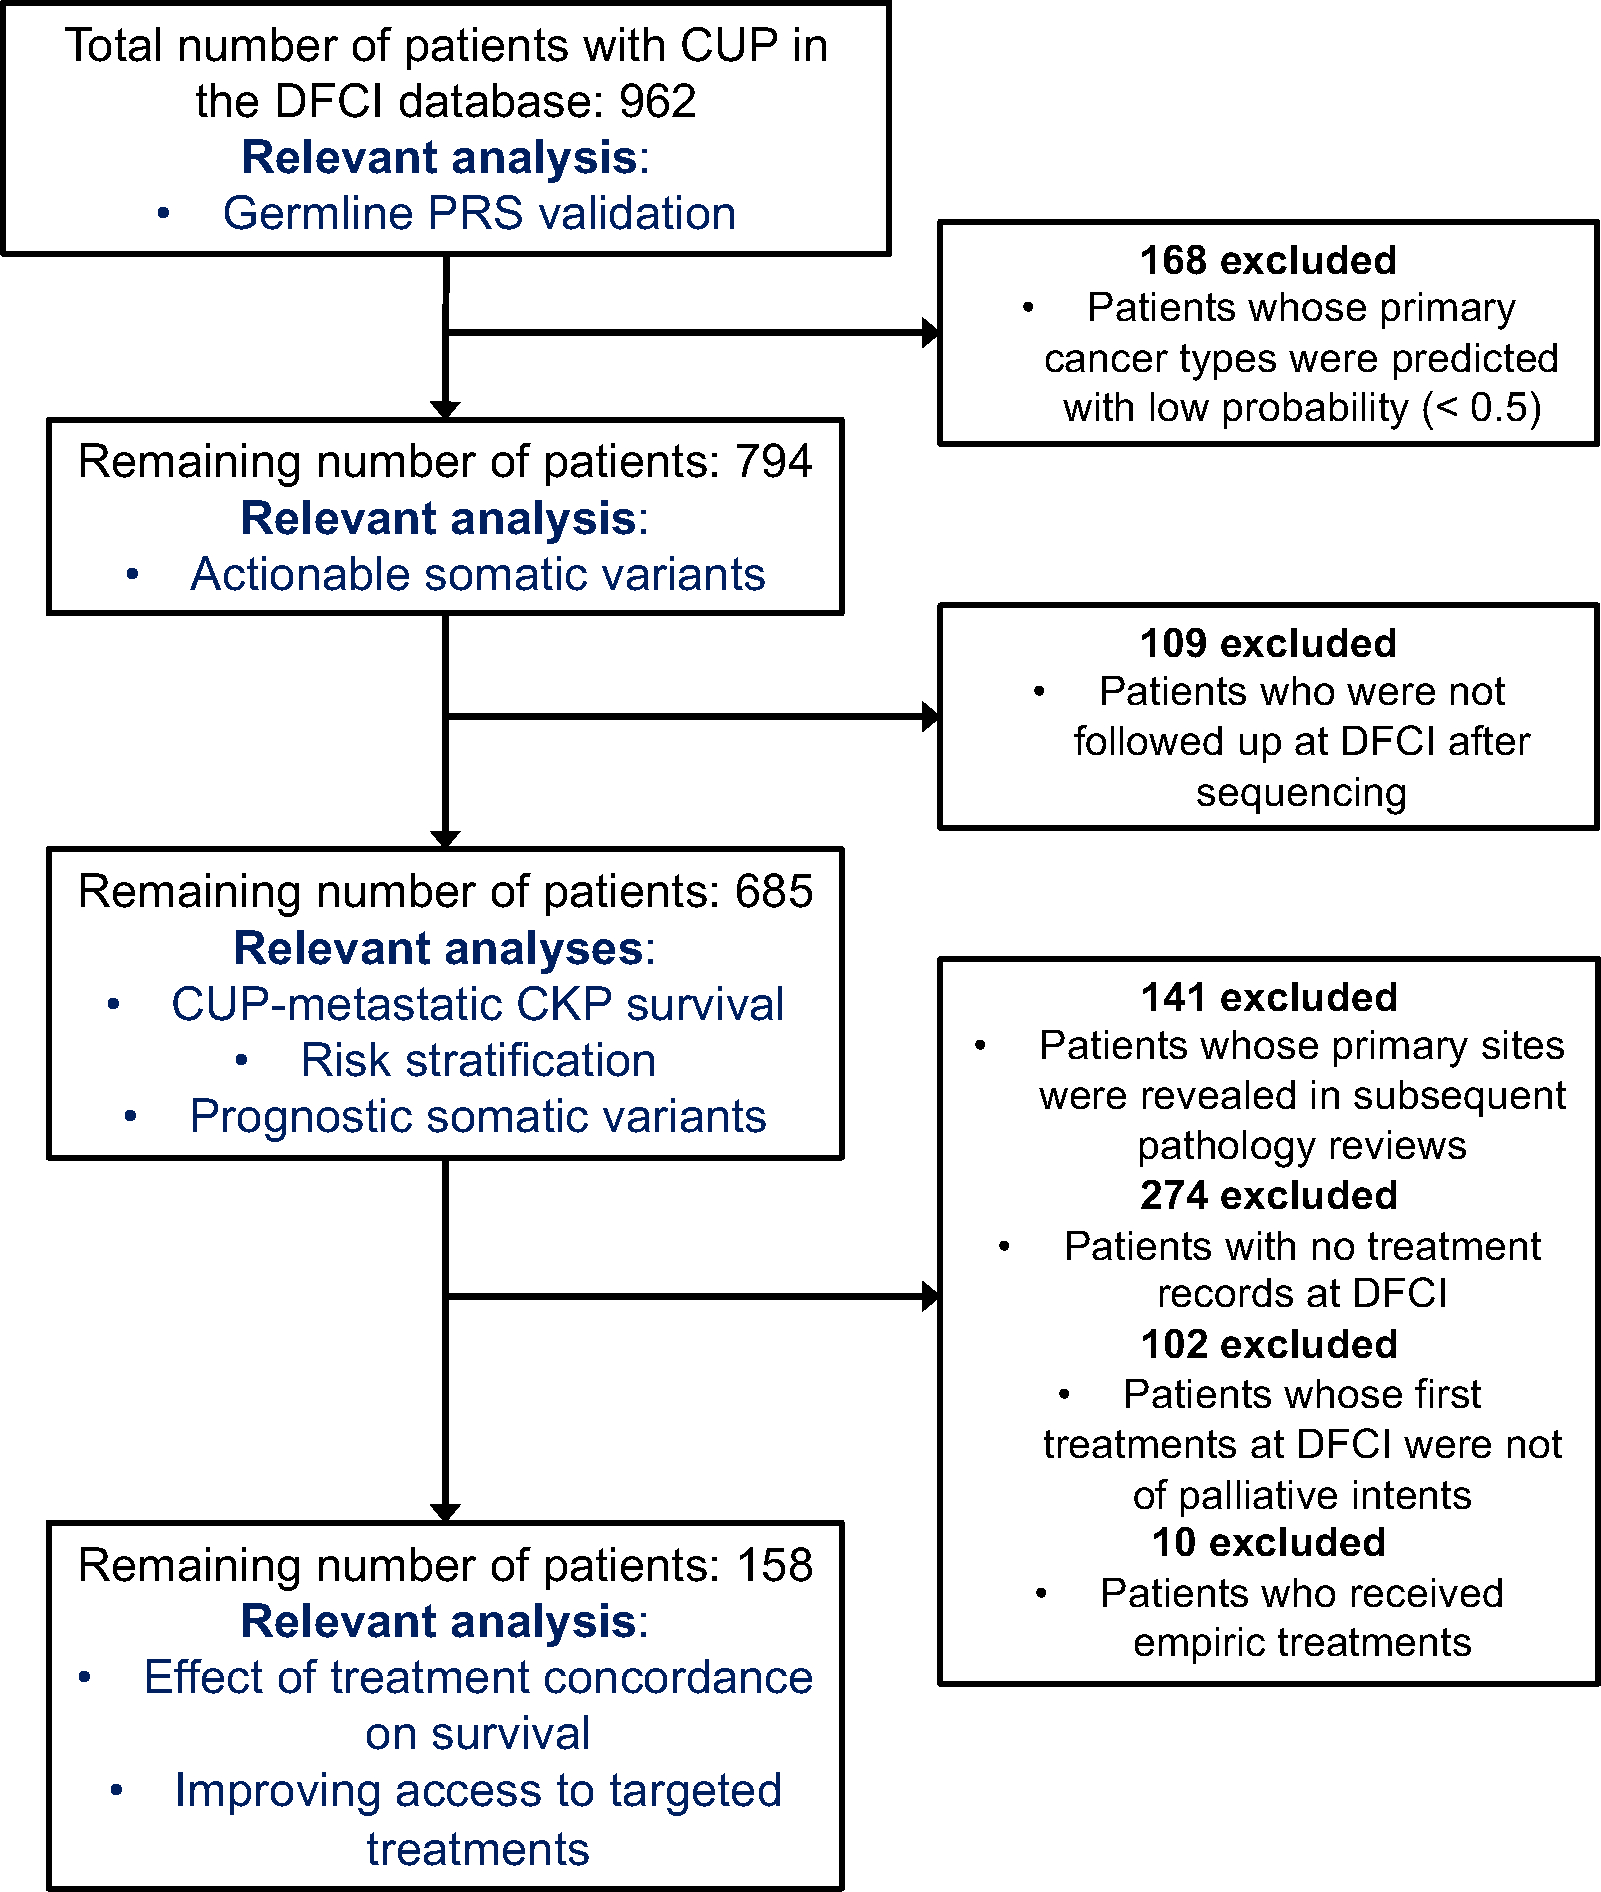
.
Extended Data Figure 7: Estimated survival curves for the concordant and discordant treatment groups among patients with CUP, broken down by OncoNPC predicted cancer types.
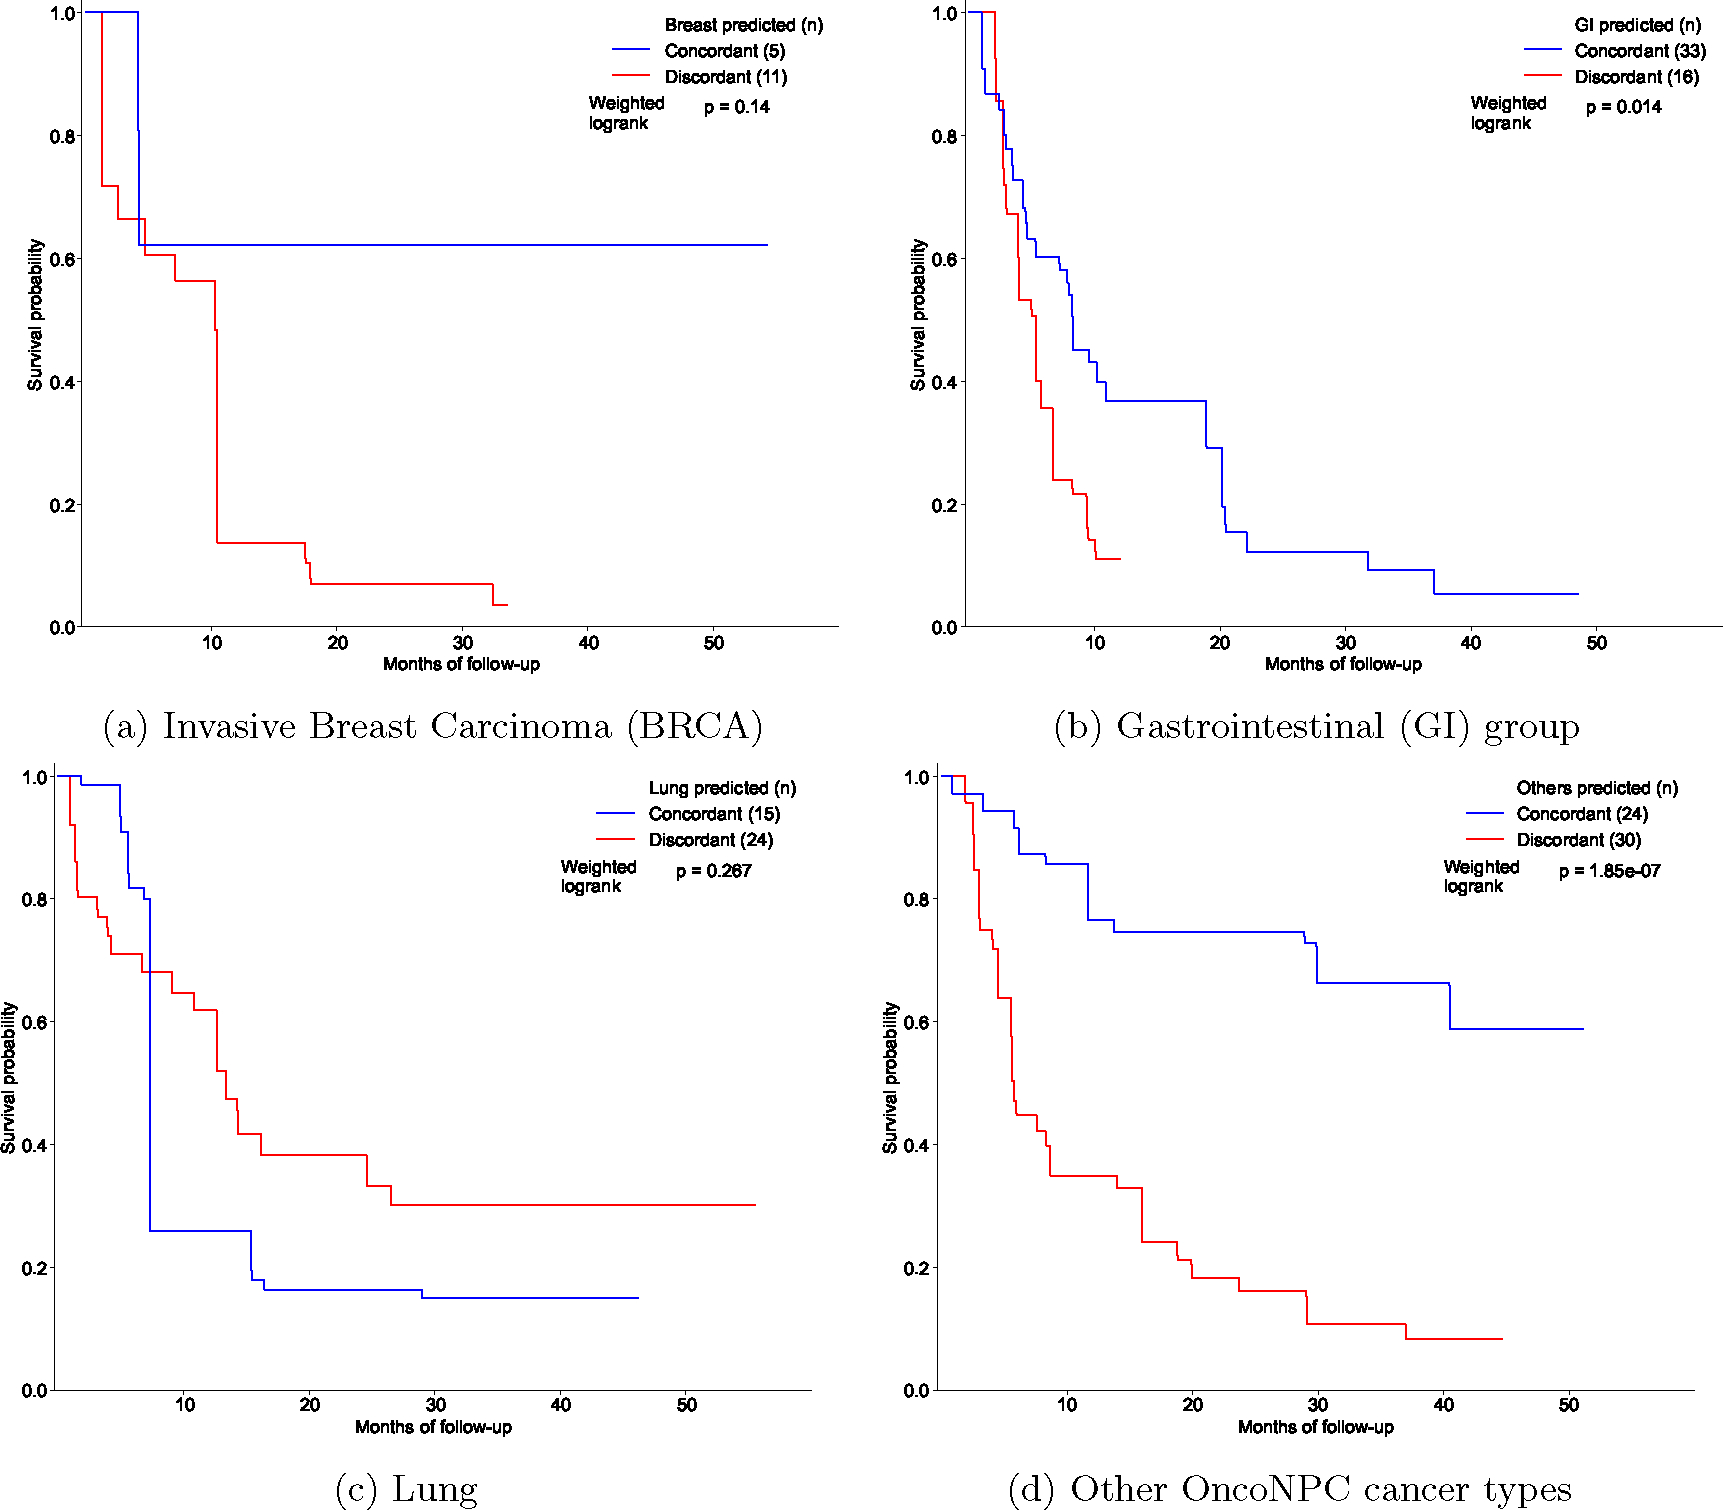
(a) BRCA, (b) Gastrointestinal (GI) group (CHOL, COADREAD, EGC, and PAAD), (c) Lung (NSCLC and PLMESO), and (d) Other OncoNPC cancer types (BLCA, DIFG, GINET, HNSCC, MEL, OVT, PANET, PRAD, RCC, and UCEC). In each figure, the concordant treatment group and discordant treatment group are shown in blue and red, respectively. To estimate each survival curve, we utilized Inverse Probability of Treatment Weighted (IPTW) Kaplan-Meier estimator while adjusting for patient covariates and left truncation until time of sequencing (see Methods). Statistical significance of the survival difference between the two groups was estimated by a weighted log-rank test.
Extended Data Figure 8: Estimated survival curves for the concordant and discordant treatment groups among patients with CUP who received their initial treatments after the results of the OncoPanel sequencing were available to clinicians.
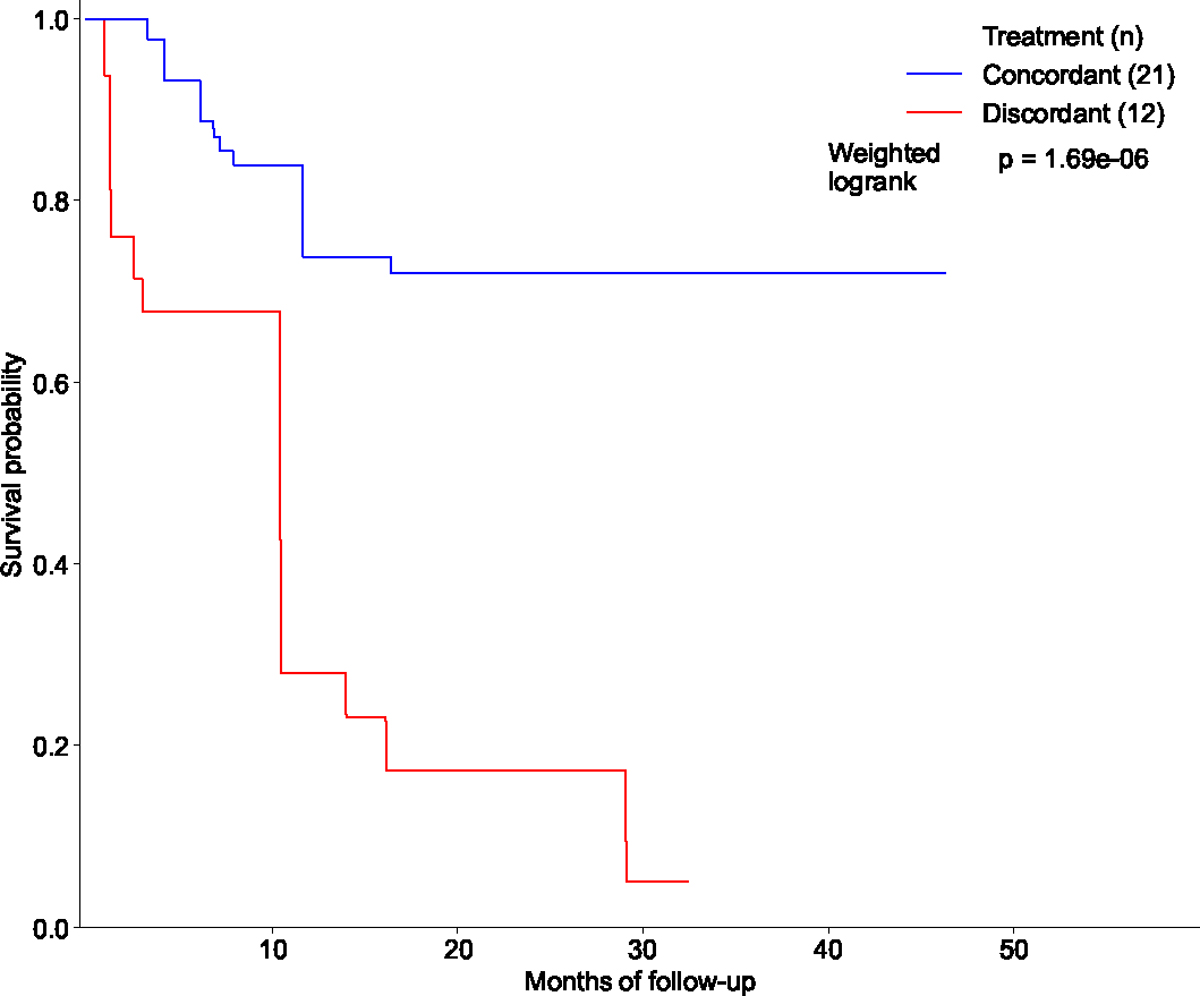
Similarly, we utilized Inverse Probability of Treatment Weighted (IPTW) Kaplan-Meier estimator for each survival curve while adjusting for patient covariates and left truncation until time of sequencing (see Methods). Statistical significance of the survival difference between the two groups was estimated by a weighted log-rank test. Refer to Supplementary Table S2 for demographic information on the cohort.
Extended Data Figure 9: OncoNPC-guided actionable variants in patients with CUP.

(a) The number of CUP tumors with actionable targets, based on OncoKB (see Methods), across actionable somatic variants (mutations, amplifications, and fusions). Each bar corresponds to an actionable target, color-coded by the number of CUP tumors in each predicted cancer type. Note that each tumor may contain more than one actionable somatic variant. (b) Proportions of CUP tumor samples with actionable somatic variants (Naction) to the total number of patients (Ntotal) across OncoNPC predicted cancer types. Proportions for 4 different therapeutic levels based on OncoKB, are shown in each bar: Level 1 - FDA-approved drugs, Level 2 – standard of care drugs, Level 3 - drugs supported by clinical evidence, and Level 4 - drugs supported by biological evidence.
Extended Data Table 1:
Demographic details of patients with CUP in the concordant and discordant treatment groups. The OncoNPC predicted cancer groups, except for the GI group, match the cancer groups defined in Main Table 1. The GI group in this analysis consists of the upper GI group, including Cholangiocarcinoma (CHOL), Esophagogastric Adenocarcinoma (EGC), and Pancreatic Adenocarcinoma (PAAD), as well as Colorectal Adenocarcinoma (COADREAD).
| Concordant treatment group (n = 77) | Discordant treatment group (n = 81) | |
|---|---|---|
|
| ||
| Sex; male-female ratio | 0.442–0.558 | 0.556–0.444 |
| Age at seqeuncing (95% C.I.) | 64 (61.6 – 66.4) | 62 (59.4 – 64.6) |
| OncoNPC prediction uncertainty (in entropy; 95% C.I.) | 0.550 (0.426 – 0.675) | 0.988 (0.850 – 1.127) |
|
| ||
| OncoPanel version (proportion in %) | ||
|
| ||
| v1 | 1 (1.30%) | 1 (1.24%) |
| v2 | 9 (11.7%) | 15 (18.5%) |
| v3 | 67 (87.0%) | 65 (80.2%) |
|
| ||
| Mutational burden (95% C.I.) | 0.027 (0.021 – 0.033) | 0.033 (0.027 – 0.040) |
| CNA burden (95% C.I.) | 0.201 (0.166 – 0.236) | 0.186 (0.155 – 0.217) |
|
| ||
| OncoNPC predicted cancer groups (proportion in %) | ||
|
| ||
| Lung | 15 (19.5%) | 24 (29.6%) |
| Breast | 5 (6.50%) | 11 (13.6%) |
| GI | 33 (42.9%) | 16 (19.8%) |
| Gyn | 9 (11.7%) | 5 (6.17%) |
| Others | 15 (19.5%) | 25 (31.0%) |
|
| ||
| Metastatic sites (proportion in %) | ||
|
| ||
| Brain | 4 (5.20%) | 8 (9.88%) |
| Bone | 7 (9.10%) | 10 (12.3%) |
| Soft tissue | 6 (7.79%) | 5 (6.17%) |
| Others | 60 (77.9%) | 58 (71.6%) |
|
| ||
| Histology (proportion in %) | ||
|
| ||
| Adenocarcinoma | 41 (53.2%) | 32 (39.5%) |
| Neuroendocrine | 9 (11.7%) | 11 (13.6%) |
| Squamous cell | 2 (2.60%) | 6 (7.41%) |
| Others | 25 (32.5%) | 32 (39.5%) |
|
| ||
| Treatment start date (95% C.I.) | 2018–4–30 (2017–12–24 – 2018–9–3) | 2018–3–1 (2017–10–28 – 2018–7–3) |
Supplementary Material
Acknowledgments
The participation of patients and the efforts of an institutional data collection system made this study possible, and we are grateful for their contributions. We would also like to express our appreciation to the DFCI Oncology Data Retrieval System (OncDRS) and AACR Project GENIE team for their role in aggregating, managing, and delivering the data used in this project.
IM and AG were supported by R01 CA227237, R01 CA244569, as well as grants from The Louis B. Mayer Foundation, The Doris Duke Charitable Foundation, The Phi Beta Psi Sorority, and The Emerson Collective. The funders had no role in study design, data collection and analysis, decision to publish or preparation of the manuscript.
Footnotes
Competing Interests Statement
The authors declare no competing interests.
Code Availability
We utilized the R (v4.0.2) and Python (v3.9.13) programming languages for OncoNPC feature processing (R deconstructSigs v1.8.0), OncoNPC model development and interpretation (Python xgboost v1.2.0, shap v0.41.0), and survival analysis (R survival v3.2.7, stats v4.0.2, Python lifelines v0.27.4, scipy v1.7.1). Please see https://github.com/itmoon7/onconpc for the pre-processing script, the fully trained OncoNPC model, a notebook demonstration on how to use OncoNPC, and other reference materials.
Data Availability
The multicenter NGS tumor panel sequencing data is available upon request at the AACR Project GENIE website: https://www.aacr.org/professionals/research/aacr-project-genie/. The fully trained OncoNPC model, processed somatic variants data from Profile DFCI, and de-identified clinical data used in the treatment concordance analysis are available in https://github.com/itmoon7/onconpc.
References
- [1].Pavlidis N, Khaled H, and Gaafar R, “A mini review on cancer of unknown primary site: A clinical puzzle for the oncologists,” Journal of advanced research, vol. 6, no. 3, pp. 375–382, 2015. [DOI] [PMC free article] [PubMed] [Google Scholar]
- [2].Varadhachary GR and Raber MN, “Cancer of unknown primary site,” New England Journal of Medicine, vol. 371, no. 8, pp. 757–765, 2014. [DOI] [PubMed] [Google Scholar]
- [3].Hyman DM et al. , “Vemurafenib in multiple nonmelanoma cancers with braf v600 mutations,” New England Journal of Medicine, vol. 373, no. 8, pp. 726–736, 2015. [DOI] [PMC free article] [PubMed] [Google Scholar]
- [4].Hainsworth JD and Greco FA, “Cancer of unknown primary site: New treatment paradigms in the era of precision medicine,” American Society of Clinical Oncology Educational Book, vol. 38, pp. 20–25, 2018. [DOI] [PubMed] [Google Scholar]
- [5].Anderson GG and Weiss LM, “Determining tissue of origin for metastatic cancers: Meta-analysis and literature review of immunohistochemistry performance,” Applied Immunohistochemistry & Molecular Morphology, vol. 18, no. 1, pp. 3–8, 2010. [DOI] [PubMed] [Google Scholar]
- [6].Oien K and Dennis J, “Diagnostic work-up of carcinoma of unknown primary: From immunohistochemistry to molecular profiling,” Annals of Oncology, vol. 23, pp. x271–x277, 2012. [DOI] [PubMed] [Google Scholar]
- [7].Moran S et al. , “Epigenetic profiling to classify cancer of unknown primary: A multicentre, retrospective analysis,” The Lancet Oncology, vol. 17, no. 10, pp. 1386–1395, 2016. [DOI] [PubMed] [Google Scholar]
- [8].Jiao W et al. , “A deep learning system accurately classifies primary and metastatic cancers using passenger mutation patterns,” Nature communications, vol. 11, no. 1, p. 728, 2020. [DOI] [PMC free article] [PubMed] [Google Scholar]
- [9].Penson A et al. , “Development of genome-derived tumor type prediction to inform clinical cancer care,” JAMA oncology, vol. 6, no. 1, pp. 84–91, 2020. [DOI] [PMC free article] [PubMed] [Google Scholar]
- [10].He B et al. , “A neural network framework for predicting the tissue-of-origin of 15 common cancer types based on rna-seq data,” Frontiers in Bioengineering and Biotechnology, vol. 8, p. 737, 2020. [DOI] [PMC free article] [PubMed] [Google Scholar]
- [11].Nguyen L, Van Hoeck A, and Cuppen E, “Machine learning-based tissue of origin classification for cancer of unknown primary diagnostics using genome-wide mutation features,” Nature communications, vol. 13, 2022. [DOI] [PMC free article] [PubMed] [Google Scholar]
- [12].Posner A et al. , “A comparison of dna sequencing and gene expression profiling to assist tissue of origin diagnosis in cancer of unknown primary,” The Journal of Pathology, vol. 259, no. 1, pp. 81–92, 2023. [DOI] [PMC free article] [PubMed] [Google Scholar]
- [13].Zhao Y et al. , “Cup-ai-dx: A tool for inferring cancer tissue of origin and molecular subtype using rna gene-expression data and artificial intelligence,” EBioMedicine, vol. 61, p. 103030, 2020. [DOI] [PMC free article] [PubMed] [Google Scholar]
- [14].A. P. G. Consortium et al. , “Aacr project genie: Powering precision medicine through an international consortium,” Cancer discovery, vol. 7, no. 8, pp. 818–831, 2017. [DOI] [PMC free article] [PubMed] [Google Scholar]
- [15].Hainsworth JD et al. , “Molecular gene expression profiling to predict the tissue of origin and direct site-specific therapy in patients with carcinoma of unknown primary site: A prospective trial of the sarah cannon research institute,” Journal of Clinical Oncology, vol. 31, no. 2, pp. 217–223, 2013. [DOI] [PubMed] [Google Scholar]
- [16].Yoon H et al. , “Gene expression profiling identifies responsive patients with cancer of unknown primary treated with carboplatin, paclitaxel, and everolimus: Ncctg n0871 (alliance),” Annals of Oncology, vol. 27, no. 2, pp. 339–344, 2016. [DOI] [PMC free article] [PubMed] [Google Scholar]
- [17].Hayashi H et al. , “Site-specific and targeted therapy based on molecular profiling by next-generation sequencing for cancer of unknown primary site: A nonrandomized phase 2 clinical trial,” JAMA oncology, vol. 6, no. 12, pp. 1931–1938, 2020. [DOI] [PMC free article] [PubMed] [Google Scholar]
- [18].Hayashi H et al. , “Randomized phase ii trial comparing site-specific treatment based on gene expression profiling with carboplatin and paclitaxel for patients with cancer of unknown primary site,” Journal of Clinical Oncology, vol. 37, no. 7, pp. 570–579, 2019. [DOI] [PubMed] [Google Scholar]
- [19].Conway A-M, Mitchell C, and Cook N, “Challenge of the unknown: How can we improve clinical outcomes in cancer of unknown primary?” Journal of clinical oncology: official journal of the American Society of Clinical Oncology, vol. 37, no. 23, pp. 2089–2090, 2019. [DOI] [PubMed] [Google Scholar]
- [20].Chen T and Guestrin C, “Xgboost: A scalable tree boosting system,” in Proceedings of the 22nd acm sigkdd international conference on knowledge discovery and data mining, 2016, pp. 785–794. [Google Scholar]
- [21].Bochtler T and Krämer A, “Does cancer of unknown primary (cup) truly exist as a distinct cancer entity?” Frontiers in oncology, vol. 9, p. 402, 2019. [DOI] [PMC free article] [PubMed] [Google Scholar]
- [22].Lundberg SM et al. , “From local explanations to global understanding with explainable ai for trees,” Nature machine intelligence, vol. 2, no. 1, pp. 56–67, 2020. [DOI] [PMC free article] [PubMed] [Google Scholar]
- [23].Tate JG et al. , “Cosmic: The catalogue of somatic mutations in cancer,” Nucleic acids research, vol. 47, no. D1, pp. D941–D947, 2019. [DOI] [PMC free article] [PubMed] [Google Scholar]
- [24].da Cunha Santos G, Shepherd FA, and Tsao MS, “Egfr mutations and lung cancer,” Annual Review of Pathology: Mechanisms of Disease, vol. 6, pp. 49–69, 2011. [DOI] [PubMed] [Google Scholar]
- [25].Zhang Y-L et al. , “The prevalence of egfr mutation in patients with non-small cell lung cancer: A systematic review and meta-analysis,” Oncotarget, vol. 7, no. 48, p. 78985, 2016. [DOI] [PMC free article] [PubMed] [Google Scholar]
- [26].Hecht SS, “Tobacco smoke carcinogens and lung cancer,” JNCI: Journal of the National Cancer Institute, vol. 91, no. 14, pp. 1194–1210, 1999. [DOI] [PubMed] [Google Scholar]
- [27].Dirican E, Akkiprik M, and Özer A, “Mutation distributions and clinical correlations of pik3ca gene mutations in breast cancer,” Tumor Biology, vol. 37, pp. 7033–7045, 2016. [DOI] [PubMed] [Google Scholar]
- [28].Elsheikh S et al. , “Ccnd1 amplification and cyclin d1 expression in breast cancer and their relation with proteomic subgroups and patient outcome,” Breast cancer research and treatment, vol. 109, no. 2, pp. 325–335, 2008. [DOI] [PubMed] [Google Scholar]
- [29].Kim J et al. , “Unfavourable prognosis associated with k-ras gene mutation in pancreatic cancer surgical margins,” Gut, vol. 55, no. 11, pp. 1598–1605, 2006. [DOI] [PMC free article] [PubMed] [Google Scholar]
- [30].Luo J, “Kras mutation in pancreatic cancer,” in Seminars in oncology, Elsevier, vol. 48, 2021, pp. 10–18. [DOI] [PMC free article] [PubMed] [Google Scholar]
- [31].Conway AM, Mitchell C, Kilgour E, Brady G, Dive C, and Cook N, “Br J CancerMolecular characterisation and liquid biomarkers in Carcinoma of Unknown Primary (CUP): taking the ‘U’ out of ‘CUP’,” Br J Cancer, vol. 120, no. 2, pp. 141–153, Jan. 2019. [DOI] [PMC free article] [PubMed] [Google Scholar]
- [32].Liu R et al. , “Systematic pan-cancer analysis of mutation–treatment interactions using large real-world clinicogenomics data,” Nature Medicine, vol. 28, no. 8, pp. 1656–1661, 2022. [DOI] [PubMed] [Google Scholar]
- [33].Liu R et al. , “Evaluating eligibility criteria of oncology trials using real-world data and ai,” Nature, vol. 592, no. 7855, pp. 629–633, 2021. [DOI] [PMC free article] [PubMed] [Google Scholar]
- [34].Grambsch PM and Therneau TM, “Proportional hazards tests and diagnostics based on weighted residuals,” Biometrika, vol. 81, no. 3, pp. 515–526, 1994. [Google Scholar]
- [35].Chakravarty D et al. , “Oncokb: A precision oncology knowledge base,” JCO precision oncology, vol. 1, pp. 1–16, 2017. [DOI] [PMC free article] [PubMed] [Google Scholar]
- [36].Moiso E et al. , “Developmental deconvolution for classification of cancer origin,” medRxiv, 2021. [DOI] [PMC free article] [PubMed] [Google Scholar]
- [37].Lu MY et al. , “Ai-based pathology predicts origins for cancers of unknown primary,” Nature, vol. 594, no. 7861, pp. 106–110, 2021. [DOI] [PubMed] [Google Scholar]
- [38].Fizazi K, Greco F, Pavlidis N, Daugaard G, Oien K, and Pentheroudakis G, “Cancers of unknown primary site: Esmo clinical practice guidelines for diagnosis, treatment and follow-up,” Annals of Oncology, vol. 26, pp. v133–v138, 2015. [DOI] [PubMed] [Google Scholar]
- [39].Mileshkin L et al. , “Cancer-of-unknown-primary-origin: A seer–medicare study of patterns of care and outcomes among elderly patients in clinical practice,” Cancers, vol. 14, no. 12, p. 2905, 2022. [DOI] [PMC free article] [PubMed] [Google Scholar]
- [40].Moon I, Groha S, and Gusev A, “Survlatent ode: A neural ode based time-to-event model with competing risks for longitudinal data improves cancer-associated venous thromboembolism (vte) prediction,” in Machine Learning for Healthcare Conference, PMLR, 2022, pp. 800–827. [Google Scholar]
- [41].Kehl KL et al. , “Natural language processing to ascertain cancer outcomes from medical oncologist notes,” JCO Clinical Cancer Informatics, vol. 4, pp. 680–690, 2020. [DOI] [PMC free article] [PubMed] [Google Scholar]
References
- [1].A. P. G. Consortium et al. , “Aacr project genie: Powering precision medicine through an international consortium,” Cancer discovery, vol. 7, no. 8, pp. 818–831, 2017. [DOI] [PMC free article] [PubMed] [Google Scholar]
- [2].Garcia EP et al. , “Validation of oncopanel: A targeted next-generation sequencing assay for the detection of somatic variants in cancer,” Archives of Pathology and Laboratory Medicine, vol. 141, no. 6, pp. 751–758, 2017. [DOI] [PubMed] [Google Scholar]
- [3].Cheng DT et al. , “Memorial sloan kettering-integrated mutation profiling of actionable cancer targets (msk-impact): A hybridization capture-based next-generation sequencing clinical assay for solid tumor molecular oncology,” The Journal of molecular diagnostics, vol. 17, no. 3, pp. 251–264, 2015. [DOI] [PMC free article] [PubMed] [Google Scholar]
- [4].Chen T and Guestrin C, “Xgboost: A scalable tree boosting system,” in Proceedings of the 22nd acm sigkdd international conference on knowledge discovery and data mining, 2016, pp. 785–794. [Google Scholar]
- [5].Chen Y et al. , “Physiol MeasClassification of short single-lead electrocardiograms (ECGs) for atrial fibrillation detection using piecewise linear spline and XGBoost,” Physiol Meas, vol. 39, no. 10, p. 104006, Oct. 2018. [DOI] [PubMed] [Google Scholar]
- [6].Hatton CM, Paton LW, McMillan D, Cussens J, Gilbody S, and Tiffin PA, “Predicting persistent depressive symptoms in older adults: A machine learning approach to personalised mental healthcare,” Journal of affective disorders, vol. 246, pp. 857–860, 2019. [DOI] [PubMed] [Google Scholar]
- [7].Ogunleye A and Wang Q-G, “Xgboost model for chronic kidney disease diagnosis,” IEEE/ACM transactions on computational biology and bioinformatics, vol. 17, no. 6, pp. 2131–2140, 2019. [DOI] [PubMed] [Google Scholar]
- [8].Bergstra J and Bengio Y, “Random search for hyper-parameter optimization.,” Journal of machine learning research, vol. 13, no. 2, 2012. [Google Scholar]
- [9].Alexandrov LB et al. , “The repertoire of mutational signatures in human cancer,” Nature, vol. 578, no. 7793, pp. 94–101, 2020. [DOI] [PMC free article] [PubMed] [Google Scholar]
- [10].Rosenthal R, McGranahan N, Herrero J, Taylor BS, and Swanton C, “Deconstructsigs: Delineating mutational processes in single tumors distinguishes dna repair deficiencies and patterns of carcinoma evolution,” Genome biology, vol. 17, no. 1, pp. 1–11, 2016. [DOI] [PMC free article] [PubMed] [Google Scholar]
- [11].Lundberg SM et al. , “From local explanations to global understanding with explainable ai for trees,” Nature machine intelligence, vol. 2, no. 1, pp. 56–67, 2020. [DOI] [PMC free article] [PubMed] [Google Scholar]
- [12].Janzing D, Minorics L, and Blöbaum P, “Feature relevance quantification in explainable ai: A causal problem,” in International Conference on artificial intelligence and statistics, PMLR, 2020, pp. 2907–2916. [Google Scholar]
- [13].Gusev A, Groha S, Taraszka K, Semenov YR, and Zaitlen N, “Constructing germline research cohorts from the discarded reads of clinical tumor sequences,” Genome medicine, vol. 13, pp. 1–14, 2021. [DOI] [PMC free article] [PubMed] [Google Scholar]
- [14].Cox DR, “Regression models and life-tables,” Journal of the Royal Statistical Society: Series B (Methodological), vol. 34, no. 2, pp. 187–202, 1972. [Google Scholar]
- [15].Xie J and Liu C, “Adjusted kaplan–meier estimator and log-rank test with inverse probability of treatment weighting for survival data,” Statistics in medicine, vol. 24, no. 20, pp. 3089–3110, 2005. [DOI] [PubMed] [Google Scholar]
- [16].Marschner I, Donoghoe MW, and Donoghoe MMW, “Package ‘glm2’,” Journal, Vol, vol. 3, no. 2, pp. 12–15, 2018. [Google Scholar]
- [17].Chakravarty D et al. , “Oncokb: A precision oncology knowledge base,” JCO precision oncology, vol. 1, pp. 1–16, 2017. [DOI] [PMC free article] [PubMed] [Google Scholar]
Associated Data
This section collects any data citations, data availability statements, or supplementary materials included in this article.
Supplementary Materials
Data Availability Statement
The multicenter NGS tumor panel sequencing data is available upon request at the AACR Project GENIE website: https://www.aacr.org/professionals/research/aacr-project-genie/. The fully trained OncoNPC model, processed somatic variants data from Profile DFCI, and de-identified clinical data used in the treatment concordance analysis are available in https://github.com/itmoon7/onconpc.


