Abstract
Background
Chronic Kidney Disease (CKD) impacts over 10% of the global population, and recent advancements in high-throughput analytical technologies are uncovering the complex physiology underlying this condition. By integrating Genome-Wide Association Studies (GWAS), RNA sequencing (RNA-seq/RNA array), and single-cell RNA sequencing (scRNA-seq) data, our study aimed to explore the genes and cell types relevant to CKD traits.
Methods
GWAS summary data for end-stage renal failure (ESRD) and decreased eGFR (CKD) with or without diabetes and (micro)proteinuria were obtained from the GWAS Catalog and the UK Biobank (UKB) database. Two gene Expression Omnibus (GEO) transcriptome datasets were used to establish glomerular and tubular gene expression differences between CKD patients and healthy individuals. Two scRNA-seq datasets were utilized to obtain the expression of key genes at the single-cell level. The expression profile, differentially expressed genes (DEGs), gene-gene interaction, and pathway enrichment were analysed for these CKD risk genes.
Results
A total of 779 distinct SNPs were identified from GWAS across different CKD traits, involving 681 genes. While many of these risk genes are specific to the CKD traits of renal failure, decreased eGFR, and (micro)proteinuria, they share common pathways, including extracellular matrix (ECM). ECM modeling was enriched in upregulated glomerular and tubular DEGs from CKD kidneys compared to healthy controls, with the expression of relevant collagen genes, such as COL1A2, prevalent in fibroblasts/myofibroblasts. Additionally, immune responses, including T cell differentiation, were dysregulated in CKD kidneys. The late podocyte signature gene THSD7A was enriched in podocytes but downregulated in CKD. We also highlighted that the regulated risk genes of CKD are mainly expressed in tubular cells and immune cells in the kidney.
Conclusions
Our integrated analysis highlight the genes, pathways, and relevant cell types associational with the pathogenesis of kidney traits, as a basis for further mechanistic studies to understand the pathogenesis of CKD.
Supplementary Information
The online version contains supplementary material available at 10.1186/s12882-024-03798-2.
Keywords: CKD, GWAS, RNA-seq, scRNA-seq, Integrated analysis
Introduction
Chronic Kidney Disease (CKD) is a class of health condition characterized by the gradual loss of kidney function regardless of its initial cause. Epidemiological studies indicate that CKD is not a rare disease, with an incidence rate exceeding 10% among adults and considered a leading cause of morbidity and mortality worldwide [1]. CKD encompasses of a wide variety of traits, ranging from mild dysfunction to severe impairment, and presents diverse clinical manifestations such as proteinuria, electrolyte imbalances, and hypertension [2]. The etiology of CKD is multifactorial and genetic, environmental, immune and metabolic factors together determine the occurrence and development of this condition [3]. Diabetes is often reported as the key factor in exacerbating kidney impairment [4]. In addition, both glomerulonephritis and tubular atrophy/interstitial fibrosis contribute to this complex disease. While research into the specific genes and signaling pathways through which the glomeruli and tubulointerstitium contribute to CKD is intensifying, the exact mechanisms of disease causation have yet to be clearly defined.
Recent advances in genomic technologies have provided new insights into the genetic underpinnings of CKD. Over the past decade, a comprehensive array of familial and linkage investigations increasingly emphasise the importance of genetics in understanding kidney function [5]. One powerful tool in this area is Genome-Wide Association Studies (GWAS). GWAS examine the entire genome of many individuals to identify genetic variations, often single nucleotide polymorphisms (SNPs), that are associated with particular traits or diseases [6]. In last few years, datasets and databases from multiple studies have been utilized to provide comprehensive information on risk genes from large populations [7]. Additionally, further research has focused on the in-depth interpretation of these identified trait-associated loci, including the use of pathway functional analysis methods to better understand the biological mechanisms involved [8].
To further elucidate the genetic landscape of CKD, researchers have turned to transcriptional data for more detailed insights. A huge amount of transcriptional data has been generated, offering a way to observe expression changes central to CKD development. Bulk RNA sequencing (bulk RNA-seq) is one such technology that measures the average expression of genes across a sample of many cells, providing insights into how genes are regulated in diseased versus healthy tissues. For example, databases like the Gene Expression Omnibus (GEO) collect such data, allowing researchers to identify differentially expressed genes (DEGs) from diseased kidneys compared to controls [9]. Following this, enriched pathway analysis is a potent tool to identify the pathways involved in CKD development [10]. For instance, studies like that of Liu et al. [11] have underscored the correlation between glomerular transcription of the angiopoietin/Tie (ANG-TIE) pathway and kidney health outcomes, providing insights into how specific pathways impact kidney disease.
The advancement of single-cell RNA sequencing (scRNA-seq) has further revolutionized our understanding of the transcriptome by pinpointing genes specific to individual cell types [12]. Unlike bulk RNA-seq, scRNA-seq analyzes the gene expression of individual cells, enabling the detailed exploration of disease pathways influenced by unique cell receptors or mediators. This technique helps overcome limitations posed by the averaging effect of bulk RNA-seq and provides a refined understanding of molecular pathways at a cellular level. This advancement has been particularly significant in identifying cell-specific responses in CKD, allowing for the identification of biomarkers and potential therapeutic targets.
In this study, we amalgamate GWAS findings with expansive kidney transcriptomic data from various kidney conditions. Our goal is to uncover shared pathways across kidney traits of CKD, and also determine enrichment in specific cell types combined with scRNA-seq data. This analysis highlighted extracellular matrix (ECM), circadian entrainment, and energy metabolism in CKD kidneys as well as podocytes, tubular cells, myofibroblasts and immune cells in detail. It gleans potential insights to therapeutic targets for subsequent translational research in CKD.
Method
Ethical compliance
All the raw or processed datasets were available from public database. Neither animal experiments nor human clinical trials were conducted as part of our investigation. The research was carried out in strict accordance with the Declaration of Helsinki (2013).
Acquisition, and processing of data
GWAS summary statistics of CKD-related kidney function traits were downloaded from the National Human Genome Research Institute (NHGRI) GWAS Catalogue (www.ebi.ac.uk/gwas/ [13]) and the UK Biobank (UKB) genotype database (www.ukbiobank.ac.uk/). We first collected the leading SNPs and risk genes reported for three traits in CKD derived from GWAS Catalogue and UK Biobank database: renal failure (abbreviated as ESRD), decreased eGFR (abbreviated as CKD), and (micro)proteinuria. The ESRD and CKD groups were further classified into diabetic and non-diabetic subgroups. For studies that did not report the leading SNPs, we defined the loci using genotypes from the 1000 Genomes Project Phase for all populations. The linkage disequilibrium (LD) of the SNPs was determined with an r2 > 0.8, tagging the same loci under LD Proxy (https://ldlink.nih.gov). The corresponding matched genes in the loci were identified accordingly based on UCSC Genome Browser (https://genome.ucsc.edu/).
Two bulk RNA-seq datasets from kidneys were downloaded from GEO database for integrated analysis. GSE180395 comprised glomerular transcriptome (GSE180395) and tubular transcriptome (GSE180395) [11, 14]. This dataset series matrix files contained Clinical Phenotyping Resource and Biobank Core (C-PROBE) cohort with a group of 47 CKD patients and 9 healthy controls from micro-dissected human kidney biopsy samples. GSE30122 was a human microarray dataset that includes glomerular and tubular compartments, derived from 12 controls and 10 patients with DN [15, 16]. The GEO2R tool on the GEO website was used to detect differentially expressed genes (DEGs) in glomeruli and tubulointerstitium compared to corresponding controls. Genes with adjusted P-value < 0.05 and |log2(Fold Change) | > 1.5 were considered DEGs.
Two human kidney scRNA-seq data sets were used. Data set A were downloaded at Zenodo (https://zenodo.org/record/4059315 [17], and data set B at GSE211785 [18]. The original annotation of cell type provided by authors was used for downstream analysis, in detail “Annotation.Level.2” in data set A [17] and “Cluster_Idents” in data set B [18]. The two datasets were integrated and normalized using R package Seurat v5.0.1. We curated the final set of cell type names by unifying the original annotations from these two sources. Differential expression test was performed on data set B using FindMarkers function in Seurat. Only genes with adjusted p value < 0.05 were regarded as significant differential expression genes. The R scripts used for the single-cell RNA-seq analysis can be accessed on GitHub at the following link of https://github.com/JingG/RiskGenesForCKD.
Gene set enrichment analysis
Enrichment analyses of the risk genes and DEGs were carried out using Enrichr (https://maayanlab.cloud/Enrichr/), which provides a wide range of annotations curated from other databases and annotation tools for the submitted genes [19]. A list containing official gene symbols of genes was used as the input, and Kyoto Encyclopedia of Genes and Genomes (KEGG) pathways annotations were retrieved through Enrichr having an adjusted p-value < 0.05 were considered statistically significant. KEGG shows the maps of molecular interaction, reaction, and relation networks relevant to cellular metabolism, genetic and environmental information processing, cellular processes, organismal systems, human diseases, and drug development [20].
The search tool for retrieval of interacting genes (STRING) (https://string-db.org/) database was employed to seek potential interactions between genes [21]. Active interaction sources, including text mining, experiments, databases, and co-expression as well as species limited to “Homo sapiens” and an interaction score > 0.4 were applied to construct the protein-protein interaction (PPI) networks. In the networks, the nodes correspond to the proteins and the edges represent the interactions.
Statistical analysis
The statistical analyses were carried out utilizing SPSS (version: 26) and R (version: 3.5.3). Statistical significance was described as a p-value or adjust p-value < 0.05.
Results
CKD Risk gene screening from GWAS
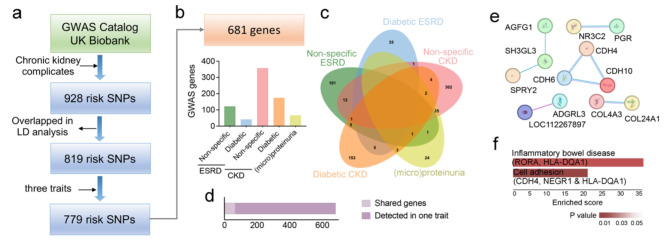
Based on the summary GWAS statistics provided by databases of GWAS Catalogue and UK Biobank (UKB), 928 CKD risk SNPs were included in the analysis (Supplementary Dataset 1). After filtration of the overlapped and strongly linked SNPs (r2 > 0.8 in LD analysis), 779 risk SNPs were identified to be significantly associated with CKD phenotypes (Fig. 1a). Among these SNPs, 681 genes were mapped according to these two databases.
Fig. 1.
Identification of risk genes for CKD. (a) Flow chart for CKD risk SNPs identification and 779 SNPs in 681 genes are selected. (b) Distribution of risk genes across phenotypic traits in CKD. (c) The Venn diagram showing the number of risk genes shared in different CKD traits. d. A total of 66 genes are shared while 615 are detected in only in one trait. (e) PPI diagram for these shared genes, including CDH and COL family. (f) the shared genes enriched for inflammatory bowel disease and cell adhesion
Since different kidney complications were explored in CKD GWAS studies [22], we primary focused on the traits referring kidney function, glomerular function, and kidney disorders with diabetes. According to the records in databases, the GWAS population is further classified into renal failure (shorted as ESRD), decreased eGFR (shorted as CKD) and (micro)proteinuria. The groups of ESRD and CKD were further classified as diabetic and non-diabetic subgroups. Majority of risk genes were identified in CKD populations, and an incidence rate exceeding 50% in CKD patients without diabetes (Fig. 1b). Among these genes, while 70 risk genes (∼ 10%) were identified in two different population studies (Fig. 1c-d). The CKD without diabetes (non-specific CKD) group shared 12 risk genes with non-specific ESRD groups, and 35 risk genes with (micro)proteinuria group. Meanwhile, only 1–5 risk genes were shared by two groups. The genes identified in each group were detailed in Supplementary Dataset 2.
In addition, these shared risk genes only slightly interacted within a few models (Fig. 1e), specifically in cell-cell adhesion model including Cadherins (e.g., CDH 4, 6 &10), Adhesion G protein-coupled receptor L3 (ADGRL3) and Collagens (Col4A3 & Col24A1). KEGG analysis also showed that cell adhesion (CDH4, NEGR1 & HLA-DQA1) was enriched in these shared CKD risk genes (Fig. 1f).
Thus, integrated GWAS profiled the risk genes associated with CKD. Different traits in CKD were associated with different gene sets, suggesting different pathological factors. Tissue remodelling genes, refereeing to cell adhesion and collagens, were highlighted as common genes contributing to kidney diseases.
Functional enrichment of the CKD risk genes
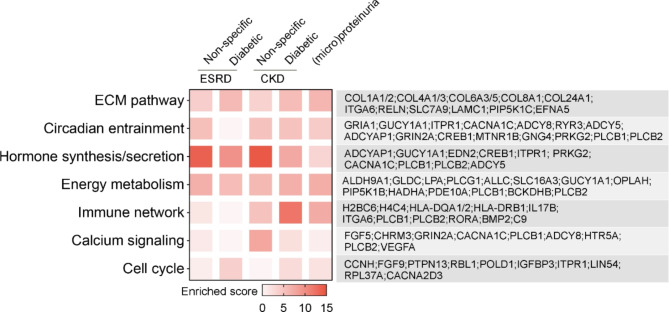
Functional enrichment analysis was further conducted on CKD-associated genes identified from GWAS investigations. Across various CKD traits, analysis of enriched KEGG pathways revealed several shared pathways, highlighted by representative genes. We identified and reported the top seven pathways with the highest enrichment scores (Fig. 2). Notably, pathways such as the extracellular matrix (ECM) pathway, circadian entrainment, and energy metabolism were enriched across different sets of GWAS-derived studies.
Fig. 2.
Enrichment analysis of KEGG pathways for CKD-associated risk genes. This analysis was performed using the Enrichr, showcasing pathways on the left with an adjust p-value < 0.05. On the right, genes identified as CKD risk factors from various GWAS studies are displayed. The colour represents the enrichment score, as detailed in the scale provided
The ECM is recognized as a key factor in the progression of fibrosis [23], a prevalent mechanism in CKD pathogenesis [24], while circadian rhythms have been shown to significantly influence cellular metabolic processes [25]. Recent studies have also elucidated the link between renal fibrosis and metabolic changes [26]. Meanwhile, kidneys play a crucial role in the body’s endocrine system, secreting hormones such as renin, erythropoietin (EPO), and 1,25-dihydroxy-vitamin D3, in addition to various autocrine and paracrine factors [27], and involved genes also showed enrichment in distinct GWAS cohorts. Furthermore, genes related to the immune network were predominantly identified in GWAS groups for non-end-stage renal disease (non-ESRD), whereas calcium signalling genes were more common in non-specific CKD groups, and cell cycle genes exhibited a broad but weak association across different cohorts.
These findings highlight the potential common pathogenic mechanisms underlying various CKD conditions, despite differences in specific traits and associated risk genes derived from different GWAS studies.
CKD transcriptionally regulate genes in the kidneys
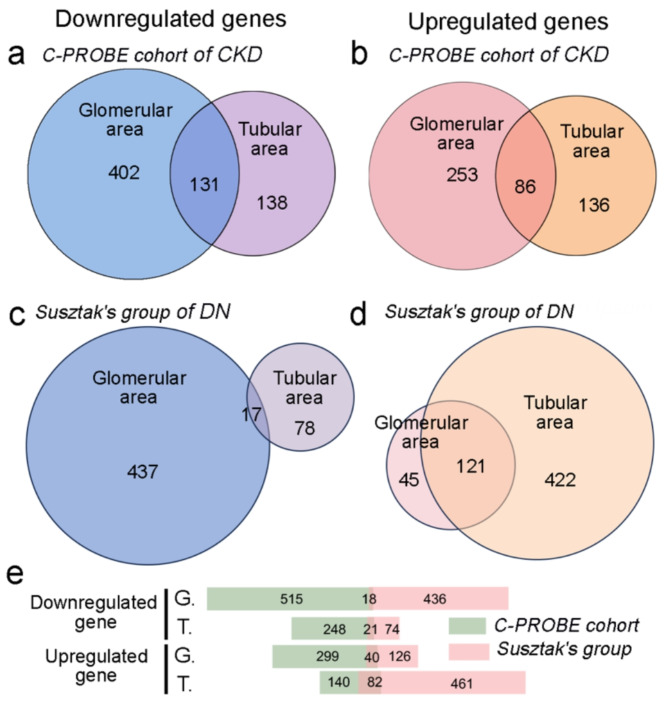
Moreover, we reanalyzed the transcriptome data derived from the C-PROBE Investigator group [11, 14]. The bulk-RNA seq data were derived from micro-dissected human kidney biopsy samples in a group of CKD patients (n = 47), and the glomerular and tubular transcriptome were analyzed in both typical primary CKD (e.g., FSGS, MN and IgAN) and secondary CKD (e.g., LN and DN). The transcriptomes from 9 healthy living donors served as controls. In our findings, a total of 533 genes were identified as downregulated in the glomerular region, and 269 genes were downregulated in the tubular transcriptome, with an intersection of 131 genes showing downregulation in both areas (Fig. 3a). Conversely, the analysis identified 339 upregulated genes in the glomerular transcriptome and 222 in the tubular transcriptome, with a subset of 86 genes upregulated in both areas (Fig. 3b). Since this cohort is a combination of different primary and secondary CKDs, it suggests the presence of commonly regulated genes in CKD.
Fig. 3.
Gene regulation in glomerular and tubular regions of kidneys affected by CKD. (a-b) The upper section displays Venn diagrams illustrating the intersection of downregulated (a) and upregulated (b) genes in CKD from C-PROBE cohort, specifying their activity in either the glomerular or tubular regions. (c-d) Similar with a-b, The regulated number were detected in Suszker’s cohort of diabetic nephropathy (DN). (e) The crossing of regulated gene number between C-PROBE and Suszker’s cohort. G: glomerular area; T: tubular area
To further investigate the transcriptional regulation in CKD, we used another dataset of diabetic nephropathy (DN) from Suszker’s group, which included 12 controls and 10 patients with DN [15, 16]. Gene array analysis revealed 454 genes were downregulated in the glomerular portion, 95 genes in the tubular portion, and 17 genes in the intersection; Conversely, 166, 543, and 121 genes were upregulated in these respective regions (Fig. 3c-d). We also analyzed the overlap between these two datasets, finding very few common genes (Fig. 3e). Interestingly, despite differences in specific genes, both datasets exhibited a trend of greater downregulation in the glomerular region, but less upregulation in the tubular region. Additionally, the C-PROBE dataset detected very few upregulated genes in the tubular area, while Suszker’s dataset identified 461 distinctly upregulated genes in the same region. We cannot rule out the possibility that these upregulated genes in tubular area are specifically related to the progression of DN.
Transcriptionally regulated pathways in the kidneys with CKD
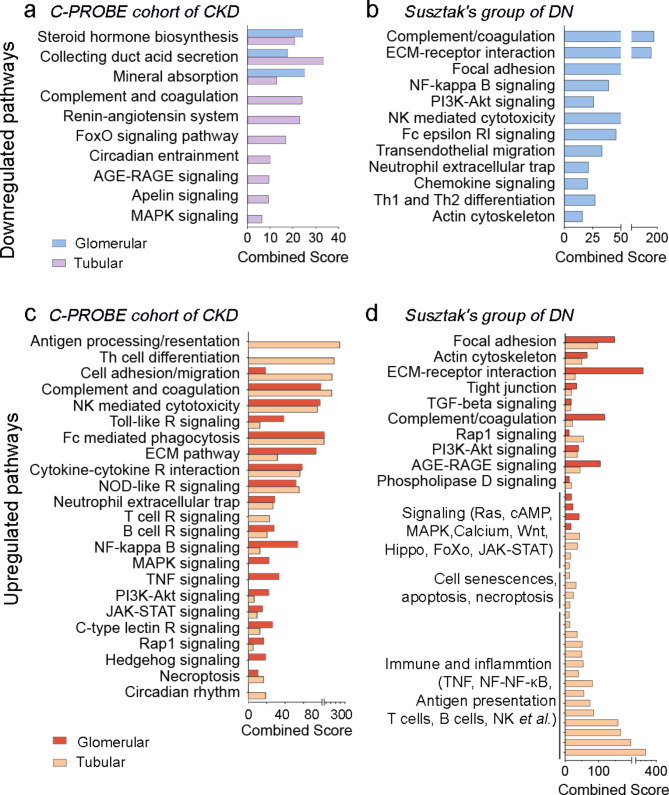
To understand the function of these regulated genes, we performed KEGG pathway analysis using the regulated genes in CKD (Fig. 3). For the downregulated genes in the C-PROBE dataset, pathways such as steroid hormone biosynthesis, collecting duct acid secretion, and mineral absorption were enriched in both glomerular and tubular transcriptomes (Fig. 4a). Interestingly, pathways previously associated with CKD, such as the complement and coagulation pathways [28] and the renin-angiotensin system [29], were exclusively downregulated in the tubular region. Additionally, the FOXO and Apelin signaling pathways, along with AMPK signaling — all involved in cell proliferation, division, migration, apoptosis, oxidative stress resistance, and metabolism [30, 31] — were also exclusively downregulated in the tubular region. However, in the DN dataset from Susztak’s group, the significantly enriched pathways were only detected in those regulated gene derived in the glomerular region, focusing on cell adhesion and immune-inflammatory pathways (Fig. 4b).
Fig. 4.
Pathways enriched by Enrichr analysis (with an adjusted p-value < 0.05, corresponding to differentially expressed genes (DEGs) in CKD, listed in Fig. 3). (a-b) Downregulated pathways in CKD derived from DEGs in the glomerular and tubular areas compared with controls, detected in the C-PROBE cohort of CKD (a) and Susztak’s group of DN (b). (c-d) Similar analysis for upregulated pathways
In contrast, a greater variety of pathways were enriched in the upregulated transcriptomes, indicating a predominant activation of pathological mechanisms contributing to CKD progression. Pathways related to cell adhesion, migration, and the extracellular matrix were notably upregulated in both the glomerular and tubular areas in both datasets. Moreover, in the C-PROBE dataset, similar upregulated pathways were observed in both regions, whereas in the DN dataset from Susztak’s group, upregulation was mainly concentrated in the tubular region (Fig. 4c-d). Most of these upregulated pathways were involved in immune responses, including pathways regulated by NK cells, T cells, and B cells, as well as necroptosis and NF-kB signaling. Another group of upregulated pathways included those regulating cell status, such as proliferation, senescence, and necrosis. Additionally, the circadian entrainment pathway exhibited mixed responses, within both CKD upregulated and downregulated tubular genes in the C-PROBE dataset, while cell adhesion pathways were prominent in the DN dataset from Susztak’s group. Notably, the AGE-RAGE signaling pathway in tubular area was downregulated in the CKD cohort of the C-PROBE dataset but upregulated in the DN cohort from Susztak’s group, which is directly related to diabetes [32].
Our data indicate a complex regulatory landscape of gene expression in CKD, showcasing distinct pathways uniquely modulated within the glomerular and tubular areas. Several pathways are consistently highlighted across both regions, underscoring their importance in the disease process.
Risk genes and pathways transcriptionally regulated in CKD
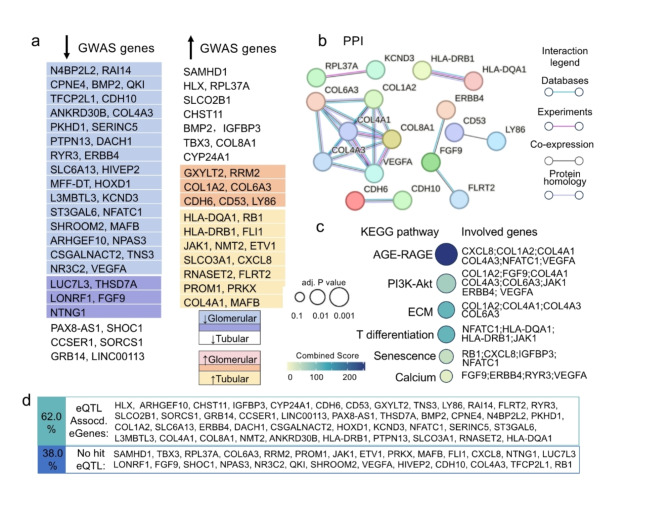
We further concentrated on the intersecting genes identified by CKD GWAS studies and those that are transcriptionally regulated in CKD. In total, 72 overlapped genes were identified, with 58.4% of these genes showing downregulation in either the glomerular or tubular regions (Fig. 5a). Specifically, GWAS gene LUC7L3, LONRF1, THSD7A, NTNG1 and FGF9 were downregulated in both glomerular and tubular regions.
Fig. 5.
Intersecting genes identified by CKD GWAS studies and those that are transcriptionally regulated in CKD. (a) The list of up- and down- regulated genes in glomerular and tubular area, respectively. The common genes are indicated in different colors. (b) PPI diagram of the regulated GWAS CKD genes, highlighting the module of collagen genes. Only the interactions of two genes were approved with experiments, derived from databases, co-expressed were considered in this analysis, as well the protein homologies. (c) KEGG enriched pathways of these genes showing AGE-RAGE, ECM and cell senescence. (d) 62% of the CKD-regulated GWAS genes overlap with kidney-specific eQTL-associated eGenes [41, 42]
while GXYLT2, CDH6, COL1A2, COL6A3, CD53, LY86 and RRM2 was upregulated in these areas.
Functionally, the relationship between these overlapped genes is highlighted in the Protein-Protein Interaction (PPI) network (Fig. 5b) and KEGG enriched pathways (adjusted p-value < 0.05; Fig. 5c). Notably, COL1A2 and COL6A3, two members of the collagen family, were detected as upregulated GWAS genes (Fig. 5a). They were connected with other collagen genes, COL4A1, COL4A3, and VEGFA, forming a distinct module under PPI analysis (Fig. 5b). KEGG pathway analysis suggests that this module is involved in the AGE-RAGE and extracellular matrix (ECM) pathways (Fig. 5c). Both AGE-RAGE and ECM pathways have been reported to contribute to tissue deposition and fibrosis in CKD [33, 34]. Meanwhile, the module of CDH6 and CDH10 belonged to cadherin family (Fig. 5b), which are involved in cell adhesion and maintaining tissue architecture in CKD [35].
Moreover, FGF9 functionally linked with ERBB4 and FLRT2 (Fig. 5b) is associated with calcium signaling and the PI3K-Akt pathway (Fig. 5c). Recent studies have shown that these two pathways interconnect, linking PI3K pathway activation to Ca2+ signaling, and play crucial roles in cell cycle regulation and apoptosis [36], which are important in CKD progression. The cell senescence was significantly enriched among the regulated GWAS genes (Fig. 5c).
Additionally, CD53 and LY86 (Fig. 5a), although not detected in the pathway enrichment analysis (Fig. 5c), are functionally related genes that potentially influence immune response [37, 38], whereases, the T-cell differentiation pathway was enriched among these regulated GWAS genes (Fig. 5c). It is important to note that the involvement of HLA genes in this pathway has been heavily scrutinized in GWAS studies, which were even questioned the relevance of HLA genes due to potential confounding factors and population-specific effects [39, 40].
Specifically, we referenced the eQTL analyses from Liu et al. [41] and Sheng et al. [42], which systematically profile kidney-specific eQTLs. Liu et al. integrated all publicly available kidney eQTL datasets, while Sheng et al. showed the eQTL association genes in glomeruli and tubules, respectively. Among the 72 regulated GWAS genes, 62% genes were identified as kidney-specific eQTLs associated-eGenes. This overlap highlights the significant association between GWAS-identified genes and kidney-specific transcriptional regulation.
Cell type-specific expression of regulated risk genes in the kidney
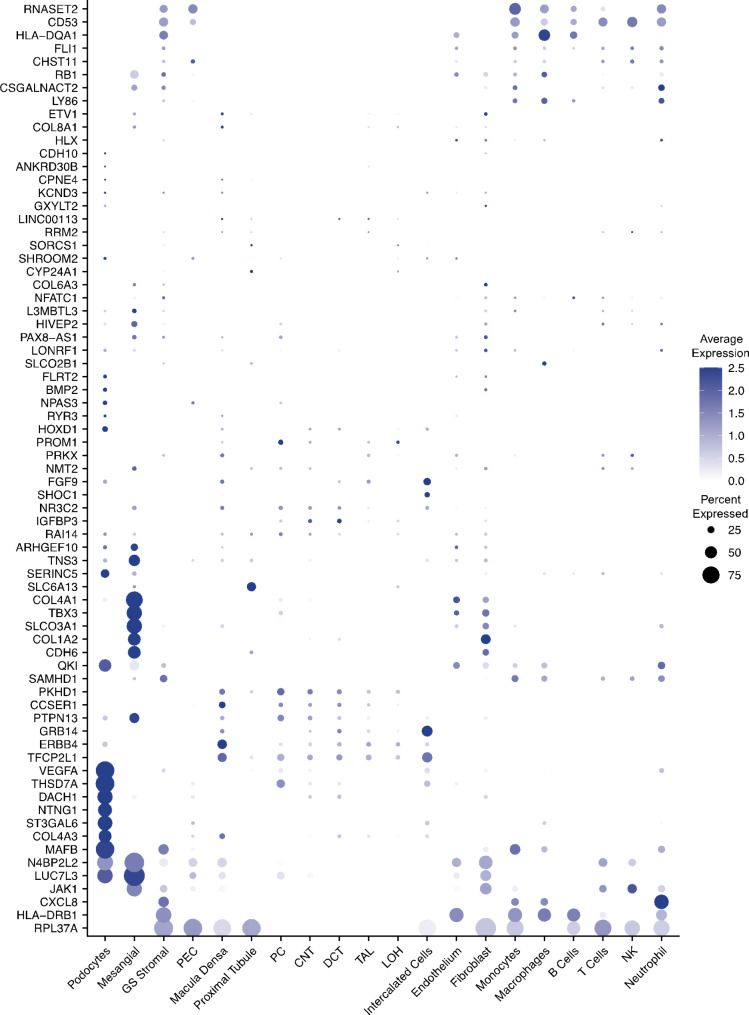
To analyze cell type-specific expression, we employed two public scRNA-seq datasets from kidney biopsy samples [17, 18], which included 145,202 cells categorized into four groups: glomerular compartment (including podocytes), tubular cells, stromal cells (primarily fibroblasts/myofibroblasts), and immune cells. The 72 CKD-related GWAS genes highlighted in Fig. 5 were plotted across these cell types. However, the abundance of more than 10 genes, such as CDH10 and COL8A1, was very low in kidney cells and are not shown due to their absence in these kidney cell types (Fig. 6).
Fig. 6.
Heat diagram of the regulated GWAS genes against the cell types in kidney, with color showing average expression and the size the percentage expressed. The percent expression in less than 3% was shown as blank
Interestingly, fibroblasts and mesangial cells exhibited a similar pattern of enriched regulated GWAS genes, including COL1A2 and LUC7L3. Mesangial cells, a type of glomerular stromal cell, are suggested to be a specific type of fibroblast [43]. COL1A2 is a typical collagen gene, and LUC7L3 may regulate fibronectin mRNA maturation [44], both playing pivotal roles in extracellular matrix remodeling. In podocytes, the genes VEGFA, THSD7A and MAFB were enriched and reported as late podocyte (LP) genes [45]. N4BP2L2 was enriched in glomerular podocytes and mesangial cells. It is listed as a predicted podocyte essential gene [46] and a hub gene related to immune regulation in membranous nephropathy [47], though its specific function remains unclear. In tubular cells, CCSER1, PKHD1, TFCP2L1, and FGF9 were predominantly expressed. Notably, PKHD1 is associated with polycystic kidney disease and its presence in tubular cells may be linked to tubular dilation and cyst formation [48]. RNASET2 and CD53 were primarily expressed in the immune cells. CD53, a leukocyte surface antigen, plays a significant role in modulating signaling pathways in immune cells, indicating its importance in immune responses within the kidney [38].
To further understand the regulation of these genes by CKD across different cell types, we analyzed their expression levels using scRNA-seq datasets [18], including samples from control subjects and CKD patients (Fig. 7). Interestingly, the late podocyte signature gene THSD7A was downregulated in podocytes in CKD compared to controls, while a group of genes, such as COL6A3, were upregulated in fibroblasts. We found enrichment for multiple proximal tubule-specific genes, such as SLC5A11 and SLC6A13 [49], which were significantly downregulated in proximal tubular cells during CKD. Conversely, a cluster of genes was upregulated in different tubular cell types, although their specific functions were not directly linked to tubular genes. Additionally, CHST11 was upregulated in the immune cells during CKD, which was positively correlated with immune cell infiltration [50], while immune relevant HLA-DRB1 gene was downregulated.
Fig. 7.
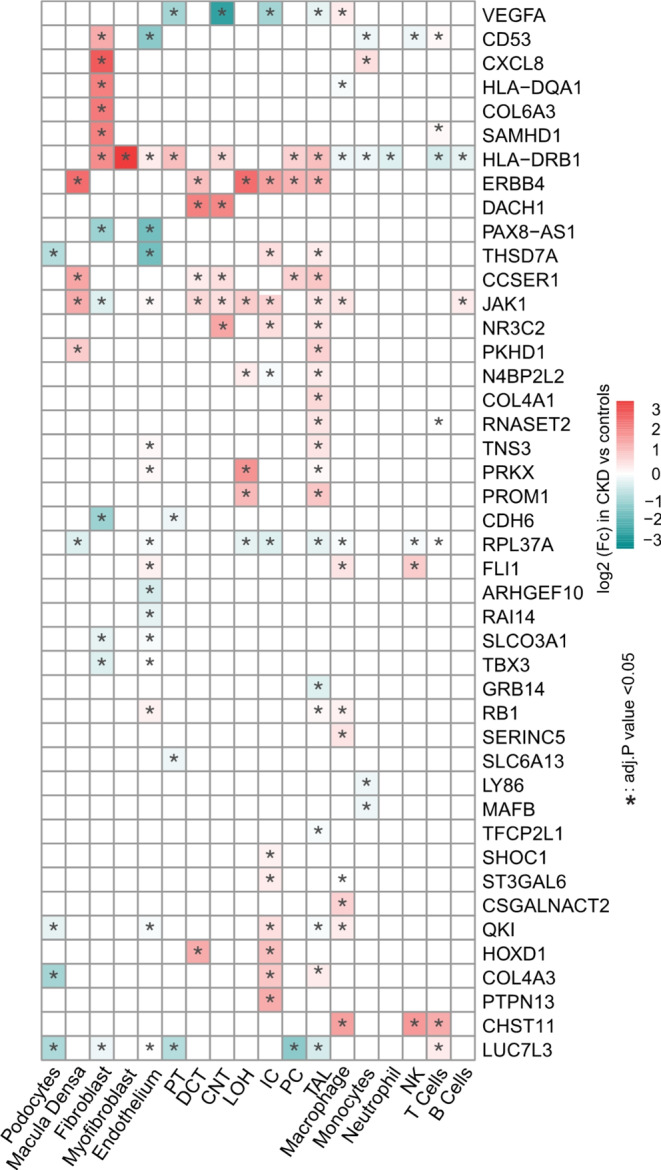
Heat diagram of different express genes (DEGs) across cell types, with color showing log2(fold change) in cells derived from CKD patients versus those from controls and the “*” indicating adjust P value < 0.05. The genes were similar expressed in each cell types were not shown in this diagram
Discussion
Genome-Wide Association Studies (GWAS) have identified numerous loci associated with kidney traits [22], but translating these findings into meaningful insights is challenging due to the complexity of relevant cell types and underlying mechanisms [51]. Our integrative analysis combined GWAS summary statistics with gene expression data to identify risk genes associated with kidney function. By leveraging single-cell RNA sequencing (scRNA-seq) data, we highlighted specific cell types and their distribution. This approach revealed that kidney function traits exhibit cell type-specific signatures of associated genes, reaffirming existing biological understanding of CKD physiology.
We compiled risk genes for CKD traits using GWAS summary statistics from the GWAS Catalogue and UK Biobank, encompassing nearly all reported GWAS genes on CKD. We compiled risk genes for CKD traits using GWAS summary statistics from the GWAS Catalogue and UK Biobank, encompassing nearly all reported GWAS genes on CKD. Recently, another meta-analysis of publicly available GWAS information from the CKDGen4, Pan-UK Biobank, MVP5, PAGE20, and SUMMIT21 consortia for 1.5 million individuals identified 878 independent loci, including 126 new loci, associated with eGFRcys and/or BUN [41]. Only about 10% of the genes showed overlap across different traits, indicating a low overlap rate in the GWAS data, and most of the overlapping genes were associated with CKD without diabetes (non-specific CKD).
Our analysis further focused on mapped genes for integration with bulk RNA data analysis. Although some genes were identified across different GWAS studies with the same CKD trait, few genes were consistently prioritized. Notably, risk genes from nonspecific CKD GWAS results overlapped with those for proteinuria or ESRD GWASs. At last, we identified 72 GWAS-identified risk genes overlapped with regulation in CKD-affected kidneys. Genes related to the extracellular matrix (ECM), especially COL1A2, underscore the importance of tissue remodeling in CKD progression, while the AGE-RAGE signaling pathway is highlighted for its role in tissue fibrosis. Moreover, the immune response is a complex process during CKD progression and is prominently featured among these regulated GWAS genes. Additionally, some eGenes in these regulated GWAS genes were listed based on two kidney-specific eQTL analyses for further study reference.
Finally, our integrative analysis of cell type-specific expression using public scRNA-seq datasets from kidney biopsy samples revealed distinct patterns of regulated CKD-related GWAS genes across various cell types. This approach highlighted the importance of specific cell types, such as fibroblasts, mesangial cells, podocytes, tubular cells, and immune cells, in CKD progression. For example, genes related to the extracellular matrix (ECM), such as COL1A2 and LUC7L3, were enriched in fibroblasts and mesangial cells, underscoring their role in tissue remodeling [43, 44]. In podocytes, VEGFA, THSD7A, and MAFB were identified as critical late podocyte genes [45]. Tubular cells predominantly expressed genes like PKHD1, which is associated with polycystic kidney disease [46], while immune cells showed significant expression of RNASET2 and CD53, emphasizing their role in immune responses [38].
However, data inconsistencies are common in integrated analyses. In GWAS analyses, inconsistencies can arise from various sources, including different trait definitions, population characteristics, GWAS detection strategies, and analysis methods [52]. For bulk RNA-seq and scRNA-seq data, discrepancies primarily result from differences in sampling, cell dissociation protocols, library preparation technologies, and sequencing platforms [53]. These variations can lead to batch effects, obscuring true biological signals and complicating data interpretation. Further validation using snATAC-seq data could provide insights into chromatin accessibility and gene regulation at the single-cell level [42, 54]. Moreover, our study lacks direct experimental validation to confirm the functional relevance of the identified genes. These multi-faceted approaches will strengthen our findings and provide more robust insights into CKD mechanisms, potentially leading to the identification of new therapeutic targets. In addition, factors such as age, ethnicity, and sex were not adjusted for in this analysis, as the multiple dataset meta-analysis approach helps to reduce individual dataset biases due to such factors.
In conclusion, the strengths of our study lie in the use of impartial datasets and multifaceted analysis, combining robust GWAS summary statistics with bulk and single-cell gene expression data. This methodology directs experimental studies post-GWAS by pinpointing the most pertinent cell type for each gene associated with a specific trait and may highlight potential molecular targets for CKD treatment, crucial for early intervention and therapeutic strategies.
Electronic supplementary material
Below is the link to the electronic supplementary material.
Acknowledgements
No.
Author contributions
S.D. did all the analysis for Figs. 1, 2, 3, 4 and 5 and J.G. prepared Figs. 6 and 7, and S.D., H.C. and E.P., wrote the main manuscript text . All authors reviewed the manuscript.
Funding
Funded by Ministry of Education - Singapore (T2EP30221-0013), National Medical Research Council, Singapore (OFLCG22may-0011).
Data availability
The datasets used during the current study are available from open database and published studies. The datasets analyzed were listed in supplementary datasets. More details are available from the corresponding author on reasonable request.
Declarations
Ethics approval and consent to participate
Not applicable.
Consent for publication
Not applicable.
Competing interests
The authors declare no competing interests.
Footnotes
Publisher’s note
Springer Nature remains neutral with regard to jurisdictional claims in published maps and institutional affiliations.
References
- 1.Kovesdy CP. Epidemiology of chronic kidney disease: an update 2022. Kidney Int Suppl (2011). 2022;12(1):7–11. [DOI] [PMC free article] [PubMed] [Google Scholar]
- 2.Chen TK, Knicely DH, Grams ME. Chronic kidney disease diagnosis and management: a review. JAMA. 2019;322(13):1294–304. [DOI] [PMC free article] [PubMed] [Google Scholar]
- 3.Zoccali C, Vanholder R, Massy ZA, Ortiz A, Sarafidis P, Dekker FW, Fliser D, Fouque D, Heine GH, Jager KJ, et al. The systemic nature of CKD. Nat Rev Nephrol. 2017;13(6):344–58. [DOI] [PubMed] [Google Scholar]
- 4.Trivedi A, Kumar S. Chronic kidney disease of unknown origin: think beyond common etiologies. Cureus. 2023;15(5):e38939. [DOI] [PMC free article] [PubMed] [Google Scholar]
- 5.Participants KC. Genetics in chronic kidney disease: conclusions from a Kidney Disease: Improving Global Outcomes (KDIGO) Controversies Conference. Kidney Int 2022, 101(6):1126–1141. [DOI] [PMC free article] [PubMed]
- 6.Sullivan KM, Susztak K. Unravelling the complex genetics of common kidney diseases: from variants to mechanisms. Nat Rev Nephrol. 2020;16(11):628–40. [DOI] [PMC free article] [PubMed] [Google Scholar]
- 7.Zeggini E, Ioannidis JP. Meta-analysis in genome-wide association studies. Pharmacogenomics. 2009;10(2):191–201. [DOI] [PMC free article] [PubMed] [Google Scholar]
- 8.Guo J, Rackham OJL, Sandholm N, He B, Osterholm AM, Valo E, Harjutsalo V, Forsblom C, Toppila I, Parkkonen M, et al. Whole-genome sequencing of Finnish type 1 Diabetic siblings discordant for kidney Disease reveals DNA variants associated with Diabetic Nephropathy. J Am Soc Nephrol. 2020;31(2):309–23. [DOI] [PMC free article] [PubMed] [Google Scholar]
- 9.Papadopoulos T, Krochmal M, Cisek K, Fernandes M, Husi H, Stevens R, Bascands JL, Schanstra JP, Klein J. Omics databases on kidney disease: where they can be found and how to benefit from them. Clin Kidney J. 2016;9(3):343–52. [DOI] [PMC free article] [PubMed] [Google Scholar]
- 10.Fu S, Cheng Y, Wang X, Huang J, Su S, Wu H, Yu J, Xu Z. Identification of diagnostic gene biomarkers and immune infiltration in patients with diabetic kidney disease using machine learning strategies and bioinformatic analysis. Front Med (Lausanne). 2022;9:918657. [DOI] [PMC free article] [PubMed] [Google Scholar]
- 11.Liu J, Nair V, Zhao YY, Chang DY, Limonte C, Bansal N, Fermin D, Eichinger F, Tanner EC, Bellovich KA, et al. Multi-scalar Data Integration Links glomerular angiopoietin-Tie Signaling Pathway Activation with Progression of Diabetic kidney disease. Diabetes. 2022;71(12):2664–76. [DOI] [PMC free article] [PubMed] [Google Scholar]
- 12.Gupta RK, Kuznicki J. Biological and Medical Importance of Cellular Heterogeneity deciphered by single-cell RNA sequencing. Cells 2020, 9(8). [DOI] [PMC free article] [PubMed]
- 13.Welter D, MacArthur J, Morales J, Burdett T, Hall P, Junkins H, Klemm A, Flicek P, Manolio T, Hindorff L, et al. The NHGRI GWAS catalog, a curated resource of SNP-trait associations. Nucleic Acids Res. 2014;42(Database issue):D1001–1006. [DOI] [PMC free article] [PubMed] [Google Scholar]
- 14.Troost JP, Hawkins J, Jenkins DR, Gipson DS, Kretzler M, El Shamy O, Bellovich K, Perumal K, Bhat Z, Massengill S, et al. Consent for genetic biobanking in a diverse Multisite CKD cohort. Kidney Int Rep. 2018;3(6):1267–75. [DOI] [PMC free article] [PubMed] [Google Scholar]
- 15.Woroniecka KI, Park AS, Mohtat D, Thomas DB, Pullman JM, Susztak K. Transcriptome analysis of human diabetic kidney disease. Diabetes. 2011;60(9):2354–69. [DOI] [PMC free article] [PubMed] [Google Scholar]
- 16.Na J, Sweetwyne MT, Park AS, Susztak K, Cagan RL. Diet-Induced Podocyte Dysfunction in Drosophila and mammals. Cell Rep. 2015;12(4):636–47. [DOI] [PMC free article] [PubMed] [Google Scholar]
- 17.Kuppe C, Ibrahim MM, Kranz J, Zhang X, Ziegler S, Perales-Paton J, Jansen J, Reimer KC, Smith JR, Dobie R, et al. Decoding myofibroblast origins in human kidney fibrosis. Nature. 2021;589(7841):281–6. [DOI] [PMC free article] [PubMed] [Google Scholar]
- 18.Abedini A, Levinsohn J, Klötzer KA, Dumoulin B, Ma Z, Frederick J, Dhillon P, Balzer MS, Shrestha R, Liu H et al. Spatially resolved human kidney multi-omics single cell atlas highlights the key role of the fibrotic microenvironment in kidney disease progression. bioRxiv 2024:2022.2010.2024.513598.
- 19.Kuleshov MV, Jones MR, Rouillard AD, Fernandez NF, Duan Q, Wang Z, Koplev S, Jenkins SL, Jagodnik KM, Lachmann A, et al. Enrichr: a comprehensive gene set enrichment analysis web server 2016 update. Nucleic Acids Res. 2016;44(W1):W90–97. [DOI] [PMC free article] [PubMed] [Google Scholar]
- 20.Kanehisa M, Sato Y, Furumichi M, Morishima K, Tanabe M. New approach for understanding genome variations in KEGG. Nucleic Acids Res. 2019;47(D1):D590–5. [DOI] [PMC free article] [PubMed] [Google Scholar]
- 21.Szklarczyk D, Gable AL, Lyon D, Junge A, Wyder S, Huerta-Cepas J, Simonovic M, Doncheva NT, Morris JH, Bork P, et al. STRING v11: protein-protein association networks with increased coverage, supporting functional discovery in genome-wide experimental datasets. Nucleic Acids Res. 2019;47(D1):D607–13. [DOI] [PMC free article] [PubMed] [Google Scholar]
- 22.Tin A, Kottgen A. Genome-Wide Association Studies of CKD and related traits. Clin J Am Soc Nephrol. 2020;15(11):1643–56. [DOI] [PMC free article] [PubMed] [Google Scholar]
- 23.Herrera J, Henke CA, Bitterman PB. Extracellular matrix as a driver of progressive fibrosis. J Clin Invest. 2018;128(1):45–53. [DOI] [PMC free article] [PubMed] [Google Scholar]
- 24.Yan H, Xu J, Xu Z, Yang B, Luo P, He Q. Defining therapeutic targets for renal fibrosis: exploiting the biology of pathogenesis. Biomed Pharmacother. 2021;143:112115. [DOI] [PubMed] [Google Scholar]
- 25.Marcheva B, Ramsey KM, Peek CB, Affinati A, Maury E, Bass J. Circadian clocks and metabolism. Handb Exp Pharmacol. 2013;217:127–55. [DOI] [PMC free article] [PubMed] [Google Scholar]
- 26.Wei X, Hou Y, Long M, Jiang L, Du Y. Advances in energy metabolism in renal fibrosis. Life Sci. 2023;312:121033. [DOI] [PubMed] [Google Scholar]
- 27.Sahay M, Kalra S, Bandgar T. Renal endocrinology: the new frontier. Indian J Endocrinol Metab. 2012;16(2):154–5. [DOI] [PMC free article] [PubMed] [Google Scholar]
- 28.Thurman JM. Complement and the kidney: an overview. Adv Chronic Kidney Dis. 2020;27(2):86–94. [DOI] [PMC free article] [PubMed] [Google Scholar]
- 29.Navar LG, Kobori H, Prieto MC, Gonzalez-Villalobos RA. Intratubular renin-angiotensin system in hypertension. Hypertension. 2011;57(3):355–62. [DOI] [PMC free article] [PubMed] [Google Scholar]
- 30.Eijkelenboom A, Burgering BM. FOXOs: signalling integrators for homeostasis maintenance. Nat Rev Mol Cell Biol. 2013;14(2):83–97. [DOI] [PubMed] [Google Scholar]
- 31.Hu G, Wang Z, Zhang R, Sun W, Chen X. The role of Apelin/Apelin Receptor in Energy Metabolism and Water Homeostasis: a Comprehensive Narrative Review. Front Physiol. 2021;12:632886. [DOI] [PMC free article] [PubMed] [Google Scholar]
- 32.Kay AM, Simpson CL, Stewart JA Jr. The Role of AGE/RAGE Signaling in Diabetes-Mediated Vascular Calcification. J Diabetes Res 2016, 2016:6809703. [DOI] [PMC free article] [PubMed]
- 33.Curran CS, Kopp JB. RAGE pathway activation and function in chronic kidney disease and COVID-19. Front Med (Lausanne). 2022;9:970423. [DOI] [PMC free article] [PubMed] [Google Scholar]
- 34.Bulow RD, Boor P. Extracellular matrix in kidney fibrosis: more than just a Scaffold. J Histochem Cytochem. 2019;67(9):643–61. [DOI] [PMC free article] [PubMed] [Google Scholar]
- 35.Luo S, Lin R, Liao X, Li D, Qin Y. Identification and verification of the molecular mechanisms and prognostic values of the cadherin gene family in gastric cancer. Sci Rep. 2021;11(1):23674. [DOI] [PMC free article] [PubMed] [Google Scholar]
- 36.Ghigo A, Laffargue M, Li M, Hirsch E. PI3K and Calcium Signaling in Cardiovascular Disease. Circ Res. 2017;121(3):282–92. [DOI] [PubMed] [Google Scholar]
- 37.Zhao M, Liu A, Mo L, Wan G, Lu F, Chen L, Fu S, Chen H, Fu T, Deng H. Higher expression of PLEK and LY86 as the potential biomarker of carotid atherosclerosis. Med (Baltim). 2023;102(42):e34445. [DOI] [PMC free article] [PubMed] [Google Scholar]
- 38.Dunlock VE. Tetraspanin CD53: an overlooked regulator of immune cell function. Med Microbiol Immunol. 2020;209(4):545–52. [DOI] [PMC free article] [PubMed] [Google Scholar]
- 39.Ishikawa Y, Tanaka N, Asano Y, Kodera M, Shirai Y, Akahoshi M, Hasegawa M, Matsushita T, Saito K, Motegi SI, et al. GWAS for systemic sclerosis identifies six novel susceptibility loci including one in the fcgamma receptor region. Nat Commun. 2024;15(1):319. [DOI] [PMC free article] [PubMed] [Google Scholar]
- 40.Karnes JH, Bastarache L, Shaffer CM, Gaudieri S, Xu Y, Glazer AM, Mosley JD, Zhao S, Raychaudhuri S, Mallal S et al. Phenome-wide scanning identifies multiple diseases and disease severity phenotypes associated with HLA variants. Sci Transl Med 2017, 9(389). [DOI] [PMC free article] [PubMed]
- 41.Liu H, Doke T, Guo D, Sheng X, Ma Z, Park J, Vy HMT, Nadkarni GN, Abedini A, Miao Z, et al. Epigenomic and transcriptomic analyses define core cell types, genes and targetable mechanisms for kidney disease. Nat Genet. 2022;54(7):950–62. [DOI] [PubMed] [Google Scholar]
- 42.Sheng X, Guan Y, Ma Z, Wu J, Liu H, Qiu C, Vitale S, Miao Z, Seasock MJ, Palmer M, et al. Mapping the genetic architecture of human traits to cell types in the kidney identifies mechanisms of disease and potential treatments. Nat Genet. 2021;53(9):1322–33. [DOI] [PMC free article] [PubMed] [Google Scholar]
- 43.Avraham S, Korin B, Chung JJ, Oxburgh L, Shaw AS. The Mesangial cell - the glomerular stromal cell. Nat Rev Nephrol. 2021;17(12):855–64. [DOI] [PubMed] [Google Scholar]
- 44.Bale S, Verma P, Varga J, Bhattacharyya S. Extracellular matrix-derived damage-Associated molecular patterns (DAMP): implications in systemic sclerosis and fibrosis. J Invest Dermatol. 2023;143(10):1877–85. [DOI] [PubMed] [Google Scholar]
- 45.Tran T, Lindstrom NO, Ransick A, De Sena Brandine G, Guo Q, Kim AD, Der B, Peti-Peterdi J, Smith AD, Thornton M, et al. In vivo Developmental trajectories of Human Podocyte inform in Vitro differentiation of pluripotent stem cell-derived podocytes. Dev Cell. 2019;50(1):102–e116106. [DOI] [PMC free article] [PubMed] [Google Scholar]
- 46.Zhang S, Wu J, Zhu X, Song H, Ren L, Tang Q, Xu X, Liu C, Zhang J, Hu W, et al. A novel approach to identify the mechanism of mir-145-5p toxicity to podocytes based on the essential genes targeting analysis. Mol Ther Nucleic Acids. 2021;26:749–59. [DOI] [PMC free article] [PubMed] [Google Scholar]
- 47.Han M, Wang Y, Huang X, Li P, Liang X, Wang R, Bao K. Identification of hub genes and their correlation with immune infiltrating cells in membranous nephropathy: an integrated bioinformatics analysis. Eur J Med Res. 2023;28(1):525. [DOI] [PMC free article] [PubMed] [Google Scholar]
- 48.Xu C, Yang C, Ye Q, Xu J, Tong L, Zhang Y, Shen H, Lu Z, Wang J, Lai E, et al. Mosaic PKHD1 in polycystic kidneys caused aberrant protein expression in the Mitochondria and Lysosomes. Front Med (Lausanne). 2021;8:743150. [DOI] [PMC free article] [PubMed] [Google Scholar]
- 49.Dhillon P, Park J, Hurtado Del Pozo C, Li L, Doke T, Huang S, Zhao J, Kang HM, Shrestra R, Balzer MS, et al. The nuclear receptor ESRRA protects from kidney disease by coupling metabolism and differentiation. Cell Metab. 2021;33(2):379–94. e378. [DOI] [PMC free article] [PubMed] [Google Scholar]
- 50.Zhan J, Zhou L, Zhang H, Zhou J, He Y, Hu T, Le Y, Lin Y, Wang J, Yu H, et al. A comprehensive analysis of the expression, immune infiltration, prognosis and partial experimental validation of CHST family genes in gastric cancer. Transl Oncol. 2024;40:101843. [DOI] [PMC free article] [PubMed] [Google Scholar]
- 51.Fogo AB. Mechanisms of progression of chronic kidney disease. Pediatr Nephrol. 2007;22(12):2011–22. [DOI] [PMC free article] [PubMed] [Google Scholar]
- 52.Uffelmann E, Huang QQ, Munung NS, de Vries J, Okada Y, Martin AR, Martin HC, Lappalainen T, Posthuma D. Genome-wide association studies. Nat Reviews Methods Primers. 2021;1(1):59. [Google Scholar]
- 53.Pimpalwar N, Czuba T, Smith ML, Nilsson J, Gidlof O, Smith JG. Methods for isolation and transcriptional profiling of individual cells from the human heart. Heliyon. 2020;6(12):e05810. [DOI] [PMC free article] [PubMed] [Google Scholar]
- 54.Fang R, Preissl S, Li Y, Hou X, Lucero J, Wang X, Motamedi A, Shiau AK, Zhou X, Xie F, et al. Comprehensive analysis of single cell ATAC-seq data with SnapATAC. Nat Commun. 2021;12(1):1337. [DOI] [PMC free article] [PubMed] [Google Scholar]
Associated Data
This section collects any data citations, data availability statements, or supplementary materials included in this article.
Supplementary Materials
Data Availability Statement
The datasets used during the current study are available from open database and published studies. The datasets analyzed were listed in supplementary datasets. More details are available from the corresponding author on reasonable request.


