Abstract
Compound identification in small-molecule research, such as untargeted metabolomics or exposome research, relies on matching tandem mass spectrometry (MS/MS) spectra against experimental or in silico mass spectral libraries. Most software programs use dot product similarity scores. Here we introduce the concept of MS/MS spectral entropy to improve scoring results in MS/MS similarity searches via library matching. Entropy similarity outperformed 42 alternative similarity algorithms, including dot product similarity, when searching 434,287 spectra against the high-quality NIST20 library. Entropy similarity scores proved to be highly robust even when we added different levels of noise ions. When we applied entropy levels to 37,299 experimental spectra of natural products, false discovery rates of less than 10% were observed at entropy similarity score 0.75. Experimental human gut metabolome data were used to confirm that entropy similarity largely improved the accuracy of MS-based annotations in small-molecule research to false discovery rates below 10%, annotated new compounds and provided the basis to automatically flag poor-quality, noisy spectra.
Liquid chromatography (LC) coupled to accurate MS/MS is the predominant technique to analyze complex mixtures of small molecules in various matrices1,2. Compound annotation in untargeted LC–MS/MS analyses is mostly performed by similarity matching of the experimental spectra against libraries of spectra of known compounds such as NIST (NIST Tandem Mass Spectral Library), MassBank of North America (MassBank.us; http://massbank.us) or other large public repositories such as Global Natural Products Services (GNPS)3. Recovering correct hits therefore relies on the accuracy of the MS/MS similarity algorithm.
In proteomics, much research has been devoted to improving accuracy in matching MS/MS spectra to peptides and proteins, including research on false discovery rates (FDRs)4–7. Conversely, for small-molecule research, MS/MS-matching algorithms have not been extensively tested to date. Most software programs rely on dot product vector calculations for MS/MS similarity testing, sometimes by weighing specific ions more than other ions8,9. However, comparing two data matrices in mathematical terms is very often probed in various fields of science, from image analysis to statistics. We hypothesized that other algorithms in matrix comparison might be more suitable for MS/MS similarity matching than dot product similarity scores.
To this end, we found that 42 methods could be successfully adapted for testing their suitability for small-molecule MS8,10–14. In addition, we developed a tool that outperformed all classic algorithms by adapting concepts from information theory. We termed this method ‘spectral entropy similarity’ and applied this method to data processing by utilizing the information content in MS/MS comparisons. We comprehensively compare the accuracy of spectral entropy similarity searches by using the NIST20 library and we show its robustness against other scoring algorithms even if random noise ions are added to test spectra. However, mass spectrometrists have to embrace further tools to improve overall confidence in small-molecule annotations. The number of possible isomers in small-molecule research is so large that only a combination of accurate MS/MS data with retention time, collision cross-section data and biological background information will eventually yield overall high confidence in compound identification.
Results
Using spectral entropy as metrics for spectral information.
Collision-induced dissociation tandem mass spectra represent the likelihood of fragmentations and rearrangements and the relative stability of fragment ions until they are recorded in the MS detector. Because small molecules can have drastic differences in bond energies as well as in stabilizing molecule substructures (such as aromatic rings), the number of fragment ions per MS/MS spectrum varies drastically across all molecules in mass spectral libraries. Often, small molecules yield only a few abundant fragment ions in MS/MS. While it is well recognized that the chances of false-positive identifications depend on the overall number of fragment ions, the intensities of ions also confer important information.
A suitable measure for the total information content of an MS/MS spectrum may therefore be spectral entropy, an application of Shannon entropy from information theory15 (Fig. 1a). Based on this definition, the minimum spectral entropy is zero for a single fragment ion (Fig. 1b). If all ions have the same intensity, a maximized spectral entropy is reached at ln (number of ions). We can calculate a normalized spectral entropy to range between 0 to 1 by dividing the spectral entropy by ln (number of ions). Example spectra show typical number of fragment ions ranging from 1–50, but neither the size of the molecule nor the apparent complexity of structures are sufficient to readily predict the number of observed fragment ions (Fig. 1b and Extended Data Fig. 1). For example, the complex molecule guanosine yields only one abundant fragment ion, whereas the smaller and less-complex amino acid valine gives multiple abundant ions owing to a large diversity of stable fragmentation and rearrangement reactions. Hence, while spectral entropy increases with the number of fragment ions, the information content varies by fragment intensity, leading to a nonlinear relationship (Fig. 1c).
Fig. 1 |. Spectral entropy as a parameter to characterize MS/MS spectra.
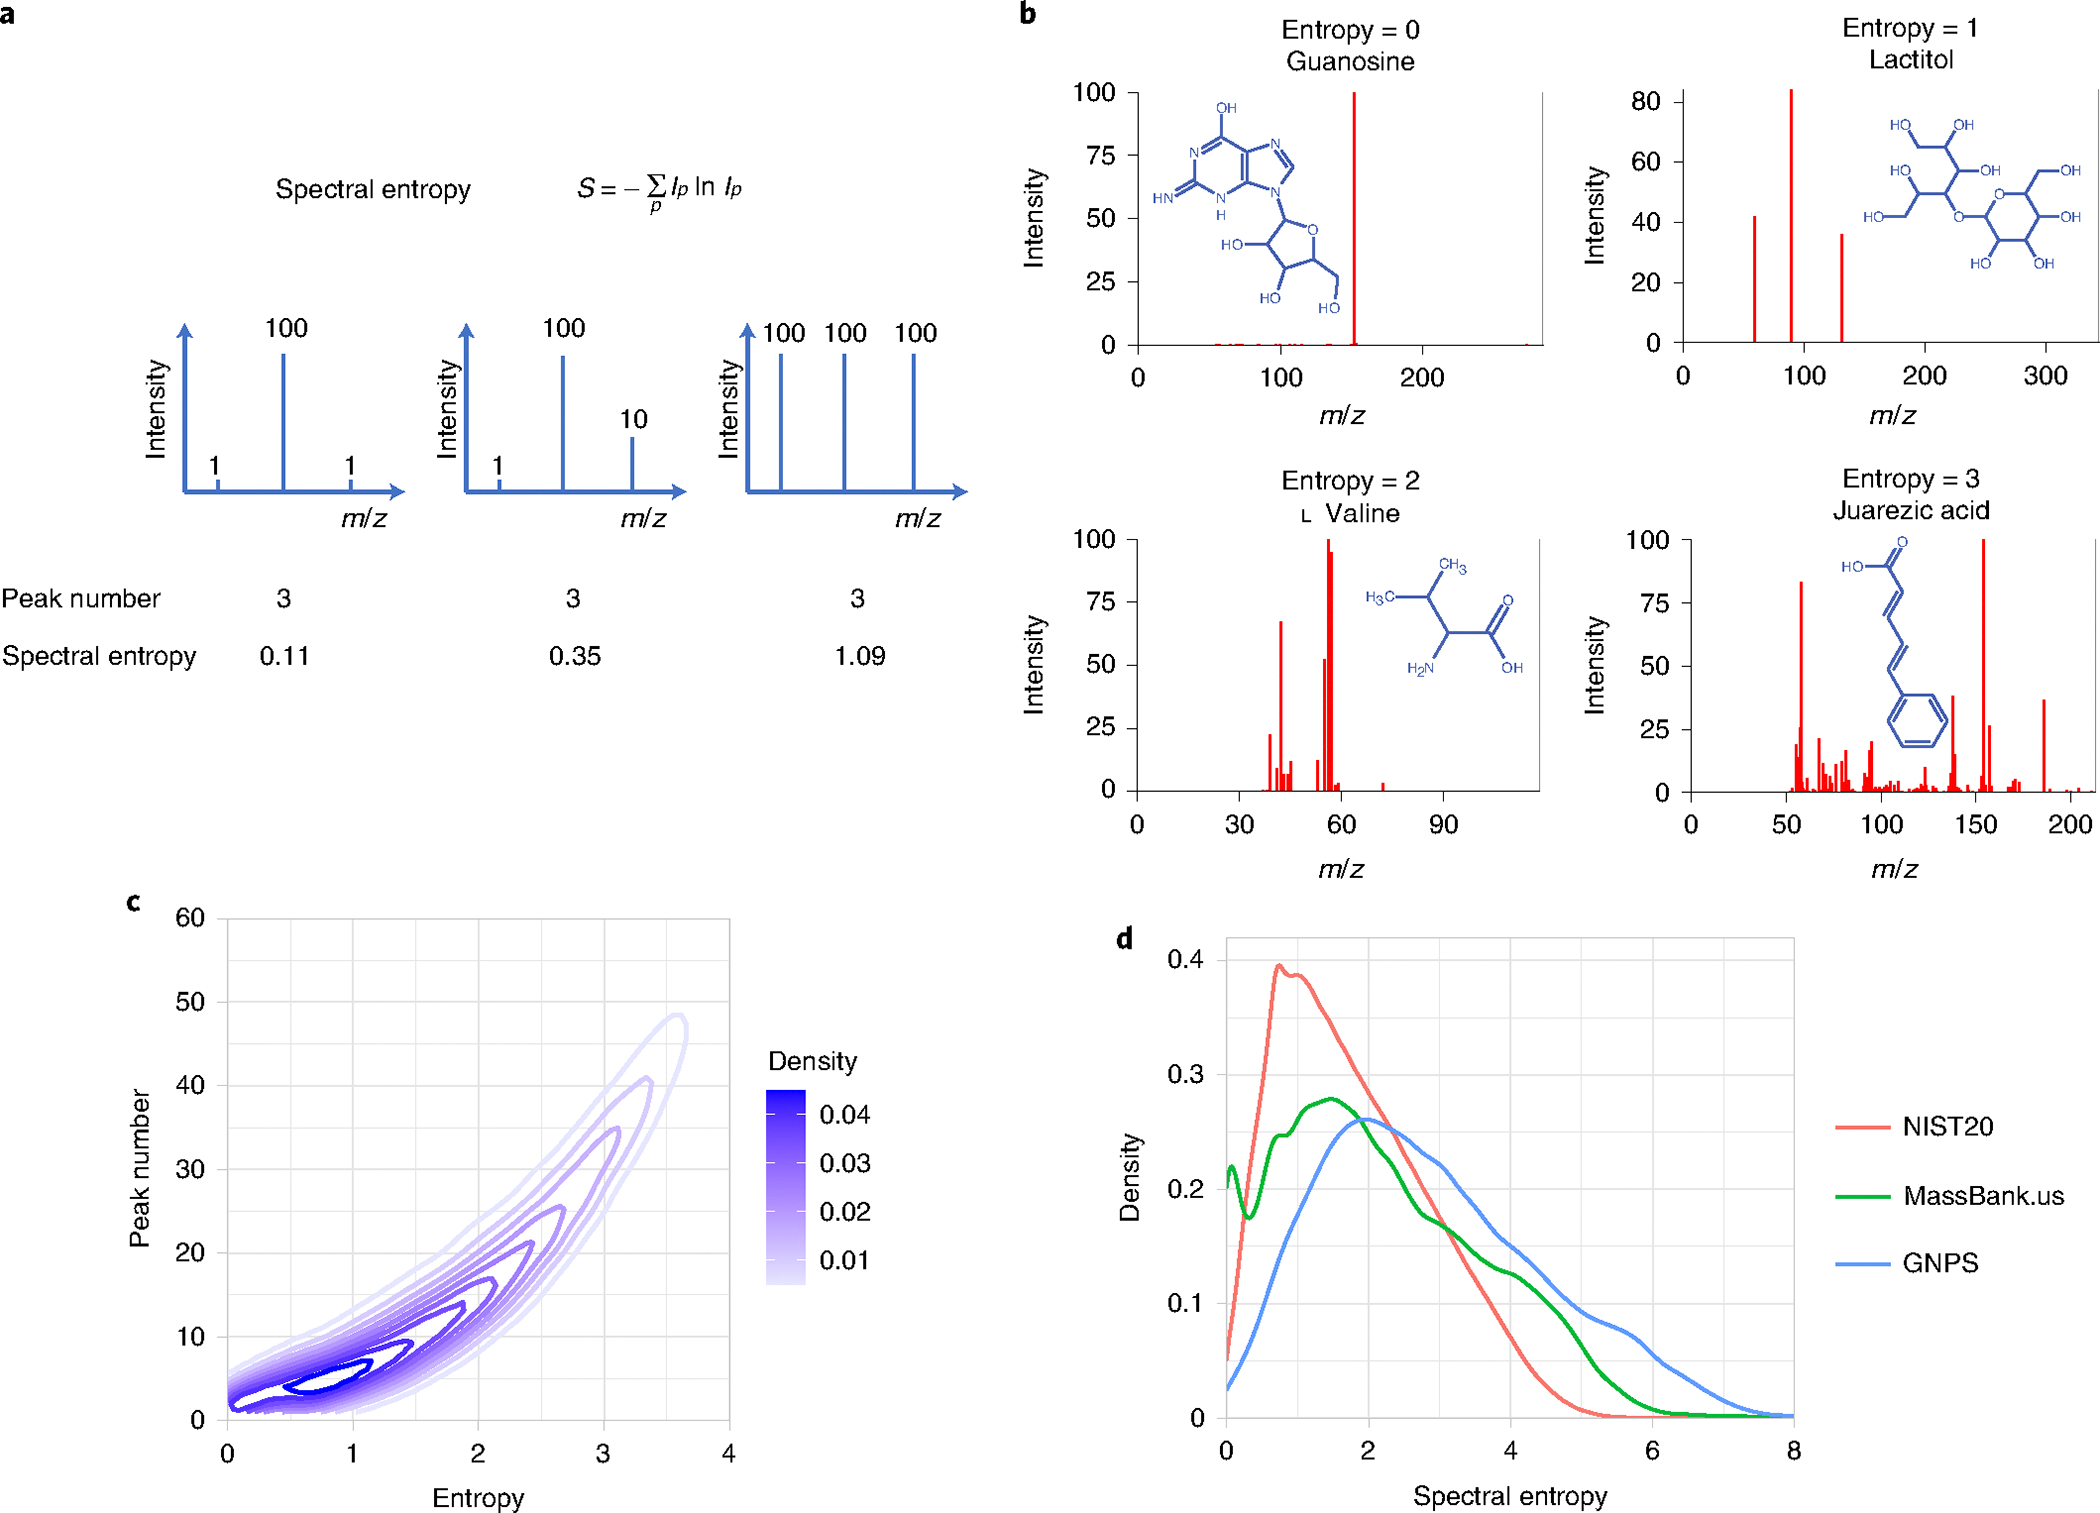
a, Formula to calculate spectral entropy with results for mock-up spectra. b, Spectral entropy calculated for example spectra from MassBank.us with precursor ion peaks in gray. Spectrum of guanosine is generated from Orbitrap with 35 eV; spectrum of lactitol is generated from TripleTOF with 35 eV; spectrum of l-valine is generated from QTOF with 55 eV; and spectrum of juarezic acid is generated from Q exactive HF with 65 eV. c, relationship between spectral entropy and number of MS/MS fragment ions. d, Distribution of spectral entropies in the NIST20, MassBank.us and GNPS databases.
When querying the NIST20 high-resolution MS/MS library, spectra with ten fragment ions had the highest density of spectral entropies ranging from S = 0.5–2.0. At entropy S = 1.0, spectra encompassed 3–15 fragment ions (Fig. 1c). The NIST20 mass spectral library is a commercial database that undergoes extensive manual validation and verification steps, contributing to the high reliability of this resource. In comparison, the freely downloadable databases MassBank.us and GNPS cover more molecules such as natural products but may include a substantial fraction of noise-containing MS/MS spectra or impurities. Consequently, the distribution of spectral entropies differs between the three MS/MS resources (Fig. 1d). The NIST20 database contains spectra generated in-house from QTOF and Orbital Ion Trap mass spectrometers, with 57% of the mass spectra ranging from spectral entropy S = 1–3 (Fig. 1d), with a maximum density at S = 1. In comparison, MassBank of North America accumulates publicly available mass spectra from across the world and any type of instrument. Its entropy range is found between 0–5 covering for 48% of its mass spectra between S = 1–3. The natural products GNPS database shows a similar entropy density of S = 1–3 of 48% (Fig. 1d) as MassBank.us, but a significantly higher number of compounds exceeding S = 5, possibly reflecting the diversity of molecules and data-processing methods.
We found a notable contribution of low-abundant ions to spectral entropy. In experimental mass spectra, low-intensity ions can originate from interference with background chemicals or even co-eluting isobaric compounds, in addition to instrument-related background. Those noise ions negatively affect the quality and confidence in spectral identifications. When restricting noise ions by removing all signals with <1% base peak intensity, GNPS showed a significantly lower number of spectra with entropy levels S > 5, much more in line with spectra found in the MassBank. us (Supplementary Fig. 1). Although there is no generally accepted limit to automatically detect and remove noise ions for single mass spectra, it seems that S > 5 may indicate a higher contribution of low-abundant ions. Such limits may be useful for library curation and automatic data-processing workflows.
The extent of MS/MS fragmentation is determined by both the molecular structure and the energy applied in the collision-induced dissociation. Consequently, the median entropy of all high-resolution NIST20 compounds increased from entropy S = 0.7–0.8 at <15 eV collision energy to S = 1.8–2.5 at >45 eV collision energy (Extended Data Fig. 2a). We also observed slightly higher median entropy levels for MS/MS spectra of positively charged molecules than under negative electrospray conditions (Extended Data Fig. 2a). These findings imply that spectral information is richer at collision energies >15 eV. Individual molecules with different collision energies in the NIST20 library showed much larger increases in spectral entropy under positive electrospray MS/MS than under negative electrospray conditions (Extended Data Fig. 2b), confirming the spectral entropy density diagrams in Extended Data Fig. 2a. Initial stark increases in spectral entropy at low collision energy differences were followed with linear association of collision energy differences and entropy levels between 10–37 eV, followed by shallower increases. That means, drastic increases from the lowest energy MS/MS spectrum will not lead to proportionally equal drastic increases in spectral entropy: the number of ways how small molecules fragment and rearrange are limited. At >45 eV collision energy under positive electrospray conditions, the highest entropy density was found at S = 3 (Extended Data Fig. 2a), suggesting that such high-energy collisions should only be used for compounds that show very little fragmentation at lower energies. At spectral entropy levels S > 3, molecules tend to fragment so heavily that mechanistic interpretations of neutral losses and secondary fragmentations are impeded (Extended Data Fig. 1). While most compounds showed information-rich fragment spectra without fragmenting too strongly between 20–40 eV collision energies, different classes of molecules showed different ranges in entropy levels. We used the ClassyFire algorithm16 to categorize compound classes that were represented by at least 50 molecules in the NIST20 library (Extended Data Fig. 3). For example, lipids showed higher entropy levels in both (+) and (−) electrospray conditions than any other compound class. Nucleosides showed the lowest entropy levels in (+) electrospray, but still slightly higher than benzenoids or organosulfur compounds under (−) electrospray conditions (Extended Data Fig. 3). Therefore, MS/MS acquisitions at different collision energies is highly advisable for untargeted metabolome or exposome studies.
Using spectral entropy for spectral similarity comparison.
Spectral entropy is particularly useful as a measure to improve the reliability of MS/MS similarity searches between experimental and library spectra. The most commonly used spectral similarity measure is the dot product (cosine) similarity algorithm.8 This method converts two spectra into two unit-vectors and then uses the cosine of the angle between the two vectors to represent their similarity (Fig. 2a). We here propose using the difference in information content, spectral entropy, as a standard method for small-molecule MS/MS similarity matching.
Fig. 2 |. Schema for calculating similarity between MS/MS spectra of small molecules.
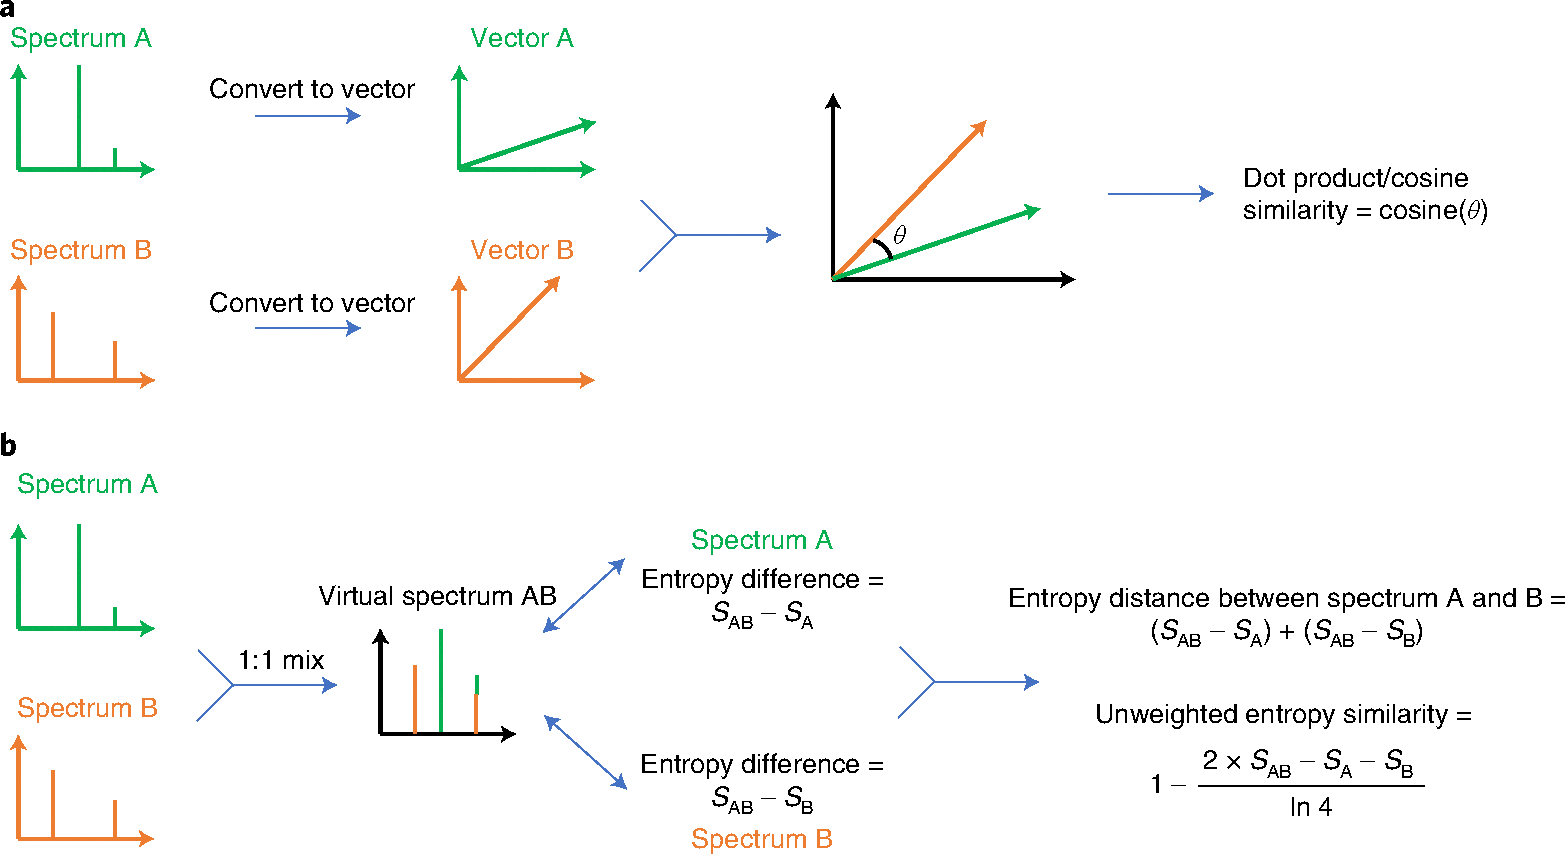
a, Calculating dot product similarity. b, Calculating unweighted entropy similarity.
The physical meaning of the entropy distance is that entropy (chaos) increases when two molecule ion sets are mixed. Hence, entropy distances are calculated by constructing a mixed spectrum of two input spectra (such as an experimental and a library spectrum) and calculating the distance by subtracting the entropy of each of the two input spectra from the mixed spectrum (Fig. 2b). The unweighted entropy similarity is then calculated from this entropy distance divided by the normalized maximum entropy difference (term ln4 in Fig. 2b). We have extended this entropy similarity calculation to accommodate for the fact that highly abundant MS/MS fragment ions are often shared between structurally similar molecules, for example, representing stable heteroatom ring structures. An example is given in Extended Data Fig. 4 comparing MS/MS spectra of ADP and ATP, both showing the adenine fragment m/z 136.062 as base peak. Hence, the difference between highly similar structures may best be discerned from low-abundant ions, which is even more important for compounds with overall low spectral entropy values. Hence, we here suggest a weight function to emphasize low-abundant ions especially for low-entropy MS/MS spectra to calculate the similarity between two small-molecule MS/MS spectra, called entropy similarity (Extended Data Fig. 5). To this end, a dynamic exponential weight function with subsequent normalization was applied to spectra with low spectral entropy S < 3, which are typically found in small-molecule libraries.
Benchmarking the performance of 43 MS/MS similarity measures.
It is surprising that researchers have not systematically evaluated mass spectral similarity scores for small-molecule MS. Once datasets are expressed as matrices, many algorithms for similarity testing have been studied in different fields of science, ranging from information theory to machine-learning approaches17,18. Including similarity entropy, we found and implemented a total of 43 different methods that were suitable to be used in MS/MS spectral similarity comparisons when systematically searching for similarity algorithms in a variety of journals10,17–19 (Supplementary Note 1). In total, we selected 434,287 spectra from the NIST20 library that were associated with either [M + H]+ or [M − H]− adduct ions, accounting for a total of 25,138 molecules. For each test spectrum, all MS/MS spectra within 10 ppm of the tested precursor mass were selected for benchmarking the MS/MS similarity algorithms. We used only protonated or deprotonated ions because these adducts were found to be the most common ion species. If we had selected additional adducts such as [M + Na]+, fewer isomers would be retrieved for a given accurate precursor mass, leading to an artificially higher rate of true positives. Overall, our algorithm benchmarking tests therefore included 25,555,973 pairs of mass spectra that originated from identical molecules (recorded with a different mass spectrometer or recorded with the same mass spectrometer at a different collision energy), but also mass spectra from isomeric structures or isobaric molecules, with 10 ppm precursor mass differences. These comparisons enabled us to enumerate true-positive and false-positive spectral hits. Histogram diagrams for the number of mass spectra and the number of achiral molecule structures within 10 ppm precursor mass windows are given in Supplementary Fig. 2 to give an overview of the NIST20 spectral databases used to determine FDRs.
We used each of the 434,287 MS/MS spectra and searched them against all alternative candidate spectra and candidate molecules in the NIST20 library within 10 ppm precursor mass windows. We performed the search with two different parameters: with or without the precursor ions removal. Using the first part of InChIKeys, we calculated true-positive and false-positive rates to construct receiver operating characteristics (ROC) curves (Fig. 3). Some similarity algorithms were clearly underperforming, such as Canberra similarity or Wave hedges similarity, giving the worst areas under the receiver-operator curve (AUC; Supplementary Table 1). On the other hand, 27 algorithms showed better AUCs than the classic dot product similarity method; for example, Bhattacharya 1 similarity and Harmonic mean similarity. Notably, across all 43 tested MS/MS similarity methods, the entropy similarity showed the best performance with an AUC = 0.958, closely followed by the unweighted entropy similarity method. To test the robustness of results when using different spectral databases, we repeated this test using 90,382 high-quality MassBank.us spectra and yielded very similar results (Extended Data Fig. 6 and Supplementary Fig. 3). These data suggests that entropy similarity is the most useful method in small-molecule MS/MS similarity matching.
Fig. 3 |. ROC curves for 43 different spectral similarity algorithms for 434,287 accurate mass MS/MS spectra of the small-molecule NIST20 database.
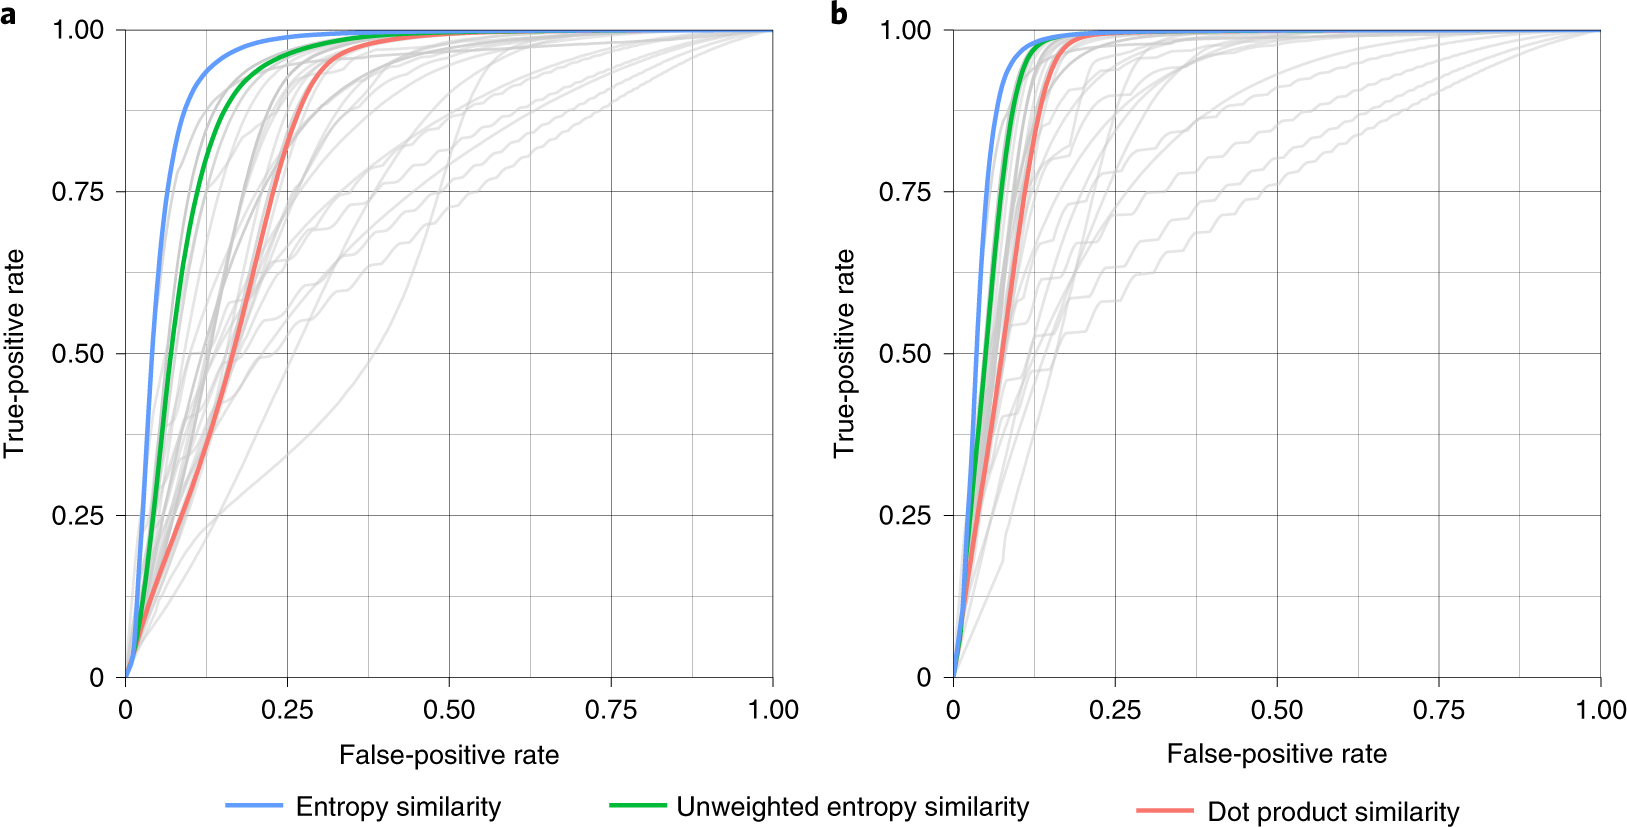
a, Classic spectral similarity tested without precursor ion removal. b, Spectral similarity tested with precursor ion removal. entropy similarity (blue) outperformed all other similarity algorithms including unweighted spectral entropy (green) or classic dot product similarity. For detailed AUC values, see Supplementary Table 1.
Next, we tested the robustness of all algorithms against the contribution of noise ions. To this end, we artificially added noise ions to each queried MS/MS spectrum in a randomized way with different magnitudes and numbers of noise ions20. The resulting benchmark tests showed a remarkable robustness of the entropy similarity method (Fig. 4 and Supplementary Table 1). Neither an increase in total noise intensity (Fig. 4a) nor an increase in the number of noise ions (Fig. 4b) dramatically changed the performance of entropy similarity, which continued to outperform all other methods in all comparisons. In comparison, the AUCs for dot product similarity steadily worsened with more intense noise signals (Fig. 4a). Dot products similarities were also drastically reduced by the presence of even a single intense noise ion (Fig. 4b). In conclusion, spectral entropy similarity proved to be more robust than dot product similarity under the impact of noise ions.
Fig. 4 |. Robustness of MS/MS similarity algorithms against random noise ions.
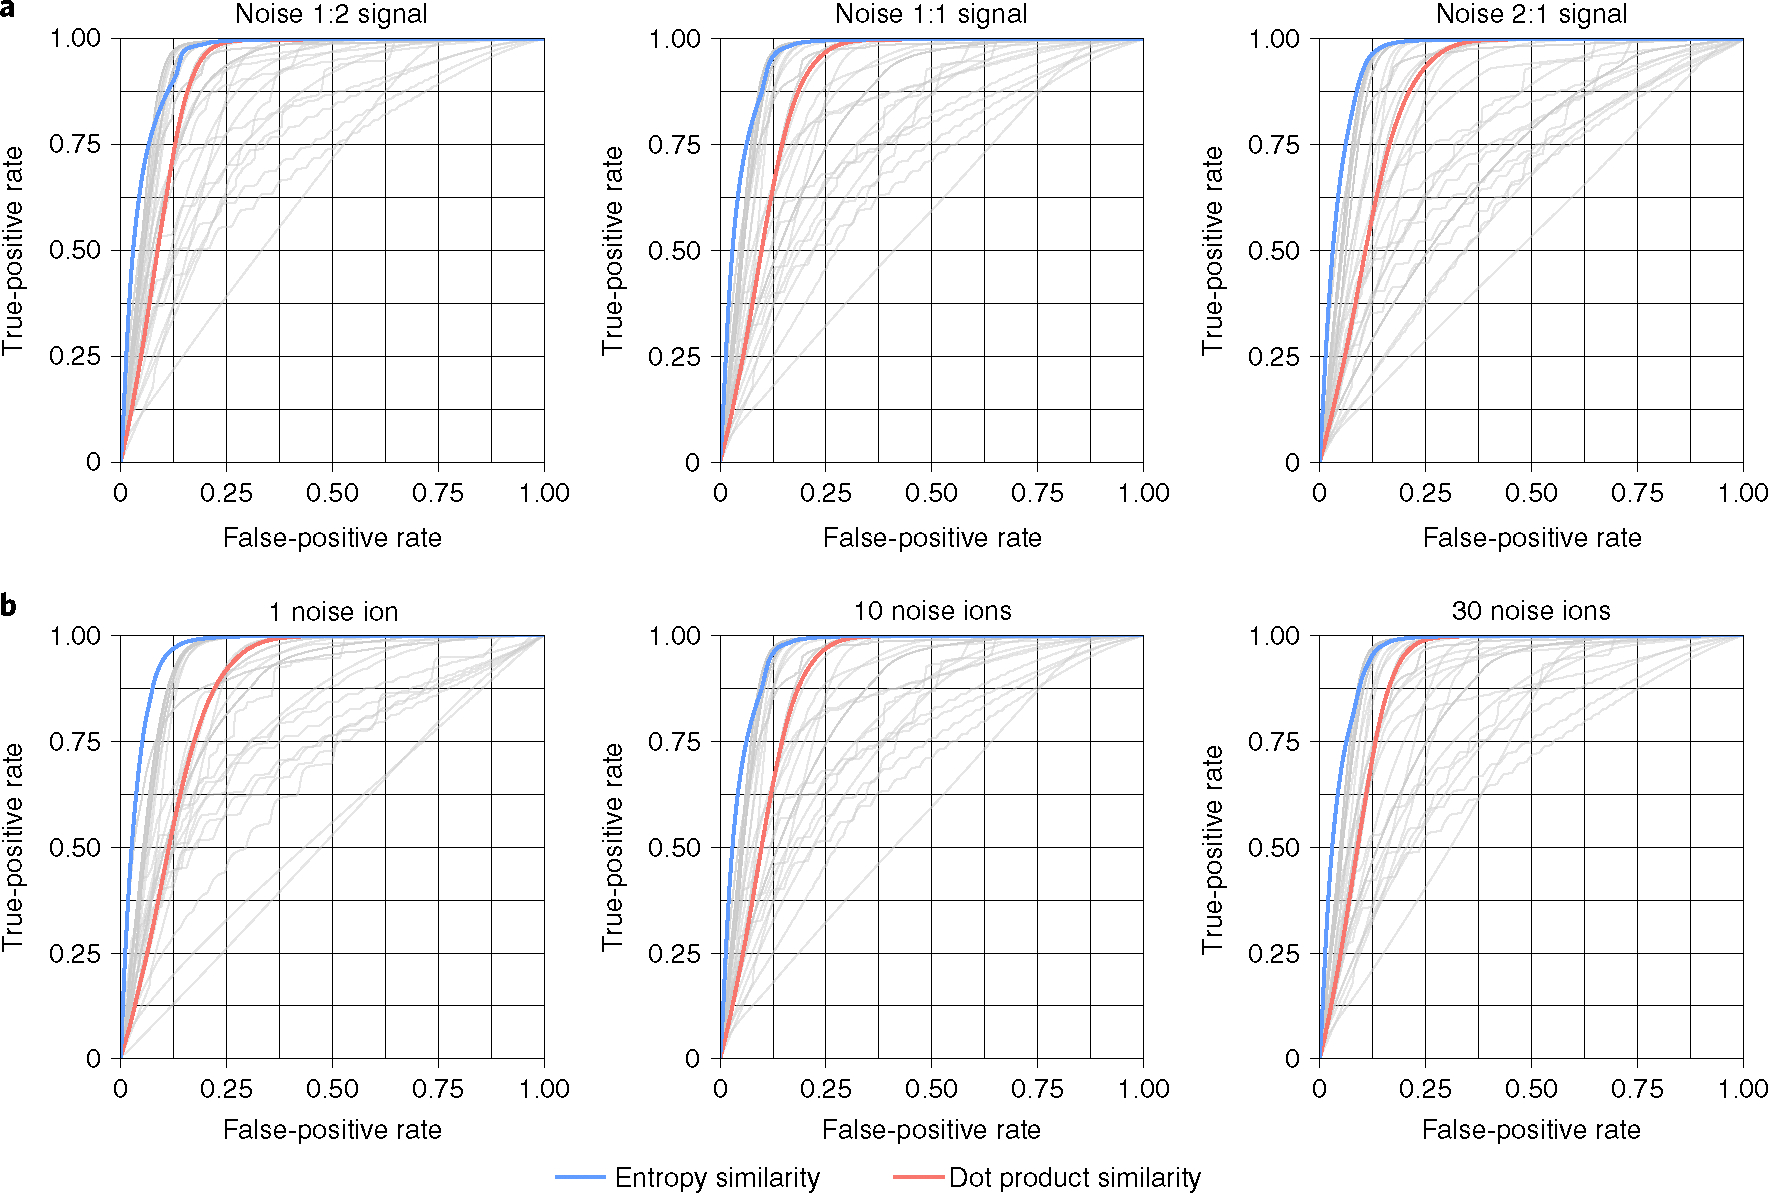
ROC curves for 43 different spectral similarity algorithms applied to the small-molecule NIST20 database with randomly added noise ions. a, robustness against ten added noise ions with different total noise intensities. b, robustness against 1–30 additional noise ions with a total sum intensity equal to the sum intensity of the MS/MS spectrum of each test molecule.
Finally, we tested the performance of spectral entropy similarity by benchmarking the NIST20 library using QTOF MS/MS and orbital ion trap MS/MS spectra against each other. This test was conducted to simulate a typical use of MS/MS libraries in experimental laboratories where users do not separate libraries into different sets of instrument-dependent mass spectra. As expected, the best AUCs were obtained when NIST20 mass spectra were compared against mass spectra of the same instrument type (Supplementary Fig. 4 and Supplementary Table 1). However, acceptable AUCs were even obtained when searching QTOF spectra against orbital ion trap MS/MS libraries or vice versa. In all these comparisons, entropy similarity queries performed best across all 43 similarity search algorithms (Supplementary Table 1).
FDR using MS/MS entropy similarity searches.
FDRs in MS/MS similarity matching has not been widely explored. In classic untargeted LC–MS/MS studies in metabolomics, lipidomics or exposome research, scientists rely on accurate mass and MS/MS matching for compound annotations. Usually, thresholds for similarity scores are employed above which annotations are stated to be likely correct, for example, scores at >0.7 or >0.8 similarity. Using the NIST20 library, we explored how often incorrect achiral molecules are retrieved by entropy similarity at different similarity thresholds (Fig. 5). Notably, about 15% of all searches of spectra with S > 1 yielded false discoveries (Fig. 5a) even at high similarity scores of 0.9. Information-poor (low-entropy) spectra at S < 1 yielded FDR levels >23%. Unweighted entropy similarity gave higher error rates at FDR > 35% at similarity scores of 0.9, demonstrating the importance of low-abundance ion weighting for MS/MS spectra at S < 1.
Fig. 5 |. Relationship between FdR and spectral entropy levels for NIST20 accurate mass MS/MS spectra.
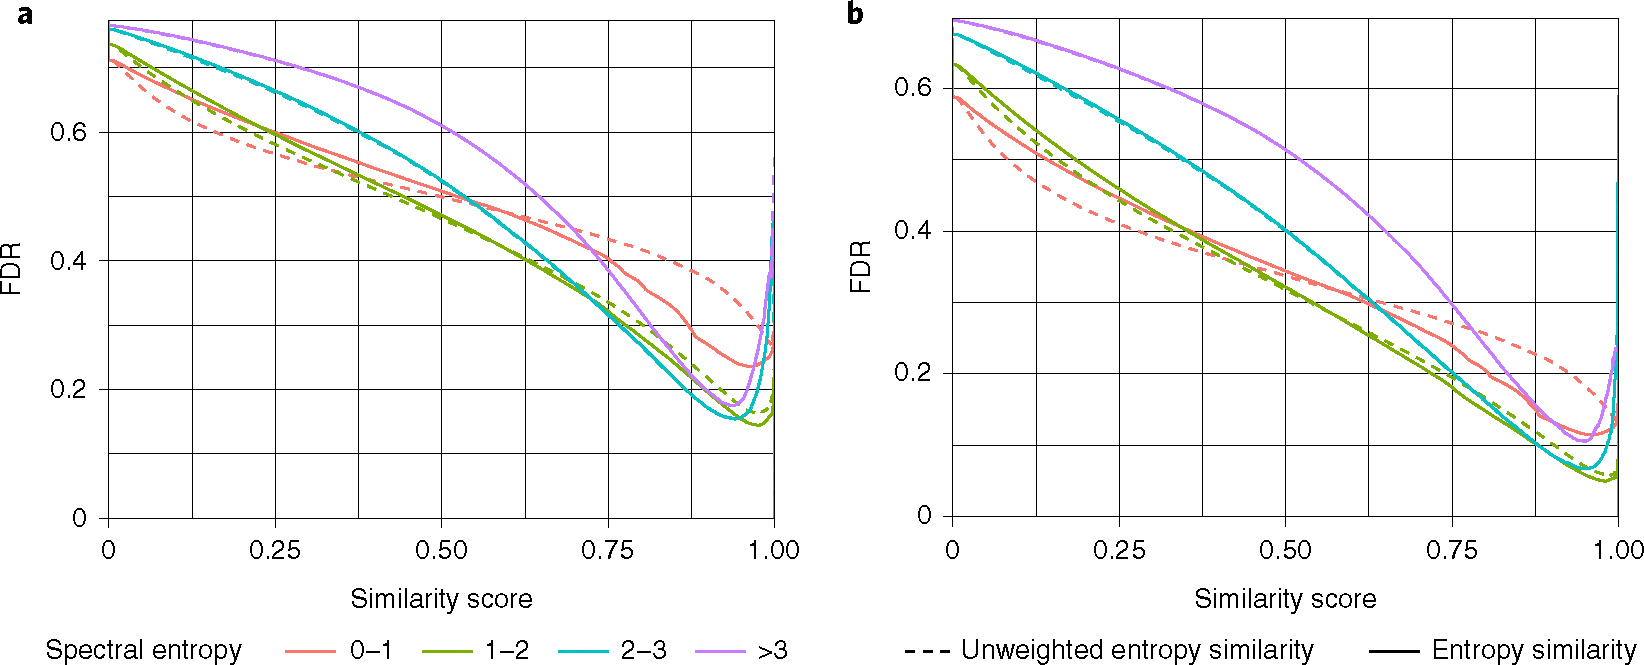
a, Benchmarking results considering only the correct achiral molecule as a true-positive hit. b, Benchmarking results considering the correct achiral molecule or isomers with one-bond differences as a true-positive hit. For details on ‘one-bond different isomers’ see extended Data Fig. 7.
At very high similarity scores >0.95 we found an increase in FDRs in the NIST20 library. This increase is due to mass spectra of isomers that cannot be distinguished by MS/MS alone. For example, isomeric molecules might only differ by the position of a single bond, for example, a single methoxy-group on an aromatic ring (Extended Data Fig. 7). Hence, we extended the search for true-positive molecules to isomers that differed from the test molecule by exactly one bond. We specified this test as ‘one-bond difference MS/MS similarity’ by maximum common substructure (MCS) calculations. Using MCS calculations, we determined the difference between the number of bonds in test molecules and corresponding isomers (Extended Data Fig. 7). Application examples are given in Supplementary Fig. 5. With an entropy similarity cutoff of 0.75, we then selected all false-positive hits and calculated their bond difference to the true-positive molecules (Supplementary Fig. 6). About 30% of the false positives were one-bond isomers and 21.5% were two-bond isomers. Three-bond and higher-bond isomer differences showed fast decreasing proportions. When rating such one-bond isomers as true-positive hits, FDRs markedly improved (Fig. 5b). For MS/MS spectra between S = 1 and S = 3, FDRs declined to <10% at a similarity score of 0.9. Information-poor MS/MS spectra at S < 1 as well as highly fragmented spectra at S > 3 yielded FDRs of 12%. These tests showed that FDRs clearly depend on MS/MS information quality as defined by spectral entropy. In general, similarity scores>0.75 should be employed in untargeted MS/MS searches to keep FDRs at acceptable levels. Results from MS/MS similarities should be ranked based on differences in scores to consider several molecules with close MS/MS similarity scores, instead of relying only on the top hit. In addition, comprehensive compound annotations should include chromatographic, biological and ion mobility likelihoods if possible.
Performance of entropy similarity in experimental data.
As a first test to evaluate the entropy similarity’s performance in experimental data, we selected 37,299 MassBank.us spectra with S > 0 from our experimental Natural Products Library (VF-NPL) and matched these spectra against the NIST20 library. Fifty-six percent of the test spectra did not yield a single hit in the NIST20 library within a 10-ppm precursor mass window. Of the remaining 16,059 MS/MS test spectra, 24.5% did not have a possible true-positive molecule match in the NIST20 library, even when extending molecule searches to one-bond-different isomers. Hence, these experimental spectra could have easily caused false-positive hits. Like in high-throughput laboratory metabolomic experiments, true-positive matches were counted only for the top hit in MS/MS similarity searches. Hence, we did not constrain the search by presence of the queried experimental molecules in the target MS/MS library, and we did not constrain searches to specific types of mass spectrometers or MS/MS energies. Such settings reflect a typical use of libraries in an experimental metabolomics laboratory but may yield a higher FDR compared to computationally generated virtual spectra that fit specific MS/MS settings. Overall, we found consistently better FDR values using entropy similarity than using dot product MS/MS similarity searches (Fig. 6a). Entropy similarity achieved FDR < 10% even at a modest cutoff threshold at 0.75 similarity score, whereas dot product similarity barely reached 15% FDR > 0.95 similarity score thresholds (Fig. 6a).
Fig. 6 |. Relationship between FdRs and spectral similarity in experimental spectra.
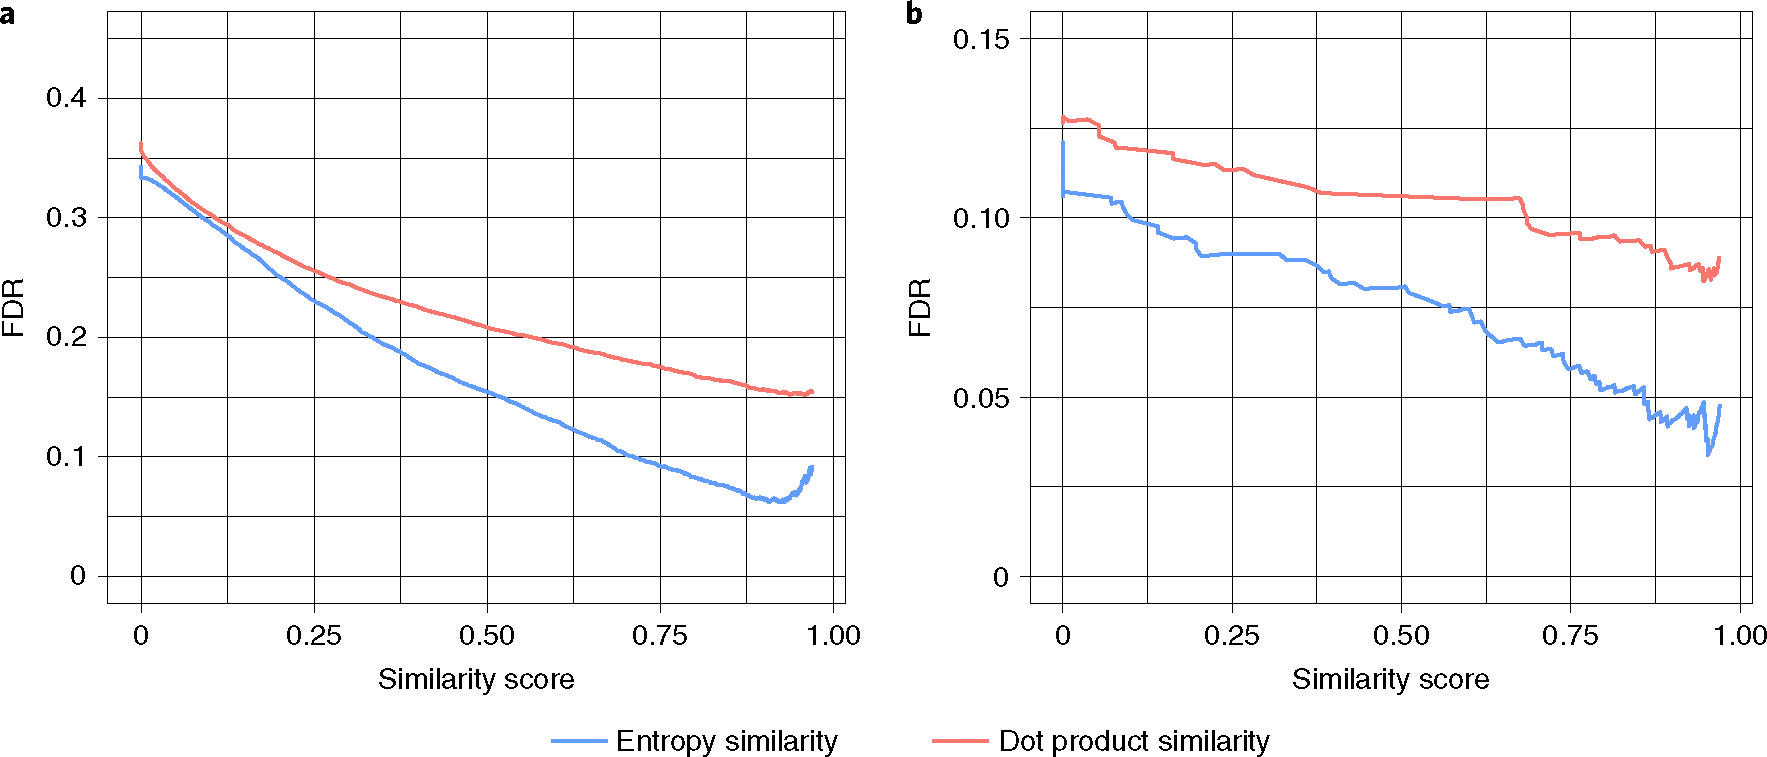
a, Matching 37,299 natural products experimental MS/MS spectra (downloaded from the MassBank.us VF-NPL library) against the NIST20 library. b, Matching 770 experimental human gut intestinal spectra against the NIST20 and MassBank.us libraries.
As a second test to showcase the practical use of entropy similarity versus classic MS/MS matching, we used a metabolome dataset of the human upper gut intestinal tract (MetabolomicsWorkbench ST001794). By retention time and MS/MS matching, and by careful manual curation, we annotated 770 metabolites21. These 770 compounds were used as ‘true positives’ for method comparisons. Just as in the first test above, we found large differences in FDRs between dot product and entropy similarity (Fig. 6b). At a 0.75 similarity score threshold, we obtained only 26 false-positive annotations by precursor ion exclusion and entropy similarity (5.8% FDR), compared to 50 false-positive annotations (9.6% FDR) using dot product similarity of full mass spectra. In addition, the use of entropy similarity yields many additional high-quality MS/MS hits for metabolite annotations. However, such hits require further validation by retention time or collision cross-section (CCS) matching to yield higher confidence levels. We therefore constrained these hit lists using the Retip22 software to exclude metabolites outside the predicted retention time windows. With this combination of entropy similarity and retention time prediction, we retrieved 177 annotated compounds from the previously unknown, manually curated dataset (Supplementary Table 2). In summary, these results demonstrate that entropy similarity with precursor ion exclusion yields better performance under real experimental settings than current practice in metabolomics laboratories.
Third, the use of entropy similarity has an additional practical use for experimental LC–MS/MS data over dot product similarity algorithms. Experimental MS/MS spectra may show a large number of noise ions, but thresholds for noise ions are not clearly defined. When plotted as a histogram of adjusted normalized entropies, our experimental data showed a distinct distribution of all annotated metabolites with a marked difference from noisy spectra of unknowns (Extended Data Fig. 8). MS/MS spectra that did not lead to successful metabolite annotations showed a sharp increase in frequency toward the high end of the scaled data range (1.0). Hence, normalized entropy values can be used to automatically discard spectra as ‘poor quality’ without manual interaction, which may be very helpful for fully automated databases such as GNPS.
Discussion
Entropy is widely used in information theory. We here exploit information theory to convert MS/MS spectra into probability distributions. Subsequently, relative entropy can be used to compare two different probability distributions. The symmetric form of relative entropy, Jensen–Shannon divergence, is mathematically equivalent to the unweighted entropy similarity we used here (Supplementary Note 2). We improved performance of entropy similarity in MS/MS matching by adding weights on the ion intensities in a heuristic manner, especially to increase the relative weight of low-intense ions that are frequently observed in small-molecule MS/MS spectra.
To benchmark different MS/MS similarity methods we had to define the complement of true-positive hits. For experimental MS/MS similarity experiments, known reference chemicals can be added into a sample matrix in a blinded fashion. The ENTACT study23,24 has been conducted to explore overall compound identification schemes, but these data are not yet publicly available. Estimating FDR values is further complicated in untargeted LC–MS/MS analyses due to the impact of library sizes used for comparison. When very small compound libraries are queried, false-positive hits will be much less likely than if large libraries are used. But even for large matching libraries, false-positive hits may be rare if there is little structural or MS/MS overlap between experimental and library entries. Alternatively, approaches to benchmarking confidence in compound identification may rely on virtual, in silico-generated mass spectra. The problem with computational small-molecule decoy MS/MS libraries is that, by definition, such mass spectra have not been experimentally determined and may not reflect possible spectra of likely occurring small molecule. Hence, FDRs that are calculated based on computational decoy libraries may be artificially low25. In contrast, the NIST20 test library that we used to test the performance of entropy similarity contained many spectra of molecules that share high structural similarities. Our method development tests yielded even higher FDRs because the actual true spectrum (the NIST20 test spectrum) was removed from the NIST20 library itself. Positive hits were only found when spectra showed high similarity in slightly different collision energies. However, when applied to experimental spectra downloaded from MassBank.us and applied to the NIST20 library, we showed that entropy similarity outperformed FDR data compared to classic dot product similarity methods, despite differences in experimental settings such as noise levels and instruments of collision energies, similar to use in experimental nontargeted screening.
It is noteworthy that a range of other similarity scores also yielded better AUCs than classic dot product similarity. Specifically, the Fidelity score is a straightforward similarity assessment using the product of all matching ions, ignoring fragment ion mismatches. The Bhattacharya similarity uses a normalized variant of the Fidelity score and also reached very high AUCs, albeit still lower than achieved by entropy similarity. We noted that entropy similarity performed better than unweighted entropy similarity. This was especially true for spectra with low entropy at S < 1.5. Such low-entropy-spectra are a characteristic of small-molecule spectral libraries, simply because small molecules often do not have many fragile bonds to be fragmented in MS/MS experiments. In principle, power transformations at w < 1 as applied in our entropy similarity formula increases the weight of low-abundant ions. However, if such power transformations are used for ion-rich spectra with high entropy values, similarity scoring performance is decreased. For this reason we added a cutoff threshold for spectra at S > 3. Here, we report an approach to extend MS/MS similarity measures to isomeric molecules using a one-bond-difference approach, with a marked improvement in FDRs. This approach is especially helpful in untargeted screens to find hits of highly similar structures, instead of simply using the top-scoring algorithm as the best hit.
The relationship between FDRs and spectral similarity scores depends on the quality of spectra. While noise ions generally decrease similarity scores, they do not necessarily increase the chance for false hits for a given MS/MS library. Hence, for high-quality spectra as used in the NIST20 library, higher similarity scores are needed for good FDRs than in typical experimental metabolomic or exposome MS/MS data sets. The entropy similarity score showed marked robustness against noise ions, independent of the number of ions or total noise intensity. In comparison, the performance of dot product similarity searches was more affected by noise ions. Our results show that accurate mass and MS/MS similarity alone will only give FDRs of <5% if either the molecule search databases are very small (if most false isomers can be excluded from searches by a priori information) or if isomers can be collapsed to highly similar structures. For such isomer-similarity searches, we here introduce a one-bond difference as a metric to improve FDR for collectives of highly similar molecules. Nevertheless, even with entropy similarity scores, no single similarity threshold can be defined that would prevent false-positive discoveries. Instead, MS/MS similarity must be complemented by other experimental measures such as retention time matching22,26–28, molecular cross-section comparisons29,30 or stable isotope labeling31 to add confidence in overall compound identification workflows.
Methods
Calculating spectral entropy similarity.
High-resolution spectra were downloaded from the licensed NIST20 library (NIST Tandem Mass Spectral Library, 2020 release). Additionally 142,903 experimental MS/MS spectra were obtained from the public MassBank of North America database (https://massbank.us) and 33,019 mass spectra were downloaded from the GNPS (where library names start with ‘GNPS’). Metabolite structures were classified using the ClassyFire algorithm (final release, v.2.0) to assign compound class information to all individual molecules16. To calculate spectral entropy, the peaks from MS/MS spectrum were centroided first, then all ion intensities were adjusted to have sum = 1, by dividing the ion intensities by the total intensity. Spectral entropies were calculated from all ion intensities according to equation (1):
| (1) |
To calculate the unweighted entropy similarity between two mass spectra A and B, we first generated a combined mass spectrum AB by 1:1 mixing the normalized mass spectra A and B, merge ions with m/z in MS/MS tolerance and renormalized all ion intensities again to have sum = 1 by dividing the ion intensities by 2. The unweighted entropy similarity between mass spectra A and B is then calculated according to equation (2):
| (2) |
Figure 2 visualizes the procedures. To calculate entropy similarities by dynamically weighted factors, we applied an additional transformation to all ions in a spectrum if . Intensity weighted factors were applied according to equation (3):
| (3) |
This transformation therefore gives more weight to low-intensity ions than to high-intensity ions. The transformed ion intensities were then normalized again to have all ion intensities summing to 1. We tested the different entropy cutoffs from 0.5 to 5, compared the AUC in different benchmarking scenario and used 3 as the cutoff (Extended Data Fig. 5b). This transformation proved especially useful for low-entropy mass spectra that are characterized by a low number of total fragment ions (Extended Data Fig. 5a).
Benchmarking spectral similarity algorithms.
Algorithms were compiled from a landmark report on mathematical similarity calculations. Some methods were found unsuitable for MS/MS similarity searches, such as algorithms that do not accept zero-intensity values. Overall, we implemented 43 different similarity algorithms (Supplementary Note 1) in Python 3.7.9. The source codes of the similarity algorithms are freely available from https://github.com/YuanyueLi/SpectralEntropy. For similarity performance benchmarking, we used the NIST20 and Massbank.us mass spectral database. The benchmarking code was written in Python 3.7.9 and R 3.6.3. To remove noise, low-abundance ions at <1% base peak intensity were removed, and ions were matched at 0.05 Da tolerance. The test spectrum itself was removed from the library. For each MS/MS similarity algorithm, true-positive matches were defined if the correct achiral structure was retrieved above a given similarity score, using the first term of the InChIKey. False-positive matches were recorded if a different molecule was found to score above a given similarity score, but not the true molecule itself. Ranking different hits was not performed (this method did not simply use the best-matching hit). FDRs were then calculated by equation (4):
| (4) |
False-positive rates were calculated by equation (5):
| (5) |
True-positive rates were calculated by equation (6):
| (6) |
Adding random noise ions to MS/MS spectra.
To test the robustness of the entropy similarity algorithm, noise ions were artificially added to NIST20 mass spectra on the basis of total relative intensity of added noise and based on the number of added noise ions. The relative intensity of spectral noise was generated by Poisson distribution20 with equation (7):
| (7) |
Here is the probability that peaks with this intensity will be generated. The m/z values of noise peaks were randomly sampled from a uniform distribution between 0 to the precursor ion m/z. Once a predefined number of noise ions were generated, their total intensity was normalized to the levels of experimental ion intensities.
Extended Data
Extended Data Fig. 1 |. Example spectra with different spectral entropy.
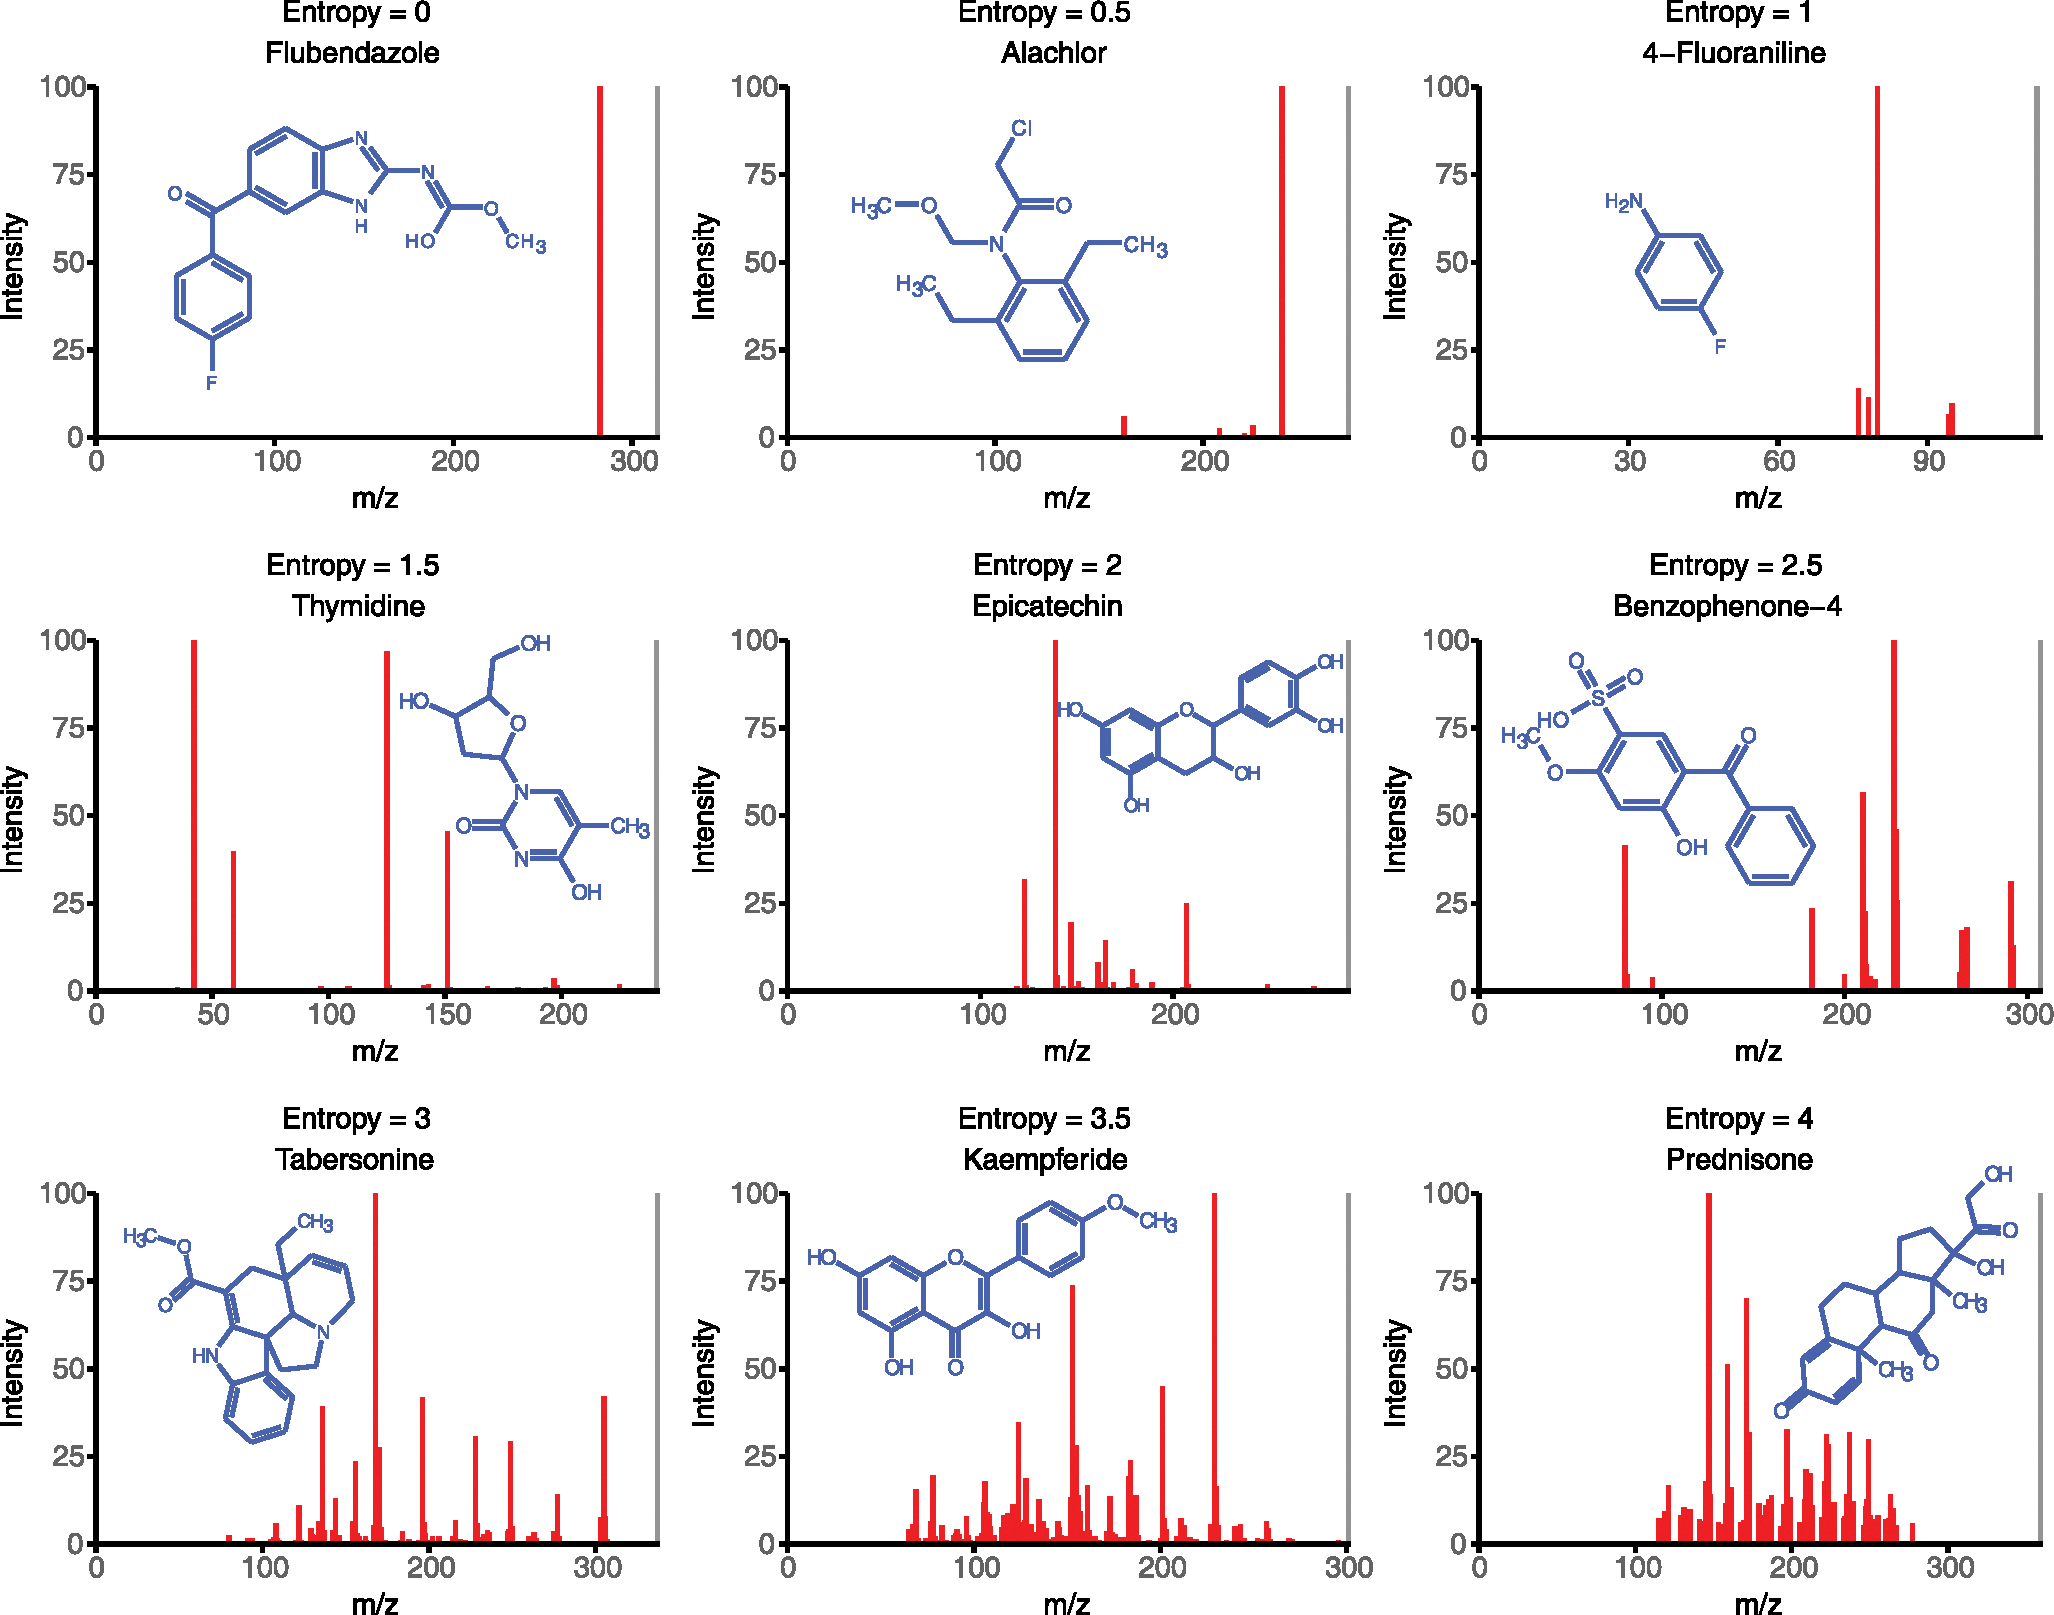
Examples of experimental MS/MS spectra downloaded from MassBank.us that are characteristic for spectra with entropy levels 0–4. The precursor ion is shown in grey.
Extended Data Fig. 2 |. Impact of collision energy on spectral entropy.
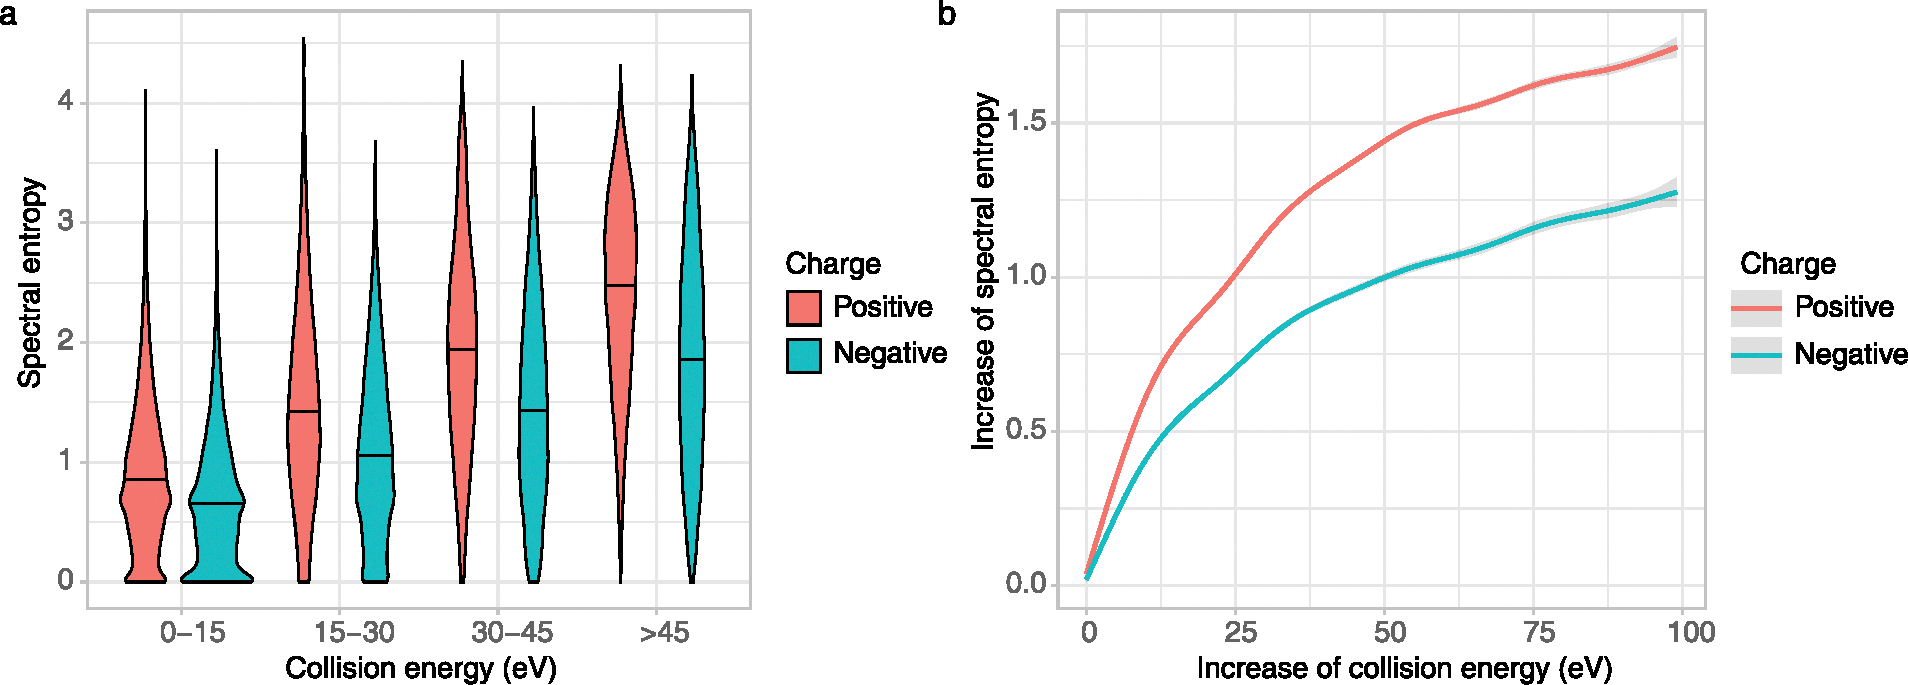
(a) Spectral entropy violin density plots for low energy (<15 eV), mid-energy (15–45 eV) and high- energy (>45 eV) high resolution NIST20 MS/MS spectra. (b) relationship between the increase of collision energy and the increase of spectral entropy in NIST20 MS/MS spectra for positively and negatively charged molecules.
Extended Data Fig. 3 |. Distribution of spectral entropy within compound classes in the NIST20 MS/MS library consisting of at least 50 molecules with collision energies between 20–40 eV.
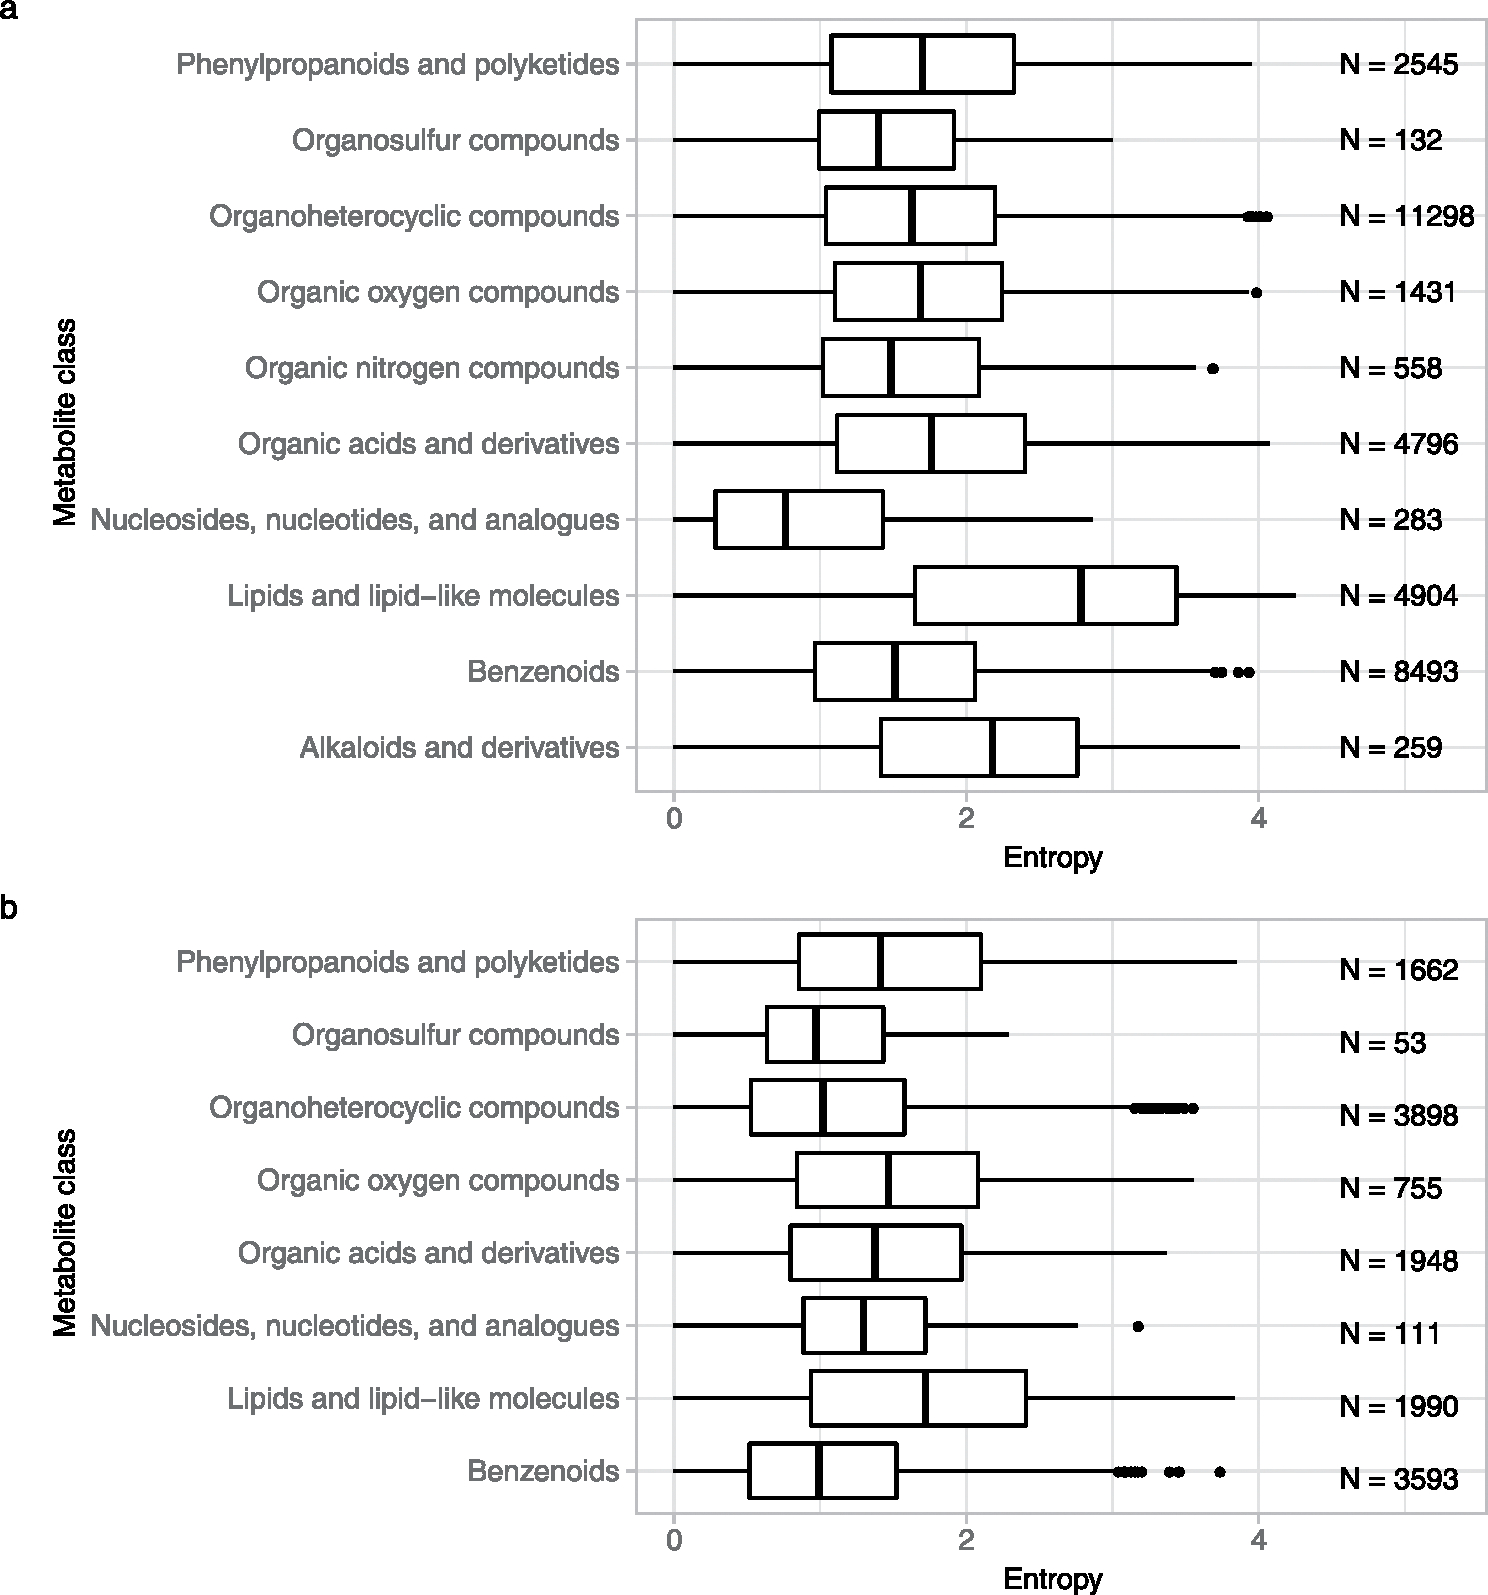
The number of spectra is shown on the right of each compound class. For each boxplot, the center is the median. Left and right hinges depict the first and third quartiles. The whiskers stretch to 1.5-times the interquartile range of the corresponding hinge. (a) Positive mode electrospray MS/MS spectra (b) Negative mode electrospray MS/MS spectra.
Extended Data Fig. 4 |. NIST20 Orbitrap MS/MS spectra for ATP and AdP at collision energy 30 eV.
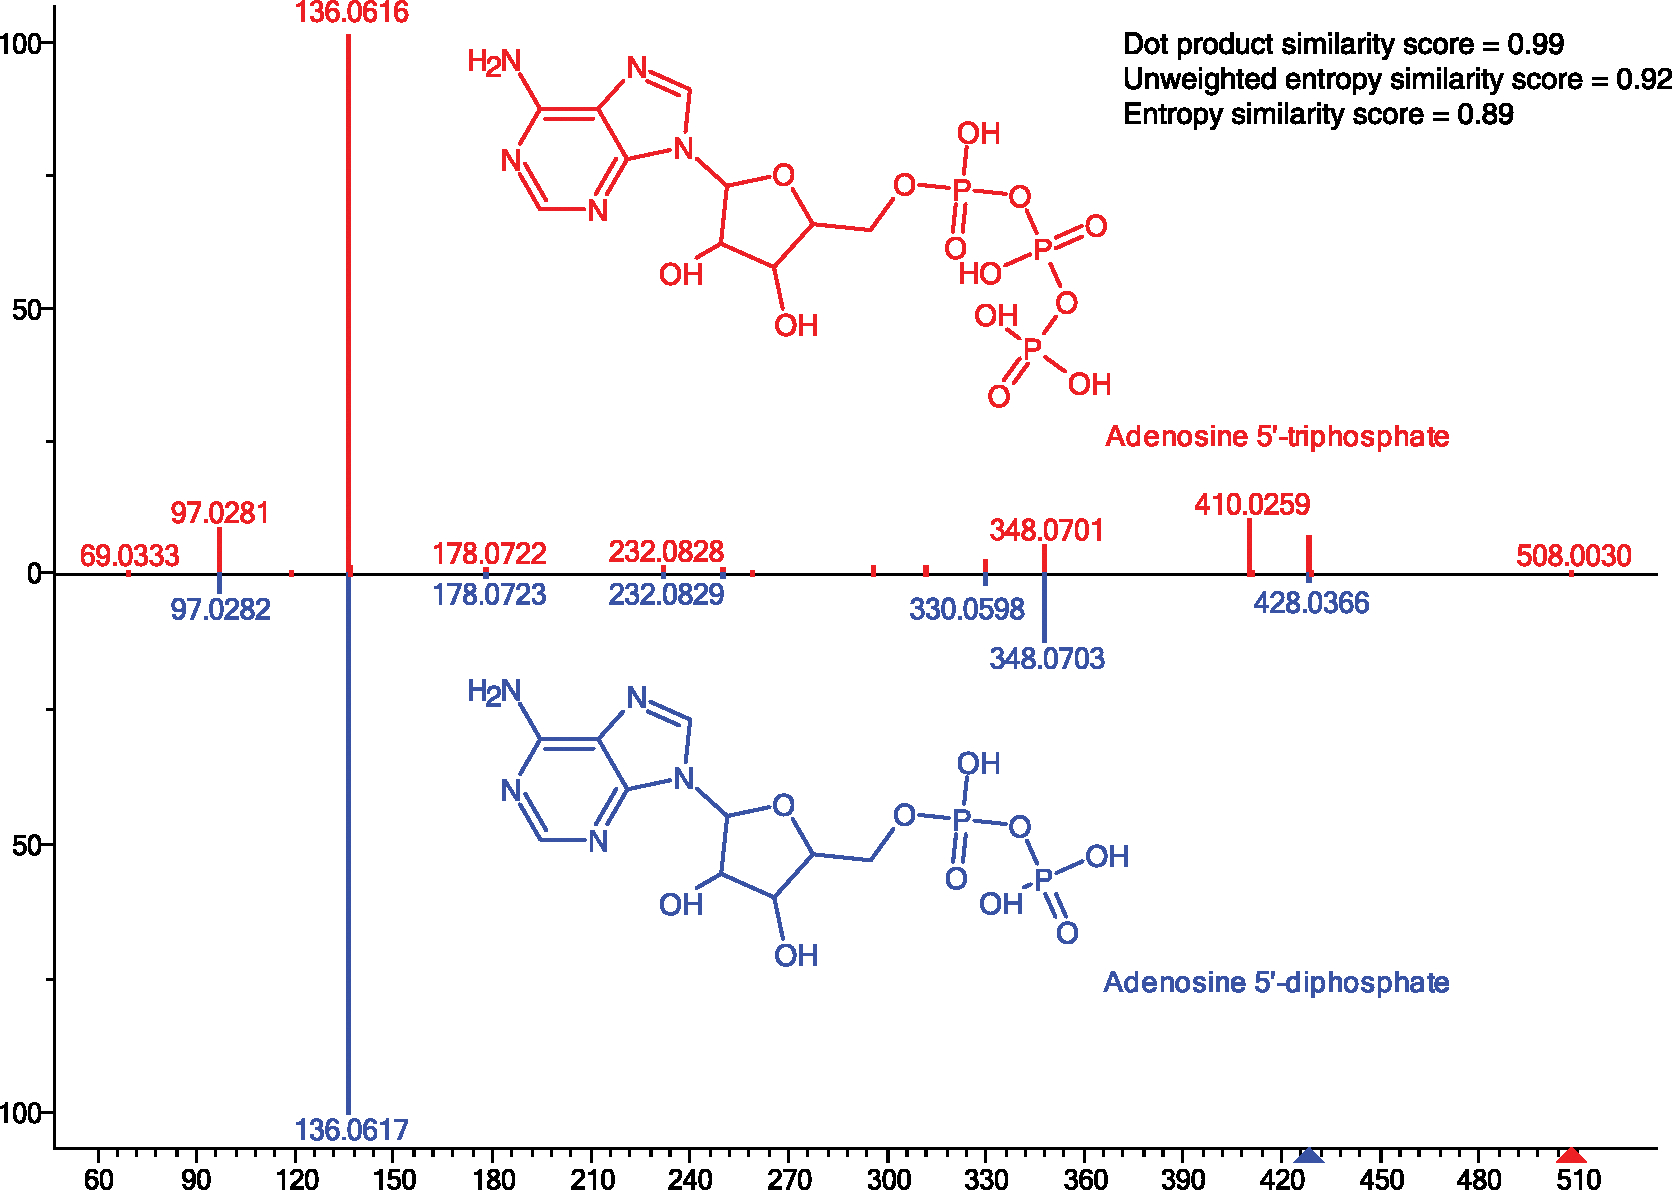
This comparison shows that similar structures may give highly similar mass spectra. Dot-product similarity yields much higher values, while differences between the mass spectra are most apparent for lower abundant ions that are emphasized by dynamic weighted similarity scores (for example for m/z 410).
Extended Data Fig. 5 |. Intensity weight for entropy similarity.
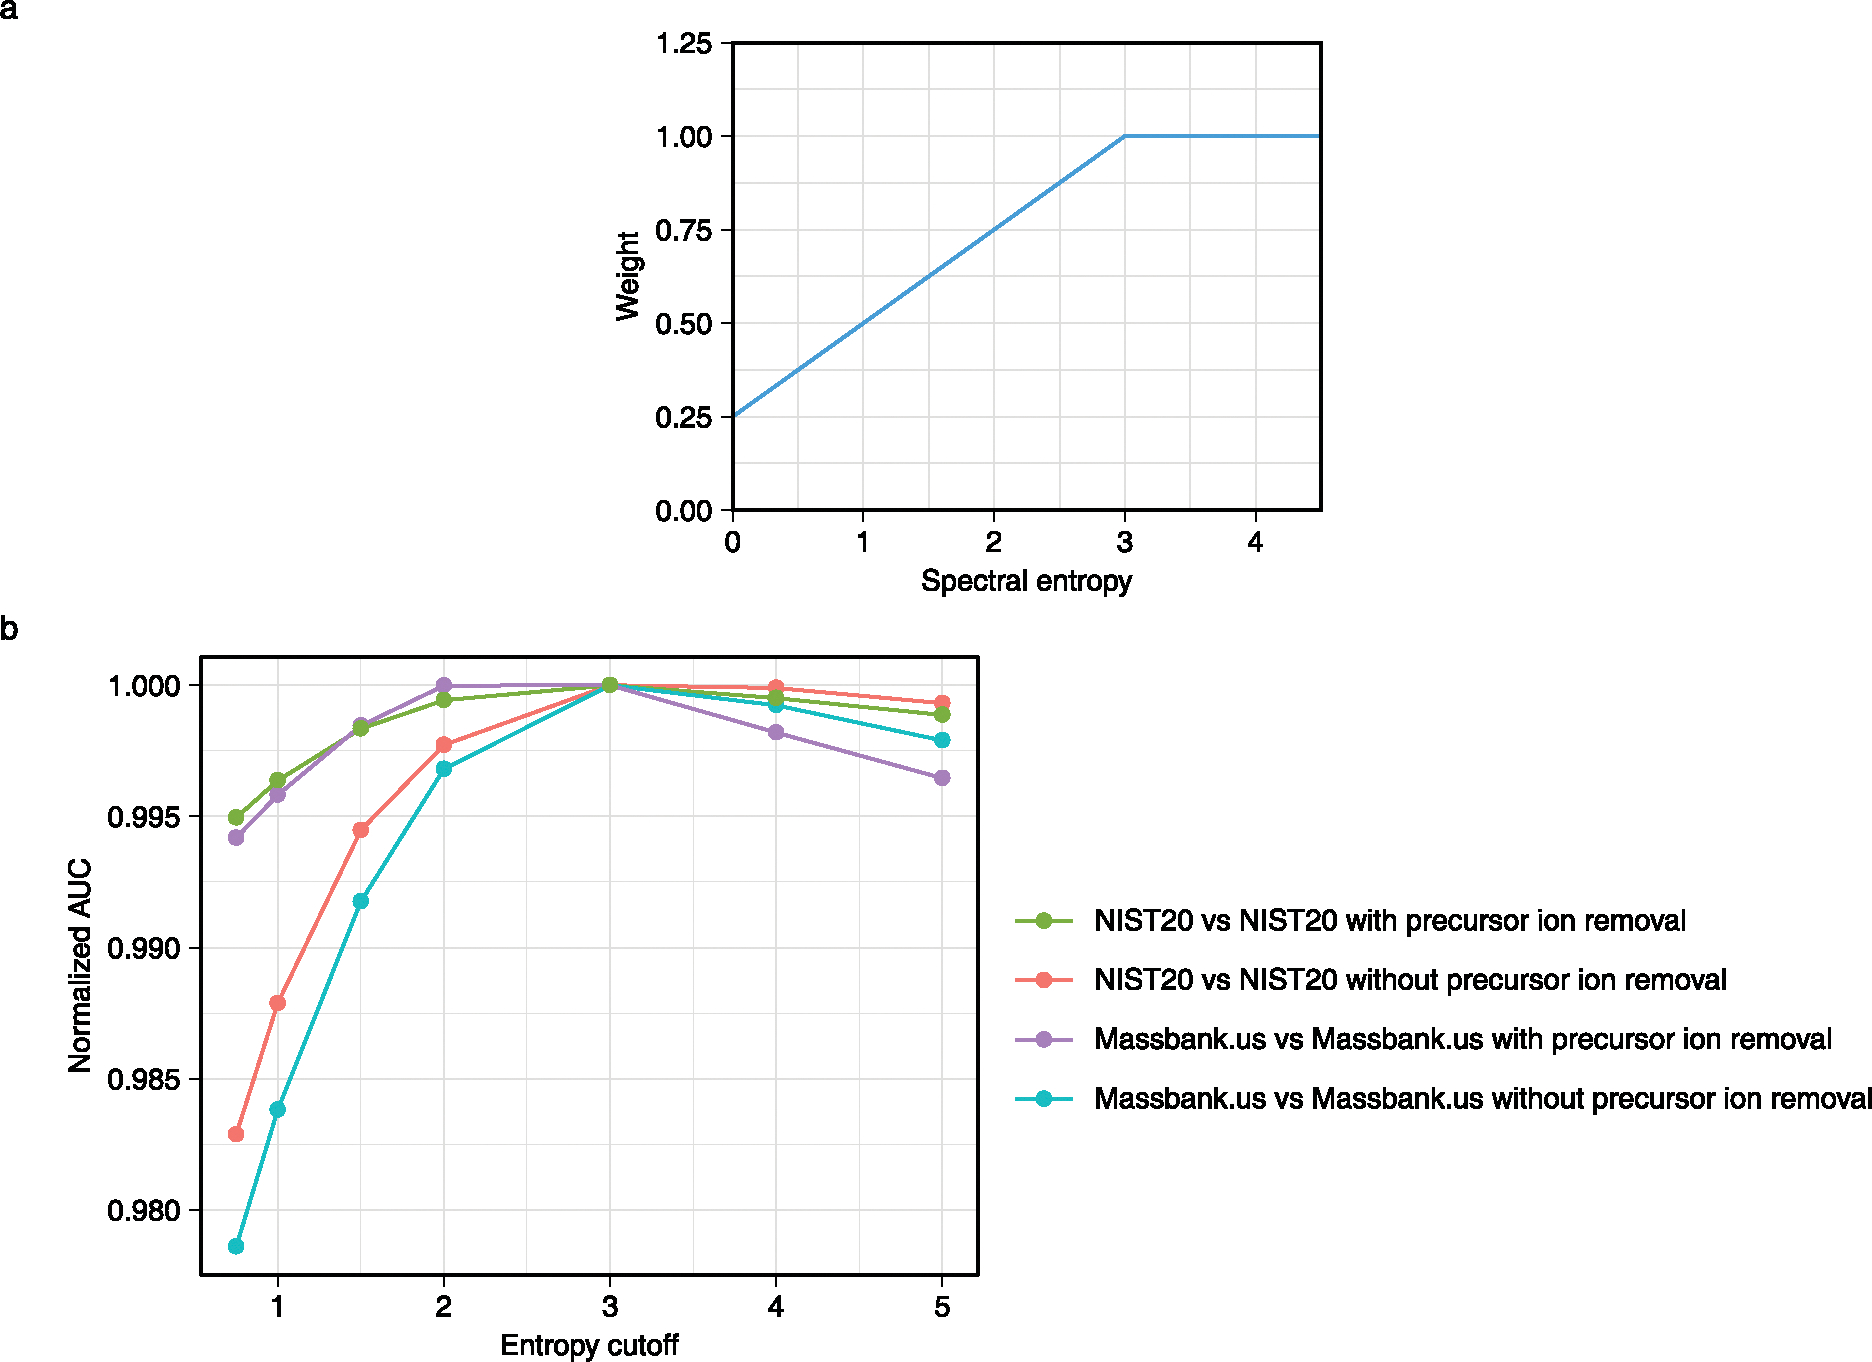
(a) The relationship between spectral entropy and weights to be used in the spectral entropy similarity algorithm. (b) The relationship between normalized AUC and entropy cutoff.
Extended Data Fig. 6 |. Receiver-operator characteristic curves for using MS/MS spectra from the Massbank.us database search against Massbank.us database.
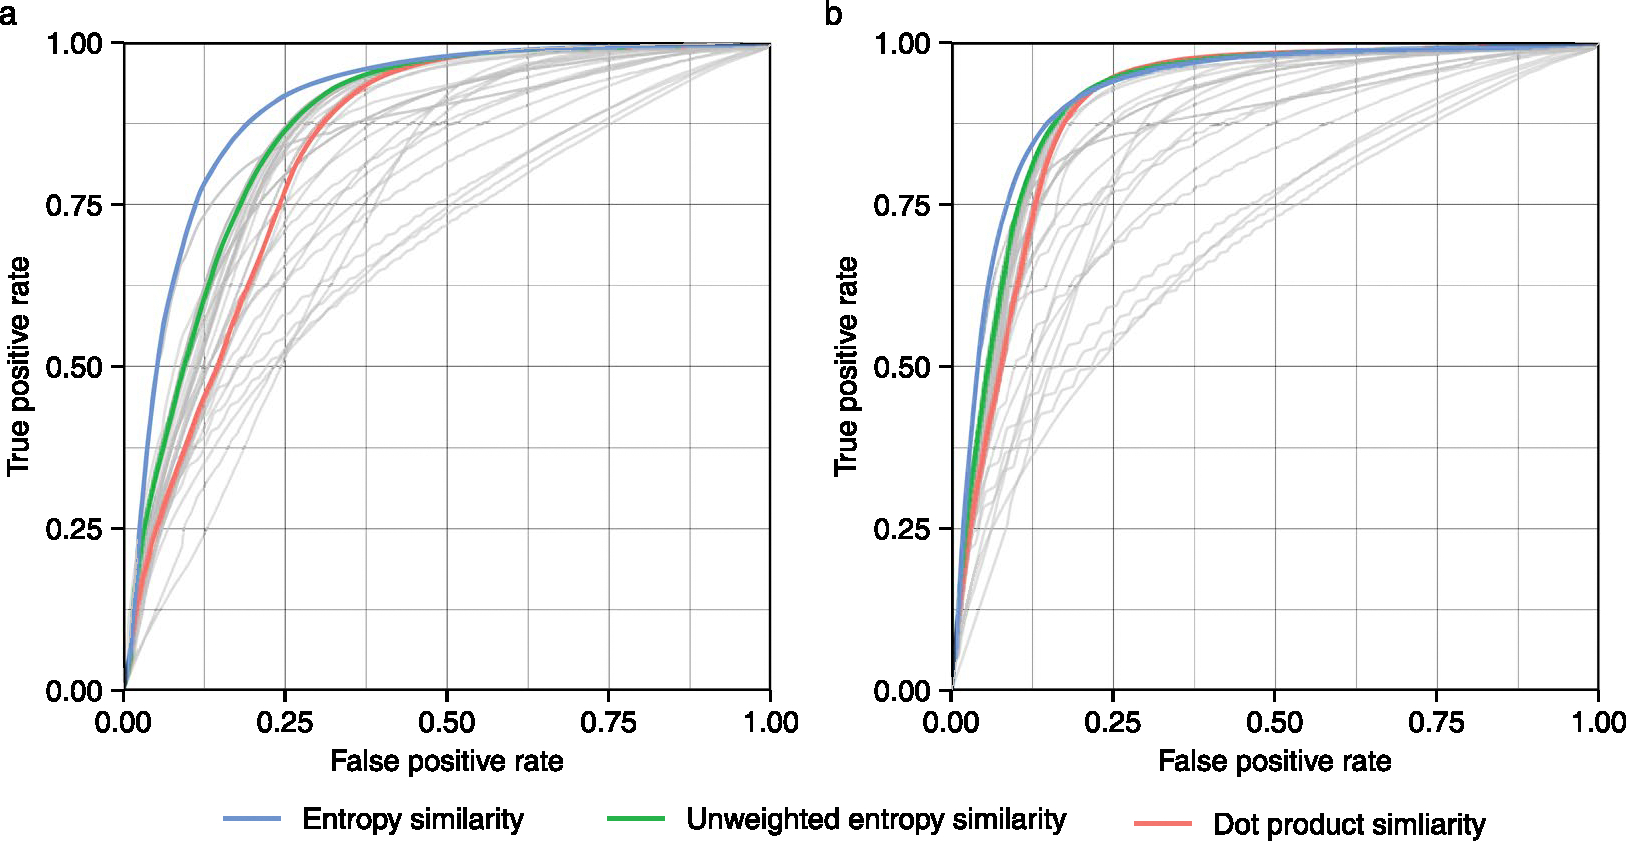
(a) Spectral similarity was compared without precursor ion removal. (b) Spectral similarity was compared with precursor ion removal.
Extended Data Fig. 7 |. Calculate the bond difference between molecules in chemical libraries.
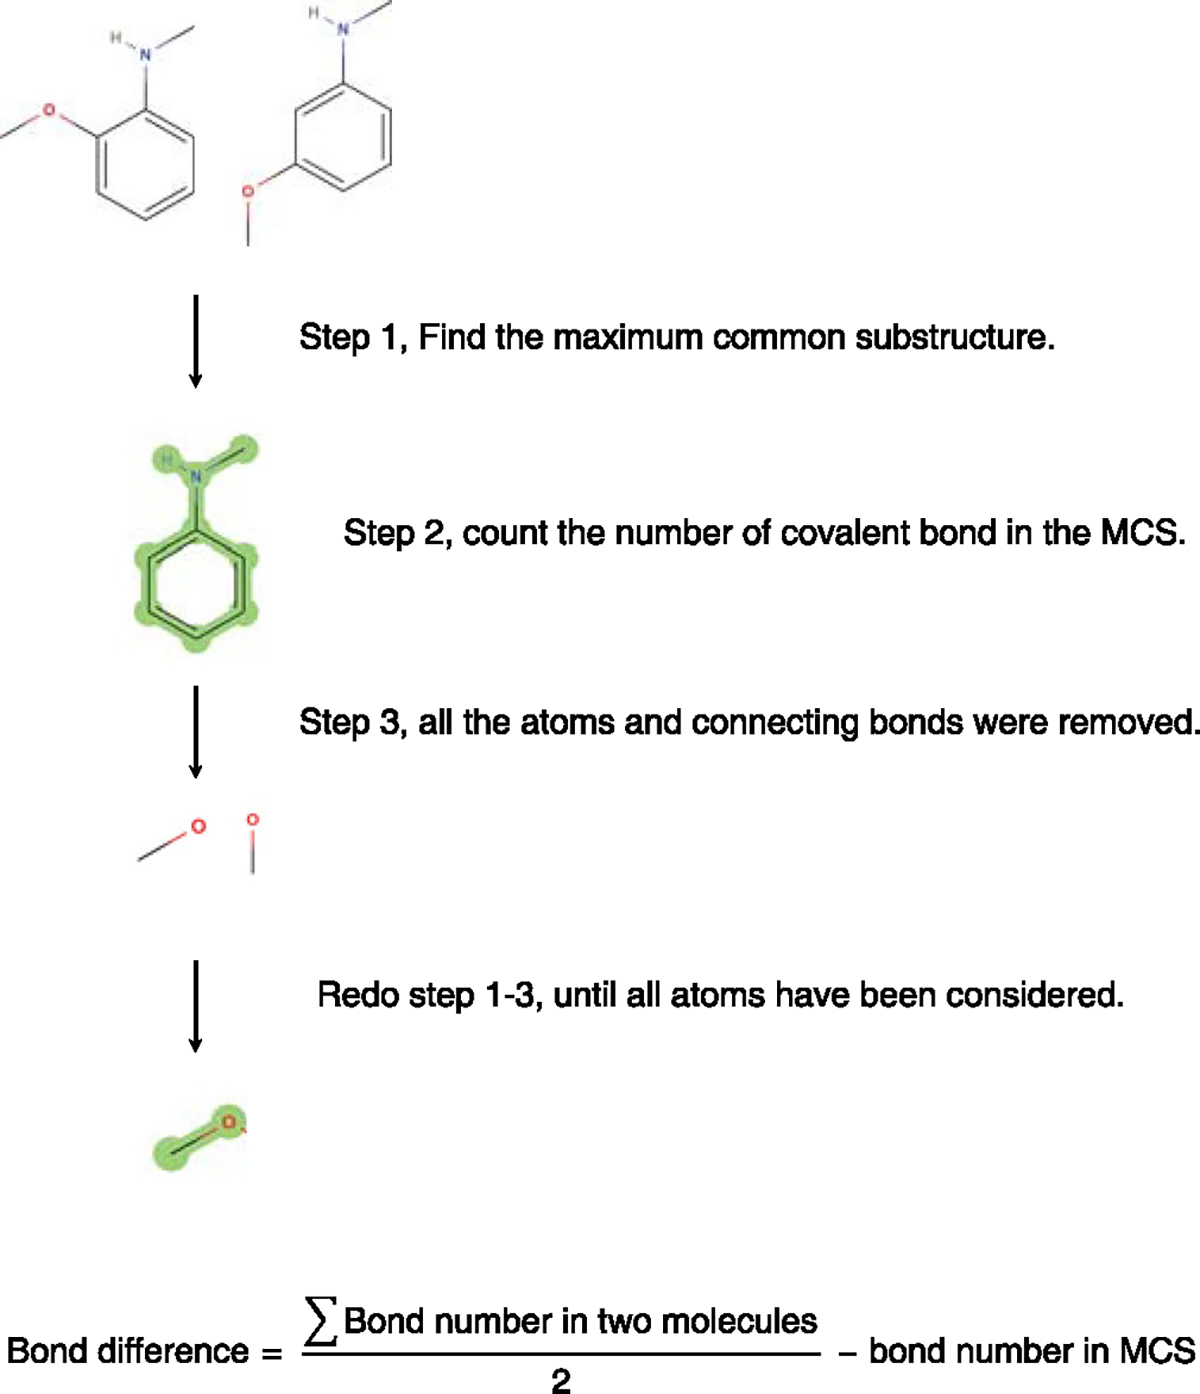
Isomer molecules that differed only by one bond were considered highly similar and therefore used as ‘true positives’ in FDr calculations in similarity calculations.
Extended Data Fig. 8 |. Frequency distribution of identified and unknown metabolites detected in a new experimental dataset from samples of the upper human gut intestinal tract.
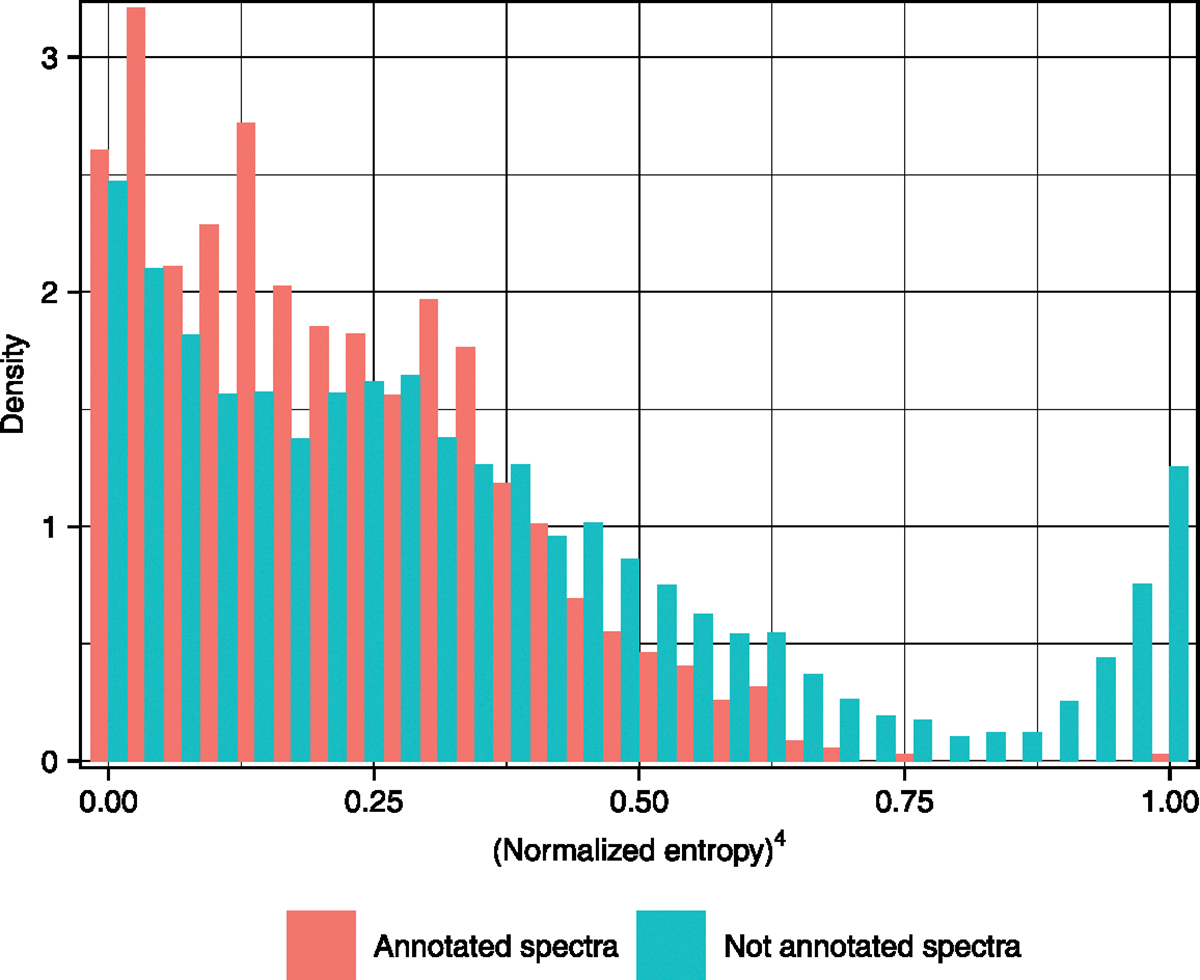
At (normalized entropy)4 > 0.8, identified metabolites are almost absent but spectra of unknown compounds show a rapid increase in frequency due to poor spectral quality.
Supplementary Material
Acknowledgements
This work was supported by the funding ‘West Coast Metabolomics Center for Compound Identification’, which was provided by the National Institutes of Health under award number NIH U2C ES030158 to O.F. The funders had no role in study design, data collection and analysis, decision to publish or preparation of the manuscript.
Footnotes
Competing interests
The authors declare no competing interests.
Code availability
The code for calculating spectral entropy and spectral similarity can be found at GitHub https://github.com/YuanyueLi/SpectralEntropy and at Zenodo https://doi.org/10.5281/zenodo.5591020.
Extended data is available for this paper at https://doi.org/10.1038/s41592-021-01331-z.
Supplementary information The online version contains supplementary material available at https://doi.org/10.1038/s41592-021-01331-z.
Peer review information Nature Methods thanks Warwick Dunn, Junmin Peng and the other, anonymous, reviewer(s) for their contribution to the peer review of this work. Arunima Singh was the primary editor on this article and managed its editorial process and peer review in collaboration with the rest of the editorial team.
Reprints and permissions information is available at www.nature.com/reprints.
Online content
Any methods, additional references, Nature Research reporting summaries, source data, extended data, supplementary information, acknowledgements, peer review information; details of author contributions and competing interests; and statements of data and code availability are available at https://doi.org/10.1038/s41592-021-01331-z.
Reporting Summary. Further information on research design is available in the Nature Research Reporting Summary linked to this article.
Data availability
NIST Tandem Mass Spectral Library, 2020 release (NIST20) spectra are commercial available and can be purchased from multiple vendors. MassBank of North America database (Massbank.us) spectra can be freely downloaded from Massbank.us (https://massbank.us/). The metabolome dataset of the human upper gut intestinal tract can be freely downloaded from MetabolomicsWorkbench (https://www.metabolomicsworkbench.org/) with accession code ST001794. Source data are provided with this paper.
References
- 1.Wu Z, Bagarolo GI, Thoröe-Boveleth S & Jankowski J ‘Lipidomics’: mass spectrometric and chemometric analyses of lipids. Adv. Drug Deliv. Rev. 159, 294–307 (2020). [DOI] [PubMed] [Google Scholar]
- 2.Xiao JF, Zhou B & Ressom HW Metabolite identification and quantitation in LC-MS/MS-based metabolomics. Trends Anal. Chem. 32, 1–14 (2012). [DOI] [PMC free article] [PubMed] [Google Scholar]
- 3.Wang M et al. Sharing and community curation of mass spectrometry data with Global Natural Products Social Molecular Networking. Nat. Biotechnol. 34, 828–837 (2016). [DOI] [PMC free article] [PubMed] [Google Scholar]
- 4.Elias JE & Gygi SP Target-decoy search strategy for increased confidence in large-scale protein identifications by mass spectrometry. Nat. Methods 4, 207–214 (2007). [DOI] [PubMed] [Google Scholar]
- 5.Olsen JV & Mann M Improved peptide identification in proteomics by two consecutive stages of mass spectrometric fragmentation. Proc. Natl Acad. Sci. USA 101, 13417–13422 (2004). [DOI] [PMC free article] [PubMed] [Google Scholar]
- 6.Nesvizhskii AI A survey of computational methods and error rate estimation procedures for peptide and protein identification in shotgun proteomics. J. Proteom. 73, 2092–2123 (2010). [DOI] [PMC free article] [PubMed] [Google Scholar]
- 7.Jeong K, Kim S & Bandeira N False discovery rates in spectral identification. BMC Bioinf. 13, S2 (2012). [DOI] [PMC free article] [PubMed] [Google Scholar]
- 8.Stein SE & Scott DR Optimization and testing of mass spectral library search algorithms for compound identification. J. Am. Soc. Mass. Spectrom. 5, 859–866 (1994). [DOI] [PubMed] [Google Scholar]
- 9.Horai H et al. MassBank: a public repository for sharing mass spectral data for life sciences. J. Mass Spectrom. 45, 703–714 (2010). [DOI] [PubMed] [Google Scholar]
- 10.Oberacher H et al. On the inter-instrument and the inter-laboratory transferability of a tandem mass spectral reference library: 2. Optimization and characterization of the search algorithm. J. Mass Spectrom. 44, 494–502 (2009). [DOI] [PubMed] [Google Scholar]
- 11.Xie Y, Wang Y, Nallanathan A & Wang L An improved K-nearest-neighbor indoor localization method based on Spearman distance. IEEE Signal Process Lett. 23, 351–355 (2016). [Google Scholar]
- 12.Minaev G, Visa A & Piche R in 2017 International Conference on Indoor Positioning and Indoor Navigation (IEEE, 2017). [Google Scholar]
- 13.Cha S-H Comprehensive survey on distance/similarity measures between probability density functions. Int. J. Math. Models Methods Appl. Sci. 1, 300–307 (2007). [Google Scholar]
- 14.Saraiva Campos R & Lovisolo L in Handbook of Position Location (eds Seyed A et al.) Ch. 15 (Wiley, 2018). [Google Scholar]
- 15.Shannon CE A mathematical theory of communication. Bell Syst. Tech. J. 27, 379–423 (1948). [Google Scholar]
- 16.Djoumbou Feunang Y et al. ClassyFire: automated chemical classification with a comprehensive, computable taxonomy. J. Cheminformatics 10.1186/s13321-016-0174-y (2016). [DOI] [PMC free article] [PubMed] [Google Scholar]
- 17.Wan KX, Vidavsky I & Gross ML Comparing similar spectra: from similarity index to spectral contrast angle. J. Am. Soc. Mass. Spectrom. 13, 85–88 (2002). [DOI] [PubMed] [Google Scholar]
- 18.Yilmaz Ş, Vandermarliere E & Martens L Methods to calculate spectrum similarity. Methods Mol. Biol. 1549, 75–100 (2017). [DOI] [PubMed] [Google Scholar]
- 19.Samokhin A, Sotnezova K, Lashin V & Revelsky I Evaluation of mass spectral library search algorithms implemented in commercial software. J. Mass Spectrom. 50, 820–825 (2015). [DOI] [PubMed] [Google Scholar]
- 20.Du P et al. A noise model for mass spectrometry based proteomics. Bioinformatics 24, 1070–1077 (2008). [DOI] [PubMed] [Google Scholar]
- 21.Folz JS, Shalon D & Fiehn O Metabolomics analysis of time-series human small intestine lumen samples collected in vivo. Food Funct. 10.1039/D1FO01574E (2021). [DOI] [PubMed] [Google Scholar]
- 22.Bonini P, Kind T, Tsugawa H, Barupal DK & Fiehn O Retip: retention time prediction for compound annotation in untargeted metabolomics. Anal. Chem. 92, 7515–7522 (2020). [DOI] [PMC free article] [PubMed] [Google Scholar]
- 23.Sobus JR et al. Integrating tools for non-targeted analysis research and chemical safety evaluations at the US EPA. J. Exposure Sci. Environ. Epidemiol. 28, 411–426 (2018). [DOI] [PMC free article] [PubMed] [Google Scholar]
- 24.Colby SM et al. ISiCLE: a quantum chemistry pipeline for establishing in silico collision cross section libraries. Anal. Chem. 91, 4346–4356 (2019). [DOI] [PMC free article] [PubMed] [Google Scholar]
- 25.Scheubert K et al. Significance estimation for large scale metabolomics annotations by spectral matching. Nat. Commun. 10.1038/s41467-017-01318-5 (2017). [DOI] [PMC free article] [PubMed] [Google Scholar]
- 26.Bach E, Szedmak S, Brouard C, Böcker S & Rousu J Liquid-chromatography retention order prediction for metabolite identification. Bioinformatics 34, i875–i883 (2018). [DOI] [PubMed] [Google Scholar]
- 27.Cao M et al. Predicting retention time in hydrophilic interaction liquid chromatography mass spectrometry and its use for peak annotation in metabolomics. Metabolomics 11, 696–706 (2015). [DOI] [PMC free article] [PubMed] [Google Scholar]
- 28.Domingo-Almenara X et al. The METLIN small molecule dataset for machine learning-based retention time prediction. Nat. Commun. 10.1038/s41467-019-13680-7 (2019). [DOI] [PMC free article] [PubMed] [Google Scholar]
- 29.Nichols CM et al. Untargeted molecular discovery in primary metabolism: collision cross section as a molecular descriptor in ion mobility-mass spectrometry. Anal. Chem. 90, 14484–14492 (2018). [DOI] [PMC free article] [PubMed] [Google Scholar]
- 30.Zhou Z et al. Ion mobility collision cross-section atlas for known and unknown metabolite annotation in untargeted metabolomics. Nat. Commun. 10.1038/s41467-020-18171-8 (2020). [DOI] [PMC free article] [PubMed] [Google Scholar]
- 31.Wang X et al. JUMPm: a tool for large-scale identification of metabolites in untargeted metabolomics. Metabolites 10.3390/metabo10050190 (2020). [DOI] [PMC free article] [PubMed] [Google Scholar]
Associated Data
This section collects any data citations, data availability statements, or supplementary materials included in this article.
Supplementary Materials
Data Availability Statement
NIST Tandem Mass Spectral Library, 2020 release (NIST20) spectra are commercial available and can be purchased from multiple vendors. MassBank of North America database (Massbank.us) spectra can be freely downloaded from Massbank.us (https://massbank.us/). The metabolome dataset of the human upper gut intestinal tract can be freely downloaded from MetabolomicsWorkbench (https://www.metabolomicsworkbench.org/) with accession code ST001794. Source data are provided with this paper.


