Abstract
Background
Obesity is a well-known risk factor for developing malignant tumors and promoting tumor cell growth and spread. However, recent studies have shown that obese cancer patients, who typically have a worse prognosis than nonobese cancer patients, show a significant improvement in survival after receiving immune checkpoint inhibitor (ICI) therapy. This phenomenon is known as the “obesity paradox”. However, this phenomenon is influenced by tumor type and sex. Therefore, this study aimed to explore the impact of obesity on immunotherapy efficacy from multiple perspectives, aiming to verify this paradox and provide new scientific evidence on the effect of obesity on ICI efficacy.
Methods
This retrospective study evaluated the data of patients who received ICI therapy between June 2019 and August 2023. Automatic segmentation of skeletal muscle, subcutaneous fat, and visceral fat was performed using Slice-O-Matic software, and the corresponding skeletal muscle index (SMI), subcutaneous fat index (SFI) and visceral fat index (VFI) were calculated. The neutrophil-to-lymphocyte ratio (NLR) was determined by dividing the neutrophil count by the lymphocyte count. Univariate and multivariate Cox regression analyses were used to evaluate the correlation between body mass index (BMI), body composition parameters, and the NLR with overall survival (OS) and progression-free survival (PFS) in obese patients receiving ICI therapy.
Results
We analyzed 219 patients with a median age of 60 years (IQR 53–69 years; 155 men and 64 women). Obese patients, particularly those with visceral fat accumulation, exhibited extended OS after ICI therapy (logrank P = 0.027). Cox multivariate analysis revealed that the NLR (HR = 1.036; 95% CI: 0.996 to 1.078; P = 0.002) was independently associated with OS. Patients with a high NLR had worse OS than those with a low NLR.
Conclusions
This study corroborates the veracity of the "obesity paradox" under specific conditions and identifies NLR as an independent prognostic factor, with elevated NLR indicative of a poor prognosis.
Keywords: Immune checkpoint inhibitor (ICI), Obesity, Sex, Inflammation
Introduction
In recent years, immune checkpoint inhibitor (ICI) have shown great potential for cancer treatment [1–3]. However, only a small percentage of patients exhibit a favorable response [4], and ICI therapy can lead to immune-related side effects. Therefore, there is a need to better identify those who can benefit from ICI therapy. Compared to traditional chemotherapy, ICI therapy induces a complex systemic response that is influenced by various factors, such as patient sex, age, and obesity [5–7]. Exploring the mechanisms by which these factors influence the ICI response can enhance our understanding of the immune microenvironment in tumors and identify more effective clinical or pathological features to guide ICI therapy.
Obesity is a recognized risk factor for several cancer types [8–10]. It can lead to metabolic dysfunction, insulin resistance and adipose tissue remodeling, including localized fibrosis and angiogenic disruption. These changes can promote the occurance and progression of cancer [11]. Furthermore, obesity triggers lipid metabolism reprogramming in tumor cells, causing metabolic competition between tumor cells and T cells and hindering immune cell function and promoting tumor growth [12]. However, recent studies have shown that obese patients with tumors may have a significantly improved prognosis after receiving ICI therapy [13–15]. This phenomenon is referred to as the “obesity paradox”. Currently, relevant clinical studies have focused on malignant melanoma [13], non-small cell lung cancer [16] and renal clear cell carcinoma [14]; it is not clear whether the “obesity paradox” exists in other cancer types. Moreover, there is no consensus on the difference in the impact of obesity on ICI therapy in patients of different sexes. Furthermore, as patients may experience significant weight fluctuations during antitumor therapy, does the predictive value of ICI therapy efficacy change over time? To answer these questions and verify the validity of the “obesity paradox”, this retrospective study aimed to investigate the impact of obesity on immunotherapy from a multidimensional perspective and to further analyze the influence of different factors on this paradox.
Body mass index (BMI) is often used to measure whether a person is obese, but BMI does not distinguish between skeletal muscle and adipose tissue. A reduction in skeletal muscle mass can serve as a predictive factor for adverse patient outcomes [17]. Furthermore, distinct structural and functional variations exist within different areas of adipose tissue [18]. This means that using BMI alone as a criterion for judging whether a patient is obese is insufficient. A more precise assessment of body composition parameters, such as visceral fat, subcutaneous fat, and skeletal muscle content, through CT cross-sectional images may provide clues to explain the “obesity paradox” by comparing structural and functional differences between different components.
Obesity, which is defined as the excessive accumulation of fat, also causes systemic metabolic disorders, in which inflammatory cell aggregation is closely related to tumor progression. Obesity causes chronic low-grade inflammation throughout the body, and adipose tissue may be a source of proinflammatory factors [19]. Does the systemic inflammatory state correlate with ICI therapy efficacy? Can inflammatory cell numbers in the blood reflect the obesity-induced systemic inflammatory state and predict the efficacy of ICI therapy? The neutrophil-to-lymphocyte ratio (NLR), based on the counts of neutrophils and lymphocytes, is proposed as a novel systemic inflammatory index that reflects the balance between host inflammation and the immune response in cancer patients [20]. This chronic inflammatory state associated with obesity has a certain impact on the development of tumors and may affect the efficacy of ICI therapy. Therefore, this study aimed to investigate the potential impact of BMI, body composition parameters, and the NLR on overall survival (OS) and progression-free survival (PFS) in patients receiving ICI therapy. This analysis serves as a foundation for further exploration into the underlying mechanisms behind the “obesity paradox” phenomenon.
Methods
Patients
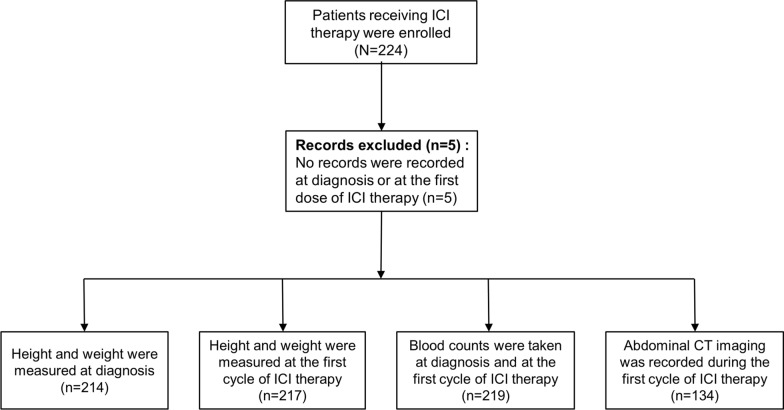
We retrospectively enrolled 224 patients treated with ICI therapy at the Department of Oncology, Guangdong Provincial People's Hospital between June 2019 and August 2023 (Fig. 1). All patients received at least 1 cycle of ICI therapy. The ICI therapies included nivolumab, pembrolizumab, camrelizumab, tislelizumab, toripalimab and sintilimab. Five patients with incomplete blood counts or height or weight records were excluded. Patients’ baseline demographic, biological, and clinical data, including age, sex, body weight, height, diagnosis, tumor stage, ICI therapy regimen and serum blood counts, including neutrophils and lymphocytes, were extracted from medical records.
Fig. 1.
Flow diagram describing the selection of patients for this study. ICIs, immune checkpoint inhibitors; CT, computed tomography
Imaging analysis
Computed tomography (CT) images of patients were obtained from Vue-RIS-GC, version 3.2.0202.0. Abdominal cross-sectional images of patients within 1 month before and after the first cycle of ICI therapy were included. Imaging was excluded if the CT scan failed to show the abdominal wall or if the CT scan had excessive artifacts. Axial CT Digital Imaging and Communications in Medicine (DICOM) images were obtained. The CT scans obtained during the evaluation of the patients were analyzed by an experienced radiology researcher. Slice-O-Matic, version 5.0 (Tomovision, Montreal, Quebec, Canada) was used for analysis. Abdominal CT images were examined at the level of the L3 vertebra for the assessment of body mass composition, which has been proven to accurately quantify a person's body composition [22, 23]. The cross-sectional area of the tissue was calculated in square centimeters using the 3rd lumbar vertebra as a reference point. In addition, CT scans were used to identify and quantify skeletal muscle (SM), visceral adipose tissue (VAT) and subcutaneous adipose tissue (SAT). The SM value corresponds to the area of the abdominal muscle. The SAT is defined as the area outside the abdominal muscular wall, while the VAT is defined as the area inside the abdominal muscular wall (Fig. 2). Predetermined Hounsfield units (SM: (-29)-(+ 150) HU, VAT: (-150)-(-50) HU, SAT: (-190)-(-30) HU) were used [23, 24]. The skeletal muscle index (SMI), subcutaneous fat index (SFI) and visceral fat index (VFI) were calculated as the area in square centimeters per square meter [24].
Fig. 2.
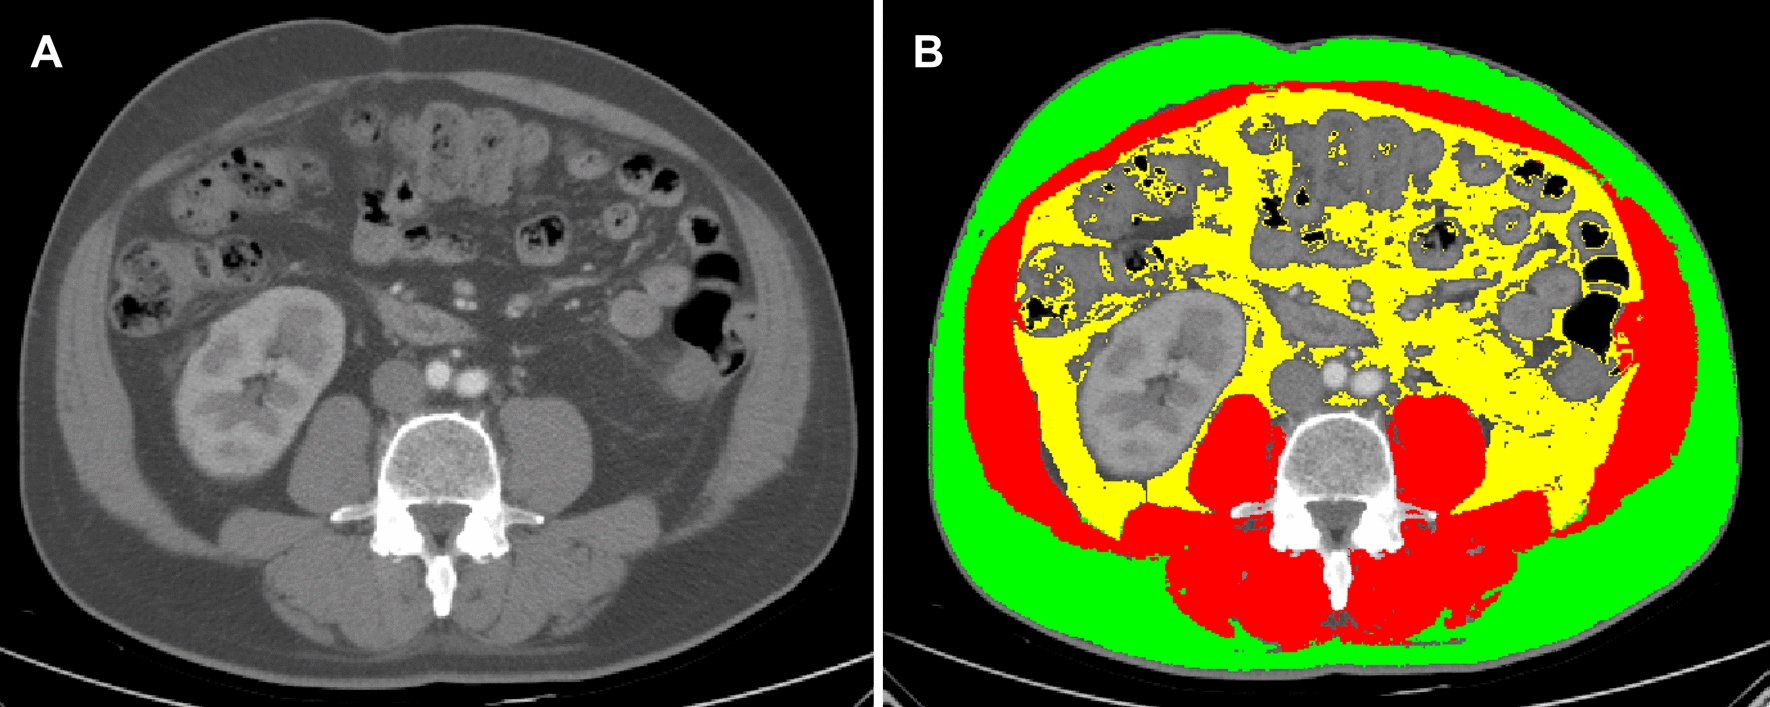
Computed tomography image of an axial section of the 3rd lumbar vertebra (A); Automatic segmentation of visceral fat (yellow), subcutaneous fat (green) and skeletal muscle (red) was performed using Slice-O-Matic software (B)
Evaluation index
BMI was calculated as weight divided by height squared (kg/m2) and categorized according to the Asia–Pacific classification criteria of underweight (< 18.5 kg/m2), normal weight (18.5–22.9 kg/m2), overweight weight (23.0–24.9 kg/m2), or obese weight (≥ 25 kg/m2) [21]. The SFI and VFI were employed primarily for the assessment of obesity characteristics in patients, whereas the SMI was utilized for the measurement of skeletal muscle content. The NLR is calculated by dividing the neutrophil count by the lymphocyte count. The baseline BMI and NLR were obtained at diagnosis and at the first cycle of ICI therapy. Other data were also extracted from medical records.
Response to treatment was assessed using the Response Evaluation Criteria in Solid Tumors V.1.1 (RECIST V.1.1). Regular follow-up was performed every 3 months and was terminated on 31st August 2023. PFS was defined as the time interval from the date of the first cycle of ICI therapy to progression or death due to any cause. OS was defined as the time interval from the date of the first cycle of ICI therapy to the date of death due to any cause.
Statistical analysis
The baseline characteristics of all patients were described and summarized using frequencies and percentages for categorical variables and medians and ranges for continuous variables. Differences were considered statistically significant at P < 0.05. Kaplan–Meier analysis and logrank tests were used to compare the differences in survival curves between groups. The cutoff values were determined based on the time to death to best separate the two groups. Pearson’s correlation analysis was used to determine relationship between body composition parameters and clinical variables. Univariate and multivariate Cox regression analyses were used to identify potential risk factors for OS and PFS. Statistical analysis was performed using GraphPad Prism v9.5.1 (GraphPad Software, Inc.) and R software V.4.2.1. Two-tailed p values < 0.05 were considered to indicate statistical significance.
Results
Baseline characteristics
A total of 219 patients with a median age of 60 years (IQR 53–69 years; 155 men and 64 women) were ultimately included in the analysis. The median follow-up period was 16 months (IQR 12–25). In accordance with the Asian BMI classification criteria [21], there were 25 (11.4%) low weight patients, 133 (60.7%) normal weight patients, 47 (21.5%) overweight and 9 (4.1%) obese patients at diagnosis. Additionally at the first cycle of ICI therapy, there were 40 (18.3%) patients with low weight, 122 (55.7%) with normal weight, 47 (21.5%) with overweight, and 8 (3.7%) with obesity. Colorectal cancer (CRC) was the most prevalent type of cancer, with 49 patients (22.4%), followed by gastric cancer (GC) with 47 patients (21.5%), esophageal cancer (EC) with 34 patients (15.5%), hepatocellular carcinoma (HCC) with 20 patients, and other types of cancer including malignant melanoma, nasopharyngeal carcinoma, and renal carcinoma, with 69 patients (31.5%). Most patients were already in stage IV (146 patients, 66.7%) when they received ICI therapy, 55 were in stage III (25.1%), and only 10 were in stage II (4.6%). Sixty-nine patients received nivolumab (31.5%), 60 received pembrolizumab (27.4%), 45 received camrelizumab (20.5%), and the remaining 45 received tislelizumab, toripalimab and sintilimab (20.5%).
The optimal cutoff values for the NLR at diagnosis and after the first cycle of ICI treatment were 4.51 and 4.01, respectively. The optimal threshold values for the SFI and VFI were divided according to sex. Based on this method, SFI ≤ 19.84 cm2/m2 for men and ≤ 45.94 cm2/m2 for women were defined as low SFI, and patients with VFI ≤ 17.03 cm2/m2 for men and ≤ 14.20 cm2/m2 for women were defined as low VFI. Sarcopenia was defined as an SMI of ≤ 44.77 cm2/m2 in men and ≤ 32.50 cm2/m2 in women [25]. When the mortality rate was < 50%, the median OS was undefined, and the mean OS was 45.0 months (95% CI 40.7 to 49.3 months). The median PFS was 10.0 months (95% CI 4.9 to 15.1 months). The baseline patient characteristics are shown in Table 1.
Table 1.
Summary of Patient Demographic, Clinicopathological, Inflammatory Mediator, and Body Composition Profile Data
| Characteristic | Patients, No. (%) (N = 219) |
|---|---|
| Age, median (IQR), y | 60 (53–69) |
| Sex | |
| Male | 155 (70.8) |
| Female | 64 (29.2) |
| BMI, mean ± SD, kg·m−2 * | 22.04 ± 3.25 |
| BMI, categories* | |
| Underweight | 25 (11.4) |
| Normal weight | 133 (60.7) |
| Overweight | 47 (21.5) |
| Obese | 9 (4.1) |
| Unclear | 5 (2.3) |
| BMI, mean ± SD, kg·m−2 ♰ | 21.56 ± 3.47 |
| BMI, categories♰ | |
| Underweight | 40 (18.3) |
| Normal weight | 122 (55.7) |
| Overweight | 47 (21.5) |
| Obese | 8 (3.7) |
| Unclear | 2 (0.9) |
| VFI, mean ± SD, (cm2/m2) | 23.37 ± 9.70 |
| SFI, mean ± SD, (cm2/m2) | 32.64 ± 13.21 |
| SMI, mean ± SD, (cm2/m2) | 40.43 ± 7.35 |
| VAT for men, mean ± SD, cm2 | 61.37 ± 21.22 |
| VAT for women, mean ± SD, cm2 | 59.67 ± 26.70 |
| SAT for men, mean ± SD, cm2 | 85.32 ± 33.37 |
| SAT for women, mean ± SD, cm2 | 95.10 ± 36.52 |
| NLR, mean ± SD * | 3.95 ± 4.22 |
| NLR, mean ± SD ♰ | 4.84 ± 4.39 |
| Diagnosis | |
| CRC | 49 (22.4) |
| EC | 34 (15.5) |
| GC | 47 (21.5) |
| HCC | 20 (9.1) |
| Others | 69 (31.5) |
| Clinical stage | |
| II | 10 (4.6) |
| III | 55 (25.1) |
| IV | 146 (66.7) |
| Unclear | 8 (3.7) |
| Treatment | |
| Nivolumab | 69 (31.5) |
| Pembrolizumab | 60 (27.4) |
| Camrelizumab | 45 (20.5) |
| Others | 45 (20.5) |
| PD-L1 | |
| Negative | 41 (18.7) |
| Positive (CPS) | 52 (23.7) |
| Unclear | 93 (42.5) |
CRC, colorectal cancer; EC, esophageal cancer; GC, gastric cancer; HCC, hepatocellular carcinoma; BMI, body mass index; NLR, neutrophil-to-lymphocyte ratio; SMI, skeletal muscle index; SFI, subcutaneous fat index; VFI, visceral fat index. SAT, subcutaneous adipose tissue; VAT, visceral adipose tissue
*: at diagnosis; ♰: at the first cycle of ICI therapy
Obese patients, particularly males, exhibit favorable survival outcomes after ICI therapy
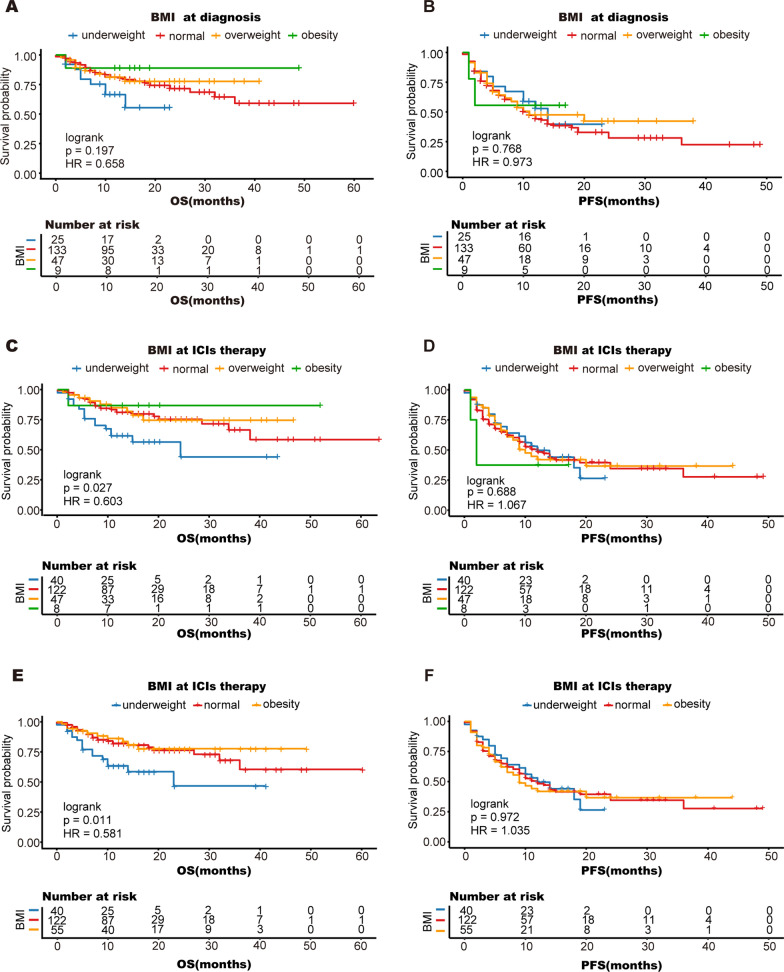
First, BMI was categorized into four subgroups: underweight, normal, overweight, and obese. We calculated BMI at two different time points, one at diagnosis and the other at the first cycle of ICI therapy. We found that at the first cycle of ICI treatment, obese patients had a longer OS (mean OS 43.1 months; 95% CI 32.4 to 53.9 months), while underweight patients had the shortest OS (mean OS 24.5 months; 95% CI 18.2 to 30.9 months) compared to other patients (logrank P = 0.027) (Fig. 3C-D). However, there was no significant difference in OS or PFS among the four different BMI subgroups, which were calculated at diagnosis (Fig. 3A-B). Because both obese and overweight patients demonstrated a survival benefit at the first cycle of ICI therapy, we combined obese and overweight patients into one group. When we reanalyzed the differences among the three BMI groups at the first cycle of ICI therapy, the results were similar to those described above. Obese patients had a longer OS, while underweight patients had the shortest OS (Fig. 3E-F).
Fig. 3.
Kaplan–Meier analysis of overall survival (A, C, E) and progression-free survival (B, D, F) according to BMI. Obesity and overweight were group together into the obese group. The patients were divided into three groups (E, F): underweight (18.5 kg/m2), normal weight (18.5–22.9 kg/m2), and obese (≥ 23 kg/m2); OS, overall survival; PFS, progression-free survival
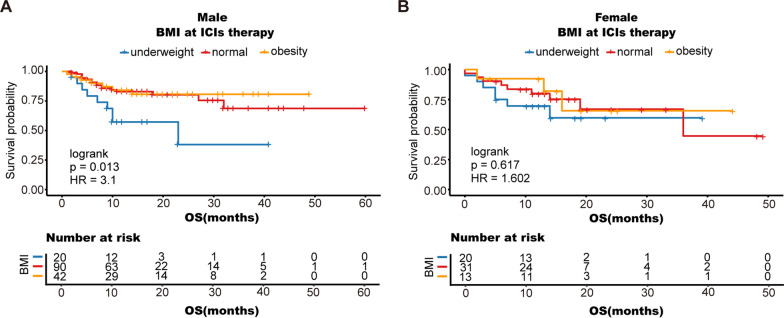
Additionally, there are variations in the development and function of the immune system between males and females [26]. Therefore, the influence of sex on the effectiveness of ICI therapy cannot be disregarded [27]. In this study, we separated the males and females with varying BMIs to investigate the impact of sex on patient OS. Similar outcomes were observed for men; obese patients receiving ICI therapy experienced prolonged OS, while underweight individuals had the shortest survival (mean OS 22.73 months; 95% CI 14.22 to 31.24 months) (logrank P = 0.013), but not for women (Fig. 4A-B).
Fig. 4.
Stratified analysis by sex: Male (A), Female (B); OS, overall survival; PFS, progression-free survival
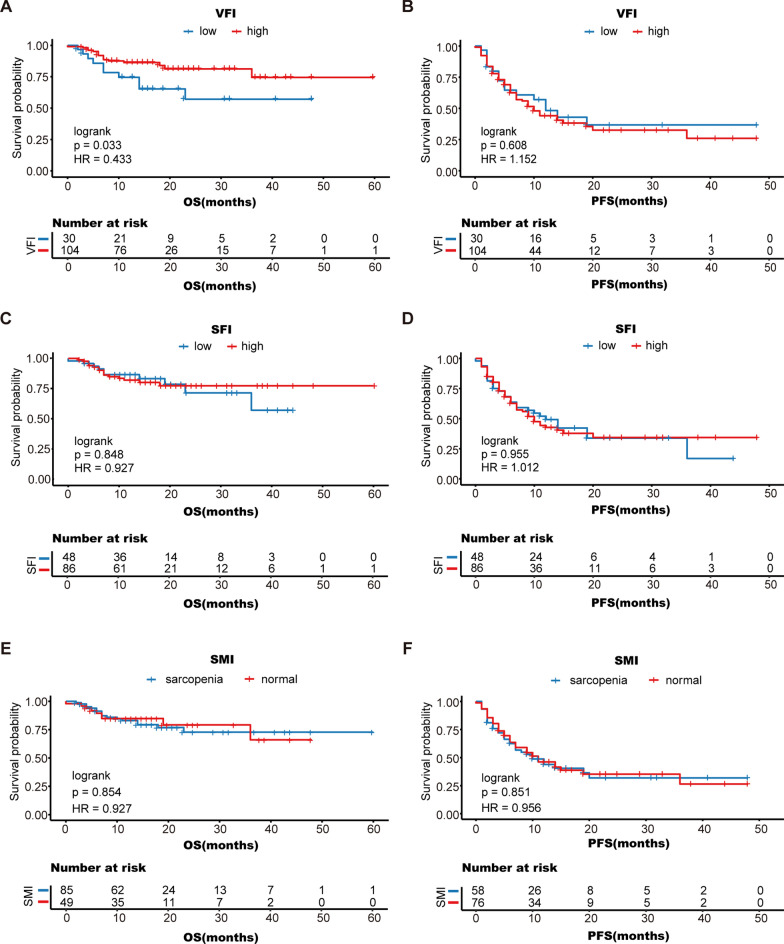
Fat distribution and skeletal muscle content may also be important prognostic indicators for patients [28, 29]. However, BMI does not precisely represent skeletal muscle content and fat content and distribution. In this study, we grouped patients into different groups according to their VFI, SFI, and SMI and analyzed their survival after receiving ICI therapy. We found that OS was significantly longer in patients with a high VFI (mean OS 48.9 months; 95% CI 43.5 to 54.2 months) than in patients with a low VFI (mean OS 32.0 months; 95% CI 24.1 to 39.8 months) (logrank P = 0.033) (Fig. 5A). However, OS did not significantly differ between patients with a high SFI and patients with a low SFI (log-rank P = 0.848) (Fig. 5C). There was also no significant difference in PFS between the VFI and SFI groups (Fig. 5B, D). Moreover, we found no significant association between the SMI and survival (log-rank P = 0.854) (Fig. 5E, F). These results indicate that obese people, especially men, are more likely to benefit from ICI therapy, and that VFI may also be an important prognostic indicator in addition to BMI.
Fig. 5.
Kaplan–Meier analysis of overall survival and progression-free survival according to VFI (A, B), SFI (C, D) and SMI (E, F); OS, overall survival; PFS, progression-free survival; SMI, skeletal muscle index; SFI, subcutaneous fat index; VFI, visceral fat index
Patients with a lower NLR are more likely to benefit from ICI therapy
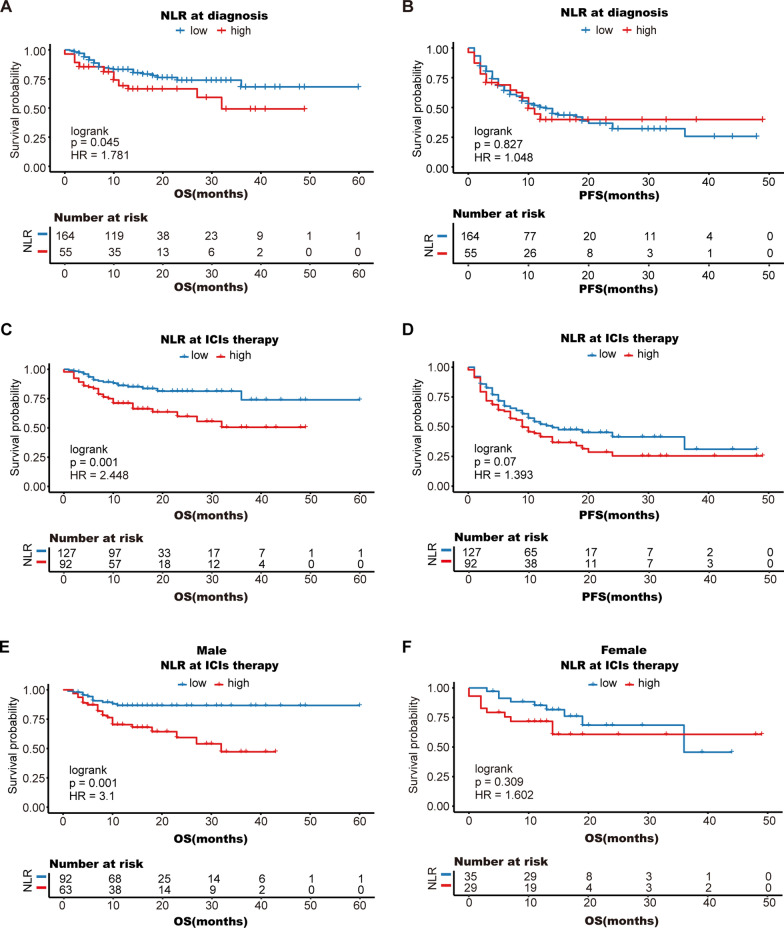
The NLR reflects the systemic inflammatory status and may predict the efficacy of ICI therapy. However, this predictive role may be influenced by the time point, sex, and the immunological drug used. Kaplan–Meier analysis revealed that patients with a high NLR had a significantly worse prognosis than those with a low NLR (mean OS: 31.0 months vs. 48.7 months, log-rank P = 0.001) after the first cycle of ICI treatment (Fig. 6C). However, when we analyzed the NLR at diagnosis, there was no significant correlation between prognosis and the NLR (Fig. 6A, B). In terms of sex, males with a high NLR had a significantly worse prognosis (log-rank P = 0.001) (Fig. 6E), while there was no significant correlation between sex and the NLR for females (log-rank P = 0.309) (Fig. 6F).
Fig. 6.
Kaplan–Meier analysis of overall survival (A, C) and progression-free survival (B, D) according to the NLR; stratified analysis by sex: male (E), female (F); OS, overall survival; PFS, progression-free survival
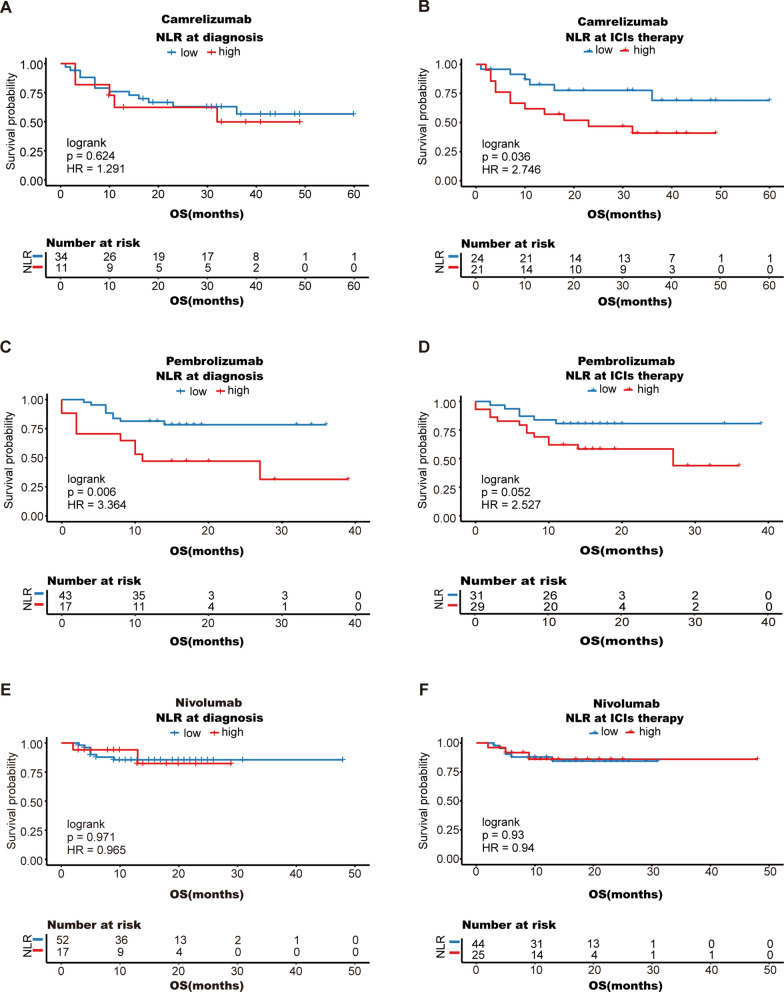
Patients in our cohort mostly received nivolumab, pembrolizumab, and camrelizumab, so we evaluated the prognostic value of the NLR in patients receiving each of these treatments. Subgroup analysis revealed that patients with a low NLR receiving camrelizumab (mean OS 46.6 months; 95% CI 37.4 to 55.8 months) had longer OS than those with a high NLR (mean OS 26.6 months; 95% CI 18.0 to 35.3 months) (log-rank P = 0.036) (Fig. 7A, B). Similarly, the benefit of a low NLR at diagnosis was more pronounced in patients treated with pembrolizumab (mean OS: 29.7 months vs. 19.1 months, log-rank P = 0.006), but no significant difference was observed at the first cycle of ICI therapy (Fig. 7C, D). For people treated with nivolumab, there were no significant differences in OS (Fig. 7E, F).
Fig. 7.
Stratified analysis according to treatment regimen: camrelizumab (A, B), pembrolizumab (C, D), and nivolumab (E, F); OS, overall survival
These results indicate that the ability of the NLR to predict ICI efficacy may be more pronounced in male patients and in patients treated with camrelizumab or pembrolizumab.
Peripheral blood cell counts cannot reflect obesity-related inflammation
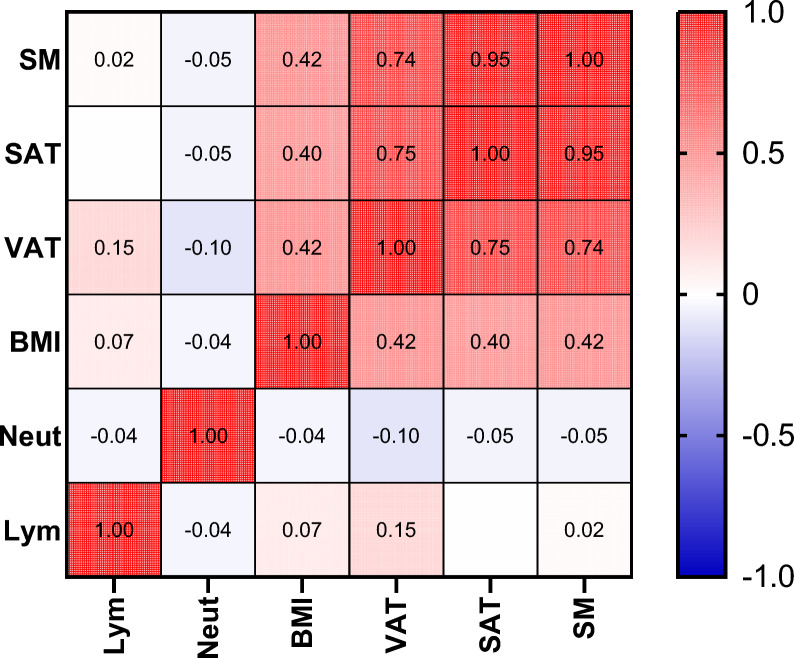
To determine if neutrophil counts, lymphocyte counts, and other markers in the peripheral blood can accurately reflect the chronic systemic low-grade inflammation caused by obesity, the relationships between BMI and body composition parameters with neutrophil counts and lymphocyte counts were analyzed. Pearson's correlation analysis revealed that there was no significant correlation between BMI, SM, SAT, or VAT and neutrophil or lymphocyte counts (Fig. 8). This finding suggests that obesity-mediated inflammation may not be dominated by neutrophil aggregation or that the inflammatory state cannot be determined by testing peripheral blood alone.
Fig. 8.
Heatmap showing the correlations between body composition parameters and neutrophils and lymphocytes. VFI, visceral fat index; NLR, neutrophil-to-lymphocyte ratio; SM, skeletal muscle; SAT, subcutaneous adipose tissue; VAT, visceral adipose tissue; BMI, body mass index; Neut, neutrophils; Lym, lymphocytes
The NLR at the first cycle of ICI therapy is an independent prognostic factor for OS
Univariate Cox regression analysis revealed that a high BMI (HR = 0.904, 95% CI 0.833–0.981, P = 0.016) and a high VFI (HR = 0.436, 95% CI 0.198–0.963, P = 0.040) at the first cycle of ICI therapy were protective factors for OS, while a high NLR (HR = 1.036, 95% CI 0.996–1.078, P = 0.002) was a risk factor. According to the multivariate Cox regression analysis, the NLR at the first cycle of ICI therapy was the only independent prognostic factor for OS (HR = 1.075, 95% CI: 1.005–1.150; P = 0.035) (Table 2).
Table 2.
Univariable and multivariable Cox regression for overall survival
| Univariable | Multivariable | |||||
|---|---|---|---|---|---|---|
| Variable | HR | 95%CI | P | HR | 95%CI | P |
| BMI(At diagnosis) | 0.939 | 0.86–1.025 | 0.160 | |||
| BMI(ICIs therapy) | 0.904 | 0.833–0.98 1 | 0.016 | 0.896 | 0.784–1.024 | 0.107 |
| group-VFI | 0.436 | 0.198–0.963 | 0.040 | 0.667 | 0.273–1.631 | 0.374 |
| group-SMI | 1.064 | 0.489–2.317 | 0.876 | |||
| group-SFI | 0.926 | 0.42–2.042 | 0.849 | |||
| NLR(At diagnosis) | 1.075 | 1.026–1.127 | 0.077 | |||
| NLR(ICI therapy) | 1.036 | 0.996–1.078 | 0.002 | 1.075 | 1.005–1.150 | 0.035 |
| PD-L1 | 1.464 | 0.541–3.965 | 0.453 | |||
| Sex | 1.420 | 0.807–2.498 | 0.224 | |||
| Stage (II) | ||||||
| (III) | 17,841.415 | 0–6.34 × 1088 | 0.921 | |||
| (IV) | 26,755.278 | 0–9.5 × 1088 | 0.918 | |||
| Treatment (Nivolumab) | ||||||
| Pembrolizumab | 2.263 | 1.023–5.008 | 0.044 | |||
| Camrelizumab | 2.322 | 1.026–5.253 | 0.043 | |||
| Attilizumab | 0.000 | 0.000 | 0.991 | |||
| Tirellizumab | 1.350 | 0.415–4.386 | 0.618 | |||
| Triplimab | 0.000 | 0.000 | 0.970 | |||
| Sindillimab | 1.448 | 0.312–6.706 | 0.636 | |||
BMI, body mass index; VFI, visceral fat index; SMI, skeletal muscle index; SFI, subcutaneous fat index; NLR, the neutrophil-to-lymphocyte ratio
Discussion
Currently, there is still a great deal of controversy about whether obese patients can benefit from ICI therapy. One study revealed that diet-induced obese mice had a lower tumor load and improved survival after treatment with PD-1 inhibitors [30]. This therapeutic effect has also been demonstrated in oncology patients. Compared with nonobese patients (BMI < 30 kg/m2), obese patients (BMI ≥ 30 kg/m2) showed significant improvements in both PFS and OS after treatment with PD-1 inhibitors [30]. However, some studies have reached the opposite conclusion. For instance, Boi et al. reported that obesity diminishes the therapeutic effectiveness of PD-1 inhibitors in mice with renal cancer and patients with metastatic renal cancer [31]. In obese patients with renal cancer, the median PFS and OS after treatment with PD-1 inhibitors were reduced by 6.5 months and 12 months, respectively, compared to those in patients with normal weight [31]. These findings indicate that obesity may have a complex impact on ICI therapy for various types of cancer. Clinical studies on the “obesity paradox” have focused mainly on tumor types such as malignant melanoma [13], non-small cell lung cancer [16] and renal clear cell carcinoma [14], with relatively few reports on gastrointestinal tumors. In this study, which mainly included patients with gastrointestinal tumors, it was found that obese patients had a more pronounced survival benefit after receiving ICI therapy, providing new evidence to support the potential advantages of obesity in ICI therapy.
In addition, there are significant differences in the immune systems of patients of different sexes [32], so does the advantage of ICI therapy for obese patients also change according to sex? Therefore, our study conducted a further stratified analysis based on sex and revealed that obese men benefited more from ICI therapy. Similar phenomena have been observed in other studies. Among the 331 patients treated with anti-PD1/PD-L1, obese male patients had a median PFS of 7.6 months (95% CI 4.1–23.5 months), compared with a median PFS of only 2.7 months (95% CI 2.7–6.8 months) for normal-weight patients [33]. Moreover, male patients who were obese had a 30–40% lower risk of tumor progression and death, while this difference was not significant for female patients [33]. These results validate the idea that obese men have a more pronounced survival benefit after receiving ICI therapy, emphasizing the importance of sex in the response to ICI therapy. This phenomenon may be closely related to the effect of estrogen on the immune system. Estrogen has been found to induce the polarization macrophage to an immunosuppressive phenotype, which promotes tumor growth. Inhibition of the estrogen receptor was shown to increase the efficacy of ICI therapy [34]. Moreover, tumor progression may trigger a more robust immune editing process in female patients, resulting in stronger immune escape mechanisms in tumor cells [6, 27]. Second, differences in sex hormone levels between men and women result in differences in fat distribution. Visceral fat tends to accumulate more in men, while in premenopausal women, excess fat tends to accumulate under the skin [35]. Inflammatory factors and immune cells also accumulate more in visceral fat, which contributes to sex differences in tumor immunity [18]. Studying differences in ICI therapy efficacy between sexes could provide insight into potential therapeutic targets. However, there are no generalized models of how adiposity and sex hormones affect cancer at the molecular level, and mechanistic pathways may differ between cancers.
Obesity-related systemic inflammation is crucial to the connection between obesity and the immune system. Some studies have suggested that the development of the “obesity paradox” may be linked to inflammatory cells, such as neutrophils and lymphocytes [13]. However, our study did not find a significant correlation between body composition parameters and these cells. The lack of correlation may be because macrophages are the primary inflammatory cells that accumulate in adipose tissue and play a crucial role in obesity-mediated chronic inflammation [36, 37]. They exhibit high plasticity and can display heterogeneity from antitumor to protumor phenotypes in response to various environments and stimuli [38, 39]. Lumeng et al. discovered that diet-induced obesity alters the activation state of macrophages from an M2-type immunosuppressive state to an M1-type antitumor state [40]. Furthermore, anti-PD-1 treatment increased the number of antitumor M1-type macrophages while decreasing the number of M2-type macrophages with immunosuppressive functions, thus promoting immune efficacy [41].
Although neutrophils are not a large subpopulation in adipose tissue, they do have an impact on ICI therapy. Current research indicates that neutrophils are the most abundant leukocytes in human circulation. They accumulate in various tumor types, and different subtypes of neutrophils have distinct functions in tumors [42–44]. Jitka et al. discovered that as tumors progress, mature high-density neutrophils (HDNs) in the peripheral circulation are transformed into immature low-density neutrophils (LDNs) with protumor effects [45]. This may explain why a higher NLR is associated with a worse prognosis. However, Jeremy et al. reported a significant increase in the number of tumor-associated neutrophils in a mouse model that responded positively to ICI therapy [42]. This conclusion is contrary to our findings, and we hypothesized that circulating and tumor-infiltrating neutrophils were also heterogeneous. A recent study by Zilionis et al. verified our hypothesis and revealed that gene expression differed significantly between circulating and tumor-infiltrating neutrophils [46]. The role of neutrophils in tumor immunity is multifaceted and influenced by various environmental stimuli. However, the intrinsic mechanisms and pathways of neutrophils remain unclear. Further exploration of these mechanisms may lead to the development of beneficial neutrophil subtypes for patients and improve the efficacy of antitumor therapy.
In addition, cancer patients often undergo multiple courses of chemotherapy before receiving ICI therapy, which may result in more pronounced weight fluctuations. Therefore, we compared the predictive value of the above indicators for ICI therapy efficacy at different time points. We found that the data from the first cycle of ICI therapy had a greater predictive value for prognosis. The study indicated that the impact of obesity on the immune system is not fixed but rather changes over time. Furthermore, the effects of obesity on ICI efficacy are more closely linked to the patient's current condition. Additionally, a recent study revealed that supplementing the diet with oleic acid improved the control of tumor growth in mice treated with PD-1 inhibitors, resulting in a significant increase in the survival rate [47]. This finding demonstrates that by implementing a reasonable dietary intervention and adjusting the patient's body state, it is possible to achieve better treatment outcomes for patients receiving ICI therapy. However, the effectiveness of ICI therapy can be influenced by various host factors, such as sex, tumor type, and therapeutic drugs. Weight management in cancer patients should be approached with caution, avoiding stereotypical demands that patients lose or gain weight. It is important to consider individual factors and promote tailored healthy lifestyle changes to address the complex relationship between obesity and cancer outcomes.
Our research indicated that BMI, VFI, and NRL were more effective predictors of OS rather than PFS. This could be because the association between early endpoints and OS was more consistent for these agents than for conventional cytotoxic agents. Moreover, the unique mechanism of action of ICI therapy and other therapies acts on tumor growth kinetics rather than directly killing tumor cells [48]. In addition, variations in deletions among the groups may have impacted PFS to a greater degree than OS, which might explain this discrepancy.
This study has limitations. First, it was a retrospective and single-center study, resulting in a small sample size and limited generalizability of some results. Second, the study mainly included gastrointestinal cancers, such as colorectal and esophageal cancers, with a majority of the patients being male. This resulted in an imbalance in the number of male and female patients, and a relatively small proportion of the included patients were obese. Therefore, the results may be biased, reducing their validity. Third, the study did not report any ICI therapy-related adverse effects.
The studies above suggest a complex link between obesity, sex, inflammatory status, and antitumor immune responses. Studying the differences could therein provide new biological insights and therapeutic targets to individualize treatment and improve patient prognosis.
Acknowledgements
None.
Author contributions
Study design: HWS, and LY. Data collection, analysis and interpretation: WJX, YFL, YY and DM. Patient follow-up: WJX, YY and RRL. Image analysis: YFL. Drafting of the manuscript: WJX. Critical revision of the manuscript: HWS, LY and LW. Approval of the final version for publication: all co-authors.
Funding
Not applicable.
Availability of data and materials
The raw data supporting the conclusions of this article will be made available by the authors, without undue reservation.
Declarations
Ethics approval and consent to participate
This study was performed in accordance with the Helsinki standard and the study’s protocol was approved by Guangdong Provincial People’s Hospital Research Ethics Committee (ref No: KY2023-714–01).
Consent for publication
Not applicable.
Competing interests
The authors declare that they have no competing interests.
Footnotes
Publisher's Note
Springer Nature remains neutral with regard to jurisdictional claims in published maps and institutional affiliations.
Wenjing Xu, Yifan Yang and Yue Yu have contributed equally to this work.
Contributor Information
Lu Yang, Email: yanglu0515@gdph.org.cn.
Hengwen Sun, Email: sunrise761114@foxmail.com.
References
- 1.Bagchi S, Yuan R, Engleman EG. Immune checkpoint inhibitors for the treatment of cancer: clinical impact and mechanisms of response and resistance. Ann Rev Pathol. 2021;16:223. [DOI] [PubMed] [Google Scholar]
- 2.Overman MJ, McDermott R, Leach Jl, et al. Nivolumab in patients with metastatic DNA mismatch repair-deficient or microsatellite instability-high colorectal cancer (CheckMate 142): an open-label, multicentre, phase 2 study. Lancet Oncol. 2017;18(9):1182. [DOI] [PMC free article] [PubMed] [Google Scholar]
- 3.Robert C, Long GV, Brady B, et al. Nivolumab in previously untreated melanoma without BRAF mutation. N Engl J Med. 2015;372(4):320–30. [DOI] [PubMed] [Google Scholar]
- 4.Das S, Johnson DB. Immune-related adverse events and anti-tumor efficacy of immune checkpoint inhibitors. J Immunother Cancer. 2019. 10.1186/s40425-019-0805-8. [DOI] [PMC free article] [PubMed] [Google Scholar]
- 5.Casrto A, Pyke RM, Zhang X, et al. Strength of immune selection in tumors varies with sex and age. Nat Commun. 2020. 10.1038/s41467-020-17981-0. [DOI] [PMC free article] [PubMed] [Google Scholar]
- 6.Conforti F, Pala L, Bagnardi V, et al. Cancer immunotherapy efficacy and patients’ sex: a systematic review and meta-analysis. Lancet Oncol. 2018;19(6):737–46. [DOI] [PubMed] [Google Scholar]
- 7.Desharnais L, Walsh LA, Quail DF. Exploiting the obesity-associated immune microenvironment for cancer therapeutics. Pharmacol Ther. 2022;229: 107923. [DOI] [PubMed] [Google Scholar]
- 8.Loomans-Kropp HA, Umar A. Analysis of body mass index in early and middle adulthood and estimated risk of gastrointestinal cancer. JAMA Netw Open. 2023;6(5): e2310002. [DOI] [PMC free article] [PubMed] [Google Scholar]
- 9.Kitahara CM, Berndt SI, De González AB, et al. Prospective investigation of body mass index, colorectal adenoma, and colorectal cancer in the prostate, lung, colorectal, and ovarian cancer screening trial. J Clin Oncol. 2013;31(19):2450–9. [DOI] [PMC free article] [PubMed] [Google Scholar]
- 10.Moon JM, Im JP, Kim D, et al. Increasing changes in visceral adiposity is associated with higher risk for colorectal adenoma: multilevel analysis in a prospective cohort. J Gastroenterol Hepatol. 2021;36(7):1836–42. [DOI] [PubMed] [Google Scholar]
- 11.Brown KA, Scherer PE. Update on adipose tissue and cancer. Endocrine Rev. 2023;44(6):961. [DOI] [PMC free article] [PubMed] [Google Scholar]
- 12.Ringel AE, Drijvers JM, Baker GJ, et al. Obesity shapes metabolism in the tumor microenvironment to suppress anti-tumor immunity. Cell. 2020;183(7):1848. [DOI] [PMC free article] [PubMed] [Google Scholar]
- 13.Lee JH, Hyung S, Lee J, et al. Visceral adiposity and systemic inflammation in the obesity paradox in patients with unresectable or metastatic melanoma undergoing immune checkpoint inhibitor therapy: a retrospective cohort study. J Immunother Cancer. 2022;10(8): e005226. [DOI] [PMC free article] [PubMed] [Google Scholar]
- 14.Ged Y, Sanchez A, Patil S, et al. Associations between pretreatment body composition features and clinical outcomes among patients with metastatic clear cell renal cell carcinoma treated with immune checkpoint blockade. Clin Cancer Res. 2022;28(23):5180–9. [DOI] [PMC free article] [PubMed] [Google Scholar]
- 15.Kichenadasse G, Miners JO, Mangoni AA, et al. association between body mass index and overall survival with immune checkpoint inhibitor therapy for advanced non-small cell lung cancer. JAMA Oncol. 2020;6(4):512–8. [DOI] [PMC free article] [PubMed] [Google Scholar]
- 16.Lee JH, Kang D, Ahn JS, et al. Obesity paradox in patients with non-small cell lung cancer undergoing immune checkpoint inhibitor therapy. J Cachexia Sarcopenia Muscle. 2023;14(6):2898–907. [DOI] [PMC free article] [PubMed] [Google Scholar]
- 17.Deng HY, Chen ZJ, Qiu XM, et al. Sarcopenia and prognosis of advanced cancer patients receiving immune checkpoint inhibitors: a comprehensive systematic review and meta-analysis. Nutrition. 2021;90:111345. [DOI] [PubMed] [Google Scholar]
- 18.Ibrahim MM. Subcutaneous and visceral adipose tissue: structural and functional differences. Obesity Rev. 2010;11(1):118. [DOI] [PubMed] [Google Scholar]
- 19.Curat CA, Wegner V, Sengenès C, et al. Macrophages in human visceral adipose tissue: increased accumulation in obesity and a source of resistin and visfatin. Diabetologia. 2006;49(4):744–7. [DOI] [PubMed] [Google Scholar]
- 20.Heshmat-Ghahdarijani K, Sarmadi V, Heidari A, et al. The neutrophil-to-lymphocyte ratio as a new prognostic factor in cancers: a narrative review. Front Oncol. 2023;13:1228076. [DOI] [PMC free article] [PubMed] [Google Scholar]
- 21.Pacific W H O R O For The W. The Asia-Pacific perspective : redefining obesity and its treatment. Sydney : Health Communications Australia, 2000.
- 22.Barbalho ER, Rocha IM, Medeiros GO, et al. Agreement between software programmes of body composition analyses on abdominal computed tomography scans of obese adults. Archiv Endocrinol Metabol. 2020;64(1):24. [DOI] [PMC free article] [PubMed] [Google Scholar]
- 23.Steele S, Lin F, Le TL, et al. Segmentation and linear measurement for body composition analysis using slice-o-matic and horos. J Vis Exp. 2021;169:e61674. [DOI] [PubMed] [Google Scholar]
- 24.Lee J, Chang CL, Lin JB, et al. Skeletal muscle loss is an imaging biomarker of outcome after definitive chemoradiotherapy for locally advanced cervical cancer. Clin Cancer Res. 2018;24(20):5028–36. [DOI] [PubMed] [Google Scholar]
- 25.Zeng X, Shi Z, Yu J, et al. Sarcopenia as a prognostic predictor of liver cirrhosis: a multicentre study in China. J Cachexia Sarcopenia Muscle. 2021;12(6):1948–58. [DOI] [PMC free article] [PubMed] [Google Scholar]
- 26.Klein SL, Flanagan KL. Sex differences in immune responses. Nat Rev Immunol. 2016;16(10):626–38. [DOI] [PubMed] [Google Scholar]
- 27.Pala L, De Pas T, Catania C, et al. Sex and cancer immunotherapy: current understanding and challenges. Cancer Cell. 2022;40(7):695–700. [DOI] [PubMed] [Google Scholar]
- 28.Zhang F-M, Wu H-F, Shi H-P, et al. Sarcopenia and malignancies: epidemiology, clinical classification and implication. Ageing Res Rev. 2023;91: 102057. [DOI] [PubMed] [Google Scholar]
- 29.Surov A, Strobel A, Borggrefe J, et al. Low skeletal muscle mass predicts treatment response in oncology: a meta-analysis. Eur Radiol. 2023;33(9):6426–37. [DOI] [PubMed] [Google Scholar]
- 30.Wang Z, Aguilar EG, Luna JI, et al. Paradoxical effects of obesity on T cell function during tumor progression and PD-1 checkpoint blockade. Nat Med. 2019;25(1):141. [DOI] [PMC free article] [PubMed] [Google Scholar]
- 31.Boi SK, Orlandella RM, Gibson JT, et al. Obesity diminishes response to PD-1-based immunotherapies in renal cancer. J Immunother Cancer. 2020;8(2):1. [DOI] [PMC free article] [PubMed] [Google Scholar]
- 32.Wang S, Cowley LA, Liu XS. sex differences in cancer immunotherapy efficacy, biomarkers, and therapeutic strategy. Molecules. 2019;24(18):141. [DOI] [PMC free article] [PubMed] [Google Scholar]
- 33.McQuade JL, Daniel CR, Hess KR, et al. Association of body-mass index and outcomes in patients with metastatic melanoma treated with targeted therapy, immunotherapy, or chemotherapy: a retrospective, multicohort analysis. Lancet Oncol. 2018;19(3):310. [DOI] [PMC free article] [PubMed] [Google Scholar]
- 34.Chakraborty B, Byemerwa J, Shepherd J, et al. Inhibition of estrogen signaling in myeloid cells increases tumor immunity in melanoma. J Clin Investig. 2021;131(23):1. [DOI] [PMC free article] [PubMed] [Google Scholar]
- 35.Palmer BF, Clegg DJ. The sexual dimorphism of obesity. Mol Cell Endocrinol. 2015;1:113. [DOI] [PMC free article] [PubMed] [Google Scholar]
- 36.Chavakis T, Alexaki VI, Ferrante AW Jr. Macrophage function in adipose tissue homeostasis and metabolic inflammation. Nat Immunol. 2023;24(5):757. [DOI] [PubMed] [Google Scholar]
- 37.Weisberg SP, McCann D, Desai M, et al. Obesity is associated with macrophage accumulation in adipose tissue. J Clin Investig. 2003;112(12):1796. [DOI] [PMC free article] [PubMed] [Google Scholar]
- 38.Christofides A, Strauss L, Yeo A, et al. The complex role of tumor-infiltrating macrophages. Nat Immunol. 2022;23(8):1148. [DOI] [PMC free article] [PubMed] [Google Scholar]
- 39.Robinson A, Han CZ, Glass CK, et al. Monocyte regulation in homeostasis and malignancy. Trends Immunol. 2021;42(2):104. [DOI] [PMC free article] [PubMed] [Google Scholar]
- 40.Lumeng CN, Bodzin JL, Saltiel AR. Obesity induces a phenotypic switch in adipose tissue macrophage polarization. J Clin Investig. 2007;117(1):175–84. [DOI] [PMC free article] [PubMed] [Google Scholar]
- 41.Pingili AK, Chaib M, Sipe LM, et al. Immune checkpoint blockade reprograms systemic immune landscape and tumor microenvironment in obesity-associated breast cancer. Cell Rep. 2021;35(12): 109285. [DOI] [PMC free article] [PubMed] [Google Scholar]
- 42.Gungabeesoon J, Gort-Freitas NA, Kiss M, et al. A neutrophil response linked to tumor control in immunotherapy. Cell. 2023;186(7):1448–1464.e20. [DOI] [PMC free article] [PubMed] [Google Scholar]
- 43.Kargl J, Busch SE, Yang GH, et al. Neutrophils dominate the immune cell composition in non-small cell lung cancer. Nat Commun. 2017;1(8):14381. [DOI] [PMC free article] [PubMed] [Google Scholar]
- 44.Shaul ME, Fridlender ZG. Tumour-associated neutrophils in patients with cancer. Nat Rev Clin Oncol. 2019;16(10):601–20. [DOI] [PubMed] [Google Scholar]
- 45.Sagiv JY, Michaeli J, Assi S, et al. Phenotypic diversity and plasticity in circulating neutrophil subpopulations in cancer. Cell reports. 2015;10(4):154. [DOI] [PubMed] [Google Scholar]
- 46.Zilionis R, Engblom C, Pfirschke C, et al. Single-cell transcriptomics of human and mouse lung cancers reveals conserved myeloid populations across individuals and species. Immunity. 2019;50(5):1317. [DOI] [PMC free article] [PubMed] [Google Scholar]
- 47.Lai Y, Gao Y, Lin J, et al. Dietary elaidic acid boosts tumoral antigen presentation and cancer immunity via ACSL5. Cell Metab. 2024;S1550–4131(24):00012–3. [DOI] [PubMed] [Google Scholar]
- 48.Merino M, Kasamon Y, Theoret M, et al. Irreconcilable differences: the divorce between response rates, progression-free survival, and overall survival. J Clin Oncol. 2023;41(15):2706. [DOI] [PMC free article] [PubMed] [Google Scholar]
Associated Data
This section collects any data citations, data availability statements, or supplementary materials included in this article.
Data Availability Statement
The raw data supporting the conclusions of this article will be made available by the authors, without undue reservation.


