Abstract
We compared the accuracy of microarray measurements obtained with oligonucleotide arrays (GeneChip, Affymetrix) with a laboratory-developed cDNA array by assaying test RNA samples from an experiment using a paradigm known to regulate many genes measured on both arrays. We selected 47 genes represented on both arrays, including both known regulated and unregulated transcripts, and established reference relative expression measurements for these genes in the test RNA samples using quantitative reverse transcriptase real-time PCR (QRTPCR) assays. The validity of the reproducible (average coefficient of variation = 11.8%) QRTPCR measurements were established through application of a new mathematical model. The performance of both array platforms in identifying regulated and non-regulated genes was identical. With either platform, 16 of 17 definitely regulated genes were correctly identified, and no definitely unregulated transcript was falsely identified as regulated. Accuracy of the fold-change measurements obtained with each platform was assessed by determining measurement bias. Both platforms consistently underestimate the relative changes in mRNA expression between experimental and control samples. The bias observed with cDNA arrays was predictable for fold-changes <250-fold by QRTPCR and could be corrected by the calibration function Fc = Fa(cDNA)q, where Fa(cDNA) is the microarray-determined fold-change comparing experimental with control samples, q is the correction factor and Fc is the calibrated value. The bias observed with the commercial oligonucleotide arrays was less predictable and calibration was unfeasible. Following calibration, fold-change measurements generated by custom cDNA arrays were more accurate than those obtained by commercial oligonucleotide arrays. Our study demonstrates systematic bias of microarray measurements and identifies a calibration function that improves the accuracy of cDNA array data.
INTRODUCTION
Microarray techniques enable parallel assessment of the relative expression of thousands of mRNAs in response to different experimental conditions or in different tissues. These approaches are being applied to refine the classification of neoplasias (1,2) and to elucidate the gene programs underlying various cellular processes (3–5). The development of centralized expression repositories, which have been proposed to serve as resources for biological hypothesis generation and testing, warrants the assessment and refinement of the different microarray platforms.
The value of microarray experiments and databases would be increased by improvements in data accuracy. The objectives of a microarray experiment are to identify the transcripts that are altered among RNA samples and to determine the magnitude of the differences observed. However, there is little known about the accuracy of microarrays in identifying regulated transcripts or about the relationship of the relative changes in mRNA levels obtained using microarrays to the actual relative levels of these mRNAs in the samples assayed. One way to refine the accuracy of microarray measurements would be to calibrate microarray measurements in reference to a more quantitative mRNA expression assay.
Either of two different experimental platforms, an oligonucleotide array or a custom printed cDNA array, is used for most microarray experiments. High density, standardized oligonucleotide arrays are available commercially (GeneChip, Affymetrix, Santa Clara, CA). cDNA arrays are usually developed as custom arrays in specialized laboratories based on protocols developed in the Brown laboratory at Stanford University (6). Little data about the relative performance of these two experimental platforms are available. Both array approaches lead to identification of transcripts with altered expression and provide data concerning the relative level of expression of these mRNAs in the RNA samples compared. However, the technology used by each system and the basis for the expression measurements are different.
The commercial oligonucleotide array targets are synthesized in situ on the array using an adaptation of the technology developed for etching integrated circuits (7). The signal for each mRNA is determined by hybridization with a cluster of up to 20 pairs of oligonucleotides. Each oligonucleotide pair consists of a perfect match and a single-base mismatch sequence for the mRNA assayed. The overall signal for the mRNA is determined from the differences in hybridization signal for the oligonucleotide pairs. Each array is hybridized with probe derived from a single RNA sample. The use of test arrays and standardized hybridization and normalization protocols allow comparison of the results obtained with different arrays.
cDNA arrays are typically custom printed from PCR generated amplicons. Usually a single sequence of >200 bp for each gene assayed is present on the array. Whereas probe generated from only one RNA sample is hybridized to each oligonucleotide array, probes from two samples, each labeled with different fluorophores, are hybridized simultaneously on one cDNA array. This competitive hybridization allows the direct comparison of the relative gene expression in the two RNA samples within each array.
Although other reports have compared the results obtained by cDNA microarray with those using other approaches (4,8), to our knowledge, no study of data calibration and systematic comparison of different microarray platforms has previously been described. One recent study claimed that there is little cDNA microarray bias (9). However, unlike the present study, this previous study used no external reference values and did not analyze regulated genes. A meaningful analysis of measurement bias requires the study of differentially expressed transcripts and the establishment of reference measurements.
We have designed the present study to address two related questions: How can the microarray measurements be calibrated to more accurately reflect the relative expression levels of the mRNAs that are assayed? How does the performance of these two widely used microarray platforms, oligonucleotide arrays and cDNA arrays, compare? Both approaches were optimized and used to assay multiple samples from the same experimental paradigm, treatment of a gonadotrope cell line with gonadotropin-releasing hormone (GnRH) or vehicle.
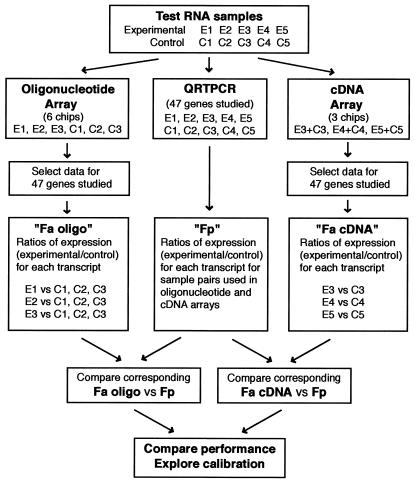
Forty-seven genes present on both arrays, including nearly equal numbers of regulated and unregulated mRNAs, were selected for independent assay of their relative expression levels in the samples assayed using quantitative reverse-transcriptase real-time PCR (QRTPCR). QRTPCR was utilized for these reference measurements because it provides reliable relative mRNA quantification over a large range of mRNA expression levels (10,11). Thus, the data from each microarray platform were evaluated in reference to an mRNA expression assay that independently quantifies the relative levels of gene expression. Using these data, we have explored calibration procedures and compared the performance of the two microarray systems. A schematic of the overall experimental design is presented in Figure 1.
Figure 1.
Study design. The test RNA samples were generated following GnRH-treatment (experimental) or vehicle-treatment (control) of a gonadotrope cell line. Samples E1–E3 and C1–C3 were generated in one experiment. The E4/C4 and E5/C5 samples were generated in two separate experiments.
MATERIALS AND METHODS
Cell culture and RNA sample preparation
LβT2 cells obtained from Pamela Mellon (University of California, San Diego, CA) were maintained at 37°C in 5% CO2 in humidified air in DMEM (Mediatech, Herndon, VA) containing 10% fetal bovine serum (Gemini, Calabasas, CA). Cells (40–50 × 106) were seeded in 15 cm dishes and medium was replaced 24 h later with DMEM containing 25 mM HEPES (Mediatech) and glutamine. The next day, the cells were treated with 100 nM GnRH or vehicle and were returned to the CO2 incubator for 1 h, at which point the medium was replaced with 10 ml lysis buffer (4 M guanidinium thiocyanate, 25 mM sodium citrate pH 7.0, 0.5% N-lauroyl-sarcosine and 0.1 M 2-mercaptoethanol). Total RNA was isolated according to the method of Chomczynski and Sacchi (12). Samples from three vehicle- and three GnRH-exposed cultures were assayed using each of the two microarray platforms studied. As one treated and control sample pair was hybridized with both arrays, a total of 10 RNA samples were used in this study (Fig. 1).
Oligonucleotide microarray probe labeling and hybridization
First strand cDNA was synthesized by incubating 40 µg of total RNA with 400 U SuperScript II reverse transcriptase (Invitrogen, Carlsbad, CA), 100 pmol T7-(dT)24 primer [5′-GGCCAGTGAATTGTAATACGACTCACTATAGGGAGGCGG-(dT)24-3′], 1× first strand buffer (50 mM Tris–HCl pH 8.3, 75 mM KCl, 3 mM MgCl2, 10 mM DTT) and 0.5 mM dNTPs at 42°C for 1 h. Second strand synthesis was performed by incubating the first strand cDNA with 10 U Escherichia coli ligase (Invitrogen), 40 U DNA polymerase I (Invitrogen), 2 U RNase H (Invitrogen), 1× reaction buffer [18.8 mM Tris–HCl pH 8.3, 90.6 mM KCl, 4.6 mM MgCl2, 3.8 mM DTT, 0.15 mM NAD, 10 mM (NH4)2SO4] and 0.2 mM dNTPs at 16°C for 2 h. Ten units of T4 DNA polymerase (Invitrogen) were then added, and the reaction was allowed to continue for another 5 min at 16°C. After phenol–chloroform extraction and ethanol precipitation, the double-stranded cDNA was resuspended in 10 µl DEPC-treated dH2O. Labeling of the dsDNA was done by in vitro transcription using a BioArray HighYield RNA transcript labeling kit (Enzo Diagnostics, Farmingdale, NY). Briefly, the dsDNA was mixed with 1× HY reaction buffer, 1× biotin labeled ribonucleotides (NTPs with Bio-UTP and Bio-CTP), 1× DTT, 1× RNase inhibitor mix and 1× T7 RNA polymerase. The mixture was incubated at 37°C for 5 h, with gentle mixing every 30 min. The labeled cRNA was then purified using a RNeasy mini kit (Qiagen, Valencia, CA) according to the manufacturer’s protocol and ethanol precipitated. The purified cRNA was fragmented in 1× fragmentation buffer (40 mM Tris–acetate, 100 mM KOAc, 30 mM MgOAc) at 94°C for 35 min. For hybridization with GeneChip cartridge (Affymetrix), 15 µg fragmented cRNA probe was incubated with 50 pM control oligonucleotide B2, 1× eukaryotic hybridization control (1.5 pM BioB, 5 pM BioC, 25 pM BioD and 100 pM cre), 0.1 mg/ml herring sperm DNA, 0.5 mg/ml acetylated BSA and 1× manufacturer recommended hybridization buffer in a 45°C rotisserie oven for 16 h. Washing and staining was performed with a GeneChip fluidic station (Affymetrix) using the appropriate antibody amplification washing and staining protocol. The phycoerythrin-stained array was scanned as a digital image file.
Oligonucleotide array quality control and data analysis
To assess the quality of the cRNA labeling, the probe was first hybridized to a Test2 Array (Affymetrix). The scanned image, after visually inspected to be free of specks or scratches, was analyzed using Microarray Suite 5.0 (Affymetrix). We required probe labeling to exceed the following benchmarks in the test array: low noise (RawQ <15), low background (<600), low 3′ to 5′ ratio of actin and GAPDH (ratio <2) and presence of control genes cre, BioD and BioC. Probes that exceeded these quality control values in the test hybridization were used with the GeneChip U74A mouse genome array. A total of six arrays were used (three with vehicle-treated samples and three with GnRH-treated samples). Quality control was identical to that for the Test2 Array but, because of the smaller feature size on the high density U74A array (20 versus 50 µm on the Test2 Array), a slightly higher noise was acceptable (RawQ <30). Pairwise comparison was done between all possible vehicle-treated versus GnRH-treated sample pairs to generate the relative levels of expression of each transcript, Fa(oligo), used in the analysis. A repeat analysis of all data was also performed using Microarray Suite 4.0 (Affymetrix), which is based on an empirical algorithm rather than a statistical algorithm. In this case the ratios of the mean-difference of all perfect-match mismatch oligonucleotide pairs for each gene between each experimental and control samples are the Fa(oligo) values used for analysis. The occasional negative fold-change values obtained using Microarray Suite 4.0 were converted to the reciprocal of the absolute value and all tildes were removed. All oligonucleotide data shown in the Figures are from the Microarray Suite 5.0-based analysis. As there are three experimental and three control samples, there were nine Fa(oligo) values for cluster on the array studied. The nine genes assayed by more than one cluster on the array were analyzed independently.
cDNA microarray development, probe labeling and hybridization
The design, quality control, validation and detailed protocols for use and analysis of this microarray have been described elsewhere (5). Briefly, this array contains 956 clones selected mostly from an NIA 15K library (13) or purchased from Research Genetics. Plasmid inserts were amplified by PCR, products were confirmed by agarose gel electrophoresis and purified. The dried product was spotted in 50% DMSO (three hits/feature, three features/gene) with a GMS 417 Arrayer (Affymetrix) on CMT–GAPS coated glass slides (Corning, Corning, NY). DNA was fixed at 85°C for 2 h.
Aliquots of 20 µg of total RNA from each sample were labeled with either Cy3 or Cy5 using the Atlas indirect labeling kit (Clontech, Palo Alto, CA) as indicated by the manufacturer. After array prehybridization (6× SSC, 0.5% SDS, 1% BSA at 42°C for 45 min), the probe was denatured and hybridized in 24 µl 50% formamide, 6× SSC, 0.5% SDS, 5× Denhardt’s with 2.4 µg salmon sperm DNA, 10 µg poly(dA) at 42°C for 16 h. Following 10 min washes in 0.1× SSC, 0.1% SDS, and twice in 0.1× SSC, the slide was scanned using the GMS 418 Scanner (Affymetrix).
cDNA microarray data analysis
Scanned microarray data were exported as TIFF files to Genepix (Axon Instruments, Union City, CA) and spot registration was optimized manually as suggested by the developer. The median background-subtracted feature intensity was utilized for further analysis. Overall differences in the signal intensity of the two wavelengths measured on each slide (λ = 532 nm and λ = 635 nm) were corrected using the loess function in S Plus Professional (Insightful Corporation, Seattle, WA). Predictors were generated using a symmetric distribution, span = 0.75 (14). The ratios of the resulting corrected data for each feature were used for subsequent analysis. Coefficient of variations (cv) of the triplicate measurements on each array were determined as previously described (5).
Target selection
As a basis for comparison of the two array platforms, we chose to analyze a selection of 47 genes that are present on both arrays. These 47 selected genes have previously been shown to consist of roughly equal numbers of regulated and non-regulated genes in this experimental paradigm (5). Some target clusters were incorrectly designed on the U74A oligonucleotide array and the genes selected for study excluded target clusters from this group. All 47 genes selected were sequence confirmed on the cDNA array. Out of these 47 genes, 7 were represented by two or more separate clusters on the oligonucleotide arrays and 5 were represented by two different inserts on the cDNA array.
Quantitative real-time PCR
We used a previously described protocol (15). Briefly, 5 µg total RNA was converted into cDNA and 1/400 (∼250 pg) was utilized for 40 cycle three-step PCR in either an ABI Prism 7700 or ABI 7900HT (Applied Biosystems, Foster City, CA) in 20 mM Tris pH 8.4, 50 mM KCl, 3 mM MgCl2, 200 µM dNTPs, 0.5× SYBR Green I (Molecular Probes, Eugene, OR), 200 nM each primer and 0.5 U Platinum Taq (Invitrogen). Amplicon size and reaction specificity were confirmed by agarose gel electrophoresis. The number of target copies in each sample was interpolated from its detection threshold (CT) value using a plasmid or purified PCR product standard curve included on each plate. The sequence of the primer sets utilized are reported elsewhere (5). Each transcript in each sample was assayed five times and the median CT values were used to calculate the Fp values (fold-change ratios between experimental and control samples for each gene) used in the analysis.
QRTPCR measurement precision was assessed by determining the reproducibility of Fp values. For this purpose, four or five independent Fp determinations were made in separate QRTPCR runs for five genes using the same experimental and treatment RNA samples. The resulting Fp values were then used to calculate the cv for each of the five genes and the overall average cv.
Determination of relative expression of the genes assayed in the different samples by QRTPCR should be corrected for any differences in reaction efficiency between the sample cDNAs and the standard curve samples. In order to determine reaction efficiency, we parametrized the QRTPCR fluorescence data for every run according to
F(C) = P(C)+T × (1+E)C
where F(C) is the fluorescence detected at each cycle number C, P(C) is the instrument background fluorescence, T is the fluorescence arising from the target sequence, and E is the PCR efficiency.
First, the background fluorescence was fit as a second order polynomial by unweighted regression using a commercial statistical analysis software package (S-Plus 6 Release 2, Insightful Corp.) over a range of cycles in which the target-induced fluorescence remained insignificant. This approach was selected to accommodate any systematic instrument drift occurring over time. This polynomial was subtracted from the fluorescence data over its entire range, and a range of cycles was selected over which the resulting fluorescence data f(C) was well fit by an exponential function
f(C) = T × exp(N × C)
with pre-factor T and slope N, using the same software. This occurred in a cycle range over which ln(f) was approximately linear: beyond the initial background-dominated region and before the saturation region. The efficiency was then straightforwardly determined as
E = exp(N) – 1
Variation in QRTPCR arising from reverse transcription
We evaluated the variation in the determination of the levels of specific mRNAs that resulted from the reverse transcription of the RNA samples by determining the variation in CT values obtained for several transcripts when repeated independent cDNA syntheses from the same RNA sample were assayed. Six repeated cDNA syntheses were performed with a total of four RNA samples and five transcripts were assayed in cDNAs from two of the RNA samples and five other transcripts were assayed in cDNAs from the other two RNA samples. To reduce the contribution of the variation occurring from the PCR to the overall determination of variance in this experiment, we obtained three to six replicate measurements for each transcript assayed from each sample and utilized the median value of these repeated measurements for our calculations. We then determined a cv using each group of six resulting median CT values corresponding to the same transcript assayed in six cDNA samples generated from the same starting RNA sample. A total of 18 determinations of cv from repeated cDNA syntheses were obtained.
Outlier detection
Oligonucleotide array. The experiments utilized to generate the samples for this study results in only up-regulated genes (5). An oligonucleotide array gene was considered regulated if it was identified as increased in at least six of the nine pairwise comparisons from all experiments using the difference call algorithm included in the statistics-based Microarray Suite 5.0 (see Fig. 1 and Supplementary Material Table S1). Outlier detection of the same dataset was also performed with the empirical algorithm-based Microarray Suite 4.0 (Supplementary Material Table S2).
cDNA array. cDNA array genes were identified as regulated based on an algorithm described in detail elsewhere (5). Briefly, t values for the log transform ratios (logFa) were determined for triplicate data from each slide. Genes were considered to be regulated if they showed Fa > 1.3, t > 3 and signal intensity for at least one fluorophore >1% of the median signal intensity value, with all criteria met in at least two of the three experiments (see Fig. 1).
QRTPCR. In order to compare microarray sensitivity and specificity, subgroups of definitely regulated and definitely unregulated transcripts were determined by QRTPCR measurements. There are a total of 11 experimental/control ratios used in either oligonucleotide or cDNA microarray analysis (see Fig. 1; nine comparisons are made with the oligonucleotide arrays, three with the cDNA arrays, and one of these comparisons, E3 + C3, overlaps in both platforms). Definitely regulated genes were defined as those transcripts showing >1.3-fold changes by QRTPCR in all 11 experimental/control ratios corresponding to the sample comparisons studied with either microarray platform. Definitely unregulated genes were defined as those showing <1.5-fold changes by QRTPCR in all 11 experimental/control ratios corresponding to the sample comparisons studied with either microarray platform. These criteria identify two distinct groups of genes in our experimental QRTPCR data (see Supplementary Material, Tables S1 and S2).
Bias quantification
The degree of bias (δ) in the microarray datasets was estimated using
and N is the total number of ratios utilized. This assessment was calculated for all ratios with 1.3 < Fp < 50. The interval was chosen because the bias is most pronounced for regulated genes and because the few genes included in this analysis that are regulated >50-fold show a maximal array regulation effect that would distort the estimate of overall array bias were they included. δ is negative when the Fa value tends to underestimate the Fp value, and positive when the Fa value tends to overestimate the Fp value.
cDNA array calibration
The cDNA array data were calibrated by applying the following power-law transformation:
where Fc is the corrected fold change for each microarray fold change Fa between experimental and control samples. The power q was determined by fitting the microarray and PCR data using a linear regression of their logarithms, namely
over a range of QRTPCR fold changes Fp between 1.3 and 32, treating every microarray measurement independently. The power q can be visualized as that power necessary to level the slope of a straight-line fit to the data in Figure 7A. Each cDNA microarray contains three measurements of each gene. Each of those measurements was treated independently and compared with the same Fp value. Duplicate genes included on the microarray are likewise treated as independent measurements in calculating q. The correction obtained from this subgroup of genes was then applied to all Fa(cDNA) values.
Figure 7.
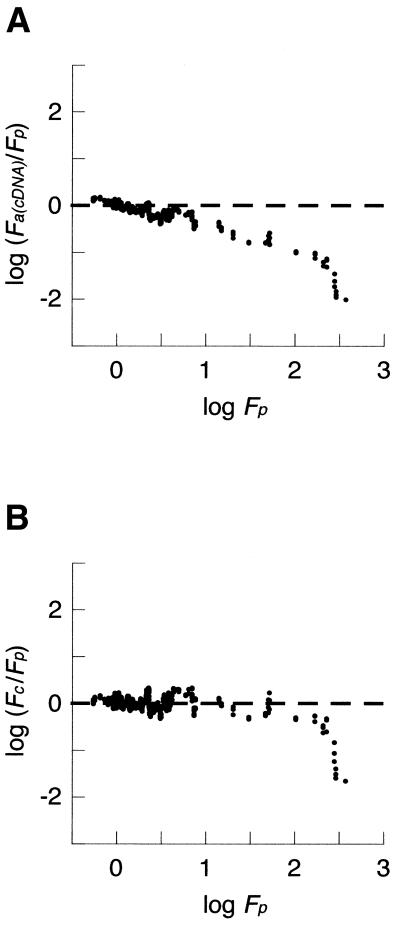
cDNA array bias and calibration. (A) The ratios obtained by cDNA arrays and by QRTPCR [log (Fa(cDNA)/Fp)] are plotted against the ratio determined by QRTPCR (log Fp) as a moving average with a window of 10 values. Note the predictable correlation of the bias error with increasing fold-change values and a saturation effect of log Fa(cDNA) measurements when (log Fp < 2.4). Unbiased data would show a balanced distribution about y = 0 (dashed line). (B) Calibrated cDNA data. All fold-change ratios were calibrated, as described, and the resulting bias plot is shown as a moving average with a window of 10 values. Fc are the calibrated cDNA array-derived relative expression ratios. Note the even distribution about y = 0 for all except the most extreme changes, indicating that the calibration has reduced bias for measurements within this range.
RESULTS
Microarray and QRTPCR reference measurements
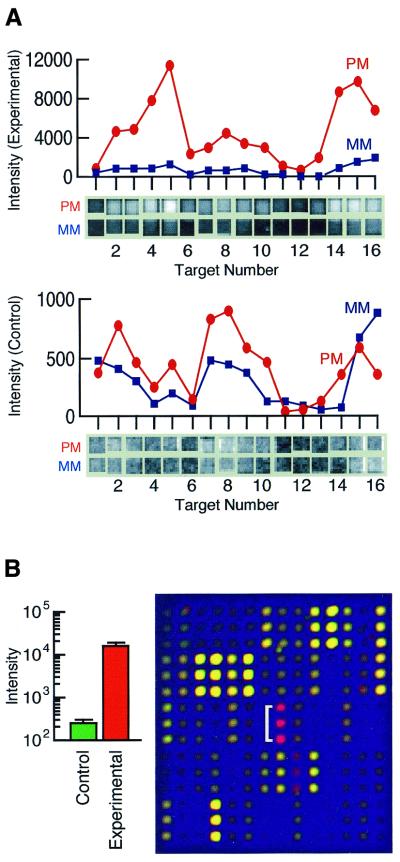
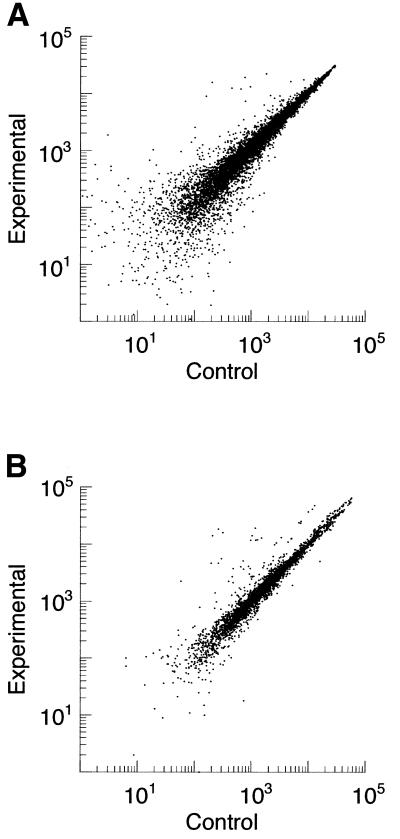
In order to compare the performance of the two microarray platforms studied and to develop approaches for data calibration, both microarray approaches and the QRTPCR used for validation were optimized to generate reproducible data. The raw data for the same gene obtained by oligonucleotide and cDNA array are shown in Figure 2. The RNA isolation, labeling and hybridization to an oligonucleotide array were required to meet stringent quality criteria in both the test-array and final array (see Materials and Methods). The cDNA array was required to manifest low levels of background labeling. The scatter plots obtained with both microarray platforms (Fig. 3) show a tight clustering of most values along the line y = x, reflecting the relatively low measurement noise in the data.
Figure 2.
Microarray data. (A) Oligonucleotide array. The graph shows the difference between experimental (top) and control (bottom) RNA samples for each of the perfect match (PM) and mismatch (MM) probes in the target cluster for the gene lrg21. Note the differences in the scales of the y axes. The raw PM and MM signal intensities for each feature of this target cluster determined using Microarray Suite 5.0 are shown below the plots. Fa(oligo) = 24.4 for this gene cluster in this assay. The scatter plot from this hybridization is shown in Figure 3A. (B) cDNA array. The graph shows the mean ± SD for three measurements of lrg21 made with one cDNA array hybridized with control (green) and experimental (red) samples. Note the y axis is log scale. Fa(cDNA) = 62 in this assay. The triplicate features corresponding to lrg21 are indicated in the overlay of the cDNA microarray raw data. The scatter plot from this hybridization is shown in Figure 3B.
Figure 3.
Representative scatter plot of expression level data from oligonucleotide and cDNA array experiments. (A) Oligonucleotide array. Scatter plot of positive average perfect match minus mismatch values from all genes on two arrays, one hybridized with a control sample and the other with an experimental sample is shown. (B) cDNA array. Background subtracted signal intensity measurements for all genes contained on the cDNA array from one experiment with control and experimental samples. Note the tight clustering of most data about y = x.
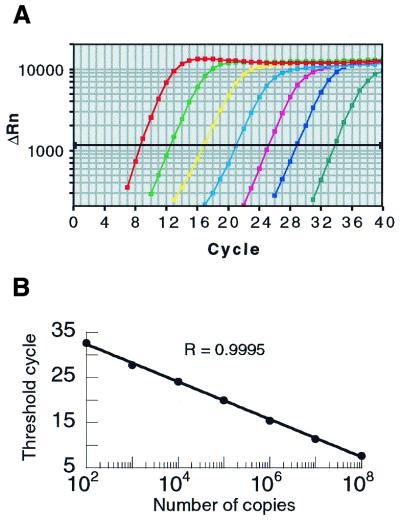
We selected QRTPCR for generating reference measurements because of its reproducibility and large measurement range (10,11,15). The QRTPCR amplifications and plot of a representative standard curve are shown in Figure 4. The large measurement range of the QRTPCR assay is evident. Similar standard curves were generated for the measurements obtained for all 47 genes utilized for analysis.
Figure 4.
Real-time PCR amplification plots from standard curve for lrg21. (A) Amplification plots of standard curve for lrg21. (B) Semilog plot of CT values for lrg21 standard curve obtained from amplification plots shown in (A). The data show a high correlation.
The QRTPCR fold-change determinations were validated by characterizing the measurement variability and by determining reaction efficiency through mathematical modeling of reaction kinetics. Repeated measurement of fold-change determinations were found to be highly reproducible. The relative expression of five genes (c-fos, tis11, pip92, gapdh and beta-actin) were determined four or five times in the same two experimental samples. The median cv for the resulting Fp ratios varied from 7.9% for c-fos to 19.6% for pip92, with an overall average cv of 11.8% for the five genes. The Fp values, which compare the expressions of the 47 transcripts studied in the experimental and control samples, were calculated by comparing the CT values of each cDNA sample with a standard curve generated on the same plate using plasmid or purified PCR product DNA standards. Therefore the accuracy of the Fp determinations depends on similar reaction efficiencies when assaying the DNA standards and the experimental and control cDNA samples. This assumption was tested by mathematical modeling (see Materials and Methods). Three QRTPCR reactions were studied in detail and the efficiencies of each reaction were determined using the model. For the pip92 reactions, the average efficiencies were 94 ± 4% (n = 87) for the cDNA samples and 95 ± 6% (n = 6) for the DNA standards. For the egr1 reactions, the average efficiencies were 88 ± 11% (n = 86) for the cDNA samples and 94 ± 5% (n = 6) for the DNA samples. For the c-jun reactions, the average efficiencies were 98 ± 8% (n = 85) for the cDNA samples and 93 ± 5% (n = 6) for the DNA standards. Thus, in no case was there a significant difference between the mean efficiencies of the QRTPCR reactions using cDNA samples or DNA standards. These results indicate that the QRTPCR measurements, using DNA standards for within-plate comparisons, provide an accurate and reproducible assessment of the relative changes of the genes assayed.
We also evaluated variation in QRTPCR measurements that arose from the reverse transcription of RNA samples. We tested this variation by generating replicate cDNA samples from the same RNA samples and determining the variation in the CT values obtained for specific transcripts (see Materials and Methods). We obtained a total of 18 determinations of cv arising from the reverse transcription, which were found to be uniformly low (median cv = 1.2%). Thus, the reverse transcription step itself introduces little variation into QRTPCR measurements. Based on these considerations, we determined that QRTPCR would provide a reliable set of reference measurements for comparison with microarray data. Accordingly, we utilized the measurements of the relative levels of expression of these 47 genes, assayed in the same samples by both microarray and QRTPCR, to evaluate the accuracy of the microarrays. All data used for the analysis is included in Supplementary Material (Tables S1–S3).
Sensitivity and specificity in identifying regulated transcripts
Both microarray platforms and the analysis algorithms utilized had a comparably high level of accuracy in identifying regulated genes as confirmed by QRTPCR. The sensitivity of the array is represented by the percentage of regulated genes that are correctly identified. In order to compare the same genes in the two platforms, we identified by QRTPCR a subgroup of 17 genes that were consistently regulated in all RNA samples used for the microarrays (see Materials and Methods). Using the cDNA array, 16 out of 17 definitely regulated transcripts were correctly identified as regulated using the selected algorithm (see Materials and Methods). Using the oligonucleotide array, 14 out of 17 definitely regulated genes were correctly identified using Microarray Suite 4.0, and 16 out of 17 were correctly identified using Microarray Suite 5.0 (see Materials and Methods). Interestingly, the transcripts that were not identified as regulated by the cDNA array (scl) and by the oligonucleotide array with Microarray Suite 5.0 analysis (gamma-actin) differed. In order to determine the false-positive rate of either platform, we determined whether definitely unregulated genes determined by QRTPCR assays (see Materials and Methods) were incorrectly identified as regulated. Both experimental platforms were remarkably specific. No definitely unregulated transcript (0/10) was falsely identified as regulated by analysis of the data from either oligonucleotide or cDNA arrays.
Bias of array fold-change measurements
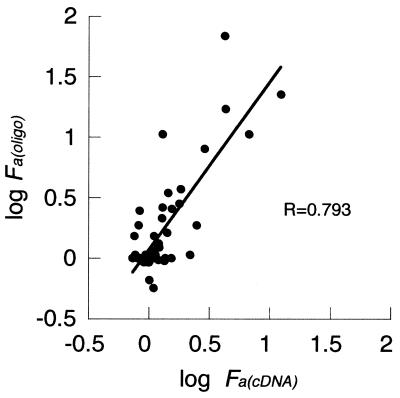
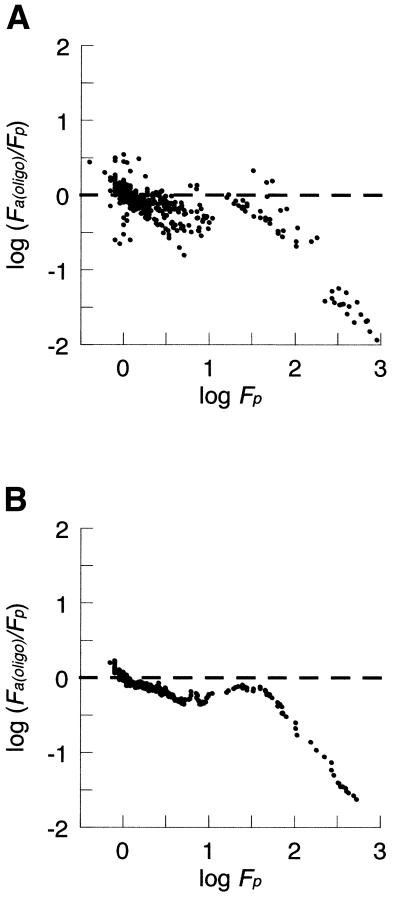
In addition to identifying regulated genes, microarrays provide an assessment of the degree of regulation. Both microarray platforms gave comparable results in determining the rank-order of gene regulation in these experiments (see Supplementary Material). However, the fold-changes obtained with each microarray platform for the regulated genes showed only a modest correlation (Fig. 5). We investigated the measurement bias of microarray data, i.e. whether the measurements are systematically distorted. In order to test for bias of the array measurements, we examined the log of the fold-change values obtained for each gene by microarray and by QRTPCR, log(Fa/Fp). In an unbiased assay, these ratios should distribute about unity and their log transform about 0. However, both oligonucleotide arrays (Fig. 6A and B) and cDNA arrays (Fig. 7A) show a marked tendency to underestimate the fold-change ratios of the underlying mRNAs, as determined by QRTPCR. The data are presented as a moving average in Figures 6B and 7A so that overall trends are more apparent. The data presented from the oligonucleotide array were analyzed using the statistics-based Microarray Suite 5.0. The data were also analyzed using the empirical Microarray Suite 4.0 and a similar bias was observed (see Supplementary Material Table S2). The degree of bias (δ) was quantified (see Materials and Methods) and found to be –0.159 for the oligonucleotide array (Microarray Suite 5.0), –0.130 (Microarray Suite 4.0) and –0.181 for the cDNA array.
Figure 5.
Correlation of fold-change measurements determined by oligonucleotide and cDNA microarrays. Comparison of the log transform fold-change values (Fa) for 47 genes determined by oligonucleotide array with Microarray Suite 5.0 versus those determined by cDNA array. The data represent assays in both microarray platforms from the same control (C3) and experimental (E3) samples.
Figure 6.
Bias of oligonucleotide microarray data. (A) The ratios obtained by oligonucleotide arrays using Microarray Suite 5.0 and by QRTPCR [log(Fa(oligo)/Fp)] are plotted against the ratio determined by QRTPCR (logFp). (B) The same data are plotted as a moving average with a window of 10 values. In this moving average, the mean of the first 10 [log(Fa(oligo)/Fp)] values are plotted as the first point, the mean of the 2–11 values as the second, and so forth. Unbiased data would show a balanced distribution about y = 0 (dashed line). Note the tendency for the Fa(oligo) values to underestimate the Fp values.
Microarray calibration
Although the oligonucleotide data is biased towards underestimating the relative mRNA changes, there is no simple pattern observed in the bias of individual transcripts. Various attempts at calibration failed to identify a satisfactory approach to improve data accuracy. Each oligonucleotide gene measurement is based on a large number of oligonucleotide hybridizations (see Fig. 2A) and the error of each measurement is somewhat idiosyncratic. We cannot identify a function that reliably predicts the degree of error for any given cluster.
In contrast, the bias observed with cDNA arrays showed a power scale increase with increasing fold change, causing a linear deviation of the log transformed data, as shown in Figure 7A. This observation suggests that a power law correction would improve data accuracy. We calculated a calibration factor for these data with an exponent of q = 1.88 and used it to generate corrected Fa(cDNA) ratios (see Materials and Methods). In order to determine whether the calibration affects measurement precision, we determined the median cv for the triplicate measurements of the 47 genes studied on each array. We find there is a slight increase in the variation of repeated measurements within each array following data correction. The median cv was 20.2% before calibration and 33.6% after correction. In contrast to this small decrease in precision, the accuracy of the data, in terms of bias, is greatly improved by calibration, from δ = –0.181 to δ = +0.007 (compare Fig. 7A and B). The regulation of genes altered >250-fold are still underestimated after calibration, which may reflect a saturation effect of the microarray assay. There appears to be a level of fold-change (Fp) above which no further increases in Fa(cDNA) values occur. Genes showing less extreme regulatory changes before calibration show little residual bias after correction (Fig. 7B).
We also explored whether a smaller number of genes assayed by QRTPCR could be utilized for calibration. Five regulated genes were selected at random and used to calculate the correction factor (q) as described in Materials and Methods. While the use of only five genes gave a considerably less accurate estimate of q, the calibration nonetheless improved cDNA array data accuracy, from an average bias of δ = –0.181 to δ = +0.112.
DISCUSSION
Many important issues of microarray technology have not been completely addressed, including the relative performance of the different microarray assay platforms, the limitations in the useful measurement range of the assays, and the relationship of the fold-change measurements in reference to quantitative assays. Our results demonstrate that both oligonucleotide and cDNA microarrays are reliable at identifying regulated genes. While the rank order of the gene regulations are comparable, the measurements of the degree of regulation shows a relatively poor correlation across platforms. Moreover, both platforms consistently underestimate the fold-change of regulated genes in comparison with the more quantitative real-time PCR assay. We also find that the bias of the cDNA data can be markedly reduced using a simple calibration algorithm.
The assessment of microarray measurement bias requires the comparison of the values obtained by microarray with those obtained using a defined measurement standard. We have used QRTPCR to generate the measurement standards. In order to validate QRTPCR measurements by determining reaction efficiencies, we have developed a new mathematical model for QRTPCR. The modeling was undertaken because we find that the common practice of determining reaction efficiency through template dilution is unreliable (T.Yuen and S.C.Sealfon, unpublished data). In the template dilution approach, reaction efficiencies are calculated from the slope of graph plotting CT against the log template dilution. However, this approach relies on the assumption that PCR reaction efficiency is unaffected by high starting concentration of DNA in the reaction, an assumption that we believe is not valid. Our conclusion is supported by studies utilizing template dilution that, surprisingly, show dilution graphs representing efficiencies exceeding 100% (16–18). The use of our model has the advantages of making it feasible to repeatedly determine efficiency for the same reaction, which improves the estimate of reaction efficiencies, and of generating reaction efficiency measurements that yield theoretically possible values.
The basis for the bias observed has not been determined in our experiments. Both microarray platforms tend to underestimate the level of change of the transcripts studied. This might arise from either overestimating the uninduced transcripts, perhaps due to non-specific hybridization, or underestimating the level of induction, perhaps due to probe saturation effects.
The cDNA microarray we utilized contains three replicate features for each cDNA, an aspect of the design that helps exclude artifacts from data analysis and facilitates the identification of regulated transcripts (5). However, for the purposes of determining bias, the triplicate features for each gene on each array were treated as independent measurements. Thus the assessment of cDNA microarray bias and the calibration function we have determined should be generally applicable to cDNA microarray design which usually contains only one feature for each cDNA. The variation of the correction factor with changes in experimental protocol is not yet known. However, the correction factor can be estimated in any experiment by measuring as few as five regulated genes using QRTPCR.
CONCLUSIONS
We find that both oligonucleotide and cDNA microarrays are sensitive and specific in identifying regulated transcripts. Our investigation reveals a measurement bias that underestimates the degree of gene regulation in data obtained by oligonucleotide and cDNA microarrays. As with any measurement approach, microarray measurements may be improved by calibration. The degree of bias observed for individual transcripts in data obtained with oligonucleotide arrays is unpredictable and not easily corrected. However, we have identified a simple calibration function that achieved a significant improvement in the accuracy of cDNA microarray data. Incorporating the calibration procedure we describe into cDNA microarray experiments will increase the accuracy and value of the resulting datasets.
SUPPLEMENTARY MATERIAL
Supplementary Material is available at NAR Online.
Acknowledgments
ACKNOWLEDGEMENTS
We thank Pamela Mellon for providing the LβT2 cells and Celia Gelernter Sealfon and Andreas Jenny for critical reading of the manuscript and helpful discussion. Supported by NIH grants RO1 DK46943, PO1 DA12923 and a Howard Hughes Medical Institute award.
REFERENCES
- 1.Golub T.R., Slonim,D.K., Tamayo,P., Huard,C., Gaasenbeek,M., Mesirov,J.P., Coller,H., Loh,M.L., Downing,J.R., Caligiuri,M.A., Bloomfield,C.D. and Lander,E.S. (1999) Molecular classification of cancer: class discovery and class prediction by gene expression monitoring. Science, 286, 531–537. [DOI] [PubMed] [Google Scholar]
- 2.Alizadeh A.A., Eisen,M.B., Davis,R.E., Ma,C., Lossos,I.S., Rosenwald,A., Boldrick,J.C., Sabet,H., Tran,T., Yu,X., Powell,J.I., Yang,L., Marti,G.E., Moore,T., Hudson,J.,Jr, Lu,L., Lewis,D.B., Tibshirani,R., Sherlock,G., Chan,W.C., Greiner,T.C., Weisenburger,D.D., Armitage,J.O., Warnke,R. and Staudt,L.M. (2000) Distinct types of diffuse large B-cell lymphoma identified by gene expression profiling. Nature, 403, 503–511. [DOI] [PubMed] [Google Scholar]
- 3.Lashkari D.A., DeRisi,J.L., McCusker,J.H., Namath,A.F., Gentile,C., Hwang,S.Y., Brown,P.O. and Davis,R.W. (1997) Yeast microarrays for genome wide parallel genetic and gene expression analysis. Proc. Natl Acad. Sci. USA, 94, 13057–13062. [DOI] [PMC free article] [PubMed] [Google Scholar]
- 4.Iyer V.R., Eisen,M.B., Ross,D.T., Schuler,G., Moore,T., Lee,J.C.F., Trent,J.M., Staudt,L.M., Hudson,J.,Jr, Boguski,M.S., Lashkari,D., Shalon,D., Botstein,D. and Brown,P.O. (1999) The transcriptional program in the response of human fibroblasts to serum. Science, 283, 83–87. [DOI] [PubMed] [Google Scholar]
- 5.Wurmbach E., Yuen,T., Ebersole,B.J. and Sealfon,S.C. (2001) Gonadotropin releasing hormone receptor-coupled gene network organization. J. Biol. Chem., 276, 47195–47201. [DOI] [PubMed] [Google Scholar]
- 6.Brown P.O. and Botstein,D. (1999) Exploring the new world of the genome with DNA microarrays. Nature Genet., 21, 33–37. [DOI] [PubMed] [Google Scholar]
- 7.Lipshutz R.J., Fodor,S.P., Gingeras,T.R. and Lockhart,D.J. (1999) High density synthetic oligonucleotide arrays. Nature Genet., 21, 20–24. [DOI] [PubMed] [Google Scholar]
- 8.Taniguchi M., Miura,K., Iwao,H. and Yamanaka,S. (2001) Quantitative assessment of DNA microarrays-comparison with northern blot analyses. Genomics, 71, 34–39. [DOI] [PubMed] [Google Scholar]
- 9.Yue H., Eastman,P.S., Wang,B.B., Minor,J., Doctolero,M.H., Nuttall,R.L., Stack,R., Becker,J.W., Montgomery,J.R., Vainer,M. and Johnston,R. (2001) An evaluation of the performance of cDNA microarrays for detecting changes in global mRNA expression. Nucleic Acids Res., 29, e41. [DOI] [PMC free article] [PubMed] [Google Scholar]
- 10.Freeman W.M., Walker,S.J. and Vrana,K.E. (1999) Quantitative RT-PCR: pitfalls and potential. Biotechniques, 26, 112–122, 124–125. [DOI] [PubMed] [Google Scholar]
- 11.Walker N.J. (2001) Real-time and quantitative PCR: applications to mechanism-based toxicology. J. Biochem. Mol. Toxicol., 15, 121–127. [DOI] [PubMed] [Google Scholar]
- 12.Chomczynski P. and Sacchi,N. (1987) Single-step method of RNA isolation by acid guanidinium thiocyanate-phenol-chloroform extraction. Anal. Biochem., 162, 156–159. [DOI] [PubMed] [Google Scholar]
- 13.Tanaka T.S., Jaradat,S.A., Lim,M.K., Kargul,G.J., Wang,X., Grahovac,M.J., Pantano,S., Sano,Y., Piao,Y., Nagaraja,R., Doi,H., Wood,W.H.,III, Becker,K.G. and Ko,M.S. (2000) Genome-wide expression profiling of mid-gestation placenta and embryo using a 15,000 mouse developmental cDNA microarray. Proc. Natl Acad. Sci. USA, 97, 9127–9132. [DOI] [PMC free article] [PubMed] [Google Scholar]
- 14.Venables W.N. and Ripley,B.D. (1999) Modern Applied Statistics with S-PLUS, 3rd Edn. Statistics and Computing, Springer, New York, NY.
- 15.Yuen T., Ebersole,B.J., Zhang,W. and Sealfon,S.C. (2001) Monitoring G-protein-coupled receptor signaling with DNA microarrays and real-time PCR. Methods Enzymol., 345, 556–569. [DOI] [PubMed] [Google Scholar]
- 16.Overbergh L., Valckx,D., Waer,M. and Mathieu,C. (1999) Quantification of murine cytokine mRNAs using real time quantitative reverse transcriptase PCR. Cytokine, 11, 305–312. [DOI] [PubMed] [Google Scholar]
- 17.Bustin S.A. (2000) Absolute quantification of mRNA using real-time reverse transcription polymerase chain reaction assays. J. Mol. Endocrinol., 25, 169–193. [DOI] [PubMed] [Google Scholar]
- 18.Pfaffl M.W. (2001) A new mathematical model for relative quantification in real-time RT–PCR. Nucleic Acids Res., 29, e45. [DOI] [PMC free article] [PubMed] [Google Scholar]
Associated Data
This section collects any data citations, data availability statements, or supplementary materials included in this article.


