Abstract
Mammary epithelial cells, the only milk-producing cell type in the mammary gland, undergo dynamic proliferation and differentiation during pregnancy, culminating in lactation postpartum. The East FriEsian sheep ranks among the world’s most prolific dairy breeds, while the Sewa sheep, a unique dual-purpose breed autochthonous to the Qinghai-Tibet Plateau, exhibits significantly lower milk production. Employing tissue culture methods, we successfully established mammary epithelial cell lines from both breeds. Morphological assessment of mammary epithelial cells and immunofluorescence identification of Cytokeratin 7 and Cytokeratin 8 confirmed the epithelial identity of the isolated cells. Subsequent RNA-seq analysis of these in vitro epithelial cell lines revealed 1813 differentially expressed genes (DEGs). Among these, 1108 were significantly up-regulated and 705 were down-regulated in Sewa epithelial sheep cells compared to East FriEsian epithelial cells. KEGG enrichment analysis identified cellular processes, environmental information processing, human diseases, metabolism, and organismal systems as the primary functional categories associated with DEGs. Gene ontology (GO) terms annotation, categorized into molecular function, biological processes, and cellular component, yielded “binding and catalytic activity,” “molecular function regulator activity,” and “cellular process,” “biological regulation,” and “regulation of biological process” as the top three terms within each domain, respectively. Clusters of Orthologous Groups of proteins (KOG) classification further revealed that “signal transduction mechanisms” accounted for the largest proportion of DEGs among all KOG categories. Finally, based on these analyses, ATF3 and MPP7 were identified as promising candidate genes for regulating lactation.
Keywords: Mammary epithelial cell, RNA-seq, Lactation, Candidate gene
Introduction
Mammary epithelial cells (MECs), located in in the acini of the lobules, are the only cells in the udder that produce milk and are key cells in the lactation process [1, 2]. MECs, compared to other cell types, have complex pathways involved in milk synthesis [3–5]. MECs absorb nutrients such as fatty acids, amino acids, and glucose from the bloodstream via a variety of basolateral membrane transporters and channels [6–9]. These nutrients are subsequently used to synthesize milk proteins (casein and whey) and lactose [10]. Lactose is synthesized only in MEC, and this process is associated with the binding of galactosyltransferase to α-whey protein (a protein unique to milk) [11]. The synthesized milk protein and lactose are packaged in secretory vesicles and then released into the lumen of mammary alveolar duct by exocytosis [12, 13]. MEC also produces milk fat, which is produced from fatty acids in the blood or is synthesized de novo from medium-chain fatty acids in the endoplasmic reticulum of MECs [14]. Lipids are released into the cytoplasm in the form of small droplets and gradually increase through repeated fusion [15]. Large lipid droplets are eventually enveloped by the apical plasma membrane and released into the mammary alveolar lumen as milk fat globules via apocrine secretion [16].
High-throughput whole transcriptome sequencing (RNA-Seq) [17], which has a wide dynamic range compared to microarray analysis, enables thorough quantification of the sample transcripts studied, as well as sequencing depth and coverage, providing structural information including alternative splicing forms and transcriptome single nucleotide polymorphisms [18]. RNA-Seq has been applied to study lactating mammary gland tissue in multiple species in recent years [19–24]. Understanding the transcriptomic changes in lactating mammary epithelial cells allows for the identification of genes associated with lactation, and physiological and metabolic changes occurring in mammary epithelial cells. Additionally, in dairy cows, understanding the transcripts expressed in lactating mammary cells can enhance the understanding of genes for dairy traits, such as milk yield and composition, milk processing characteristics, and lactation persistence [23].
The aim of this study was to understand the molecular basis of milk yield and composition differences between EF and Sewa sheep. Six healthy animals (three SWS and three EFS) were selected for the experiment. SWS are a high-altitude breed indigenous to the Qinghai-Tibet Plateau, known for their resilience to extreme environments. EFS are a world-renowned dairy breed from Germany, with a long lactation period and high milk production [25]. This study provides insights into the molecular basis of the differences in milk production between these two sheep breeds and could update breeding strategies for improved milk production in SWS.
Method and material
Animals and sampling
This study used Sewa sheep sourced from the Bangor County Sonaqiurimpo Animal Husbandry Professional Cooperative as the experimental subjects, and East FriEsian sheep procured from Shenmu City Sheep Breeding Farm as the control group. This study was approved by the Experimental Animal Ethics Committee of Southwest University of Science and Technology. Six unrelated sheep (three SWS and three EFS) grazing freely were selected, based on descriptions and methods from relevant research manuscript [26]. All the experimental animals were purchased from the two places mentioned earlier. The chosen ewes all delivered their lambs within the third to fifth litters. On the 50th day post-lambing, all sheep were slaughtered, and four mammary gland parenchyma tissue samples were collected from each animal. The tissue samples were rinsed in phosphate-buffered saline containing 1% penicillin-streptomycin until the rinse solution was clear. The collected mammary gland parenchima tissue was vitrified and stored at -80 °C for subsequent experimental use.
MECs culture
The mammary gland tissue samples frozen at -80 °C were thawed in a 37 °C water bath and then rinsed repeatedly with PBS on a biosafety cabinet (BSC, Jinan Xinbeisi Biotechnology Co., Ltd, BSC-1100 II A2-X) and trimmed away as much non-acinar tissue as possible. The processed tissue samples were transferred to a sterile Petri dish and cut into 1 mm³ pieces with scissors. The tissue pieces were inoculated into 60 mm petri dishes using tweezers, placing 15–20 pieces in each dish with a 5 mm spacing between each piece. The culture dishes were incubated in a 37 °C, 5% CO2 incubator for 3 h to allow the tissue blocks to adhere to the bottom of the dish. Then, 3 mL of complete culture medium, the ingredients are details in Table 1, were added to each dish and was changed regularly every 3 days. When cells were observed migrating out from around the tissue blocks, then the medium was changed every 2 days.
Table 1.
Complete culture medium ingredient list
| Component | Content | Company |
|---|---|---|
| DMEM/F12 | / | cytiva |
| Fetal Bovine Serum | 10% | ExCell Bio |
| Bovine Insulin | 5 mg/L | Solarbio |
| Hydrocortisone | 5 mg/L | Solarbio |
| Progesterone | 1 µg/L | Solarbio |
| Epidermal Growth Factor | 1 µg/L | Solarbio |
| Penicillin-Streptomycin | 1% | Solarbio |
The cell growth after every 2 days was monitored and the observations were recorded. Once the cell density was reached to 75–85%, the culture medium was discarded, the cells were rinsed twice with PBS, and 0.05% trypsin-0.02% EDTA was added at 37 °C. The cells were digested for 1–2 min and were observed under a microscope. Fibroblasts are more sensitive to trypsin than epithelial cells, so they were detached from the bottom of the dish first. Once the fibroblasts were detached, the digestion solution was discarded. 1 mL of 0.25% trypsin was added and continued the digestion for 3–5 min, or until the cells became round. The complete culture medium was added to terminate digestion. The cell suspension was transferred to a biosafety cabinet and gentle pipetting was performed repeatedly to ensure that all adherent cells was detached. The cell suspension was collected in a centrifuge tube, centrifuged at 1000 rpm for 5 min, and then precipitate was collected. The sediment in complete culture medium was resuspended and then transferred to new culture dishes to continue culturing. The purification process was repeated for 2–3 generations to eliminate most fibroblasts and to obtain relatively pure mammary epithelial cells. The enhanced CCK-8 kit (Sparkjade, Shandong, China) was implemented to assess cell viability at the 8th generation.
MECs identification
A sterile circular glass coverslip (diameter: 20 mm) was positioned within a 12-well plate. Purified mammary epithelial cells were then seeded onto the coverslip to generate a mammary epithelial cell monolayer. Upon complete cell adherence and spreading, the culture medium was aspirated and the coverslip was washed twice with PBS. Subsequently, 1 mL of 4% paraformaldehyde fixative was added to each well, and the cells were fixed for 30 min. The fixed cell coverslips were transferred to a staining dish and washed three times with PBS for 5 min per wash. Next, a membrane-permeabilization solution was applied to cover the cells and incubated at room temperature for 10 min. The coverslips were then washed three times with PBS for 5 min per wash, followed by the addition of bovine serum-blocking solution for 20 min at room temperature. The blocking solution was gently shaken off, and the primary antibody (diluted 1:200) was applied dropwise to the cell coverslip. The coverslips were then incubated flat in a humidified chamber at 4 °C overnight. The following day, the coverslips were washed three times with PBS for 5 min per wash. Secondary antibody was applied dropwise and incubated at 37 °C for 30 min, followed by three washes with PBS for 5 min per wash. DAPI was applied dropwise and incubated at room temperature for 10 min, followed by three washes with PBS for 5 min per wash. Finally, the coverslips were mounted with an anti-fade mounting medium for fluorescence microscopy analysis.
RNA extraction
The RNA extraction method was performed following the protocol outlined in the instruction manual of the RNAprep Pure Cell/Bacteria Kit (TIANGEN BIOTECH CO., LTD, Beijing, China). Three plates each of Sewa sheep and East FriEsian sheep cells were utilized for RNA extraction. The process involved several steps, including cell quantification, cell lysis, filtration, ethanol addition, and several centrifugation steps to isolate the RNA. Subsequently, DNase I treatment was carried out to remove any contaminating DNA, followed by a series of washes and a final elution step to obtain the RNA solution. The RNA solutions were then stored at -80 °C.The described RNA extraction method is a crucial step in obtaining high-quality RNA for downstream applications. It is essential to follow a standardized and meticulous protocol to ensure the integrity and purity of the extracted RNA, which is fundamental for accurate and reliable experimental results. The protocol used shares similarities with various RNA extraction methods, such as the use of lysis buffers, centrifugation, and purification steps, which are common in RNA extraction procedures.
RNA sequencing
We monitored RNA degradation and contamination by running the samples on 1% agarose gels. We checked the RNA purity using the NanoPhotometer spectrophotometer (IMPLEN, CA, USA), and measured the RNA concentration using the QubitR RNA Assay Kit in QubitR 2.0 Fluorometer (Life Technologies, CA, USA). Additionally, we assessed the RNA integrity using the RNA Nano 6000 Assay Kit of the Bioanalyzer 2100 system (Agilent Technologies, CA, USA). For the RNA sample preparations, we used a total amount of l µg RNA per sample as input material. The sequencing libraries were generated using the NEBNextRUltraTMRNA Library Prep Kit for llumina (NEB, USA) following the manufacturer’s recommendations, and index codes were added to attribute sequences to each sample. The process involved various steps such as mRNA purification, fragmentation, cDNA synthesis, and PCR. Finally, the prepared libraries were sequenced on an Illumina platform, and 150 bp paired-end reads were generated after cluster generation. The original fatsq files for the RNA-seq library are publicly available in the Sequence Read Archive (SRA) under accession number PRJNA1054237. The data can be accessed directly at the following link: https://dataview.ncbi.nlm.nih.gov/object/PRJNA1054237?reviewer=iqncm7q32celp8qkl011frelvt.
RNA-Seq data analysis
We used fastp to filter the original data, primarily to remove reads with adapters. Additionally, we removed paired-end reads in the following cases: when the N content in any sequencing read exceeded 10% of the base number, and when the number of low-quality (Q < = 20) bases exceeded 50% of the read bases. All subsequent analyses were based on the clean reads. We then downloaded the reference genome and its annotation files from the designated website, used HISAT 2.2.1 to construct the index, and compared the clean reads to the reference genome [27]. For new gene prediction, we used StringTie 2.1.5, which applies network streaming algorithms and optional de novo to splice transcripts. Compared with Cufflinks and other software, StringTie can splice a completer and more accurate transcript, and the splicing speed is faster. We used feature counts to calculate the gene alignment and then calculated the FPKM of each gene based on the gene length. FPKM is currently the commonly used method to estimate gene expression levels.
DESeq2 1.22.1 was used to analyze the differential expression between the two groups, and the P-value was corrected using the Benjamini & Hochberg method. The corrected P-value and |log2foldchange| were used as the threshold for significant differences in expression. The enrichment analysis was performed based on the hypergeometric test [28]. For KEGG, the hypergeometric distribution test was performed with the unit of the pathway [29]; for GO, it was performed based on the GO terms. We used rMATS 4.1.2 to analyze variable splicing events, including five alternative splicing events: skipped exon (SE), retained intron (RI), mutually exclusive exons (MXE), alternative 5’ splice site (A5SS), and alternative 3’ splice site (A3SS) [30]. GATK 4.1.9.0 was used to analyze the variant sites, and annovar was used to annotate the variant sites [31]. The protein interaction analysis of the differentially expressed genes (DEGs) was based on the STRING database of known and predicted protein-protein interactions. For the species existing in the database, we constructed the network by extracting the target gene list from the database; otherwise, we used blasty to compare the target gene sequence with the selected reference protein sequence, and then according to the selected reference species, we knew the interaction to build a network. We used GSEA for gene set enrichment analysis and WGCNA for weighted gene co-expression network analysis [32, 33].
Protein-protein interaction network analysis
The STRING protein interaction database (http://string-db.org) was utilized to analyze the differential gene protein interaction network. Initially, we employed DIAMOND to align the sequences in the target gene set with the protein sequences of the reference species (or closely related species) available in the STRING database. Based on these alignment results, we derived the protein interaction relationships.
qPCR validation of RNA-Seq
To validate the accuracy of RNA-Seq gene expression data, we randomly selected 12 DEGs and performed quantitative reverse transcriptase PCR (qRT-PCR) analysis using the same RNA samples employed for sequencing. Following the Quantscript RT Kit protocol (TIANGEN BIOTECH CO., LTD, Beijing, China), we generated cDNA from the residual RNA. Primer sequences for each DEG were designed using Primer Premier 6.25 software and are detailed in Table 2. We then conducted SYBR Green assays with SYBR Green SuperReal PreMix Plus (TIANGEN BIOTECH CO., LTD, Beijing, China) on a CFX96 TouchTM real-time PCR detection system (Bio-Rad, Mnnich, Germany). Data were analyzed using the 2-ΔΔCt method, and Student’s t-tests was performed on the ΔΔCt values using Sigmaplot v.8 software to compare expression differences between SWS and EFS mammary epithelial cell samples.
Table 2.
DEGs primer sequences
| Gene | Sense Primer | Anti-sense Primer |
|---|---|---|
| VGF | GACGACGACGAAGAGATG | CGATGATGCTGACCACAT |
| ALDH1A1 | GCATAGTTCAGTGAGTGGTA | AACATCCTCCTTATCTCCTTC |
| IL33 | GTGTTGAGGACTTGATAGGA | GACCACCATCACCATCTG |
| NREP | GCTTTCTGTCTGGGTCTG | ATCCTTCTTGCGGTTCAC |
| TGFBR3 | TCCTTCTTCAGCCGACTT | GTAACAGACACCTCCACATA |
| ETS2 | CCTGCCAGTCATTCATCA | GCTTCTCGTAGTTCATCTTG |
| CCN5 | CTCCTCTGTCTCCTCTCCAAG | AGCAGTTGCAGCCATCCA |
| RARB | TTACACTTGTCACCGAGATA | GGCTCCTTCTTCTTCTTGT |
| LTBP1 | TGTCACCAAGCAGGAATG | TTCACCATCAACGCCATAA |
| DPT | GTCGCTACAGCAAGAGAT | ACAGTCATAGTCAGTCATCC |
| SBSPON | ACCAGGAACACAGAGGAT | TCACCAGAACAACGAAGG |
| DES | CCATCGCAGCCAAGAATA | AATCTCGCAGGTGTAGGA |
Results
Histomorphometric analysis of mammary epithelial cells
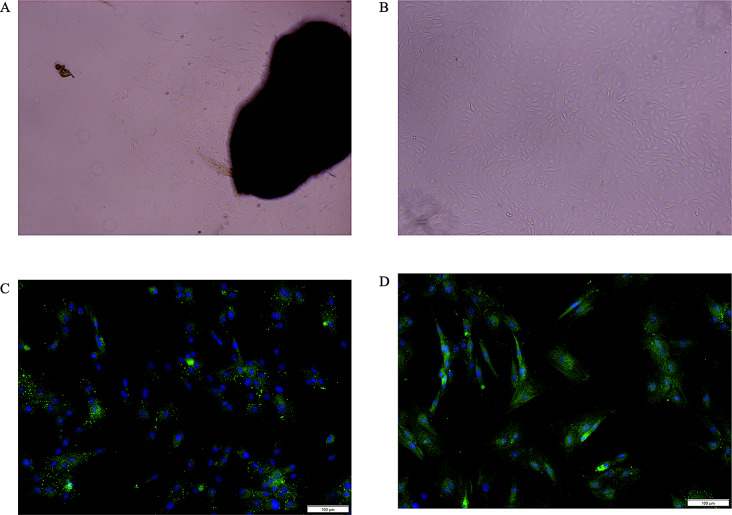
The first step is to observe the microscopic morphology of the mammary epithelial cells under a microscope [34]. We found that Sewa sheep mammary gland epithelial cells form tightly packed, single-layered sheets with an oval or irregular shape, resembling cobblestones laid in a pavement (Fig. 1A and B). Cytokeratin 7 (CK7) and cytokeratin 8 (CK8) are common markers for identifying and characterizing the type and status of epithelial cells [35]. CK8, typically found in simple epithelial tissues like liver, pancreas, kidney, and breast, is often used in immunohistochemistry to identify epithelial cells in these tissues [36]. We observed positive immunofluorescence for CK8 in our samples (Fig. 1C). Similarly, CK7 immunofluorescence, expressed in various epithelial tissues like breast, lung, ovary, and pancreas, is also used in immunohistochemistry for identification. In our study, CK7 immunofluorescence was also positive (Fig. 1D). Based on these observations, we can confidently conclude that we successfully isolated and cultured mammary epithelial cells from SWS. Isolated SWS cells growth curve followed an “S” shape (Fig. 2).
Fig. 1.
Morphology and identification of Sewa sheep mammary epithelial cells. (A) Primary epithelial cells extend from the tissue mass. (B) Sewa sheep mammary epithelial cells exhibit an oval or irregular morphology, resembling a cobblestone pavement (100 x). (C) Immunofluorescence staining for CK8 reveals blue nuclei (DAPI) and green fluorescence indicative of CK8 expression in the cells. (D) Similarly, CK7 immunofluorescence labeling shows blue nuclei and green fluorescence corresponding to CK7 expression within the cells
Fig. 2.
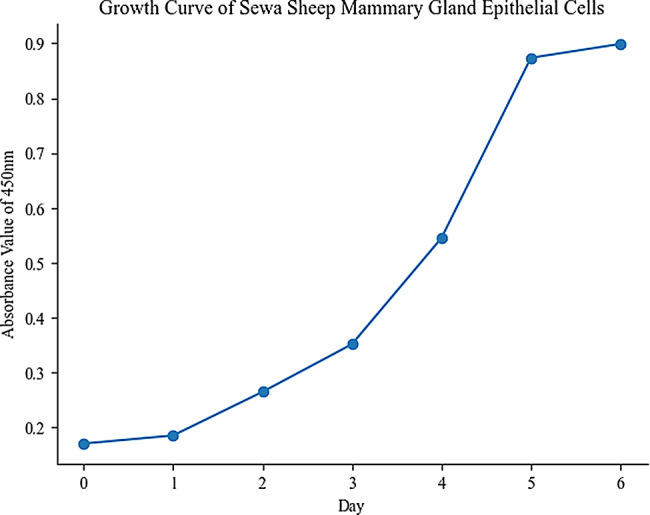
SWS mammary epithelial cells growth curve followed an “S” shape
Evaluation of RNA sequencing
Our study involved constructing cDNA libraries from six replicate mammary epithelial cell samples from both SWS and EFS sheep. All samples were successfully processed and used for sequencing. Following quality control, we generated a total of 48.54 GB of high-quality data (Clean Data), with each sample yielding approximately 7 GB. Notably, the Q30 base percentage, a measure of sequencing accuracy, exceeded 93% for all samples (Table 3). We then aligned the clean reads from each sample to the specified reference genome, achieving alignment efficiencies between 97.21% and 97.54% (Table 4). All subsequent sequence comparisons and analyses were performed using the designated Ovis Aries Rambouillet genome as a reference.
Table 3.
Sample sequencing clean reads data
| Sample | Raw Reads | Clean Reads | Clean Base(G) | Error Rate(%) | Q20(%) | Q30(%) | GC Content(%) |
|---|---|---|---|---|---|---|---|
| DongFuli-1 | 57,181,450 | 56,468,148 | 8.47 | 0.03 | 97.73 | 93.5 | 49.8 |
| DongFuli-2 | 60,185,352 | 59,454,802 | 8.92 | 0.03 | 97.68 | 93.46 | 49.98 |
| DongFuli-3 | 53,036,030 | 52,358,384 | 7.85 | 0.03 | 97.82 | 93.67 | 48.86 |
| sewa-1 | 51,469,666 | 50,824,402 | 7.62 | 0.03 | 97.64 | 93.3 | 49.77 |
| sewa-2 | 55,678,902 | 54,930,614 | 8.24 | 0.03 | 97.69 | 93.42 | 50.12 |
| sewa-3 | 50,171,540 | 49,612,252 | 7.44 | 0.03 | 97.67 | 93.29 | 49.63 |
Table 4.
Sequence comparison of sample sequencing data with selected reference genomes
| Sample | Total Reads | Reads mapped | Unique mapped | Multi mapped |
|---|---|---|---|---|
| DongFuli-1 | 59,454,802 | 55,078,570(97.54%) | 52,052,380(92.18%) | 3,026,190(5.36%) |
| DongFuli-2 | 59,454,802 | 57,795,286(97.21%) | 54,660,537(91.94%) | 3,134,749(5.27%) |
| DongFuli-3 | 52,358,384 | 51,044,042(97.49%) | 48,093,772(91.85%) | 2,950,270(5.63%) |
| sewa-1 | 50,824,402 | 49,486,401(97.37%) | 47,008,118(92.49%) | 2,478,283(4.88%) |
| sewa-2 | 54,930,614 | 53,517,426(97.43%) | 50,809,419(92.50%) | 2,708,007(4.93%) |
| sewa-3 | 49,612,252 | 48,323,880(97.40%) | 45,834,360(92.39%) | 2,489,520(5.02%) |
Quantitation of Gene expression
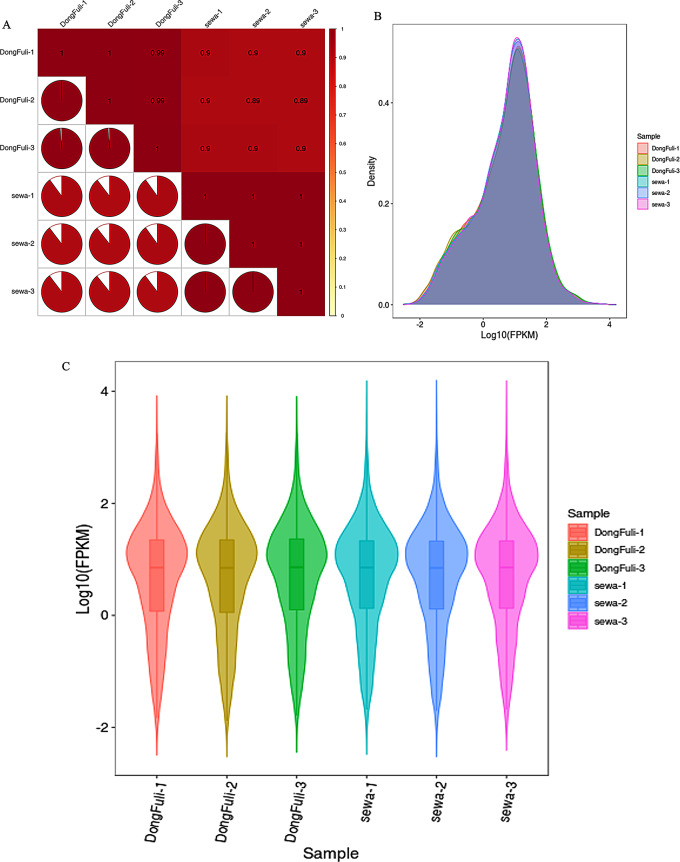
Gene expression quantification was performed by counting reads mapped to each gene’s genomic location in the reference genome. Read counts reflect the combined influence of sequencing depth, transcript length, and true expression level. To account for variation in sequencing depth, transcript length was normalized. Notably, transcriptome data offers high sensitivity for detecting gene expression, typically capturing protein-coding gene expression spanning six orders of magnitude (10− 2 to 104) in a single sample. Pearson’s correlation coefficient r was used as an evaluation index for the correlation between biological replicates. The closer the absolute value of r is to 1, the stronger the correlation between the replicate samples. The inter-sample correlation statistics, presented in Fig. 3A, indicate the overall similarity in expression levels between the samples. The density plot (Fig. 3B) further exemplifies this pattern, highlighting the concentration of gene abundance between 10− 2 and 104. Finally, the violin plot (Fig. 3C) effectively visualizes the distribution and probability density across multiple datasets, demonstrating a peak at Fragments Per Kilobase of transcript per Million fragments mapped (FPKM) 10.
Fig. 3.
Overview distribution of gene expression in RNA-seq data. (A) Sample correlation plot. The horizontal and vertical axes represent different samples. The color gradient of the pie charts indicates the Pearson correlation coefficient of gene expression between two samples. A redder color signifies a stronger positive correlation. (B) Density plot of gene expression. Each colored curve represents a different sample. The x-axis depicts the log10 FPKM values, and the y-axis shows the corresponding probability density. This plot highlights the frequency of genes at different expression levels within each sample. (C) Violin plot of gene expression. The x-axis represents the log10 FPKM values, and each violin, colored according to the sample, depicts the distribution of gene expression levels with its width reflecting the number of genes at each level. This visual emphasizes both the central tendency and spread of gene expression within each sample
Differential expression (DE) analysis
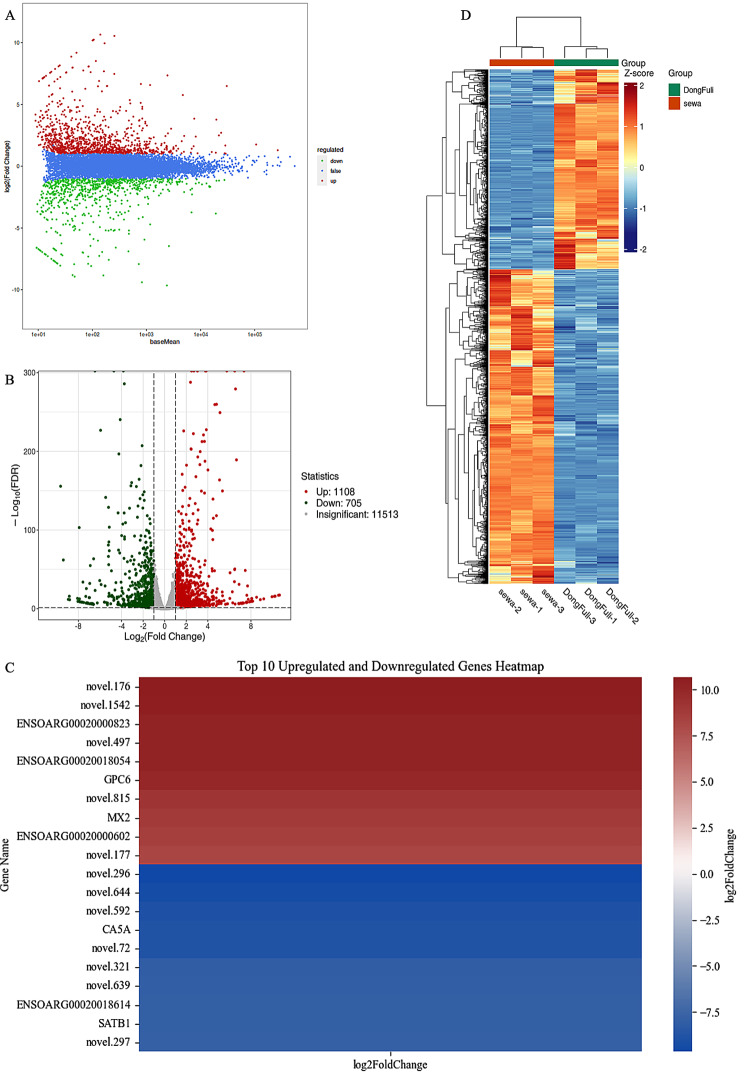
Differential expression analysis between the SWS and EFS mammary epithelial cell groups was conducted using DESeq2, employing a screening threshold of |log2Fold Change| ≥ 1 and FDR < 0.05. This analysis identified 1813 DEGs: 1108 up-regulated and 705 down-regulated. These findings are visually depicted in the MA plot (M-versus-A plot) (Fig. 4A) and volcano plot (Fig. 4B). Notably, the 20 genes exhibiting the most extreme fold changes are highlighted in the heatmap (Fig. 4C), revealing 10 up-regulated and down-regulated genes. Subsequent cluster analysis further corroborated these differentially expressed patterns, demonstrating distinct clusters of genes with high and low expression in each sample group (Fig. 4D).
Fig. 4.
Visualization of differentially expressed genes (DEGs). (A) MA plot, this scatter plot reveals DEGs based on their average expression levels across samples (x-axis) and log2 fold change (log2FC) values (y-axis). Red points represent up-regulated genes, green points represent down-regulated, and blue indicates genes with no significant difference. (B) Volcano plot, this visual highlight statistically significant differentially expressed genes. The x-axis shows the fold change in expression, and the y-axis indicates the adjusted p-value (significance level). Red and green dots denote up- and down-regulated genes, respectively, while gray dots represent genes with no significant difference. (C) Differential gene heatmap, the chart illustrates the top 20 DEGs, comprising 10 up-regulated and 10 down-regulated genes, based on log2 fold change (log2FC) values. The color variations represent the fold changes in gene expression. (D) Differential gene clustering heatmap, this heatmap displays the expression profiles of all DEGs across samples. The x-axis shows sample names and their hierarchical clustering relationships. The y-axis lists individual genes and their hierarchical clustering patterns. Red indicates high expression levels, and blue indicates low expression levels
KEGG enrichment analysis
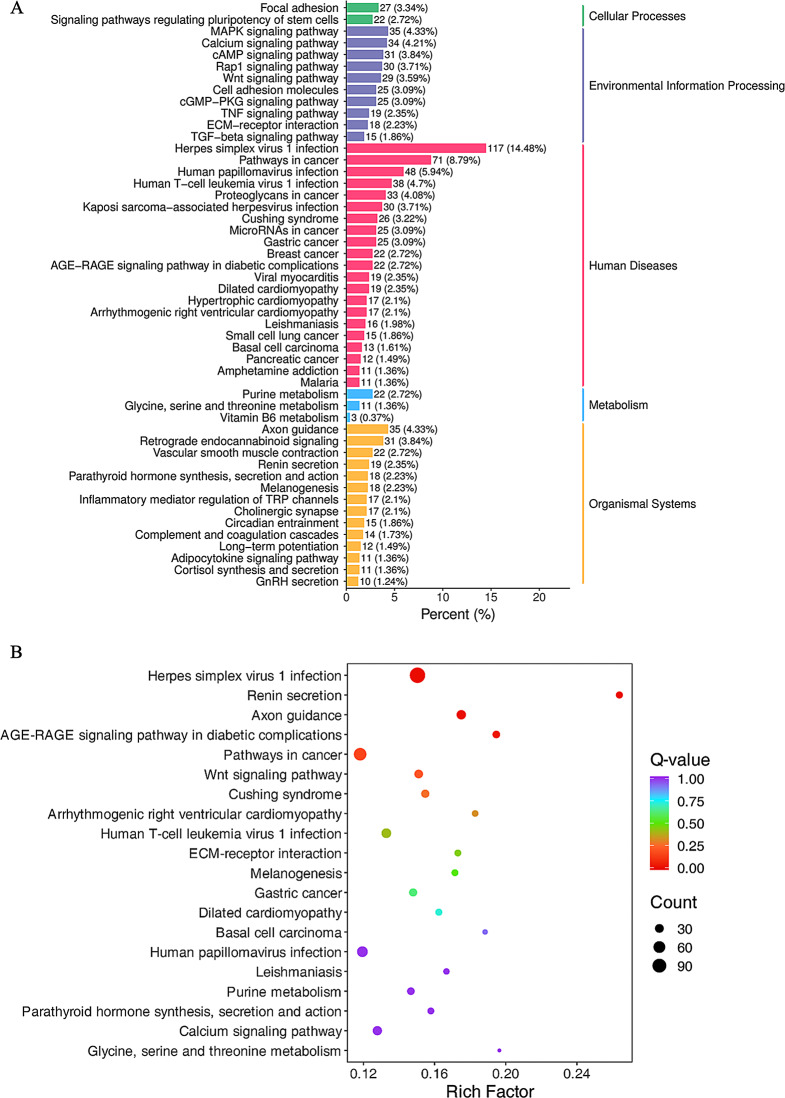
KEGG pathway analysis revealed enrichment in five major categories: Cellular Processes, Environmental Information Processing, Human Diseases, Metabolism, and Organismal Systems (Fig. 5A). Notably, several specific pathways exhibited significant enrichment, including Herpes simplex virus 1 infection, Renin secretion, Axon guidance, and the AGE-RAGE signaling pathway in diabetic complications (Fig. 5B).
Fig. 5.
KEGG pathway enrichment analysis. (A) Bar chart of enriched pathways, the x-axis shows the number of differentially expressed genes (DEGs) annotated to each KEGG pathway, and the y-axis displays the pathway names. The bar heights represent the number of DEGs mapped to each pathway, with numbers in brackets indicating the ratio of pathway annotated DEGs to the total number of DEGs. The labels on the far right represent the KEGG pathway classifications. (B) Enrichment scatter plot, the x-axis depicts Rich factor, with higher values indicating greater enrichment. The y-axis shows the KEGG pathways, and the size of each point corresponds to the number of DEGs enriched in that pathway. The point color reflects the enrichment significance, with redder signifying higher significance
Functional enrichment analysis of gene ontology (GO)
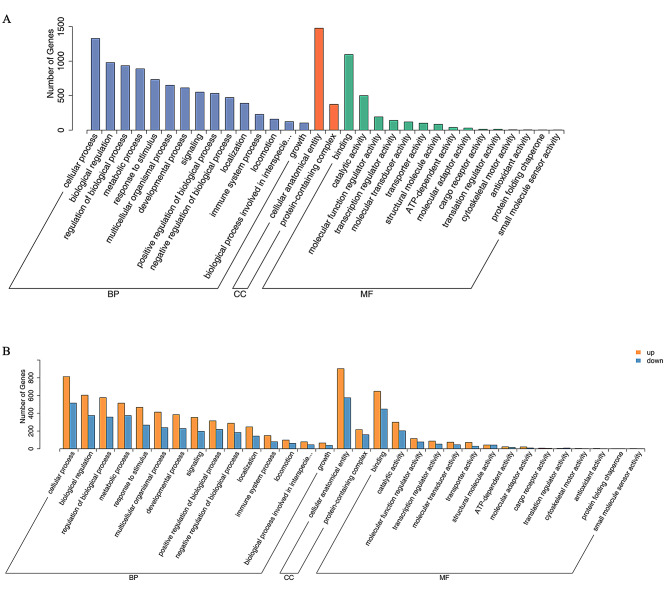
To understand the functional roles of DEGs in SWS and EFS mammary epithelial cells, we performed Gene Ontology (GO) enrichment analysis. This analysis focused on three categories: Molecular Function, Biological Process, and Cellular Component. We classified and counted DEGs annotated to the second level of GO terms and ranked them by gene count (highest to lowest). Strikingly, the top five Biological Process terms included cellular process, biological regulation, regulation of biological process, metabolic process, and response to stimulus (Fig. 6A). Similarly, the Cellular Component category highlighted cellular anatomical entity and protein-containing complex, while the top Molecular Function terms were included binding, catalytic activity, molecular function regulator activity, transcription regulator activity, and molecular transducer activity (Fig. 6A). Notably, further analysis of up- and down-regulated DEGs revealed consistent top 5 GO terms for each category, mirroring the overall enrichment results (Fig. 6B). These findings suggest that DEGs may be involved in key physiological functions, potentially including milk synthesis.
Fig. 6.
GO annotation analysis of DEGs. (A) GO classification histogram, this histogram presents the distribution of DEGs across various second-level GO terms (x-axis). The y-axis displays the number of DEGs associated with each term. (B) GO up- and down-regulation histogram, this histogram illustrates the differential expression patterns of DEGs within specific second-level GO terms (x-axis). The y-axis represents the number of DEGs in each term, with yellow bars indicating up-regulated genes and blue bars indicating down-regulated genes
Cluster of orthologous groups of proteins (COG) analysis
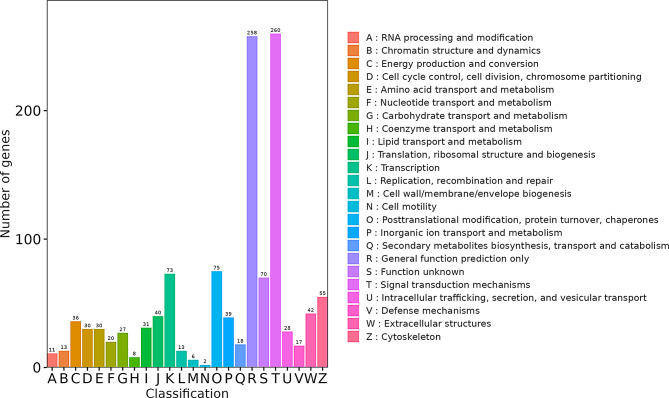
Clusters of Orthologous Groups of proteins (COGs) encompass two distinct databases: COG for prokaryotes and KOG for eukaryotes. These databases classify homologous proteins based on their evolutionary relationships and functional annotations [37]. In this study, we utilized KOG for annotation classification of our DEGs. The analysis revealed that DEGs fall into 24 distinct KOG clusters. Notably, the “signal transduction mechanisms” cluster harbors the largest number of DEGs, suggesting a potential key role in the observed differences between SWS and EFS mammary epithelial cells (Fig. 7).
Fig. 7.
KOG functional classification of DEGs. This bar chart visualizes the distribution of DEGs across various KOG functional categories. The x-axis displays the KOG ID codes, and the y-axis represents the number of DEGs associated with each category. Different colors differentiate between KOG classes, and the legend provides the KOG ID codes alongside their corresponding functional descriptions
Protein-protein interaction network
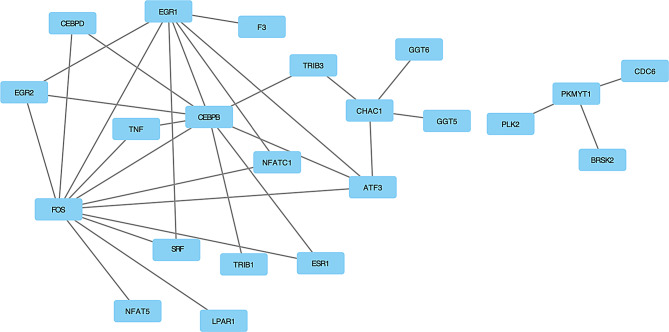
Using the STRING database, we constructed a protein-protein interaction (PPI) network for the differentially expressed genes. The network revealed several key hub gene ATF3. These findings highlight the potential central roles of ATF3 in the regulatory network associated with our experimental conditions (Fig. 8).
Fig. 8.
Protein-protein interaction network of the top differentially expressed genes, including ATF3, constructed using the STRING database. Nodes represent proteins
Quantitative real-time PCR (qPCR) validation
To validate the RNA-seq analysis, we conducted qPCR on 12 randomly selected DEGs: VGF, ALDH1A1, IL33, NREP, TGFBR3, ETS2, CCN5, RARB, LTBP1, DPT, SBSPON, and DES. Notably, the qPCR results displayed remarkable concordance with the RNA-seq data, as evidenced by the strong correlation observed between fold changes determined by both methods (Fig. 9).
Fig. 9.
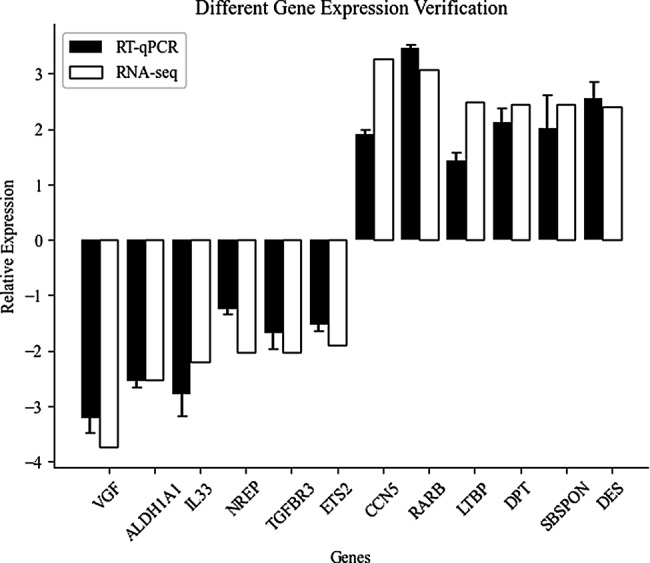
Validation of DEGs by RT-qPCR. This figure compares the relative expression levels of selected genes measured by both RNA-Seq and RT-qPCR. Values are presented as Log2 fold change (FC), representing the relative abundance of each gene transcript, with RT-qPCR data normalized to the expression level of the GAPDH gene. Error bars depict the standard deviation across three biological replicates per group
Discussion
The mammary gland is a vital organ for mammalian growth and development, ensuring offspring survival through lactation. Its basic structural unit is the mammary leaflet, consisting of epithelial cells surrounded by the basement membrane. Within each lobule lies an acinus, lined solely by epithelial cells responsible for milk production [38]. During gestation, these cells of female animals undergo extensive proliferation and differentiation to acquire lactation function postpartum [39, 40]. Studying the molecular mechanisms underlying mammary gland lactation relies heavily on in vitro culture models of mammary epithelial cells.
Several methods exist for their isolation, including tissue block, enzymatic digestion, mechanical disruption, and milk separation [41]. Enzymatic digestion, a popular method for its faster isolation and higher purity, is highly sensitive to enzyme type, concentration, and digestion time. Excessive dosages or prolonged digestion can significantly damage cell viability. Therefore, this study opted for the tissue method to culture Sewa sheep mammary epithelial cells. While this method exhibits slower initial migration, it yields cells with superior growth vitality and rapid adherence, proliferation, and division. Identification of purified mammary epithelial cells was achieved through a combination of morphological observation, growth curve analysis, and immunofluorescence staining. Isolated SWS cells displayed a characteristic strip-shaped or island-shaped appearance with collective growth, and their growth curve followed an “S” shape. While morphological observation offers a preliminary basis for cell identification, however, its inherent subjectivity can limit its reliability. To address this, we targeted specific protein expression in the cultured cells. Cytokeratin, key structural proteins of the epithelial cytoskeleton, possess strong and stable expression, making them ideal markers for epithelial cell identification [39]. Immunofluorescence staining confirmed positive expression of cytokeratin 7 and 8 in the cultured cells, providing definitive evidence of their mammary epithelial origin.
Goat milk, a valuable source of high-quality protein and economic prosperity in the dairy industry, and research on its lactation regulation is still scarce [42]. Understanding the intricate molecular mechanisms governing this process has become a leading research priority. RNA-seq technology has emerged as a powerful tool for unraveling mammary gland function, shedding light on complex transcriptional changes across lactation stages [41]. Xuan et al. [43] employed this technology to profile goat mammary gland transcriptomes at three non-lactation stages, identifying 1381 DEGs involved in cell growth, apoptosis, immunity, nutrient transport, and metabolism, showcasing their adaptive shifts to prepare for lactation. Similarly, Xia et al. [44] explored the yak mammary gland transcriptome throughout lactation, revealing genes like BTA3-28 as key players. Their functional analysis highlighted an orchestrated induction of lipid metabolism, potentially orchestrated by PPAR signaling, suggesting increased triglyceride synthesis during active milk production. However, studies comparing gene expression in SWS and EFS mammary glands remain scarce. Addressing this gap, our present study utilized RNA-seq to analyze Sewa and East FriEsian sheep mammary epithelial cells. With high-quality sequencing data (48.54 GB Clean Data, > 93% Q30 bases, 97.21–97.54% reference genome mapping), we identified 1813 DEGs: 1108 up-regulated and 705 down-regulated. Subsequent functional enrichment analysis using databases like GO, KEGG, KOG revealed significant functional annotations for these DEGs.
Among the significantly up-regulated DEGs in SWS epithelial cells, those encoding proteins like glypican 6 (GPC6), inositol polyphosphate-5-phosphatase D (INPP5D), and membrane palmitoylated proteins 7 and 2 (MPP7/2) hint at potential roles in cell proliferation, division, apoptosis, and establishing epithelial cell polarity. Conversely, down-regulated DEGs in SWS epithelial cell, linked to hormone regulatory pathways and lipid metabolism, suggest the involvement of proteins like estrogen-related receptor gamma (ESRRG), growth regulating estrogen receptor binding 1 (GREB1), phospholipid phosphatase related 5 (PLPP5), estrogen receptor 1 (ESR1), activating transcription factor 3 (ATF3), and MAF bZIP transcription factor F (MAFF) in these processes.
ATF3, a transcription factor activated under stress, plays a significant role in regulating both metabolic and immune processes [45–49]. This member of the ATF/cAMP response element binding family binds to the cyclic AMP response element (CRE) in promoters through the consensus sequence TGACGTCA [50, 51]. ATF3 can also interact with proteins through its basic leucine zipper (bZIP) domain, affecting cellular functions independent of its transcriptional activity [52, 53]. Notably, ATF3 involvement in glucose metabolism extends across various organs and tissues, including the pancreas, liver, adipose tissue, hypothalamus, and heart [54–57].
Favre et al. (2011) demonstrated that reduced inducible cAMP early repressor protein in white adipose tissue (WAT) triggers increased CREB activity in obese animals, leading to elevated ATF3 expression and decreased Glut4 and adiponectin levels [58]. Interestingly, ATF3 expression is upregulated in human breast cancer [59], and Wang et al. (2008)’s transgenic mice expressing ATF3 in basal epithelial cells developed epidermal hyperplasia, oral cancer, and breast cancer [60]. Yin et al.‘s study revealed that TGFβ upregulates ATF3, and in turn, ATF3 promotes TGFβ gene expression in breast cancer cells, forming a positive feedback loop [61]. Additionally, Sabin et al. (2022)’s work suggests that ATF3 can indirectly or directly regulate low-density lipoprotein receptor (LDLR) by inhibiting MAFF expression [62]. In agreement with our RNA-Seq analysis, SWS mammary epithelial cells exhibited significantly upregulated ATF3 and downregulated MAFF expression. These findings raise the possibility that ATF3 regulates LDLR expression in mammary epithelial cells through MAFF, potentially impacting milk fat synthesis.
Cell polarity plays a crucial role in tumor progression and development, with disruptions in associated proteins driving epithelial disorganization, uncontrolled cell division, and ultimately, tumorigenesis [63]. Membrane-associated guanylate kinases (MAGUKs) are a crucial family of scaffolding proteins regulating cell adhesion, junctions, and polarity [64–66]. Within this family, the membrane palmitoylated protein (MPP) subfamily stands out for its specific involvement in cell polarity and adhesion [67].
Recent research has shed light on the intriguing role of MPPs in cancer. MPP2, for instance, has been shown to modulate the activity of the proto-oncogene c-Src [68]. Similarly, MPP3 has been implicated in enhanced liver migration and invasion of cancer cells [69]. Furthermore, inhibiting MPP6 can reverse the antitumor activity of Saa3-deficient cancer-associated fibroblasts [70]. Notably, MPP7, a known regulator of cell polarity and tight junctions [64], is believed by New et al. [71] to suppress pancreatic ductal adenocarcinoma (PDAC) cell survival through autophagy induction. Moreover, Liao et al. [72] demonstrated elevated MPP7 expression in breast cancer patients compared to healthy individuals, with MPP7 promoting cancer cell metastasis by regulating epithelial-mesenchymal transition (EMT) and activating EGFR/AKT signaling. Intriguingly, our RNA-seq results reveal a significant upregulation of MPP7 expression in Sewa sheep mammary epithelial cells. This suggests that MPP7 may not only contribute to establishing epithelial cell polarity, but also potentially promote their maturation and consequently influence lactation production.
Overall, this transcriptome sequencing analysis reveals that ATF 3 and MPP 7 may be key regulators of lactation. Building on the findings from the current transcriptomic analysis, future studies will focus on validating the biological significance of the differentially expressed genes (DEGs) identified. Specifically, we plan to conduct functional assays to further explore their roles in mammary epithelial cell behavior and mammary gland development. These assays will include: proliferation and differentiation, Migration, response to stimuli. These future studies will not only provide a deeper understanding of the genes identified in this transcriptomic analysis but also contribute to potential therapeutic strategies for enhancing mammary gland function and lactation.
Conclusion
This study successfully established primary mammary epithelial cell lines from both SWS and EFS using the tissue culture method. Subsequent RNA-seq analysis of these lines identified a total of 1813 DEGs: 1108 up-regulated and 705 down-regulated. Functional enrichment analysis within this DEG set yielded ATF3 and MPP7 as promising candidates for regulating lactation processes.
Acknowledgements
The support is gratefully acknowledged. The authors thank the researchers in our lab for their dedication and hard work. We would also like to thank all those who helped us with this paper.
Author contributions
R.L. was responsible for writing and revising the first draft and was involved in sample collection and experimental processing. J.P., C.P., and K.S. were responsible for Conceptualization of experiments. J.L., Z.Z., Q.Z, W.Z, and H.Q were responsible for project data processing and thesis revision. Y.S, T.S., and W.Z. were responsible for project management and fund preparation. All authors have read and agreed to the final manuscript.
Funding
This work was supported by National Natural Science Foundation of China (32260824) and local project guided by the Central Government of Tibet Autonomous Region (XZ202201YD0007C).
Data availability
The original fatsq files for the RNA-seq library are publicly available in the Sequence Read Archive (SRA) under accession number PRJNA1054237. The data can be accessed directly at the following link: https://dataview.ncbi.nlm.nih.gov/object/PRJNA1054237?reviewer=iqncm7q32celp8qkl011frelvt.
Declarations
Ethics approval and consent to participate
The whole study was approved by the Experimental Animal Ethics Committee of Southwest University of Science and Technology, and all studies involving animals were carried out in compliance with the Southwest University of Science and Technology. All methods have been reported in accordance with the applicable ARRIVE guidelines for the reporting of animal experiments. The Ethical number is L2022014. We obtained informed consent from the owner to using the animals.
Consent for publication
Not applicable.
Competing interests
The authors declare no competing interests.
Footnotes
Publisher’s note
Springer Nature remains neutral with regard to jurisdictional claims in published maps and institutional affiliations.
Rui Li and Junru Pan contributed equally to this work.
Contributor Information
Tianzeng Song, Email: songtianzeng123@sina.com.
Wangsheng Zhao, Email: wangshengzhao01@163.com.
References
- 1.Brisken C, Rajaram RD. Alveolar and lactogenic differentiation. J Mammary Gland Biol Neoplasia. 2006;11(3–4):239–48. [DOI] [PubMed] [Google Scholar]
- 2.Richert MM, Schwertfeger KL, Ryder JW, Anderson SM. An atlas of mouse mammary gland development. J Mammary Gland Biol Neoplasia. 2000;5(2):227–41. [DOI] [PubMed] [Google Scholar]
- 3.Anderson SM, Rudolph MC, McManaman JL, Neville MC. Key stages in mammary gland development. Secretory activation in the mammary gland: it’s not just about milk protein synthesis! Breast Cancer Res. 2007;9(1):204. [DOI] [PMC free article] [PubMed] [Google Scholar]
- 4.Burgoyne RD, Duncan JS. Secretion of milk proteins. J Mammary Gland Biol Neoplasia. 1998;3(3):275–86. [DOI] [PubMed] [Google Scholar]
- 5.Truchet S, Honvo-Houéto E. Physiology of milk secretion. Best Pract Res Clin Endocrinol Metab. 2017;31(4):367–84. [DOI] [PubMed] [Google Scholar]
- 6.Mobasheri A, Kendall BH, Maxwell JE, Sawran AV, German AJ, Marples D, Luck MR, Royal MD. Cellular localization of aquaporins along the secretory pathway of the lactating bovine mammary gland: an immunohistochemical study. Acta Histochem. 2011;113(2):137–49. [DOI] [PubMed] [Google Scholar]
- 7.Patel OV, Casey T, Plaut K. Profiling solute-carrier transporters in key metabolic tissues during the postpartum evolution of mammary epithelial cells from nonsecretory to secretory. Physiol Genomics. 2019;51(11):539–52. [DOI] [PubMed] [Google Scholar]
- 8.Zhao FQ. Biology of glucose transport in the mammary gland. J Mammary Gland Biol Neoplasia. 2014;19(1):3–17. [DOI] [PubMed] [Google Scholar]
- 9.Shennan DB. Mammary gland membrane transport systems. J Mammary Gland Biol Neoplasia. 1998;3(3):247–58. [DOI] [PubMed] [Google Scholar]
- 10.Clermont Y, Xia L, Rambourg A, Turner JD, Hermo L. Transport of casein submicelles and formation of secretion granules in the golgi apparatus of epithelial cells of the lactating mammary gland of the rat. Anat Rec. 1993;235(3):363–73. [DOI] [PubMed] [Google Scholar]
- 11.Ramakrishnan B, Boeggeman E, Qasba PK. Beta-1,4-galactosyltransferase and lactose synthase: molecular mechanical devices. Biochem Biophys Res Commun. 2002;291(5):1113–8. [DOI] [PubMed] [Google Scholar]
- 12.McManaman JL, Neville MC. Mammary physiology and milk secretion. Adv Drug Deliv Rev. 2003;55(5):629–41. [DOI] [PubMed] [Google Scholar]
- 13.Truchet S, Chat S, Ollivier-Bousquet M. Milk secretion: the role of SNARE proteins. J Mammary Gland Biol Neoplasia. 2014;19(1):119–30. [DOI] [PubMed] [Google Scholar]
- 14.Argov-Argaman N. Symposium review: milk fat globule size: practical implications and metabolic regulation. J Dairy Sci. 2019;102(3):2783–95. [DOI] [PubMed] [Google Scholar]
- 15.Chong BM, Reigan P, Mayle-Combs KD, Orlicky DJ, McManaman JL. Determinants of adipophilin function in milk lipid formation and secretion. Trends Endocrinol Metab. 2011;22(6):211–7. [DOI] [PMC free article] [PubMed] [Google Scholar]
- 16.Kobayashi K. Culture models to investigate mechanisms of milk production and blood-milk barrier in mammary epithelial cells: a review and a protocol. J Mammary Gland Biol Neoplasia. 2023;28(1):8. [DOI] [PMC free article] [PubMed] [Google Scholar]
- 17.Marioni JC, Mason CE, Mane SM, Stephens M, Gilad Y. RNA-seq: an assessment of technical reproducibility and comparison with gene expression arrays. Genome Res. 2008;18(9):1509–17. [DOI] [PMC free article] [PubMed] [Google Scholar]
- 18.Wickramasinghe S, Cánovas A, Rincón G, Medrano JF. RNA-Sequencing: a tool to explore new frontiers in animal genetics. Livest Sci. 2014;166:206–16. [Google Scholar]
- 19.Paten AM, Duncan EJ, Pain SJ, Peterson SW, Kenyon PR, Blair HT, Dearden PK. Functional development of the adult ovine mammary gland–insights from gene expression profiling. BMC Genomics. 2015;16:748. [DOI] [PMC free article] [PubMed] [Google Scholar]
- 20.Lemay DG, Ballard OA, Hughes MA, Morrow AL, Horseman ND, Nommsen-Rivers LA. RNA sequencing of the human milk fat layer transcriptome reveals distinct gene expression profiles at three stages of lactation. PLoS ONE. 2013;8(7):e67531. [DOI] [PMC free article] [PubMed] [Google Scholar]
- 21.Paten AM, Duncan EJ, Pain SJ, Peterson SW, Kenyon PR, Blair HT, Dearden PK. Functional development of the adult ovine mammary gland–insights from gene expression profiling. BMC Genomics. 2015;16:1471–2164. (Electronic)):748. [DOI] [PMC free article] [PubMed] [Google Scholar]
- 22.Lin J, Bao ZK, Zhang Q, Hu WW, Yu QH, Yang Q. Transcriptome analysis of the mammary gland from GH transgenic goats during involution. Gene. 2015;565(2):228–34. [DOI] [PubMed] [Google Scholar]
- 23.Wickramasinghe S, Rincon G, Islas-Trejo A, Medrano JF. Transcriptional profiling of bovine milk using RNA sequencing. BMC Genomics. 2012;13(Electronic):1471–2164. [DOI] [PMC free article] [PubMed] [Google Scholar]
- 24.Lemay DG, Hovey RC, Hartono SR, Hinde K, Smilowitz JT, Ventimiglia F, Schmidt KA, Lee JW, Islas-Trejo A, Silva PI, et al. Sequencing the transcriptome of milk production: milk trumps mammary tissue. BMC Genomics. 2013;14:1471–2164. (Electronic)):872. [DOI] [PMC free article] [PubMed] [Google Scholar]
- 25.Li X, Yuan L, Wang W, Zhang D, Zhao Y, Chen J, Xu D, Zhao L, Li F, Zhang X. Whole genome re-sequencing reveals artificial and natural selection for milk traits in East Friesian sheep. Front Vet Sci. 2022;9:1034211. [DOI] [PMC free article] [PubMed] [Google Scholar]
- 26.Suárez-Vega A, Gutiérrez-Gil B, Klopp C, Robert-Granie C, Tosser-Klopp G, Arranz JJ. Characterization and comparative analysis of the milk transcriptome in two dairy Sheep breeds using RNA sequencing. Sci Rep. 2015;5:18399. [DOI] [PMC free article] [PubMed] [Google Scholar]
- 27.Kim D, Langmead B, Salzberg SL. HISAT: a fast spliced aligner with low memory requirements. Nat Methods. 2015;12(4):357–60. [DOI] [PMC free article] [PubMed] [Google Scholar]
- 28.Varet H, Brillet-Guéguen L, Coppée J-Y, Dillies M-A. SARTools: a DESeq2- and EdgeR-Based R Pipeline for Comprehensive Differential Analysis of RNA-Seq Data. PLoS ONE. 2016;11(6):e0157022. [DOI] [PMC free article] [PubMed] [Google Scholar]
- 29.Kanehisa M, Araki M, Goto S, Hattori M, Hirakawa M, Itoh M, Katayama T, Kawashima S, Okuda S, Tokimatsu T, et al. KEGG for linking genomes to life and the environment. Nucleic Acids Res. 2008;36(suppl1):D480–4. [DOI] [PMC free article] [PubMed] [Google Scholar]
- 30.Shen S, Park JW, Lu ZX, Lin L, Henry MD, Wu YN, Zhou Q, Xing Y. rMATS: robust and flexible detection of differential alternative splicing from replicate RNA-Seq data. Proc Natl Acad Sci U S A. 2014;111(51):E5593–5601. [DOI] [PMC free article] [PubMed] [Google Scholar]
- 31.Wang K, Li M, Hakonarson H. ANNOVAR: functional annotation of genetic variants from high-throughput sequencing data. Nucleic Acids Res. 2010;38(16):e164. [DOI] [PMC free article] [PubMed] [Google Scholar]
- 32.Wang K, Li M, Hakonarson H. ANNOVAR: functional annotation of genetic variants from high-throughput sequencing data. Nucleic Acids Res. 2010;38(16):e164–164. [DOI] [PMC free article] [PubMed] [Google Scholar]
- 33.Chen S, Zhou Y, Chen Y, Gu J. Fastp: an ultra-fast all-in-one FASTQ preprocessor. Bioinformatics. 2018;34(17):i884–90. [DOI] [PMC free article] [PubMed] [Google Scholar]
- 34.Stampfer MR, Yaswen P. Culture models of human mammary epithelial cell transformation. J Mammary Gland Biol Neoplasia. 2000;5(4):365–78. [DOI] [PubMed] [Google Scholar]
- 35.Jedrzejczak M, Szatkowska I. Bovine mammary epithelial cell cultures for the study of mammary gland functions. Vitro Cell Dev Biol Anim. 2014;50(5):389–98. [DOI] [PMC free article] [PubMed] [Google Scholar]
- 36.Bonilla-Díaz A, Ordóñez-Morán P. Differentiated epithelial cells of the gut. Methods Mol Biol. 2023;2650:3–16. [DOI] [PubMed] [Google Scholar]
- 37.Tatusov RL, Galperin MY, Natale DA, Koonin EV. The COG database: a tool for genome-scale analysis of protein functions and evolution. Nucleic Acids Res. 2000;28(1):33–6. [DOI] [PMC free article] [PubMed] [Google Scholar]
- 38.Biswas SK, Banerjee S, Baker GW, Kuo CY, Chowdhury I. The mammary gland: Basic structure and Molecular Signaling during Development. Int J Mol Sci 2022, 23(7). [DOI] [PMC free article] [PubMed]
- 39.Slepicka PF, Somasundara AVH, Dos Santos CO. The molecular basis of mammary gland development and epithelial differentiation. Semin Cell Dev Biol. 2021;114:93–112. [DOI] [PMC free article] [PubMed] [Google Scholar]
- 40.Aikawa S, Yuan J, Dewar A, Sun X, Dey SK. Scribble promotes alveologenesis in the pregnant mammary gland for milk production. Reproduction. 2020;159(6):719–31. [DOI] [PMC free article] [PubMed] [Google Scholar]
- 41.Boutinaud M, Herve L, Lollivier V. Mammary epithelial cells isolated from milk are a valuable, non-invasive source of mammary transcripts. Front Genet. 2015;6:323. [DOI] [PMC free article] [PubMed] [Google Scholar]
- 42.Al-Saadi QHAL, Al-Rikabi JS, Altemimi AKJ, Hesarinejad AB, Abedelmaksoud MA. Exploring the health benefits and functional properties of goat milk proteins. Food Sci Nutr. 2023;11(10):5641–56. [DOI] [PMC free article] [PubMed] [Google Scholar]
- 43.Xuan R, Chao T, Zhao X, Wang A, Chu Y, Li Q, Zhao Y, Ji Z, Wang J. Transcriptome profiling of the nonlactating mammary glands of dairy goats reveals the molecular genetic mechanism of mammary cell remodeling. J Dairy Sci. 2022;105(6):5238–60. [DOI] [PubMed] [Google Scholar]
- 44.Xia W, Liu Y, Loor JJ, Bionaz M, Jiang M. Dynamic Profile of the Yak Mammary Transcriptome during the Lactation cycle. Anim (Basel) 2023, 13(10). [DOI] [PMC free article] [PubMed]
- 45.Xu Y, Li Y, Jadhav K, Pan X, Zhu Y, Hu S, Chen S, Chen L, Tang Y, Wang HH, et al. Hepatocyte ATF3 protects against atherosclerosis by regulating HDL and bile acid metabolism. Nat Metab. 2021;3(1):59–74. [DOI] [PMC free article] [PubMed] [Google Scholar]
- 46.Ku HC, Cheng CF. Master Regulator activating transcription factor 3 (ATF3) in metabolic homeostasis and Cancer. Front Endocrinol (Lausanne). 2020;11:556. [DOI] [PMC free article] [PubMed] [Google Scholar]
- 47.Jadhav K, Zhang Y. Activating transcription factor 3 in immune response and metabolic regulation. Liver Res. 2017;1(2):96–102. [DOI] [PMC free article] [PubMed] [Google Scholar]
- 48.Zmuda EJ, Qi L, Zhu MX, Mirmira RG, Montminy MR, Hai T. The roles of ATF3, an adaptive-response gene, in high-fat-diet-induced diabetes and pancreatic beta-cell dysfunction. Mol Endocrinol. 2010;24(7):1423–33. [DOI] [PMC free article] [PubMed] [Google Scholar]
- 49.Gilchrist M, Thorsson V, Li B, Rust AG, Korb M, Roach JC, Kennedy K, Hai T, Bolouri H, Aderem A. Systems biology approaches identify ATF3 as a negative regulator of toll-like receptor 4. Nature. 2006;441(7090):173–8. [DOI] [PubMed] [Google Scholar]
- 50.Montminy MR, Bilezikjian LM. Binding of a nuclear protein to the cyclic-AMP response element of the somatostatin gene. Nature. 1987;328(6126):175–8. [DOI] [PubMed] [Google Scholar]
- 51.Deutsch PJ, Hoeffler JP, Jameson JL, Lin JC, Habener JF. Structural determinants for transcriptional activation by cAMP-responsive DNA elements. J Biol Chem. 1988;263(34):18466–72. [PubMed] [Google Scholar]
- 52.Wu X, Nguyen BC, Dziunycz P, Chang S, Brooks Y, Lefort K, Hofbauer GF, Dotto GP. Opposing roles for calcineurin and ATF3 in squamous skin cancer. Nature. 2010;465(7296):368–72. [DOI] [PMC free article] [PubMed] [Google Scholar]
- 53.Hai TW, Liu F, Coukos WJ, Green MR. Transcription factor ATF cDNA clones: an extensive family of leucine zipper proteins able to selectively form DNA-binding heterodimers. Genes Dev. 1989;3(12b):2083–90. [DOI] [PubMed] [Google Scholar]
- 54.Li D, Yin X, Zmuda EJ, Wolford CC, Dong X, White MF, Hai T. The repression of IRS2 gene by ATF3, a stress-inducible gene, contributes to pancreatic beta-cell apoptosis. Diabetes. 2008;57(3):635–44. [DOI] [PubMed] [Google Scholar]
- 55.Hartman MG, Lu D, Kim ML, Kociba GJ, Shukri T, Buteau J, Wang X, Frankel WL, Guttridge D, Prentki M, et al. Role for activating transcription factor 3 in stress-induced beta-cell apoptosis. Mol Cell Biol. 2004;24(13):5721–32. [DOI] [PMC free article] [PubMed] [Google Scholar]
- 56.Wang J, Webb G, Cao Y, Steiner DF. Contrasting patterns of expression of transcription factors in pancreatic alpha and beta cells. Proc Natl Acad Sci U S A. 2003;100(22):12660–5. [DOI] [PMC free article] [PubMed] [Google Scholar]
- 57.Wang J, Cao Y, Steiner DF. Regulation of proglucagon transcription by activated transcription factor (ATF) 3 and a novel isoform, ATF3b, through the cAMP-response element/ATF site of the proglucagon gene promoter. J Biol Chem. 2003;278(35):32899–904. [DOI] [PubMed] [Google Scholar]
- 58.Favre D, Le Gouill E, Fahmi D, Verdumo C, Chinetti-Gbaguidi G, Staels B, Caiazzo R, Pattou F, Lê KA, Tappy L, et al. Impaired expression of the inducible cAMP early repressor accounts for sustained adipose CREB activity in obesity. Diabetes. 2011;60(12):3169–74. [DOI] [PMC free article] [PubMed] [Google Scholar]
- 59.Yin X, Dewille JW, Hai T. A potential dichotomous role of ATF3, an adaptive-response gene, in cancer development. Oncogene. 2008;27(15):2118–27. [DOI] [PubMed] [Google Scholar]
- 60.Wang A, Arantes S, Yan L, Kiguchi K, McArthur MJ, Sahin A, Thames HD, Aldaz CM, Macleod MC. The transcription factor ATF3 acts as an oncogene in mouse mammary tumorigenesis. BMC Cancer. 2008;8:268. [DOI] [PMC free article] [PubMed] [Google Scholar]
- 61.Yin X, Wolford CC, Chang YS, McConoughey SJ, Ramsey SA, Aderem A, Hai T. ATF3, an adaptive-response gene, enhances TGF{beta} signaling and cancer-initiating cell features in breast cancer cells. J Cell Sci. 2010;123(Pt 20):3558–65. [DOI] [PMC free article] [PubMed] [Google Scholar]
- 62.Bauer S, Eigenmann J, Zhao Y, Fleig J, Hawe JS, Pan C, Bongiovanni D, Wengert S, Ma A, Lusis AJ et al. Identification of the transcription factor ATF3 as a Direct and Indirect Regulator of the LDLR. Metabolites 2022, 12(9). [DOI] [PMC free article] [PubMed]
- 63.Gandalovičová A, Vomastek T, Rosel D, Brábek J. Cell polarity signaling in the plasticity of cancer cell invasiveness. Oncotarget. 2016;7(18):25022–49. [DOI] [PMC free article] [PubMed] [Google Scholar]
- 64.Stucke VM, Timmerman E, Vandekerckhove J, Gevaert K, Hall A. The MAGUK protein MPP7 binds to the polarity protein hDlg1 and facilitates epithelial tight junction formation. Mol Biol Cell. 2007;18(5):1744–55. [DOI] [PMC free article] [PubMed] [Google Scholar]
- 65.Won S, Levy JM, Nicoll RA, Roche KW. MAGUKs: multifaceted synaptic organizers. Curr Opin Neurobiol. 2017;43:94–101. [DOI] [PMC free article] [PubMed] [Google Scholar]
- 66.Nourry C, Grant SG, Borg JP. PDZ domain proteins: plug and play! Sci STKE. 2003;2003(179):Re7. [DOI] [PubMed] [Google Scholar]
- 67.Liu J, Li J, Ren Y, Liu P. DLG5 in cell polarity maintenance and cancer development. Int J Biol Sci. 2014;10(5):543–9. [DOI] [PMC free article] [PubMed] [Google Scholar]
- 68.Baumgartner M, Weiss A, Fritzius T, Heinrich J, Moelling K. The PDZ protein MPP2 interacts with c-Src in epithelial cells. Exp Cell Res. 2009;315(17):2888–98. [DOI] [PubMed] [Google Scholar]
- 69.Ma H, Cai H, Zhang Y, Wu J, Liu X, Zuo J, Jiang W, Ji G, Zhang Y, Liu C, et al. Membrane palmitoylated protein 3 promotes hepatocellular carcinoma cell migration and invasion via up-regulating matrix metalloproteinase 1. Cancer Lett. 2014;344(1):74–81. [DOI] [PubMed] [Google Scholar]
- 70.Djurec M, Graña O, Lee A, Troulé K, Espinet E, Cabras L, Navas C, Blasco MT, Martín-Díaz L, Burdiel M, et al. Saa3 is a key mediator of the protumorigenic properties of cancer-associated fibroblasts in pancreatic tumors. Proc Natl Acad Sci U S A. 2018;115(6):E1147–56. [DOI] [PMC free article] [PubMed] [Google Scholar]
- 71.New M, Van Acker T, Sakamaki JI, Jiang M, Saunders RE, Long J, Wang VM, Behrens A, Cerveira J, Sudhakar P, et al. MDH1 and MPP7 regulate Autophagy in Pancreatic Ductal Adenocarcinoma. Cancer Res. 2019;79(8):1884–98. [DOI] [PMC free article] [PubMed] [Google Scholar]
- 72.Liao W, Fan L, Li M, Deng H, Yang A, Liu F. MPP7 promotes the migration and invasion of breast cancer cells via EGFR/AKT signaling. Cell Biol Int. 2021;45(5):948–56. [DOI] [PubMed] [Google Scholar]
Associated Data
This section collects any data citations, data availability statements, or supplementary materials included in this article.
Data Availability Statement
The original fatsq files for the RNA-seq library are publicly available in the Sequence Read Archive (SRA) under accession number PRJNA1054237. The data can be accessed directly at the following link: https://dataview.ncbi.nlm.nih.gov/object/PRJNA1054237?reviewer=iqncm7q32celp8qkl011frelvt.


