

Abstract
The licensing step of DNA double-strand break repair by homologous recombination entails resection of DNA ends to generate a single-stranded DNA template for assembly of the repair machinery consisting of the RAD51 recombinase and ancillary factors1. DNA end resection is mechanistically intricate and reliant on the tumour suppressor complex BRCA1–BARD1 (ref. 2). Specifically, three distinct nuclease entities—the 5′–3′ exonuclease EXO1 and heterodimeric complexes of the DNA endonuclease DNA2, with either the BLM or WRN helicase—act in synergy to execute the end resection process3. A major question concerns whether BRCA1–BARD1 directly regulates end resection. Here, using highly purified protein factors, we provide evidence that BRCA1–BARD1 physically interacts with EXO1, BLM and WRN. Importantly, with reconstituted biochemical systems and a single-molecule analytical tool, we show that BRCA1–BARD1 upregulates the activity of all three resection pathways. We also demonstrate that BRCA1 and BARD1 harbour stand-alone modules that contribute to the overall functionality of BRCA1–BARD1. Moreover, analysis of a BARD1 mutant impaired in DNA binding shows the importance of this BARD1 attribute in end resection, both in vitro and in cells. Thus, BRCA1–BARD1 enhances the efficiency of all three long-range DNA end resection pathways during homologous recombination in human cells.
Individuals with mutations in BRCA1 and BARD1 genes are predisposed to breast, ovarian and other cancers. The proteins encoded by these genes form an obligatory heterodimer that functions in homologous recombination (HR) responsible for DNA double-strand break (DSB) repair, replication fork repair and preservation of stressed replication forks against nucleolytic attrition2. Other biological functions, such as the resolution of pathogenic R-loop structures that arise during transcription or transcription-coupled processes, have also been ascribed to the BRCA1–BARD1 complex.
BRCA1–BARD1 is involved in multiple stages of HR4, including the nucleolytic processing of DNA break ends, a process referred to as DNA end resection, to generate a 3′-tailed, single-stranded DNA template for the assembly of a helical filament of the RAD51 recombinase capable of DNA homology search and strand invasion necessary for HR execution5,6. It has been proposed that the role of BRCA1–BARD1 in DNA end resection is to overcome restriction imposed by the 53BP1 axis of proteins on access by the resection machinery to DNA ends7. We have shown that BRCA1–BARD1 also interacts with, and enhances, the recombinase activity of RAD51 (ref. 8).
DNA end resection entails digestion of the 5′-terminated DNA strand and is a highly intricate, tightly controlled process. End resection is initiated via the endonucleolytic and 3′–5′ exonuclease activities of the MRE11–RAD50–NBS1 complex in conjunction with CtIP, to create a DNA gap proximal to break ends that serves as the entry point for the long-range resection machinery comprising three distinct nuclease entities, namely, the 5′–3′ exonuclease EXO1 and complexes of the DNA flap endonuclease DNA2 with either BLM or WRN, members of the RECQ helicase family9. Notably, mutations in BLM and WRN lead to the cancer-prone Bloom syndrome and the premature ageing Werner syndrome, respectively10,11. Even though BRCA1–BARD1 is clearly indispensable for the timely resection of DSB ends to facilitate the engagement of HR as a repair tool, whether it directly enhances the activity of the short-range resection machinery consisting of the MRE11–RAD50–NBS1 complex–CtIP and the long-range resection machinery comprising EXO1, BLM–DNA2 and WRN–DNA2 remains to be determined.
Here, making use of our DNA end resection systems reconstituted with highly purified factors, single-molecule DNA curtain analysis of DNA unwinding and end resection and cell-based resection and HR assays, we define the role of BRCA1–BARD1 in long-range DNA end resection. Specifically, we show that BRCA1–BARD1 directly interacts with, and robustly upregulates, the exonuclease activity of EXO1, the helicase activity of BLM and WRN and the efficiency of BLM/WRN–DNA2-mediated DNA end resection. Importantly, we provide evidence that BRCA1 and BARD1 harbour stand-alone functional modules that help ensure the overall efficacy of BRCA1–BARD1 as a positive regulator of DNA end resection. We also show that a mutation that ablates the DNA-binding activity of BARD1 adversely affects resection by BLM–DNA2 and EXO1 in vitro and, accordingly, engenders a strong resection defect in cells. Taken together, our results allow us to conclude that BRCA1–BARD1 serves a direct, versatile role in DNA end resection in human cells.
BRCA1–BARD1 stimulates BLM–DNA2 activity
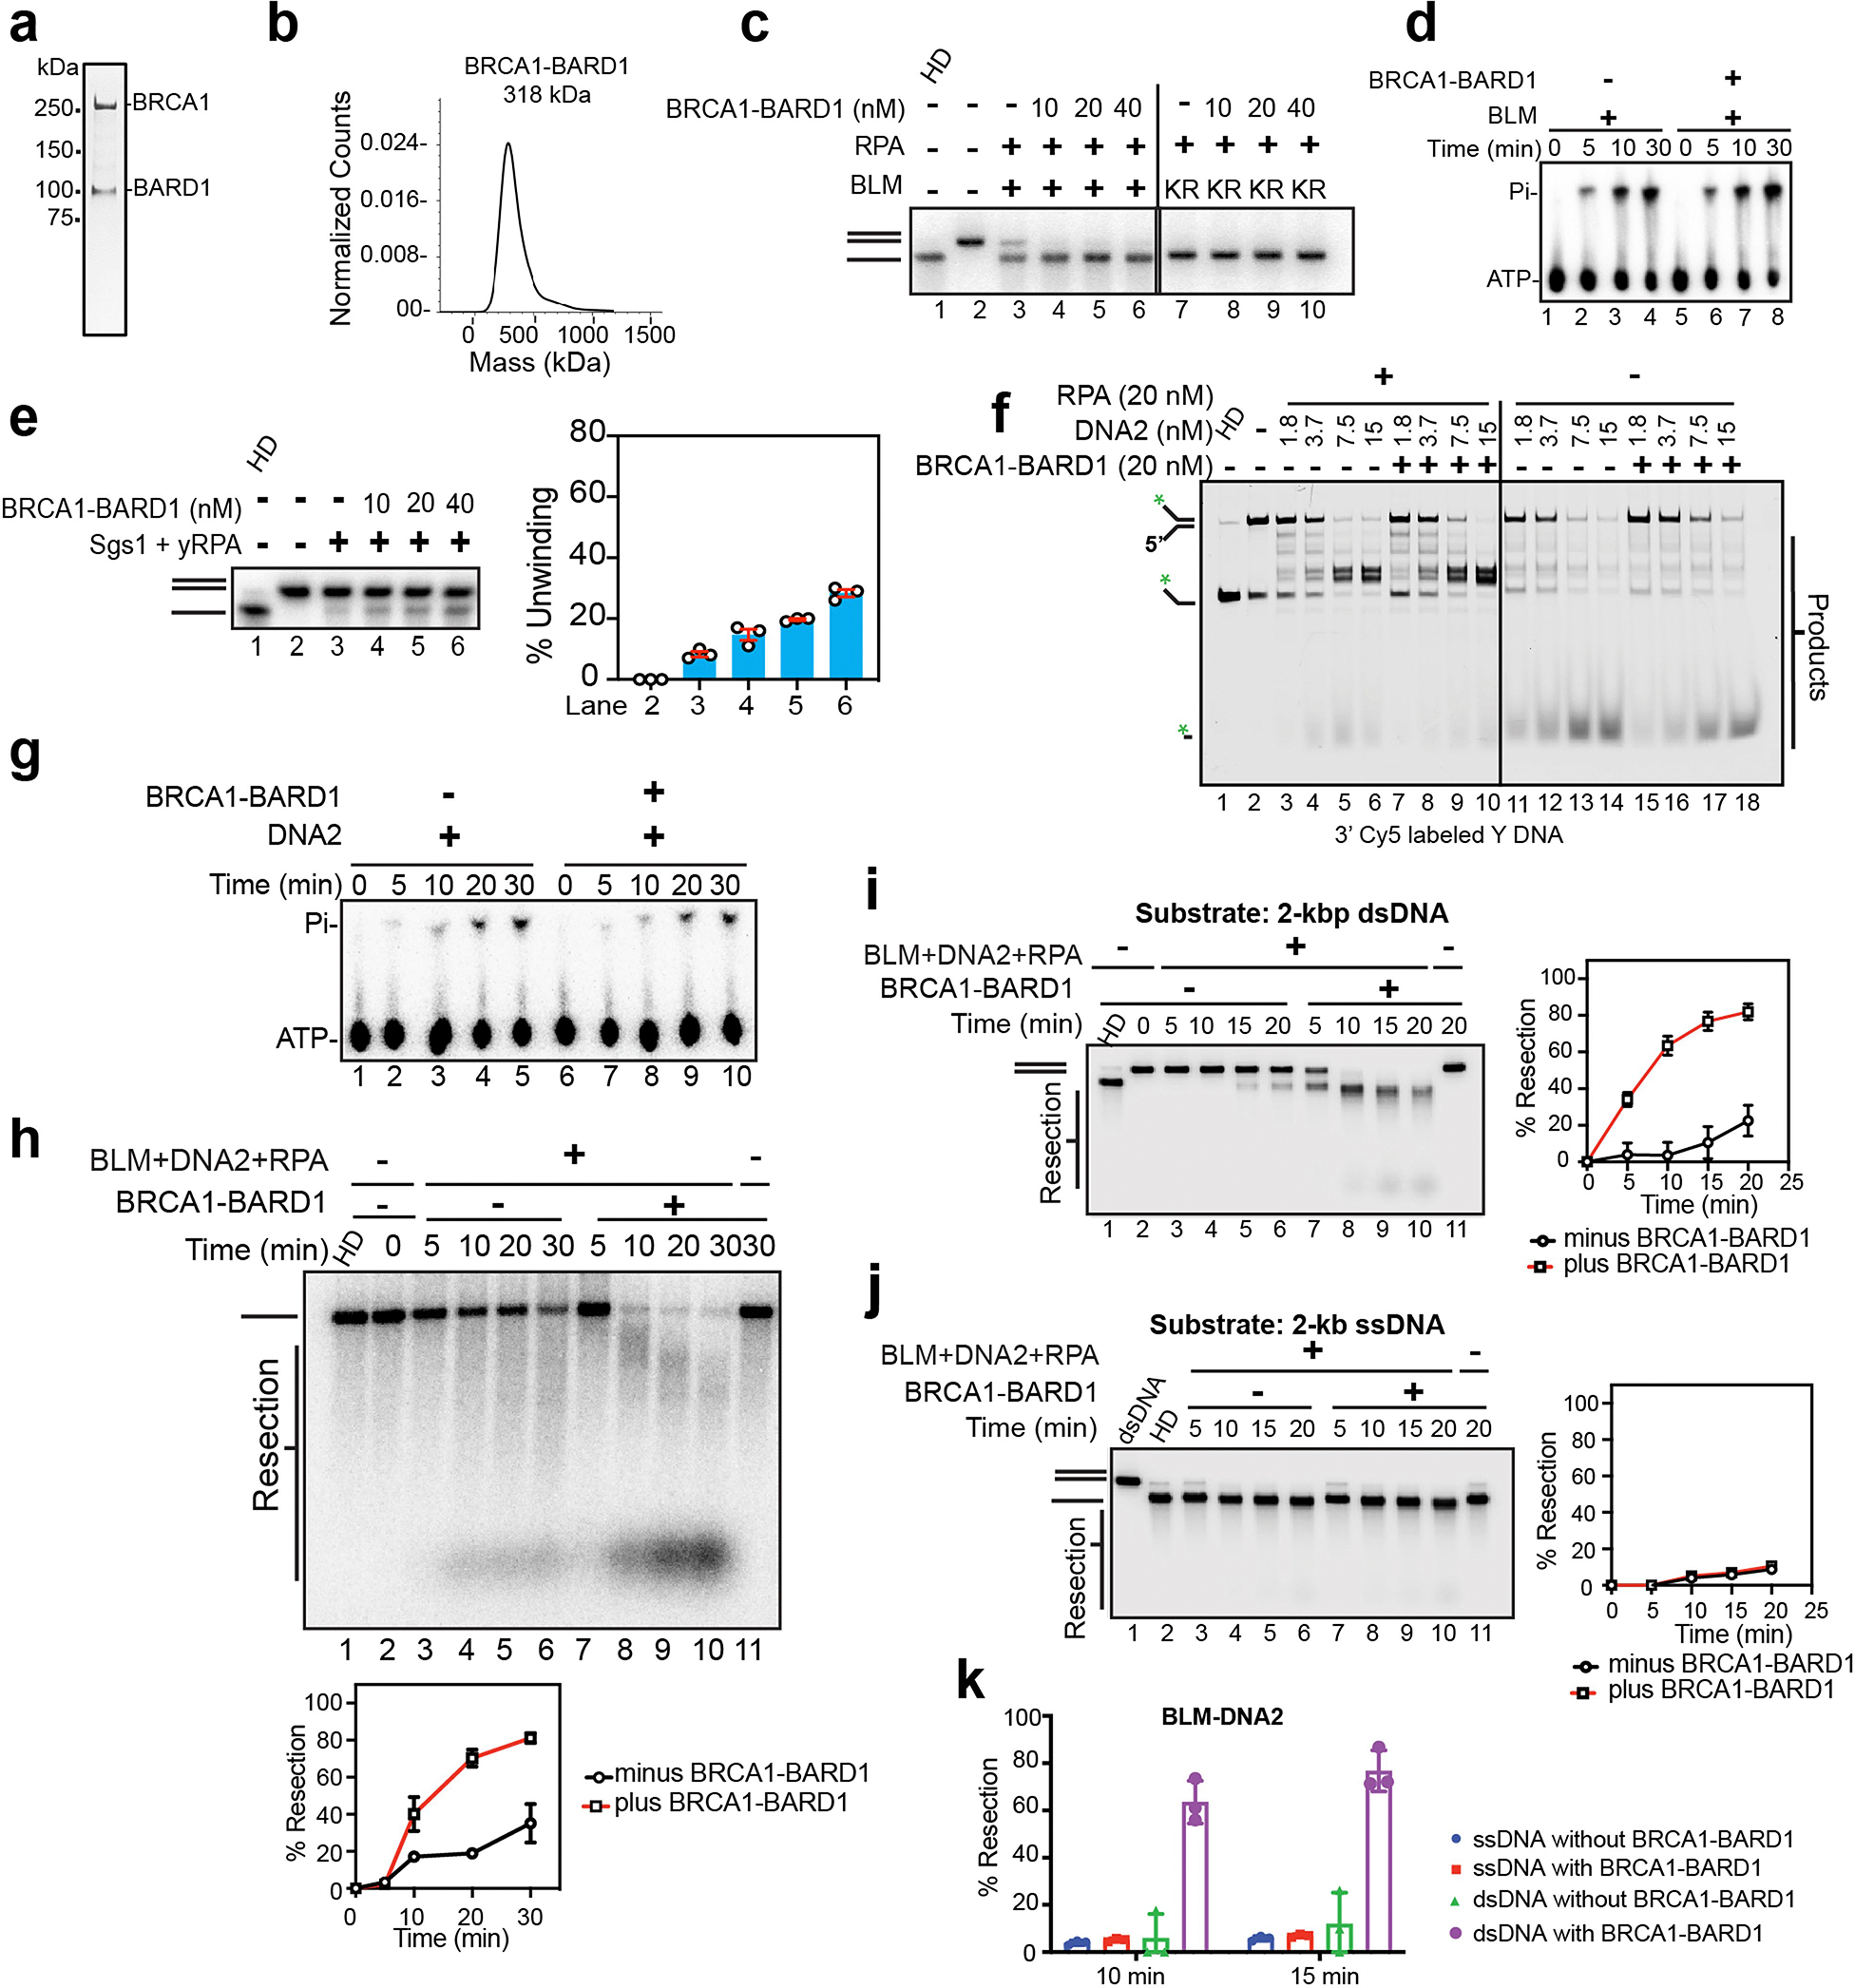
The BRCA1–BARD1 complex was expressed in insect cells and purified (Extended Data Fig. 1a) using our previously described procedure8. Mass photometry analysis confirmed a 1:1 stoichiometry of BRCA1 and BARD1 in the purified complex (Extended Data Fig. 1b). We first asked whether BRCA1–BARD1 would affect the helicase activity of BLM using a two-kilobase pair (kbp), double-stranded DNA substrate randomly labelled with [α−32P] deoxycytidine triphosphate (dCTP). The single-stranded DNA (ssDNA)-binding protein RPA was added to the reaction to prevent reannealing of unwound DNA strands12. Importantly, an amount of BRCA1–BARD1 stoichiometric to that of BLM strongly stimulated DNA unwinding (Fig. 1a–c). RPA was needed for DNA unwinding even in the presence of BRCA1–BARD1, and also no unwinding was seen when we tested the ATP hydrolysis-defective BLM–K695R mutant (Extended Data Fig. 1c). We found that BRCA1–BARD1 had no discernible impact on the ssDNA-dependent ATPase activity of BLM (Extended Data Fig. 1d). By contrast, BRCA1–BARD1 had little effect on the helicase activity of Sgs1, the yeast orthologue of BLM (Extended Data Fig. 1e). We note that even a relatively high concentration of BRCA1–BARD1 had little or no effect on the DNA flap endonuclease activity of DNA2, regardless of the presence of RPA (Extended Data Fig. 1f). Likewise, the ATPase activity of DNA2 was not affected by BRCA1–BARD1 (Extended Data Fig. 1g).
Fig. 1 |. Enhancement of BLM/WRN–DNA2-mediated DNA end resection by BRCA1–BARD1.
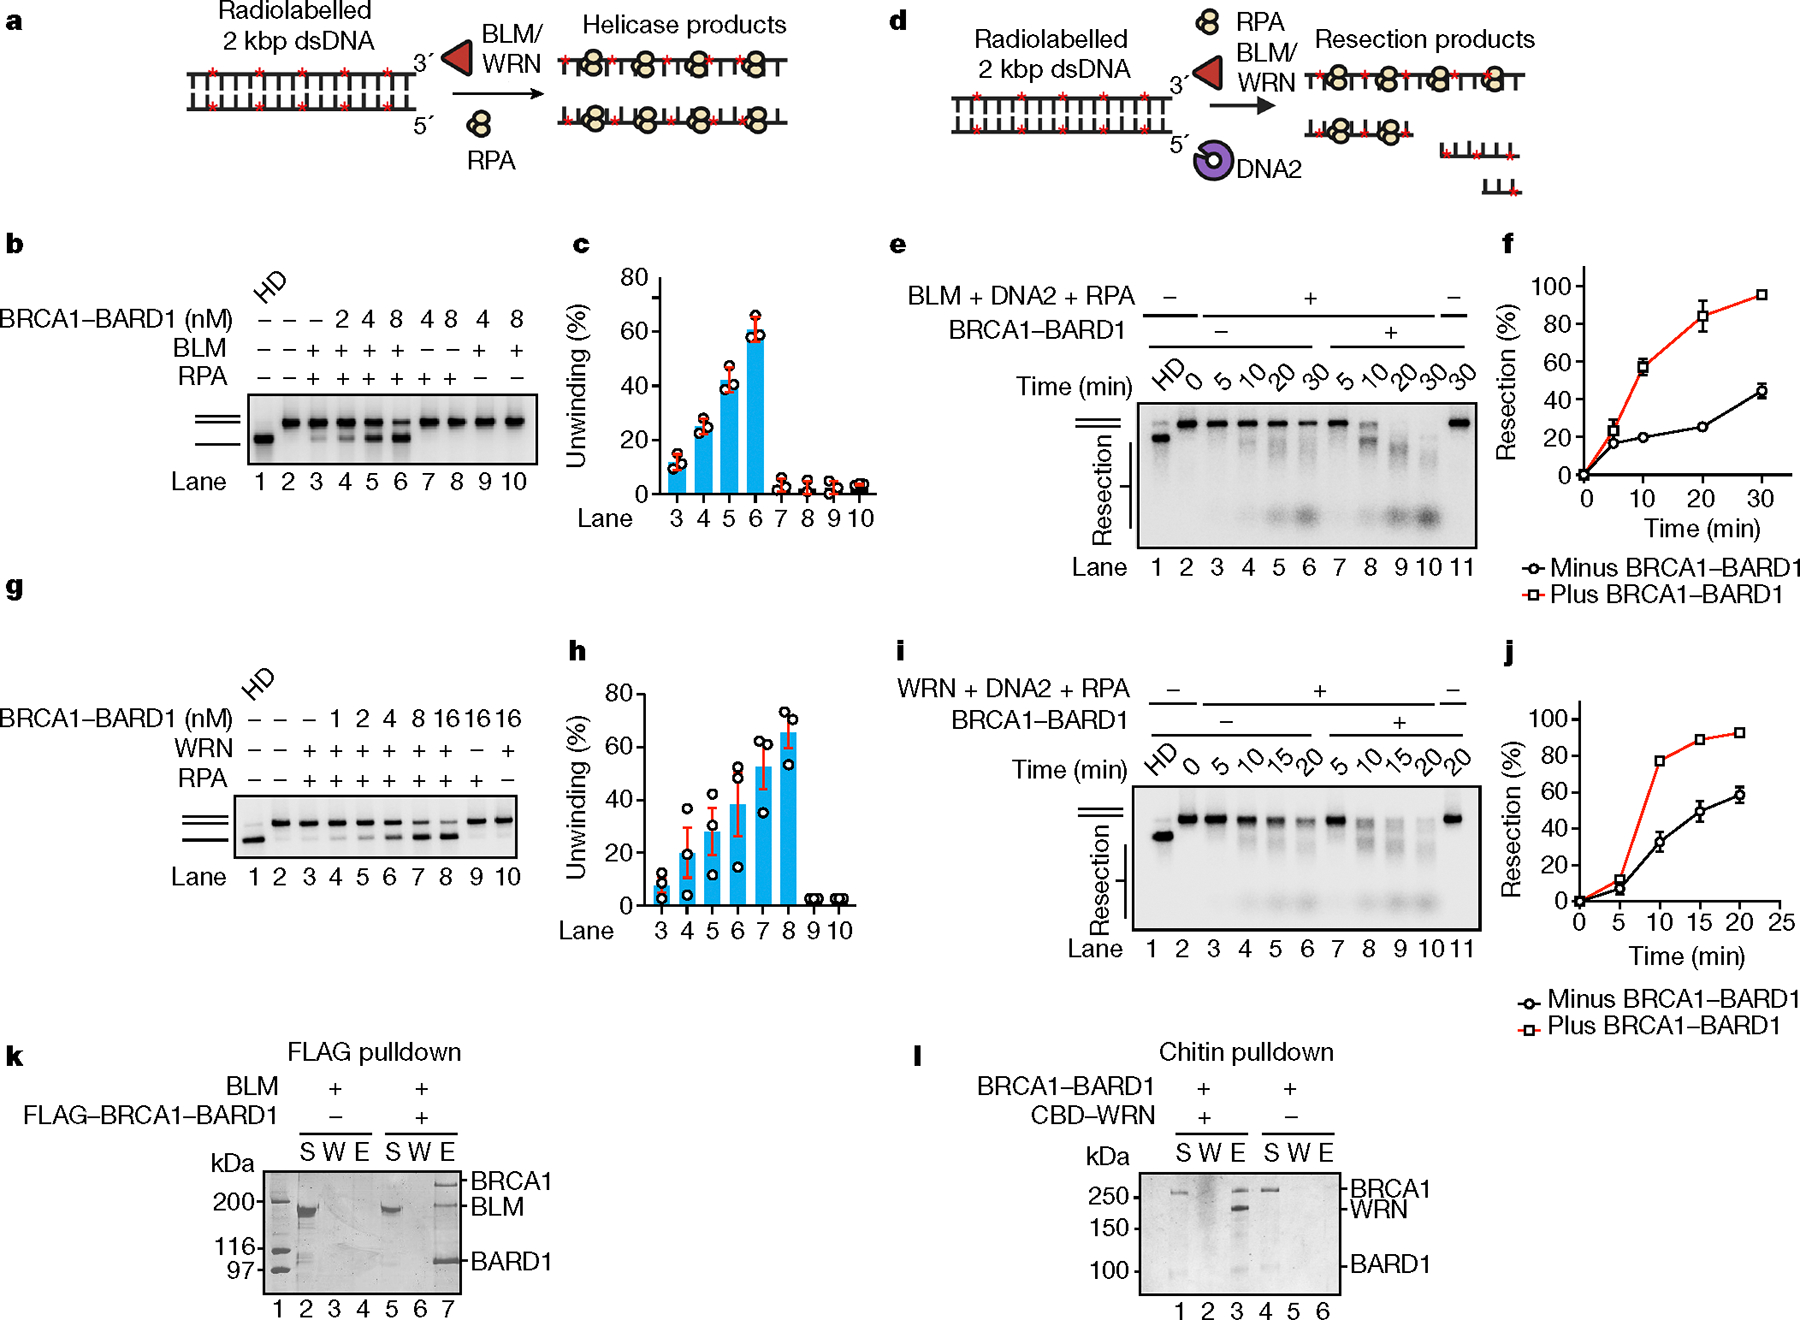
a, Schematic of the DNA unwinding assay. b, The effect of BRCA1–BARD1 on unwinding of the 32P-labelled, 2 kbp dsDNA substrate (0.5 nM ends) by BLM (2 nM) and RPA (200 nM) was tested in a 30 min reaction. Lane 1, DNA was heat denatured (HD). c, Quantification of results from b. Error bars show mean ± s.e.m.; n = 3. d, Schematic of BLM/WRN–DNA2 resection assay. e, Resection of the 32P-labelled, 2 kbp dsDNA substrate was tested with BLM (2 nM), DNA2 (15 nM) and RPA (200 nM) with or without BRCA1–BARD1 (10 nM). f, Quantification of data in e. Error bars show mean ± s.e.m.; n = 3. g, The effect of BRCA1–BARD1 on unwinding of the 32P-labelled, 2 kbp dsDNA substrate by WRN (2 nM) and RPA (200 nM) was tested in a 20 min reaction. h, Quantification of results from g. Error bars show mean ± s.e.m.; n = 3. i, Resection of the 32P-labelled, 2 kbp dsDNA substrate was tested with WRN (2 nM), DNA2 (20 nM) and RPA (200 nM) with or without BRCA1–BARD1 (8 nM). j, Quantification of results from i. Error bars show mean ± s.e.m.; n = 3. k, The interaction between BRCA1–BARD1 and BLM was assessed by affinity pulldown (n = 2). FLAG-tagged BRCA1–BARD1 immobilized on anti-FLAG resin was incubated with His-tagged BLM, and proteins were eluted from the resin and analysed by SDS–polyacrylamide gel electrophoresis (SDS–PAGE) with Coomassie blue staining. l, Interaction between BRCA1–BARD1 and WRN was assessed by affinity pulldown (n = 2). WRN (protein tagged with a chitin-binding domain (CBD)) immobilized on chitin resin was incubated with BRCA1–BARD1, and proteins were eluted and analysed as in k. a,d, Red asterisks (*) denote 32P label. Uncropped gel images are provided in Supplementary Fig. 1. n, Number of independent experiments; E, SDS eluate of resin; S, supernatant; W, wash.
BLM functions with DNA2 and RPA in long-range DNA end resection13. Given the strong stimulatory effect of BRCA1–BARD1 on BLM-mediated DNA unwinding (Fig. 1b,c), we asked whether it would similarly enhance DNA end resection in a reconstituted system assembled with BLM, DNA2 and RPA. Importantly, the addition of BRCA1–BARD1 stoichiometric to that of BLM–DNA2 resulted in strong stimulation of DNA end resection (Fig. 1d–f). The presence of a DNA species (lane 8 in Fig. 1e) with electrophoretic mobility similar to that of ssDNA (generated by heat denaturation of the double-stranded DNA (dsDNA) substrate; lane 1 in Fig. 1e) prompted us to examine whether BRCA1–BARD1 might also cause uncoupling of BLM helicase and DNA2 nuclease activities, which would lead to an accumulation of intact ssDNA. To address this possibility, reaction mixtures were subjected to heat treatment to dissociate all duplex DNA species before carrying out gel electrophoresis for an extended time to achieve better resolution of products and unresected ssDNA. This analysis showed that the DNA species in question (lane 8 in Fig. 1e) represented substrate that had undergone significant DNA end resection, as indicated by its higher electrophoretic mobility compared with intact ssDNA (Extended Data Fig. 1h, compare lanes 1 and 8). Furthermore, we tested the ability of BLM–DNA2 to degrade ssDNA under the same experimental conditions as in DNA end resection. Importantly, ssDNA was poorly digested by BLM–DNA2 even in the presence of BRCA1–BARD1 (Extended Data Fig. 1i–k). Taken together, our results provide clear evidence that BLM helicase and DNA2 nuclease activities are coupled during DNA end resection, with BRCA1–BARD1 functioning as a positive regulator.
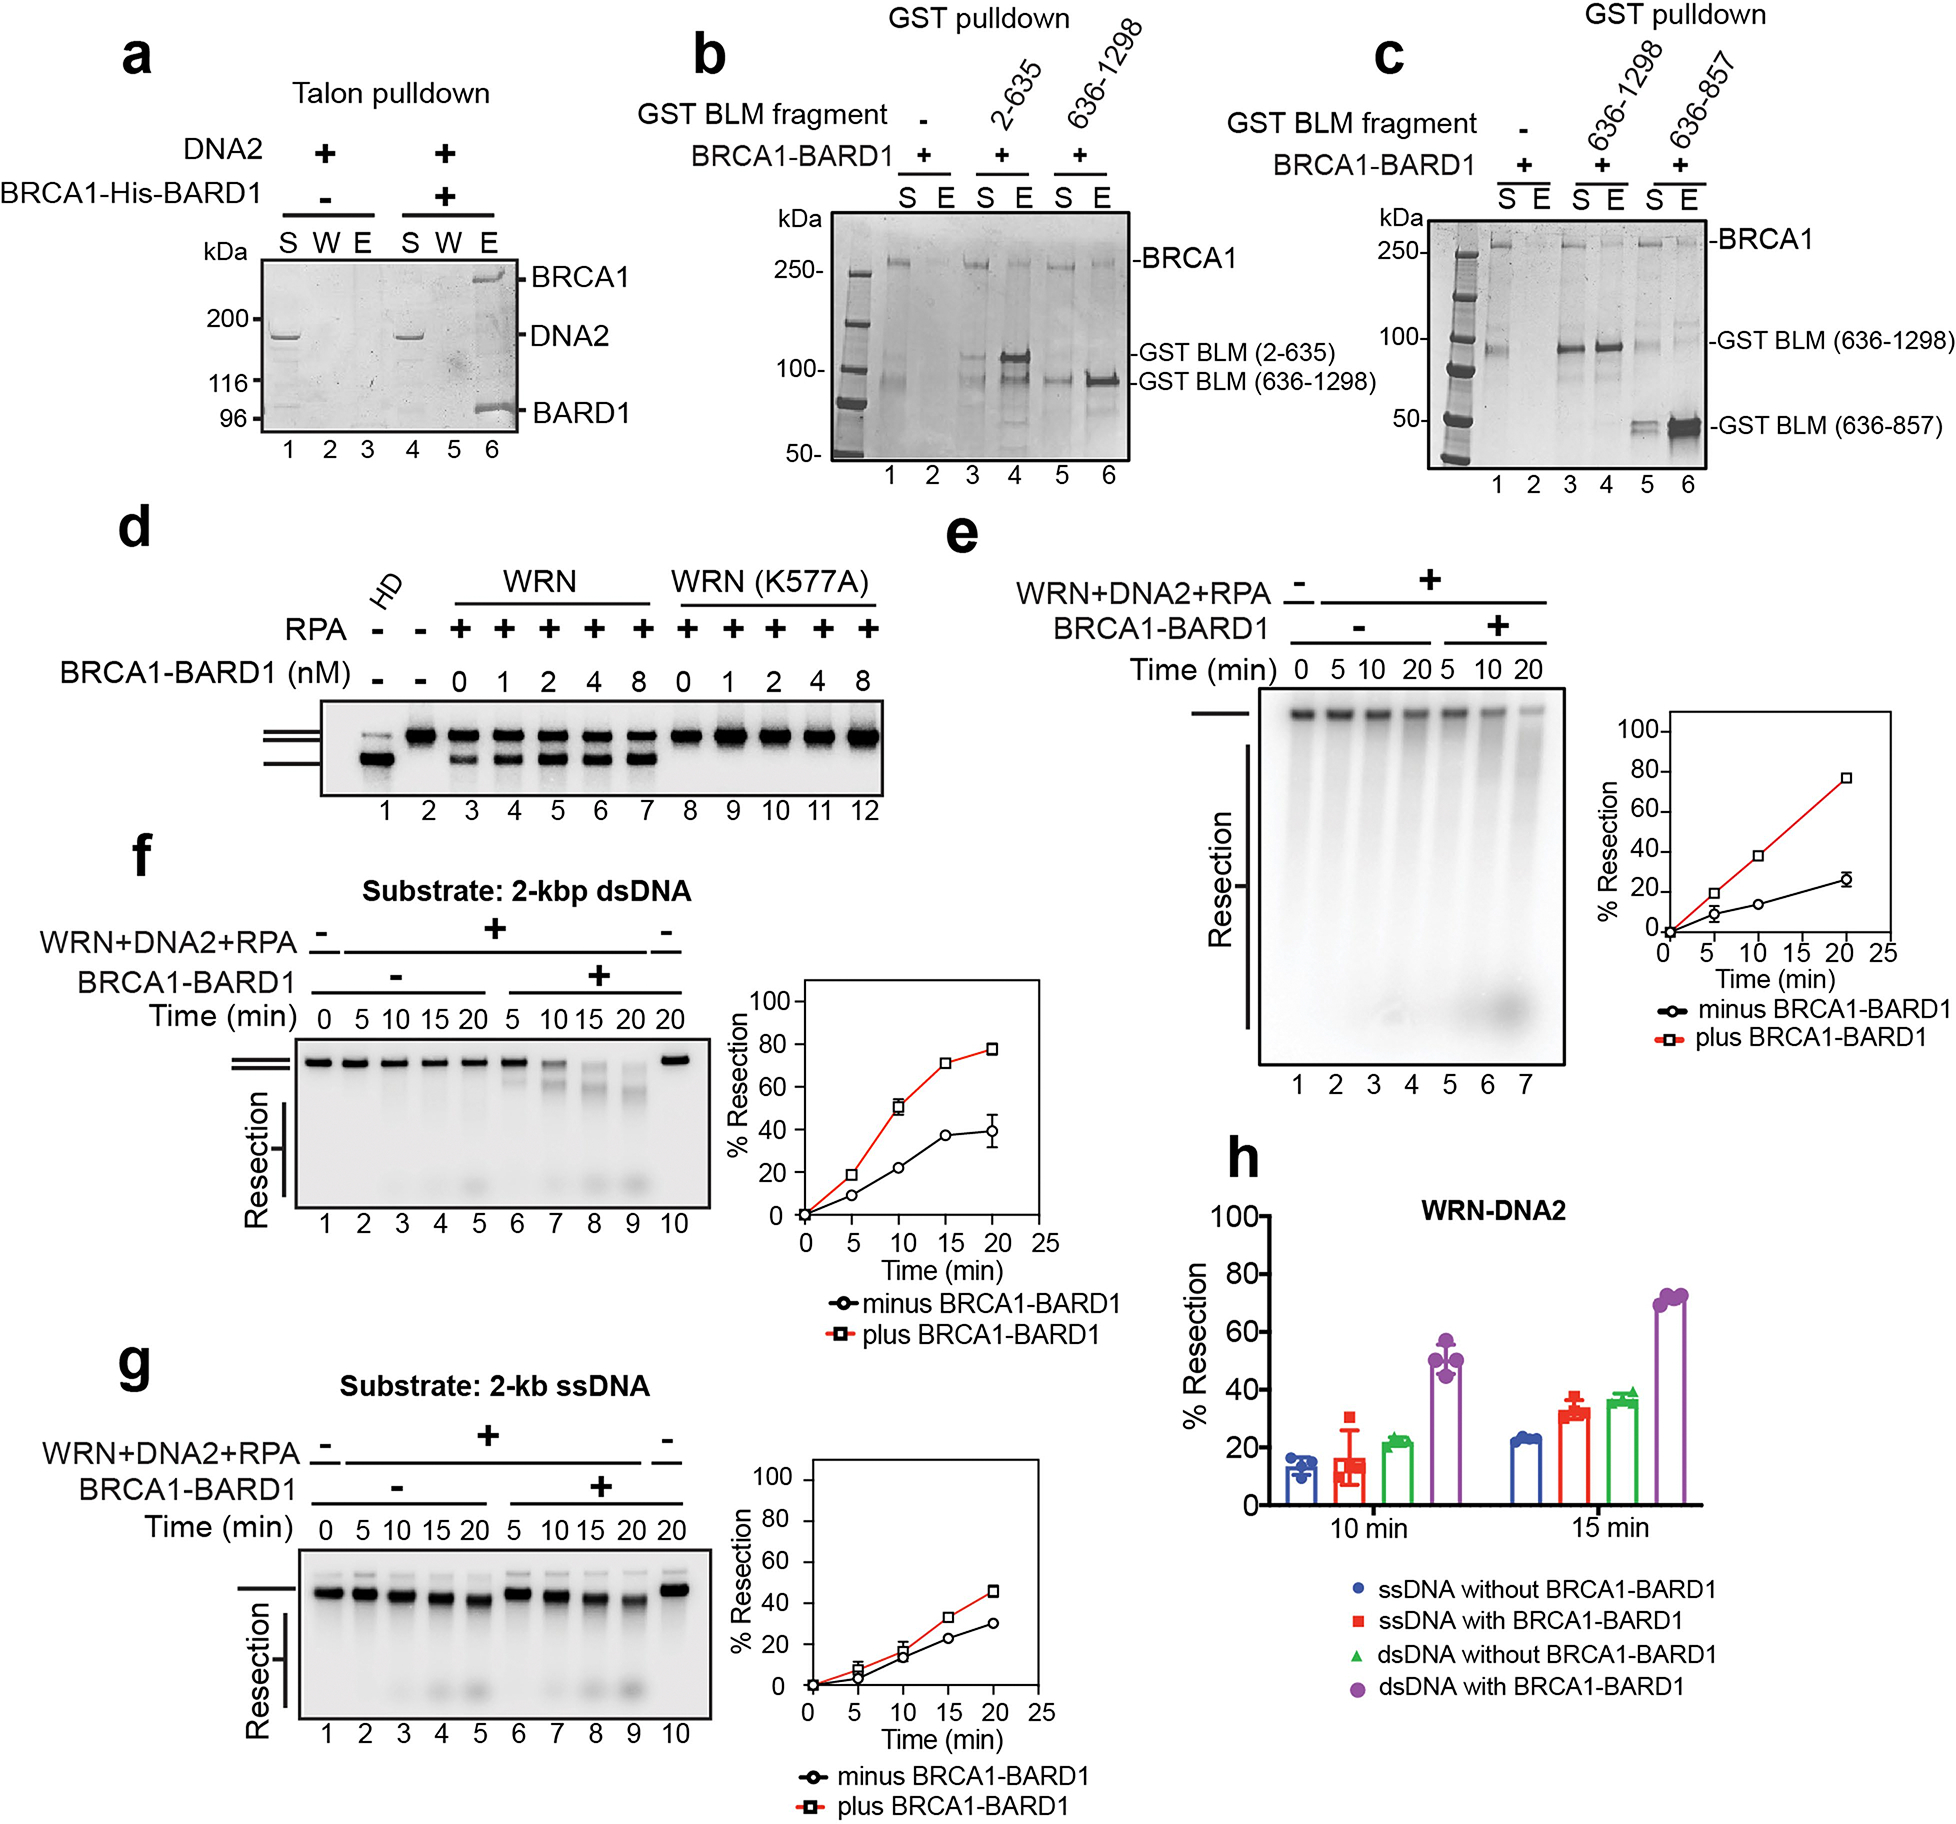
BLM was previously shown to co-immunoprecipitate with BRCA1 from cell extracts14, indicating that they are associated in a complex in cells. However, whether this reflects a direct interaction between BLM and BRCA1–BARD1 remains to be addressed. Using affinity pulldown, we found that purified BRCA1–BARD1 and BLM interacted strongly (Fig. 1k, compare lanes 4 and 7). The inclusion of TurboNuclease (a pan-nuclease that digests both DNA and RNA) in the affinity pulldown reaction showed that nucleic acid is not needed for complex formation between these entities. By contrast, and consistent with our observation that BRCA1–BARD1 failed to stimulate the DNA flap endonuclease activity of DNA2 (Extended Data Fig. 1f), no significant interaction between these protein factors was detected (Extended Data Fig. 2a, compare lanes 3 and 6). Next, we carried out biochemical mapping to help identify the BLM domain that mediates protein interaction with BRCA1–BARD1. We found that the amino- and carboxyl-terminal halves of BLM (encompassing amino acid residues 2–635 and 636–1298, respectively) can interact individually with BRCA1–BARD1 (Extended Data Fig. 2b). We further showed that the region of BLM encompassing C-terminal residues 636–857 also interacts with BRCA1–BARD1 (Extended Data Fig. 2c). Thus, BLM probably associates with BRCA1–BARD1 through distinct interfaces.
BRCA1–BARD1 promotes WRN–DNA2 activity
WRN, another 3′–5′ RECQ family helicase, also combines with DNA2 to resect the 5′ terminated DNA strand of DSB ends during HR15. Given our findings with BLM, we asked whether BRCA1–BARD1 could also stimulate DNA unwinding catalysed by WRN. Indeed, BRCA1–BARD1 enhanced WRN helicase activity (Fig. 1g,h) to the same extent as BLM. As expected, even in the presence of BRCA1–BARD1, DNA unwinding was reliant on RPA (Fig. 1g,h) and the helicase activity of WRN, as shown by testing the helicase null WRN–K577A mutant (Extended Data Fig. 2d). Next, we asked whether BRCA1–BARD1 would also enhance DNA resection mediated by WRN–DNA2 and RPA. Indeed, the addition of BRCA1–BARD1 stoichiometric to that of WRN–DNA2–RPA led to marked stimulation of resection of the 2 kbp DNA substrate (Fig. 1i,j). As in the case of BLM–DNA2, salient analyses showed that DNA unwinding and strand resection mediated by the BRCA1–BARD1–WRN–DNA2 ensemble occur in a coupled manner (Extended Data Fig. 2e–h).
Because WRN can be co-immunoprecipitated with BRCA1 from cell extracts16, we addressed whether these entities interact directly. Importantly, affinity pulldown conducted in the presence of TurboNuclease provided evidence that WRN forms a complex with BRCA1–BARD1 (Fig. 1l, compare lanes 3 and 6).
EXO1 enhancement by BRCA1–BARD1
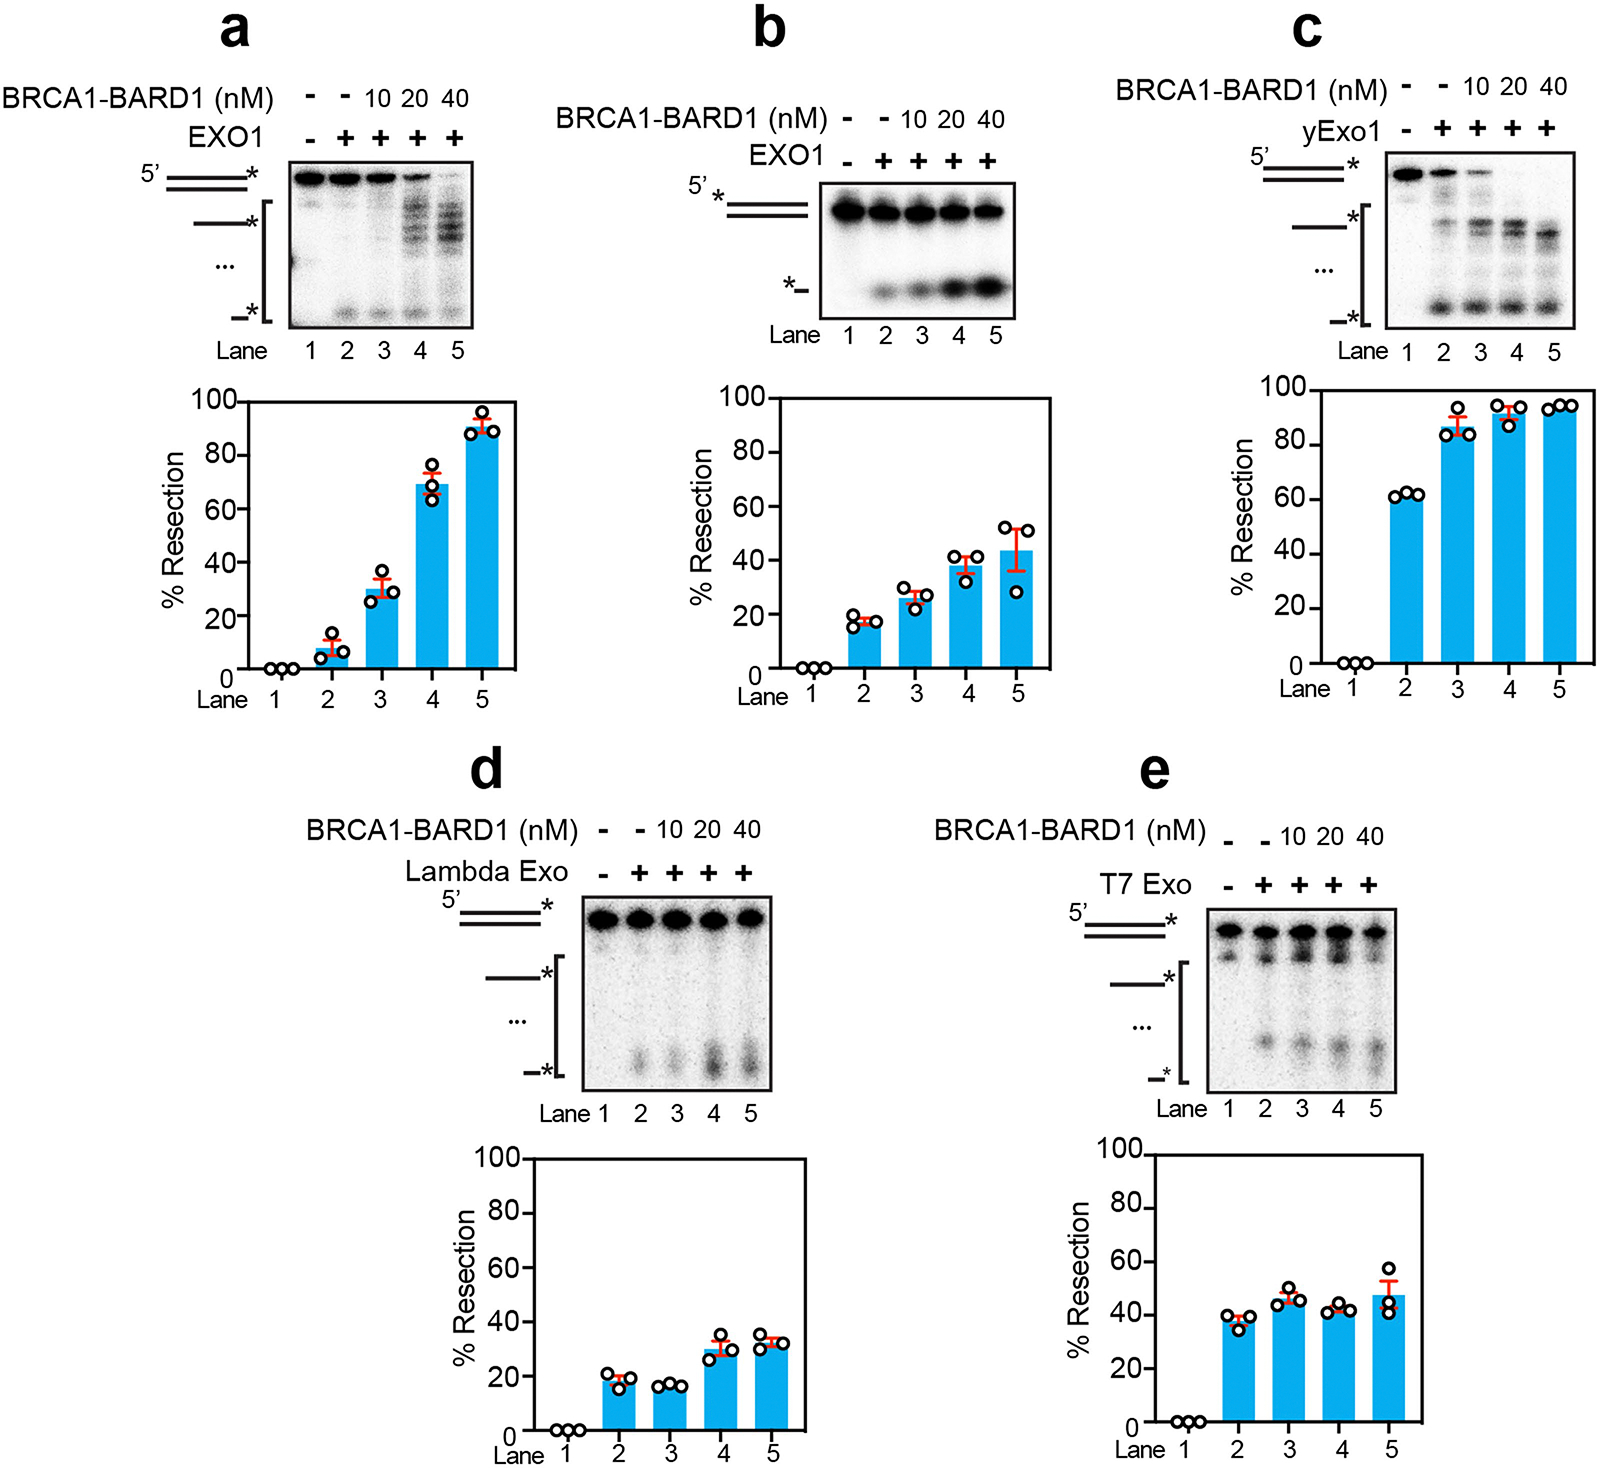
The 5′–3′ exonuclease EXO1 also participates in long-range resection, functioning in parallel with BLM–DNA2 and WRN–DNA2 (ref. 13). The main difference between the EXO1-dependent resection pathway and that mediated by BLM–DNA2 or WRN–DNA2 is that the former does not require ATP. Importantly, using the 2 kbp, 32P-labelled DNA substrate, we found that stoichiometric amounts of BRCA1–BARD1 robustly stimulated EXO1-mediated resection either with or without RPA (Fig. 2a–c). We confirmed EXO1 stimulation by BRCA1–BARD1 using a 3′ 32P-labelled, 80-base-pair dsDNA as substrate (Extended Data Fig. 3a). In addition, we found that BRCA1–BARD1 enhanced the initiation of resection (first incision) by EXO1 through testing of a 5′ 32P-labelled, 80-base-pair dsDNA substrate (Extended Data Fig. 3b). BRCA1–BARD1 could stimulate yeast Exo1 (Extended Data Fig. 3c) but not the structurally unrelated 5′–3′ exonucleases Lambda Exo and T7 Exo (Extended Data Fig. 3d,e), further supporting the idea that the influence of BRCA1–BARD1 on EXO1 is specific.
Fig. 2 |. Enhancement of EXO1-mediated DNA end resection by BRCA1–BARD1.

a, Schematic of the EXO1 resection assay. b, EXO1 (2 nM) was tested with the 2 kbp, 32P-labelled substrate with and without the presence of BRCA1–BARD1 or RPA (100 nM); incubation time was 10 min. c, Quantification of data in b; error bars show mean ± s.e.m.; n = 3. d, The interaction between BRCA1–BARD1 and EXO1 was assessed by affinity pulldown (n = 2). GFP-tagged EXO1 immobilized on anti-GFP affinity resin was incubated with BRCA1–BARD1, and proteins were eluted from the resin and analysed by SDS–PAGE with Coomassie blue staining. e, Interaction between BRCA1–BARD1 and EXO1 fragments was assessed by affinity pulldown (n = 2). Either glutathione S-transferase (GST)-tagged EXO11–346 or EXO1347–846 was immobilized on glutathione Sepharose and then incubated with BRCA1–BARD1. Supernatant and SDS eluate were analysed by immunoblotting using either anti-FLAG antibody (specific for the FLAG tag on BRCA1) or anti-GST antibody (specific for the GST tag on EXO1 fragments). f, EXO11–346 (10 nM) was incubated with 3′ 32P-labelled (asterisks (*) denote 32P label), 80-mer dsDNA (2.5 nM) with or without BRCA1–BARD1 for 10 min, then analysed. g, Quantification of results from f. Error bars show mean ± s.e.m.; n = 3. a, Red asterisks (*) denote the 32P label. Uncropped gel images are provided in Supplementary Fig. 1. n, Number of independent experiments.
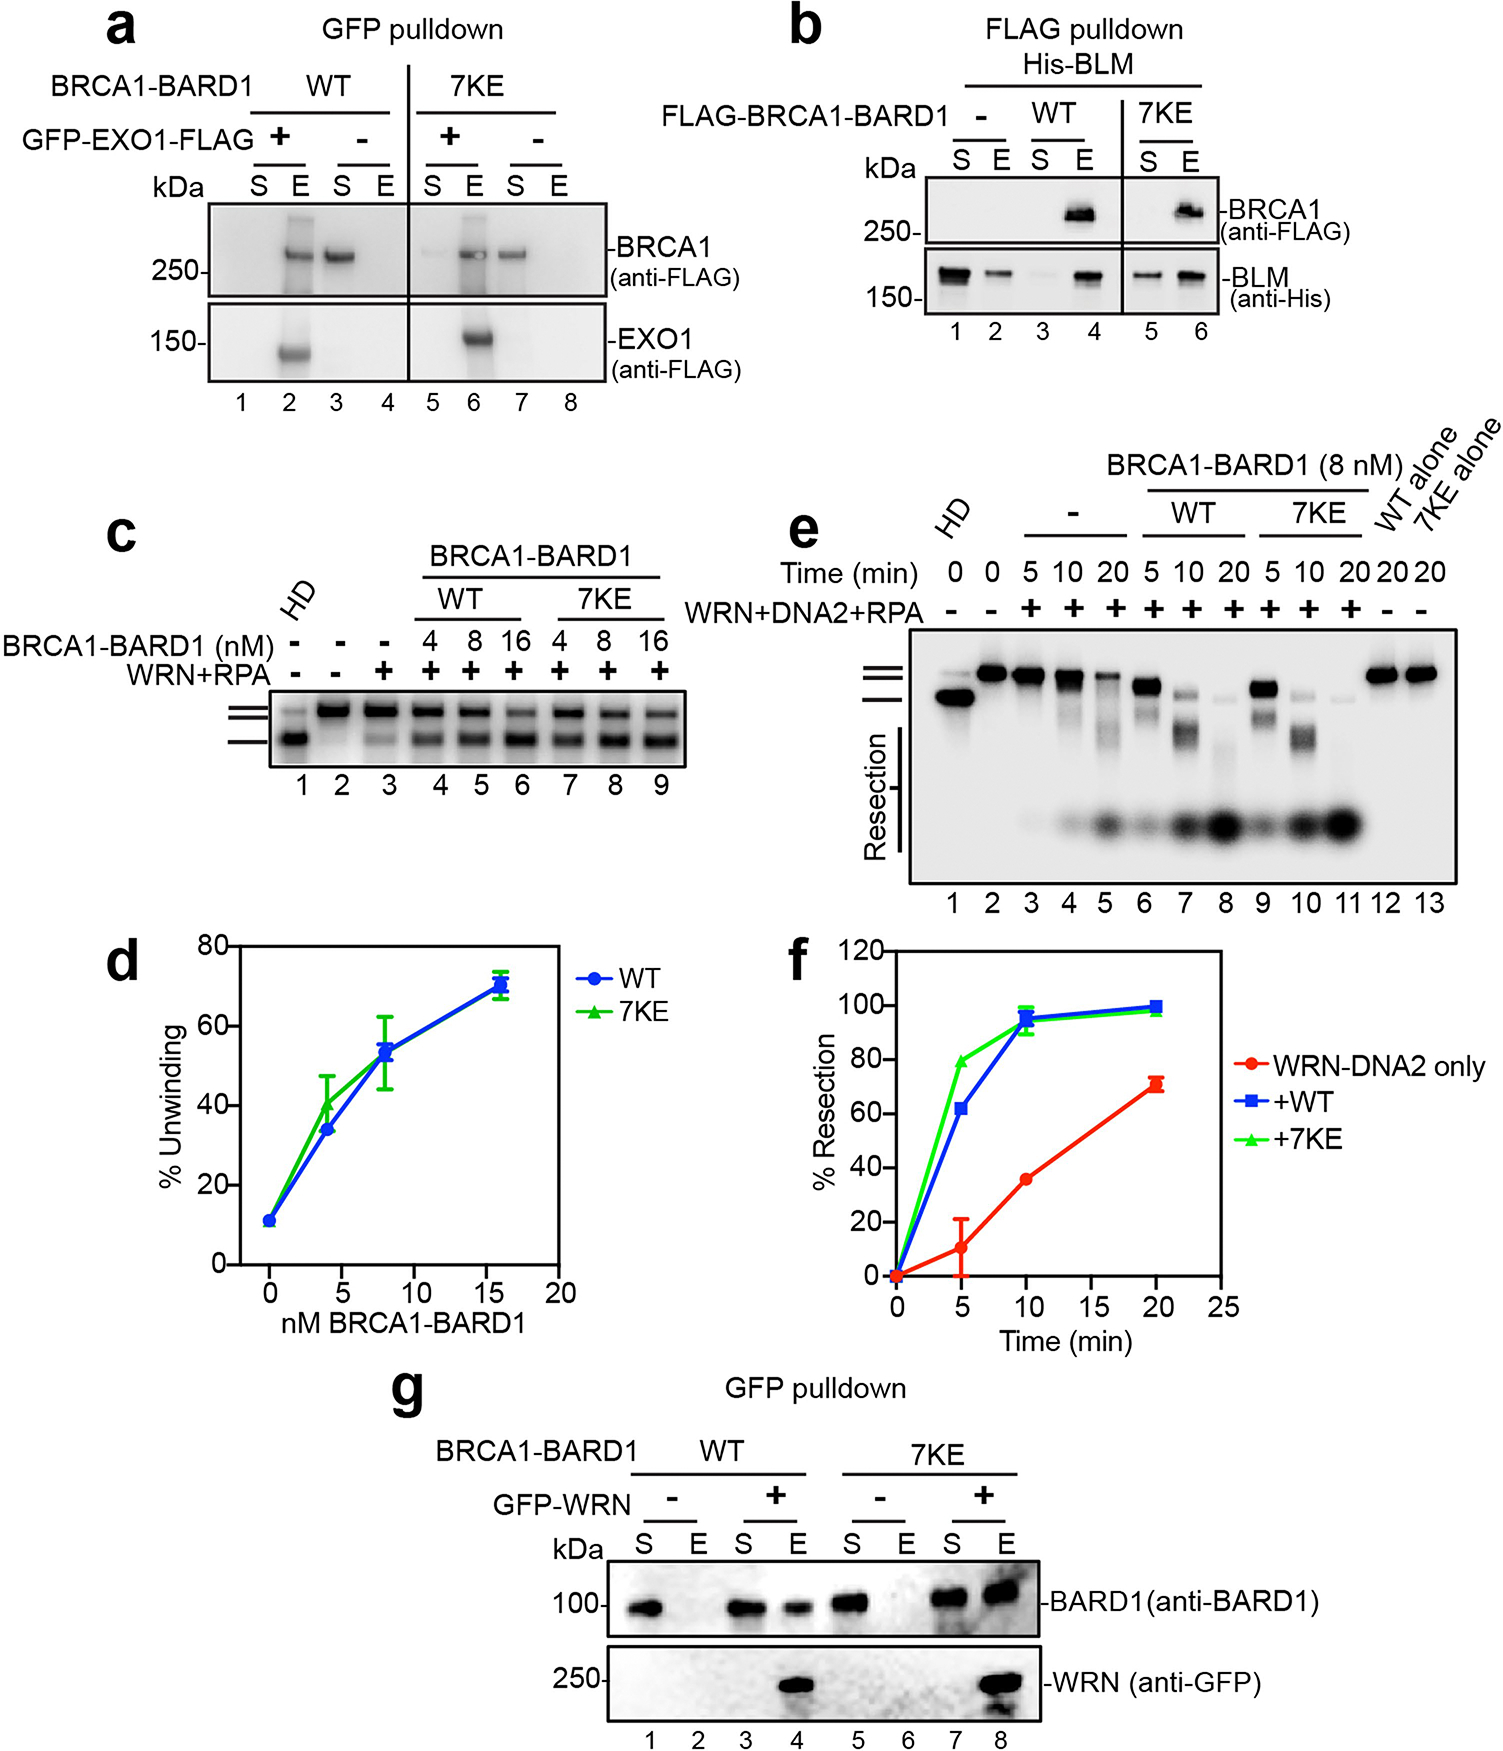
BRCA1–BARD1 was shown to exist in a complex with EXO1 by co-immunoprecipitation from cell extracts, but whether these entities interact directly remains to be established17. Importantly, affinity pulldown performed in the presence of TurboNuclease showed direct interaction of BRCA1–BARD1 with EXO1 (Fig. 2d, compare lanes 3 and 6). Furthermore, we expressed EXO1 fragments encompassing either its N- or C-terminal half (amino acid residues 1–346 or 347–846, NTD or CTD, respectively) for testing. We found interaction of both EXO11–346 and EXO347–846 with BRCA1–BARD1, even though EXO11–346 appeared to possess higher affinity for BRCA1–BARD1 (Fig. 2e). EXO1–NTD harbours the nuclease active site18 but, despite the fact that it interacts with BRCA1–BARD1 (Fig. 2e), its nuclease activity was not significantly affected by the latter (Fig. 2f,g). Taken together, our results show that (1) BRCA1–BARD1 directly associates with EXO1 through contacts located in the NTD and CTD of the latter, (2) BRCA1–BARD1 strongly upregulates EXO1 activity and (3) EXO1–CTD is indispensable for maximal activity of the EXO1–BRCA1–BARD1 ensemble.
Single-molecule analysis of BRCA1–BARD1
Next, we utilized DNA curtain assays with double-stranded λ-DNA (48.5 kbp) bearing a 30-nucleotide (nt) 3′ ssDNA overhang as the substrate19. This experimental set-up mimics a partially processed DSB based on the affinity of BLM for 3′ ssDNA overhangs during unwinding of dsDNA. The DNA substrate is biotinylated, thus allowing its immobilization over a lipid bilayer on the flow cell surface through a biotin–streptavidin linkage (Fig. 3a). Application of hydrodynamic force aligns DNA molecules along the leading edge of nanofabricated chromium (Cr) barriers to lipid diffusion, as previously described19,20. Using this system, we have previously shown that DNA end resection can be monitored in real time with total internal reflection fluorescence microscopy (TIRFM) using green fluorescent protein (GFP)-tagged BLM or GFP-tagged EXO1, together with mCherry-tagged RPA, which is used to detect the production of ssDNA19,21.
Fig. 3 |. Single-molecule analysis of BRCA1–BARD1 in BLM- and EXO1-dependent resection.
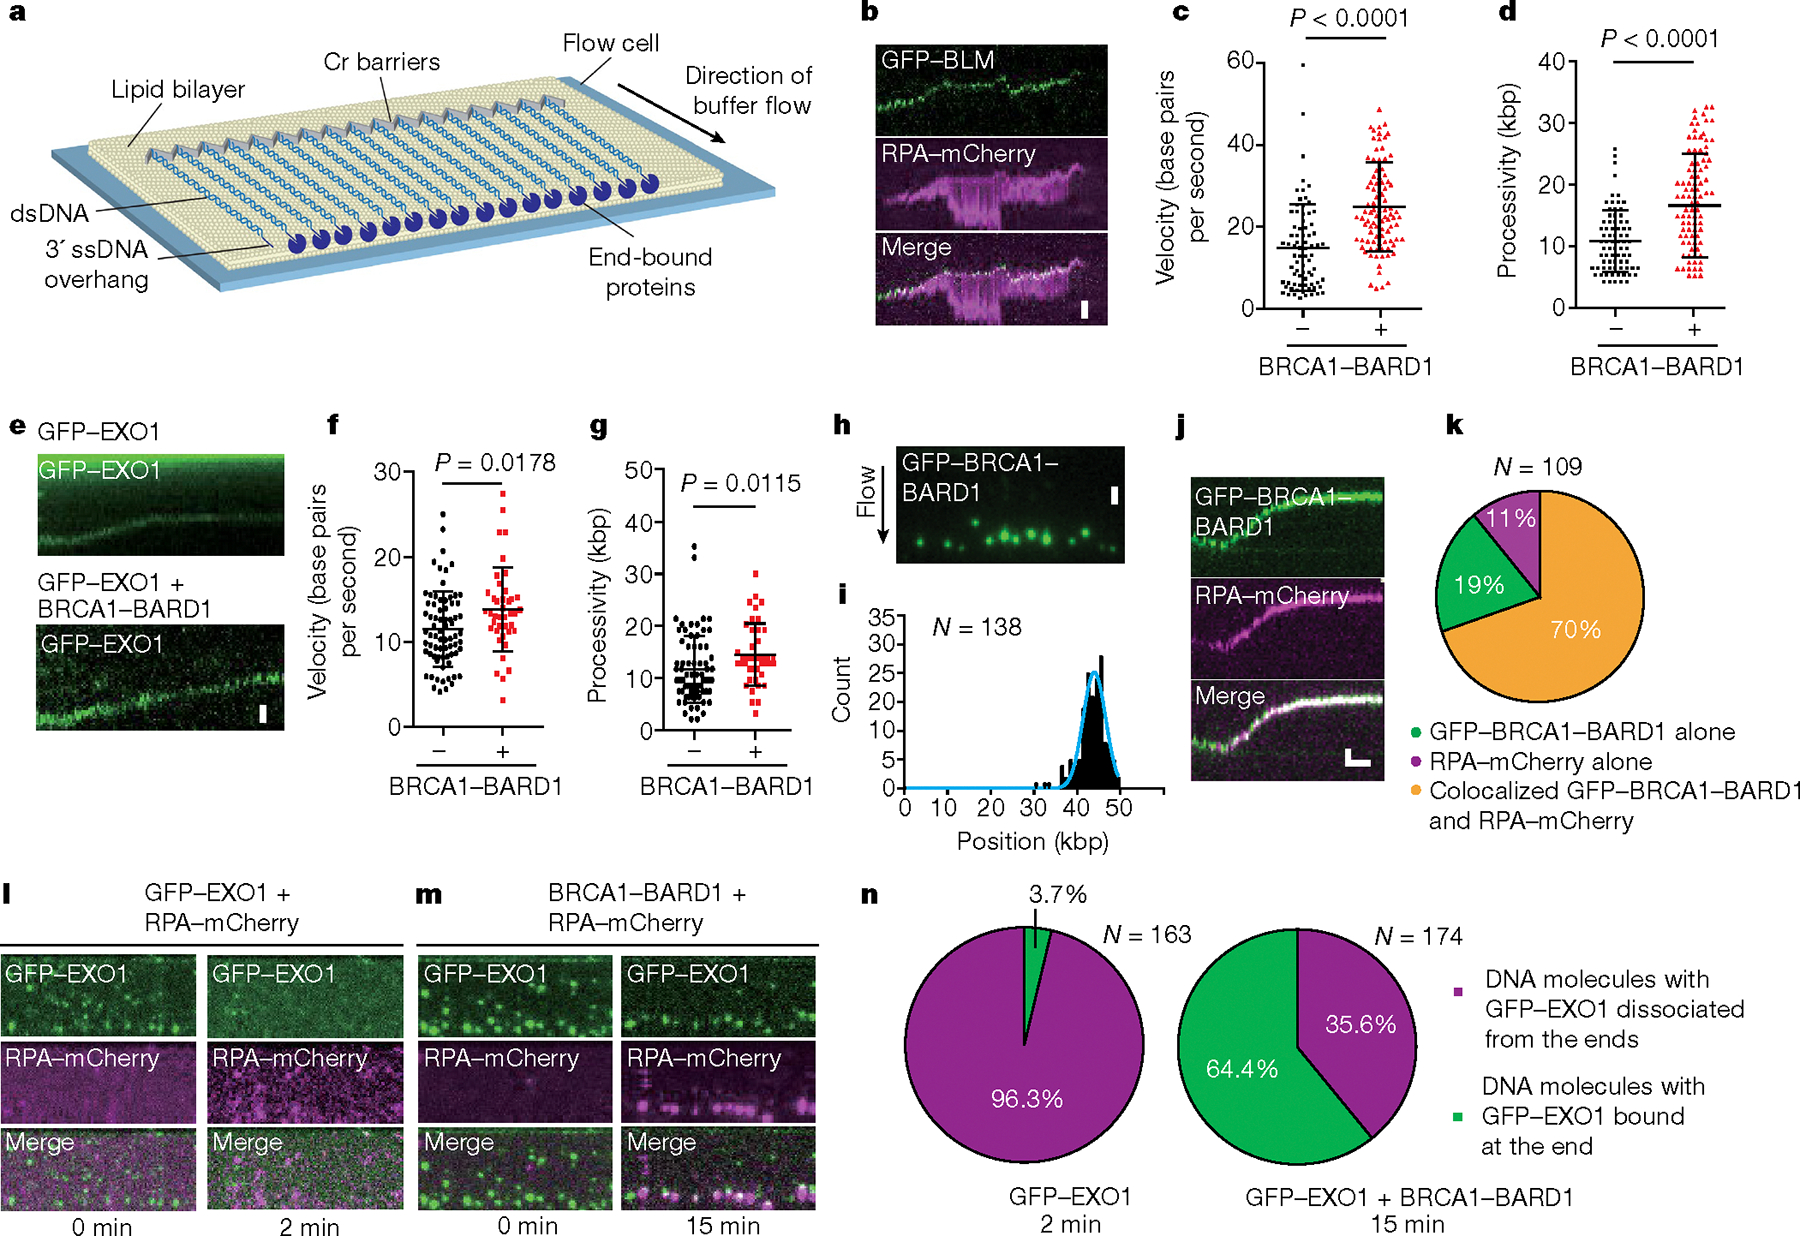
a, Schematic of the DNA curtains analytical set-up. b, Kymographs of DNA resection by GFP–BLM, RPA–mCherry, DNA2 and BRCA1–BARD1. c,d, Velocity (N = 77, n = 3 and N = 93, n = 3) (c) and processivity of reactions (d) with GFP–BLM, RPA–mCherry and DNA2 with or without BRCA1–BARD1 (N = 77, n = 3 and N = 93, n = 3). e, Kymographs of DNA resection by GFP–EXO1 alone and GFP–EXO1 + BRCA1–BARD1. f,g, Velocity (N = 73, n = 3 and N = 41, n = 3) (f) and processivity of resection reactions (N = 73, n = 3 and N = 41, n = 3) (g). h, Wide-field TIRFM image showing association of GFP–BRCA1–BARD1 (green) with DNA ends. i, Binding distribution of GFP–BRCA1–BARD1 following bootstrap analysis (N = 138, n = 4). j, Kymograph showing DNA end resection by unlabelled BLM, GFP–BRCA1–BARD1 (green), unlabelled DNA2 and RPA–mCherry (magenta). k, Percentage of resecting DNA molecules with GFP–BRCA1–BARD1 and RPA–mCherry colocalization (N = 109, n = 4). l, Wide-field TIRFM image showing rapid loss of end-bound GFP–EXO1 in the absence of BRCA1–BARD1. m, Wide-field TIRFM image showing BRCA1–BARD1 mediating GFP–EXO1 retention on DNA in the presence of RPA–mCherry. n, Pie chart summarizing the occupancy of GFP–EXO1 at DNA ends in the absence (2 min time point; N = 163, n = 3) and presence (15 min time point; N = 174, n = 3) of BRCA1–BARD1. c,d,f,g, Error bars represent standard deviation of means, and P values are derived from two-tailed unpaired t-testing. Scale bars, 2 μm (b,e,h,j (vertical)), 3 min (j, horizontal). N, number of DNA molecules analysed; n, number of flow cell repeats.
Notably, BRCA1–BARD1 increased both the velocity (from 15 ± 10 base pairs per second (n = 77) to 25 ± 11 base pairs per second (n = 93, 67% increase, P < 0.0001)) and processivity (from 10.8 ± 5.0 kbp (n = 77) to 16.7 ± 8.3 kbp (n = 93, 55% increase, P < 0.0001)) of dsDNA resection by BLM–DNA2 (Fig. 3b–d), but did not stimulate yeast Sgs1–Dna2 (Extended Data Fig. 4a–f) in concordance with our bulk biochemistry data. Both the velocity and processivity of EXO1 were also enhanced by BRCA1–BARD1, yielding an increase in velocity from 12 ± 5 base pairs per second (n = 73) to 14 ± 5 base pairs per second (n = 41, 17% increase, P = 0.0178) and an increase in processivity from 11.6 ± 6.4 kbp (n = 73) to 14.6 ± 6.0 kbp (n = 41, 26% increase, P = 0.0115) (Fig. 3e–g).
To determine whether BRCA1–BARD1 colocalizes with the resection machinery, we used a GFP-tagged version of BRCA1–BARD1 (Extended Data Fig. 4g) that is fully functional in upregulating BLM helicase activity in biochemical analysis (Extended Data Fig. 4h,i), along with unlabelled BLM, DNA2 and mCherry-tagged RPA in our DNA curtain end resection assay. GFP–BRCA1–BARD1 localized at the free end of DNA molecules (Fig. 3h,i). Following initiation of resection by the addition of DNA2 and RPA–mCherry, end-bound GFP–BRCA1–BARD1 moved along the DNA molecule with the resection machinery during end processing, as indicated by the colocalization of RPA–mCherry and GFP–BRCA1–BARD1 (Fig. 3j). GFP–BRCA1–BARD1 colocalized with the resecting DNA ends in 89% of resection events (n = 97 of 109). In most cases (n = 76 of 109), the movement of BRCA1–BARD1 coincided with the accumulation of RPA–mCherry, suggesting the generation of ssDNA (Fig. 3k). In the remaining cases (n = 21 of 109), there was no coincident accumulation of RPA–mCherry, suggesting that BLM movement on this subset of DNA molecules became decoupled from DNA resection, probably due to the absence or loss of DNA2 in these cases (Fig. 3k). To investigate whether BRCA1–BARD1 might itself be responsible for decoupling a fraction of BLM and DNA2 molecules, we performed experiments using mCherry–BLM and GFP–DNA2 with and without unlabelled BRCA1–BARD1. Both mCherry–BLM and GFP–DNA2 colocalized at the ends of DNA molecules and moved together during end resection, regardless of the presence of BRCA1–BARD1 (Extended Data Fig. 4j,k). Importantly, the number of DNA molecules harbouring GFP–BLM alone did not differ considerably without (9.8%, 5 of 51) or with (12.6%, 8 of 63) the presence of BRCA1–BARD1, providing evidence that BRCA1–BARD1 does not cause the dissociation of BLM and DNA2 during end resection (Extended Data Fig. 4l). These single-molecule data are in concordance with biochemical analyses (Extended Data Fig. 1h–k) also showing that BRCA1–BARD1 does not decouple BLM helicase and DNA2 nuclease activities during end resection.
As indicated above, BRCA1–BARD1 also enhanced both the velocity and processivity of EXO1-mediated end resection (Fig. 3f,g). However, BRCA1–BARD1 did not affect the binding distribution of GFP–EXO1 to the DNA substrate, with the majority of GFP–EXO1 being associated with DNA ends regardless of whether BRCA1–BARD1 was present (Extended Data Fig. 4m,n). However, BRCA1–BARD1 strongly stimulated the retention of GFP–EXO1 at DNA ends and promoted the initial accumulation of RPA–mCherry at these ends (Fig. 3l–n). In the absence of BRCA1–BARD1, 96.3% (n = 157 of 163) of end-bound GFP–EXO1 dissociated from DNA after 2 min whereas 64.4% (n = 112 of 174) of EXO1 molecules remained DNA bound even at the 15 min time point when BRCA1–BARD1 was present. Most of these BRCA1–BARD1–EXO1 complexes coincided with the accumulation of RPA–mCherry, suggesting that they had successfully initiated end resection (Fig. 3m,n).
Taken together, the results from single-molecule analyses furnish mechanistic evidence that BRCA1–BARD1 promotes end resection by enhancing the velocity and processivity of BLM–DNA2, and also the retention of EXO1 at DNA ends.
BRCA1–BARD1 DNA binding in resection
We previously reported that the region of BARD1 encompassing amino acid residues 124–270 harbours a DNA-binding domain8 (Extended Data Fig. 5a,b). Through biochemical mapping efforts, we have now narrowed the DNA-binding region of BRCA1 to amino acid residues 467–696 (Extended Data Fig. 5c,d). Next, we examined specifically how the DNA-binding domains in BRCA1 and BARD1 contribute to resection enhancement within the context of the BRCA1–BARD1 complex. Accordingly, we constructed three BRCA1–BARD1 mutant complexes deleted for either or both of the BRCA1 and BARD1 regions that encompass the DNA-binding domain in these factors. These mutant complexes, namely, BRCA1Δ467–696–BARD1, BRCA1–BARD1Δ124–270 and BRCA1Δ467–696–BARD1Δ124–270, were assembled in insect cells by coexpression of the salient protein species and purified to near homogeneity (Extended Data Fig. 5e). Mass photometry analysis provided assurance that these mutant BRCA1–BARD1 complexes are monodispersed and retain the expected 1:1 subunit stoichiometry (Extended Data Fig. 5f). DNA-binding analysis using electrophoretic mobility shift assays (EMSA) confirmed that all three mutant complexes are impaired for DNA binding, with the double-deletion mutant being the most deficient in this regard (Extended Data Fig. 5g,h).
We first tested purified BRCA1Δ467–696–BARD1, BRCA1–BARD1Δ124–270 and BRCA1Δ467–696–BARD1Δ124–270 with BLM using 2 kbp DNA as helicase substrate. Importantly, the results showed that all three mutant complexes are impaired in their ability to enhance DNA unwinding, with the BRCA1Δ467–696–BARD1Δ124–270 mutant exhibiting the strongest deficiency followed by BRCA1–BARD1Δ124–270 and then BRCA1Δ467–696–BARD1 (Extended Data Fig. 6a,b). Consistent with this observation, all three mutant complexes were less efficacious than the wild-type counterpart in the promotion of DNA end resection catalysed by BLM–DNA2, with the degree of functional impairment mirroring that seen in the DNA unwinding assay—that is, BRCA1Δ467–696–BARD1Δ124–270 > BRCA1–BARD1Δ124–270 > BRCA1Δ467–696–BARD1 (Extended Data Fig. 6c,d). With EXO1 also, the BARD1Δ124–270 mutation exerts a stronger impact on resection activity than BRCA1Δ467–696 (Extended Data Fig. 6e,f). From these results, we infer that the DNA-binding activity of both BRCA1 and BARD1 contributes towards the overall efficacy of BRCA1–BARD1 as an enhancer of EXO1 and BLM–DNA2. Interestingly, in the case of the WRN helicase, we saw no significant impairment by either the BRCA1–BARD1Δ124–270 or BRCA1Δ467–696–BARD1 mutation, although the double mutant did show a significant defect in this regard (Extended Data Fig. 6g,h).
Functional modules in BRCA1 and BARD1
Given the requirement of the BRCA1 and BARD1 DNA-binding domains for maximal efficacy of resection enhancement (see previous section), we wished to determine whether BRCA1467–696 and BARD1124–270 polypeptides could, on their own, influence the activity of the resection enzymes under study. We therefore proceeded to test BRCA1467–696 and BARD1124–270, which could be expressed and purified from Escherichia coli, for their potential influence on the DNA unwinding and resection activities of the enzymatic entities under study. Importantly, we found that both the BRCA1 and BARD1 fragments, at concentrations (50–200 nM) significantly higher than that of the BRCA1–BARD1 complex (2–8 nM), were able to upregulate both DNA unwinding (Extended Data Fig. 7a,b) and resection by BLM–DNA2 (Fig. 4a,b). Similarly, BRCA1467–696 could enhance WRN and WRN–DNA2 activities whereas BARD1124–270 exerted a lesser effect in this regard (Extended Data Fig. 7c,d and Fig. 4c,d). Notably, the BRCA1467–696 and BARD1124–270 fragments both physically interact with BLM (Extended Data Fig. 7e,f) and WRN (Extended Data Fig. 7g,h).
Fig. 4 |. Functionality of BRCA1467–696 and BARD1124–270 in DNA end resection.
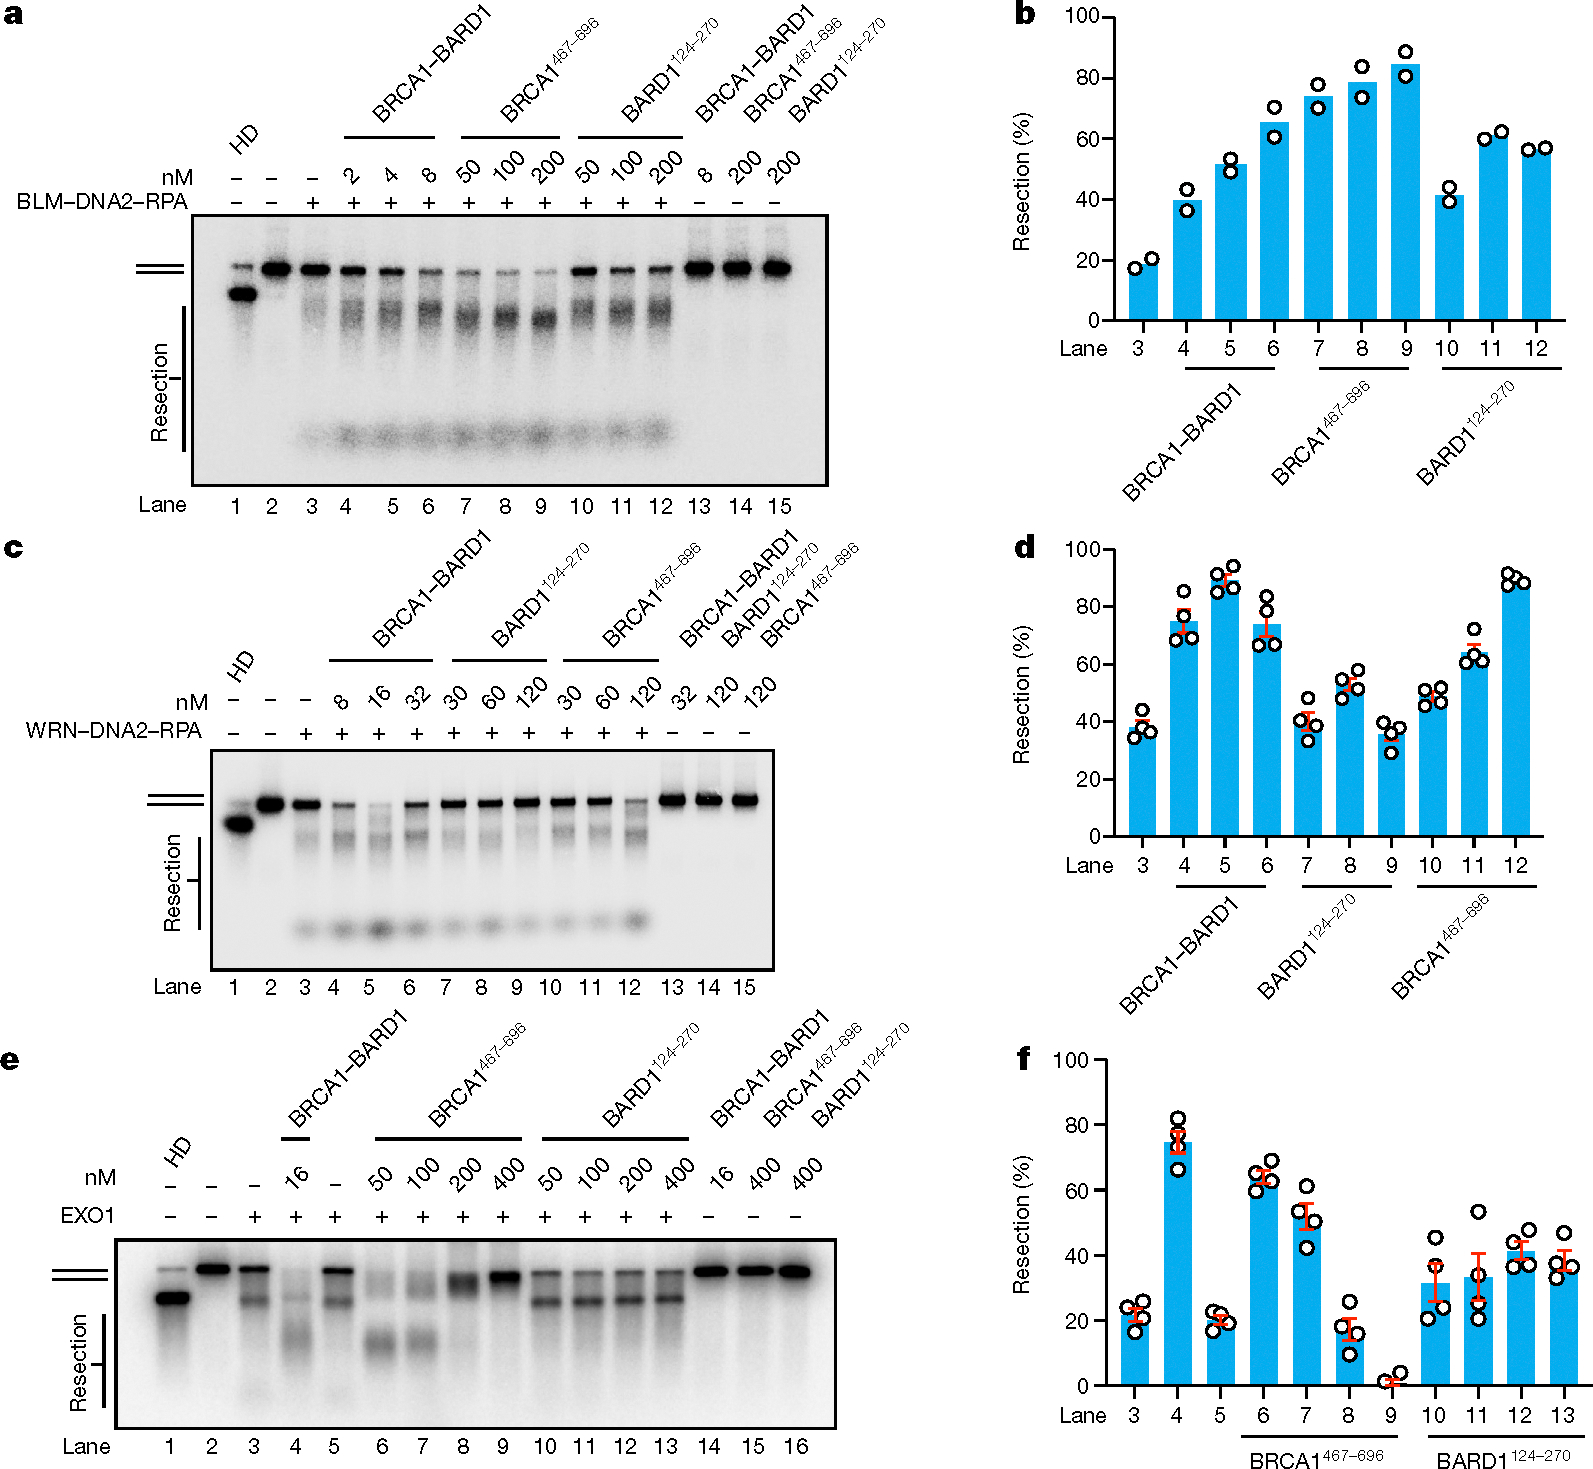
a, Testing the influence of BRCA1467–696 and BARD1124–270 alongside BRCA1–BARD1 on DNA end resection mediated by BLM (2 nM), RPA (200 nM) and DNA2 (15 nM) using the 32P-labelled, 2 kbp dsDNA substrate in a 30 min reaction. b, Quantification of results from a (n = 2). c, Testing the influence of BRCA1467–696 and BARD1124–270 alongside BRCA1–BARD1 on DNA resection mediated by WRN (2 nM), RPA (200 nM) and DNA2 (20 nM) using the 32P-labelled, 2 kbp dsDNA substrate in a 20 min reaction. d, Quantification of results from c. Error bars show mean ± s.e.m.; n = 4. e, Testing the influence of BRCA1467–696 and BARD1124–270 alongside BRCA1–BARD1 on DNA end resection mediated by EXO1 (2 nM) using the 32P-labelled, 2 kbp dsDNA substrate. Reaction time was 10 min. f, Quantification of results from e. Error bars show mean ± s.e.m.; n = 4. Uncropped gel images are provided in Supplementary Fig. 1. n, Number of independent experiments.
With EXO1, BRCA1467–696 was efficient at elevating nuclease activity when present at 50–100 nM, but higher concentrations of this BRCA1 polypeptide inhibited EXO1 activity. We note that the same concentrations of BARD1124–270 also stimulated EXO1 activity, but with no inhibition noted even at 400 nM of this BARD1 polypeptide (Fig. 4e,f). At their respective optimal concentrations, BRCA1467–696 exhibited higher efficacy in elevation of EXO1 activity than BARD1124–270.
Taken together, our results provide strong support for the notion that the BRCA1 and BARD1 DNA-binding domains represent stand-alone functional modules that act in a synergistic manner within the context of the BRCA1–BARD1 complex to upregulate all three branches of long-range DNA end resection.
Role of BARD1 DNA binding in resection
The results presented above support the premise that DNA binding by BRCA1 and BARD1 is crucial for the optimal efficiency of all three branches of long-range DNA end resection. Specifically, BRCA1–BARD1Δ124–270 showed greater defects than BRCA1Δ467–696–BARD1 in end resection mediated by BLM–DNA2 and EXO1. We therefore strived to identify a point mutant of BARD1 that is specifically impaired for DNA-binding activity to further address this premise. Based on sequence alignment among BARD1 orthologues, we selected a total of seven lysine residues that could conceivably be involved in electrostatic interactions with the phosphodiester backbone of DNA, within the middle portion of the BARD1124–270 fragment as mutagenesis targets. These lysine residues were changed in various combinations to glutamic acid to yield mutations 2KE, 3KE, 5KE and 7KE (Extended Data Fig. 8a). These mutant BARD1124–270 polypeptides could be expressed in soluble form and purified from E. coli (Extended Data Fig. 8b). Importantly, all four mutant polypeptides are impaired in DNA binding to varying degrees, with the 7KE mutant being the most defective in this regard (Extended Data Fig. 8c,d).
We next assembled the BRCA1–BARD17KE mutant complex in insect cells and purified it (Extended Data Fig. 8e) as a monodispersed species with the expected 1:1 subunit stoichiometry (Extended Data Fig. 8f). EMSA results showed that the BRCA1–BARD17KE mutant was significantly impaired for DNA binding (Extended Data Fig. 8g,h). Importantly, we verified that BRCA1–BARD17KE retained E3 ubiquitin ligase activity comparable to wild-type levels when tested with histone H2A as substrate (Extended Data Fig. 8i).
Additional salient analyses also showed that, even though BRCA1–BARD17KE interacted with EXO1 in affinity pulldown (Extended Data Fig. 9a), it was strongly impaired in its ability to upregulate EXO1 activity (Fig. 5a,b). Likewise we found that, whereas BRCA1–BARD17KE interacted with BLM (Extended Data Fig. 9b), the helicase attribute of BLM- and BLM–DNA2-mediated DNA end resection was largely unresponsive to the mutant complex (Fig. 5c–f). Taken together, these results provide direct evidence for an important role of BARD1 DNA-binding activity in the enhancement of BLM, BLM–DNA2 and EXO1.
Fig. 5 |. Testing of BRCA1–BARD17KE DNA-binding mutant in DNA end resection.
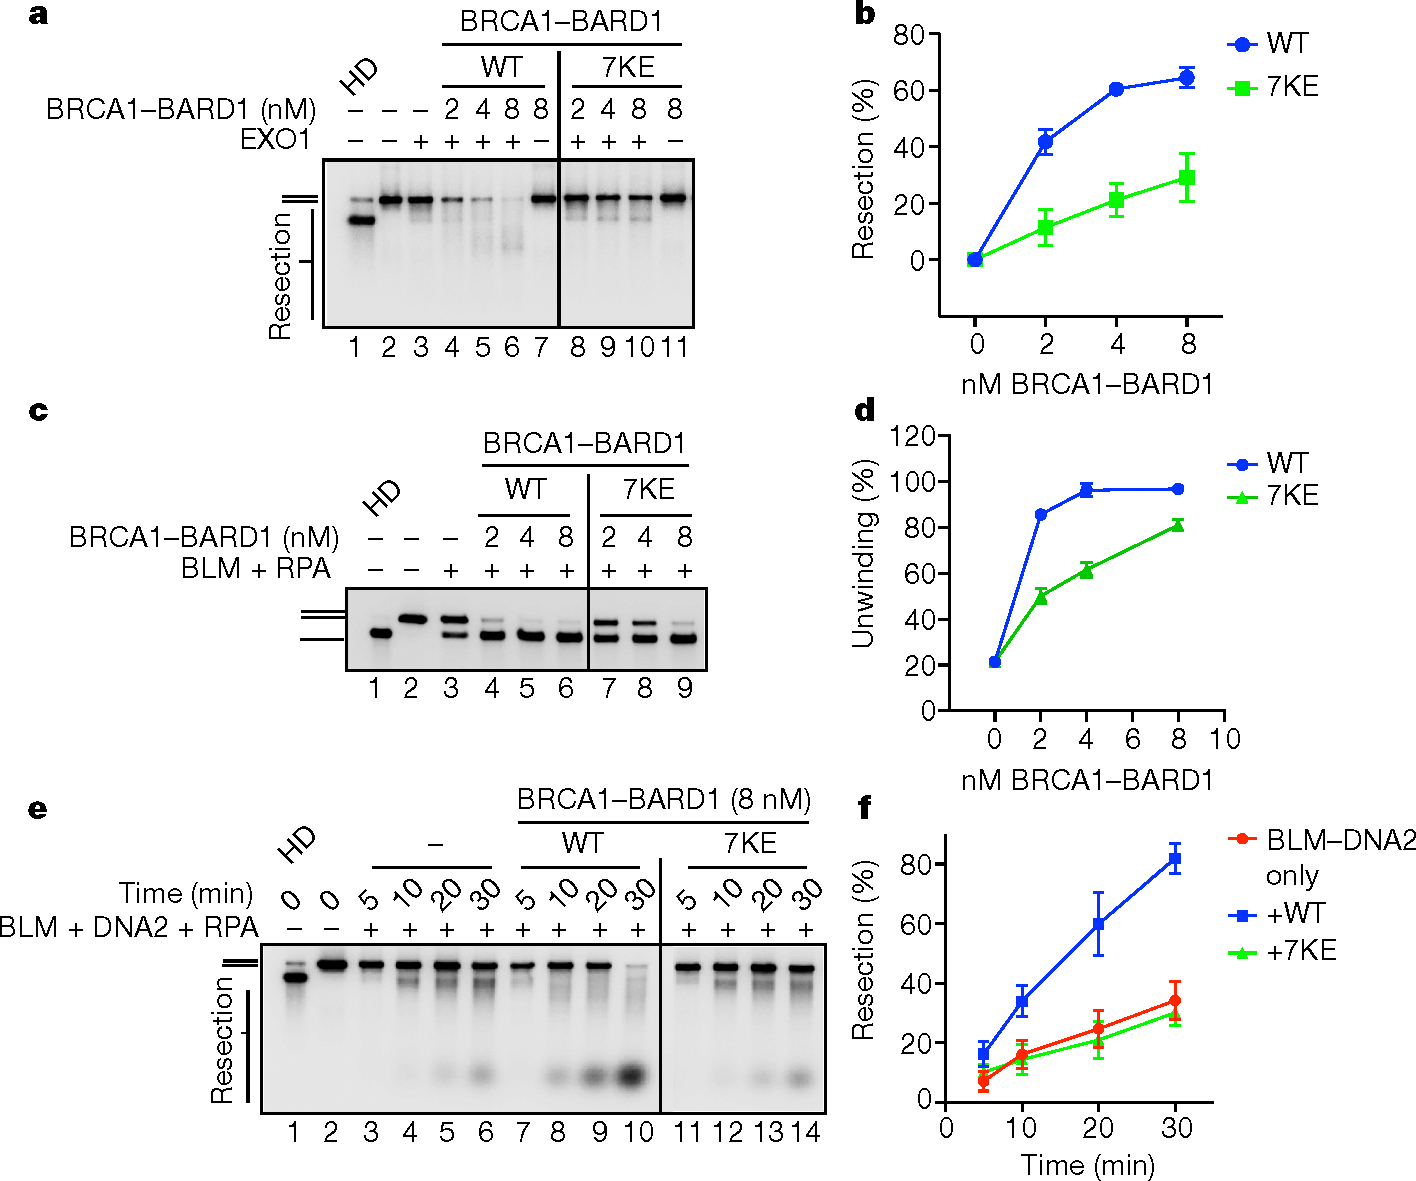
a, EXO1 (2 nM) was incubated with the 2 kbp, 32P-labelled dsDNA substrate with or without the indicated BRCA1–BARD1 species for 10 min and then analysed. b, Quantification of results from a. Error bars show mean ± s.e.m.; n = 3. c, Assessment of BLM (2 nM) and RPA (200 nM) helicase activity using the 2 kbp, 32P-labelled dsDNA substrate for 30 min with or without the indicated BRCA1–BARD1 species. d, Quantification of results from c. Error bars show mean ± s.e.m.; n = 3. e, DNA end resection was examined with BLM (2 nM), RPA (200 nM) and DNA2 (15 nM) using the 2 kbp, 32P-labelled substrate with or without BRCA1–BARD1 or BRCA1–BARD17KE for the indicated times. f, Quantification of results from e. Error bars show mean ± s.e.m.; n = 3. Uncropped gel images are provided in Supplementary Fig. 1. n, Number of independent experiments; WT, wild type.
Consistent with previous results (Extended Data Fig. 6g,h) showing that BRCA1-BARD1Δ124–270 is as proficient as wild-type BRCA1–BARD1 in enhancing DNA unwinding by WRN, our examination of BRCA1–BARD17KE showed that it retains the wild-type level of stimulatory activity in DNA unwinding and end resection involving WRN and WRN–DNA2, respectively (Extended Data Fig. 9c–f). The 7KE mutation in BARD1 does not affect interaction of BRCA1–BARD1 with WRN (Extended Data Fig. 9g).
Cellular role of BARD1 DNA binding
Next, we asked whether the BARD17KE mutation would affect DSB end resection in cells. For this purpose, we constructed HeLa cell lines expressing short hairpin RNA-resistant, Myc-tagged BARD1WT or BARD17KE wherein endogenous BARD1 can be efficiently depleted following doxycycline treatment22. We first confirmed by immunoblotting that BARD1WT and BARD17KE are expressed at an equivalent level (Extended Data Fig. 10a). Importantly, BARD1WT and BARD17KE form equivalent numbers of foci in nuclei following exposure to X-rays (Extended Data Fig. 10b). We also verified that BARD1WT- and BARD17KE-complemented cells do not exhibit any change in cell cycle profile (Extended Data Fig. 10c), before assessing the extent of DNA end resection in these cells by quantification of both RPA and BrdU foci to detect the generation of ssDNA23.
Depletion of endogenous BARD1 resulted in a severe defect in DNA end resection, as was evident from the decreased number of RPA and BrdU foci following exposure of cells to ionizing radiation. Importantly, the resection defect in these BARD1-depleted cells could be largely alleviated by ectopic expression of BARD1WT whereas BARD17KE expression was much less effective in this regard (Fig. 6a,b). Consequently, cells expressing BARD17KE also showed a defect in ionizing radiation-induced focal accumulation of RAD51 (Fig. 6c). Next, we irradiated cells expressing BARD1WT or BARD17KE and quantified the formation and dissolution of 53BP1 foci in G1 (cyclin A negative) versus S/G2 (cyclin A positive) nuclei to evaluate the overall kinetics of DSB repair17. Relative to BARD1WT, cells expressing BARD17KE showed no discernible defect in the dissolution of 53BP1 foci in G1 cells but exhibited persistent 53BP1 foci in S/G2 cells (Fig. 6d and Extended Data Fig. 10d), reflecting a defect in DSB repair in mutant cells. To test this directly, we used the established DR–GFP assay in which DSB repair by HR leads to the formation of a functional GFP gene24. As predicted, cells expressing BARD17KE showed diminished DSB repair capacity (Fig. 6e). Accordingly, clonogenic survival following irradiation was also reduced in BARD17KE mutant cells (Fig. 6f), and these cells showed an increase in chromatid breaks and radial chromosome structures (Fig. 6g). Together, these data establish that the DNA-binding activity of BARD1 is indispensable for DNA end resection in HR and, accordingly, for HR-mediated DSB repair in vivo.
Fig. 6 |. Cellular phenotypes of the BARD17KE mutant.
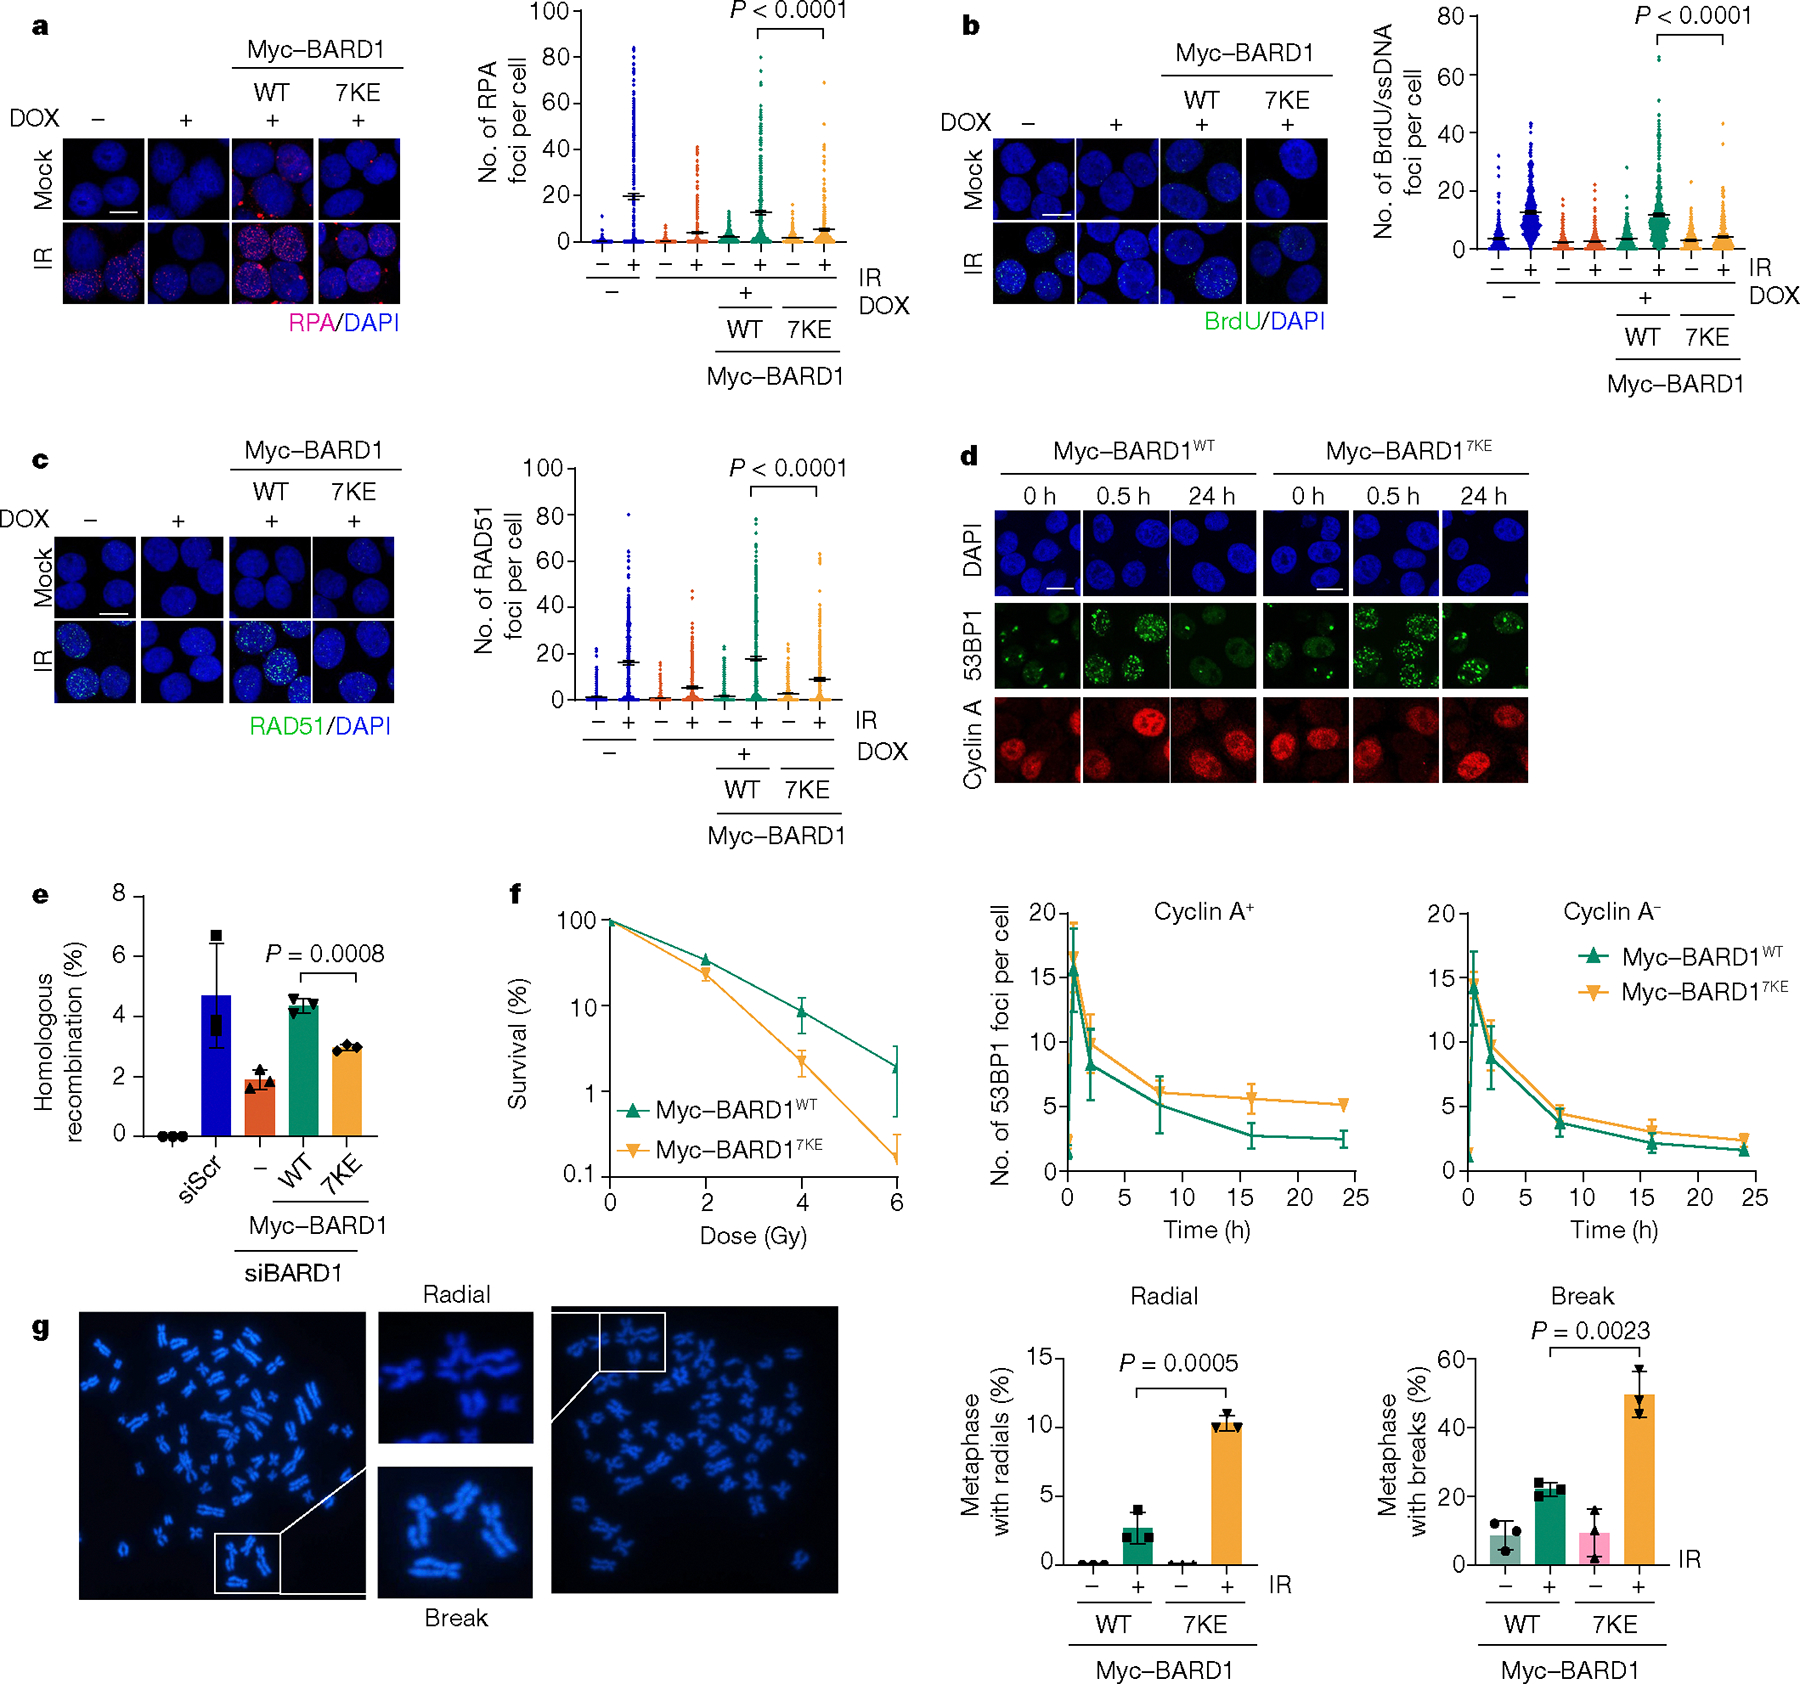
a, Representative images of mock-treated (Mock) and irradiated (IR) HeLa cells depleted of endogenous BARD1 by doxycycline treatment (DOX) and expressing BARD1WT or BARD17KE. Cells were immunostained with either anti-RPA antibody (red) or DAPI (blue) to identify nuclei. Error bars show mean ± s.e.m.; n = 3 (300 cells counted). b, Representative images of mock-treated and irradiated cells immunostained with anti-BrdU antibody (green) or DAPI (blue). Error bars show mean ± s.e.m.; n = 3 (300 cells counted). c, Representative images of mock-treated and irradiated cells immunostained with anti-RAD51 antibody (green) or DAPI (blue). Error bars show mean ± s.e.m.; n = 3 (431, 400, 404, 339, 386, 415, 418 and 373 cells counted (left to right)). d, Representative images of irradiated cells co-immunostained for 53BP1 foci (green) and cyclin A (red). Rates of DSB repair in S/G2 cells were determined by scoring 53BP1 foci in cyclin A-positive nuclei. The average number of 53BP1 foci remaining was plotted against the indicated time following ionizing radiation. Error bars show mean ± s.d.; n = 3. e, HR efficiency was measured by quantification of GFP expression in U2OS cells harbouring a DR–GFP reporter following transfection with an I-SceI plasmid. Cells were depleted of endogenous BARD1 using small interfering RNA (siBARD1) or a scrambled siRNA (siScr) and complemented with BARD1WT or BARD17KE. Error bars show mean ± s.d.; n = 3. f, Clonogenic survival of HeLa cells with knockdown of endogenous BARD1 and ectopic expression of BARD1WT or BARD17KE following exposure to the indicated doses of ionizing radiation. Error bars show mean ± s.d.; n = 3. g, Percentages of metaphase spreads with one or more radial chromosomes or breaks are plotted for irradiated HeLa cells with knockdown of endogenous BARD1 and ectopic expression of BARD1WT or BARD17KE. Error bars show mean ± s.d.; n = 3. In all cases, statistical analysis was performed using unpaired two-tailed Student’s t-test. P values are shown. Scale bars, 10 μm. n, Number of independent experiments.
Discussion
BRCA1–BARD1 is a pivotal regulator of both DNA end resection and DSB repair pathway choice, and super-resolution microscopy has shown sustained retention of BRCA1–BARD1 at DSBs25. BRCA1–BARD1 has been postulated to antagonize the 53BP1-dependent mechanism of HR restriction, which favours the selection of non-homologous DNA end joining as the DSB repair tool. Specifically, BRCA1–BARD1 has been suggested to alleviate the resection block imposed by the 53BP1 axis consisting of partner factors such as RIF1, the heterotrimeric CST (CTC1–STN1–TEN1) complex and the tetrameric Shieldin (SHLD1–SHLD2–SHLD3–REV7), via ubiquitination of histone H2A26. However, elimination of 53BP1 only partially restores the resection and HR defects of BRCA1−/− cells, indicating that BRCA1–BARD1 has roles beyond 53BP1 removal27. Consistent with this premise, we have shown that BRCA1–BARD1 interacts with RAD51 and enhances the recombinase activity of the latter, thus formally furnishing evidence for a role of BRCA1–BARD1 in HR steps downstream of 53BP1 removal8. Here, we identify another new role of BRCA1–BARD1 in direct upregulation of long-range DNA end resection via physical and functional interactions with key factors, namely BLM, WRN and EXO1, in all three branches of long-range resection.
Several salient features of BRCA1–BARD1-dependent resection control, as summarized in our working model (Extended Data Fig. 10e), are worth highlighting. First, BRCA1–BARD1 enhances the helicase activity of both BLM and WRN but not that of the budding yeast BLM orthologue Sgs1. Accordingly, and consistent with the premise of DNA strand separation being a rate-limiting step in DNA end resection, the inclusion of BRCA1–BARD1 leads to markedly higher resection efficacy of reactions catalysed by BLM–DNA2 or WRN-DNA2. Importantly, BRCA1–BARD1 also stimulates the activity of EXO1 but not that of structurally unrelated 5′–3′ exonucleases. Single-molecule data show that BRCA1–BARD1 travels with BLM–DNA2 as resection progresses and also facilitates the retention of EXO1 on the DNA substrate. Second, by analyses of various BRCA1–BARD1 deletion mutants, we can conclude that both BRCA1 and BARD1 are indispensable for optimal resection catalysed by EXO1, BLM–DNA2 and WRN–DNA2. Third, we have shown that DNA-binding fragments of BRCA1 and BARD1 are efficient at enhancing the efficacy of all three branches of long-range resection, and thus represent stand-alone functional modules that cooperate synergistically in DNA end resection. Finally, via isolation of the BARD17KE point mutant and companion biochemical and cellular analyses, we formally demonstrate the biological relevance of BARD1 DNA-binding activity in DNA end resection. Given that BRCA1–BARD1 also functionally interacts with RAD51 recombinase6, it is possible that the negative impact of BARD17KE mutation on HR efficiency entails altered functional interplay between BRCA1–BARD17KE and residual RAD51 at DSB sites.
The results described here are in concordance with those from the Cejka group28 showing enhancement of WRN and EXO1 by BRCA1–BARD1. Our findings also provide the requisite foundation to answer other important questions regarding the multifaceted role of BRCA1–BARD1 in DSB repair pathway choice. Notably, the reconstituted systems described in this study will be valuable for testing whether known negative regulators of DNA end resection, including the 53BP1 axis factors RIF1, the CST complex and Shieldin—which all possess DNA-binding activity—directly interfere with DNA end resection mediated by EXO1 and BLM/WRN in conjunction with DNA2, and, if so, how BRCA1–BARD1 may help overcome the restriction imposed by these 53BP1 axis factors. Our studies have important implications for the elucidation of cancer aetiology from the standpoint of understanding how dysfunction in BRCA1–BARD1 leads to oncogenesis, and how perturbations of the 53BP1 axis engender resistance to cancer therapeutics such as inhibitors of poly(ADP-ribose) polymerases.
Online content
Any methods, additional references, Nature Portfolio reporting summaries, source data, extended data, supplementary information, acknowledgements, peer review information; details of author contributions and competing interests; and statements of data and code availability are available at https://doi.org/10.1038/s41586-024-07910-2.
Methods
Protein purification
Cell lysate preparation and protein purification steps were carried out at 0–4 °C. Purified protein preparations were snap-frozen in liquid nitrogen and stored in 2–5 μl aliquots at −80 °C. Once thawed, proteins were kept on ice for no longer than 24 h and never refrozen.
BRCA1–BARD1 and mutants.
Point mutations were introduced into BRCA1–BARD1 by Quick Change using Pfu polymerase (Promega), and deletions were generated via PCR with Phusion polymerase (NEB) followed by ligation with T4 DNA Ligase (NEB). BRCA1–BARD1 and mutant variants of the complex were expressed in Tni or Sf9 insect cells and purified as described previously8.
BRCA1 and BARD1 fragments.
BRCA1 and BARD1 fragments tagged with His–SUMO were cloned into pET-TEV and expressed in E. coli Rosetta (DE3) cells. Cultures were grown in Luria-Bertani broth to an optical density (OD600) of 0.6 at 37 °C, induced with 0.5 mM isopropyl-β-d-thiogalactopyranoside (IPTG) and incubated for 16 h at 16 °C, and pellets were then harvested and stored at −80 °C. The extract was prepared by sonication in 50 ml of T buffer (25 mM Tris-HCl pH 7.5, 10% glycerol, 0.5 mM EDTA, 0.05% IGEPAL CA-630 (Sigma-Aldrich), 2 mM DTT and protease inhibitors: 1 mM phenylmethylsulfonyl fluoride and 5 μg ml−1 each of aprotinin, chymostatin, leupeptin and pepstatin) containing 500 mM KCl. Following centrifugation (45,000g for 45 min), clarified lysate was incubated with 2 ml of Ni-NTA resin (Qiagen) for 1 h. The resin was washed sequentially with 100 ml of T buffer with 1 M KCl, supplemented with 20 mM imidazole, 1 mM ATP and 2 mM MgCl2, and then with 20 ml of T buffer with 300 mM KCl. The resin was then incubated three times with 2 ml of T buffer containing 300 mM KCl and 200 mM imidazole for 10 min to elute proteins. Where indicated, the His–SUMO tag was cleaved by incubation with Ulp1 protease overnight at 4 °C. The BRCA1 and BARD1 protein fragments were then fractionated in a 24 ml Superdex 200 column (GE) in T buffer with 300 mM KCl, and concentrated using an Amicon device with a 10 kDa cut-off before storage.
His–EXO1–GFP.
The pESC–URA–His–EXO1–GFP expression plasmid was transformed into protease-deficient yeast expression strain JEL-1. Yeast culture was grown in basic medium minus uracil (0.17% yeast nitrogen base, 0.5% ammonium sulfate, 2% sodium lactate, 3% glycerol and 0.87 g l−1 amino acid mix without uracil) at 30 °C to OD 1.0 and was induced by the addition of 2% galactose for 12 h at 30 °C. Cells were then harvested by centrifugation at 4 °C. All subsequent steps were performed at 4 °C, and care was taken to minimize sample exposure to light. Cells were resuspended in 40 ml of cell lysis buffer (50 mM Tris-HCl pH 7.5, 500 mM NaCl, 10% glycerol, 1 mM tris(2-carboxyethyl)phosphine, protease inhibitor cocktail (Roche, catalogue no. 05892988001) and 2 mM EDTA) and mixed with 40 ml of glass beads (425–600 μm, Sigma). Cells were lysed by vortexing ten times for 30 s each time, and samples were chilled on ice for 2 min between each cycle. Clarified lysate was mixed with Ni-NTA resin (Qiagen) for 2 h, followed by protein elution with buffer E (20 mM Tris-HCl pH 7.5, 150 mM KCl, 10% glycerol and 1 mM tris(2-carboxyethyl)phosphine) containing 150 mM imidazole. Fractions containing EXO1–GFP were pooled and further purified through a heparin column (Amersham) using a 50 ml gradient of 15–650 mM KCl in buffer T. Fractions containing the GFP–EXO1 peak were concentrated before storage.
EXO1 fragments.
GST–EXO11–346 and GST–EXO1347–846 in pESC–URA were transformed into the JEL-1 stain, and cell pellets and lysates were prepared as described for GFP–EXO1. Clarified cell lysates were affinity purified using glutathione resin followed by further purification in Source Q and heparin columns (Amersham) with a 50 ml gradient of 150–650 mM KCl. Fractions containing EXO1 fragments were further purified in a Superdex 200 size exclusion column in buffer T containing 150 mM KCl. Peak fractions were concentrated before storage.
BLM, Sgs1, DNA2, yDna2, EXO1, yExo1, WRN and RPA were expressed and purified as previously described29–33. RPA–mCherry, GFP–BLM and mCherry–BLM were purified as previously described34.
BLM fragments.
GST-tagged BLM fragments were expressed in E. coli Rosetta (DE3) cells. Cultures were grown in Luria-Bertani medium to OD600 0.6 at 37 °C, induced with 0.5 mM IPTG and incubated for 16 h at 16 °C. Cells were harvested by centrifugation and stored at −80 °C. Cells were then resuspended in 50 ml of T buffer with protease inhibitors and containing 500 mM KCl. Following centrifugation at 45,000g for 45 min, the clarified lysate was incubated with 2 ml of glutathione agarose resin for 1 h. The resin was sequentially washed with 100 ml of T buffer containing 1 M KCl, 1 mM ATP and 2 mM MgCl2, followed by 20 ml of T buffer with 300 mM KCl. The resin was then incubated three times with 2 ml of T buffer containing 300 mM KCl and 10 mM glutathione for 10 min each to elute the proteins. The eluate containing the BLM fragment was concentrated in an Amicon device with 10 kDa cut-off before being fractionated in a 24 ml Superdex 200 column (GE) in T buffer with 300 mM KCl. Peak fractions were pooled and concentrated before storage.
The WRN–K577A helicase mutant35 was generated by site-directed mutagenesis using primers PSOL11822 and PSOL11823 (Supplementary Table 1). His–WRN–FLAG and His–WRN–K577A–FLAG were purified as previously described36.
Purification of UBE1, UBE2D3 and H2A.
Plasmids for His6–UBE1-, His6–UBE2D3- and His6–VSVG-tagged human H2A were transformed into E. coli BL21 (DE3) cells and cultured at 37 °C in Luria-Bertani liquid medium to OD 0.6, followed by induction with 0.5 mM IPTG and culture overnight at 16 °C before harvesting of cell pellets. All steps from cell lysis and protein purification were performed at 0–4 °C. The cell pellet was suspended in 50 ml of buffer T containing 300 mM KCl, and lysate was prepared by sonication. Following centrifugation (45,000 rpm for 45 min), the clarified lysate was passed though a HisTrap HP column (Cytiva) and protein was eluted in an imidazole gradient (20–200 mM). Eluted protein was subjected to ion exchange chromatography with a HiTrap Q HP (Cytiva) followed by size exclusion on a Superdex 200 column (GE). Purified protein was concentrated in an Amicon concentrator with either 100 kDa cut-off (UBE1 and UBE2D3) or 10 kDa cut-off (H2A), and stored in small aliquots at −80 °C. Ubiquitin was purchased from R&D systems (catalogue no. U 100-H 10-M).
DNA substrates
The 2 kbp dsDNA substrate has been described previously33. The 32P, 3′-end-labelled, 80-base-pair dsDNA substrate used for EXO1 assays was made by hybridization of PSOL12135 and PSOL12136 (Supplementary Table 1) and slow cooling from 95 °C to room temperature over the course of 3 h. For 3′ end labelling, the annealed substrate was subjected to fill-in synthesis with Klenow fragment (exo-) (NEB) and [α−32P]-dCTP, and excess dCTP was removed using a Bio-Spin 6 column (Bio-Rad). 5′ 32P labelling (80 base pairs) was done using the annealed product of PSOL11894 and PSOL12165 (Supplementary Table 1) by treatment with polynucleotide kinase (NEB) and γ−32P-ATP. Substrate was separated from non-annealed oligonucleotides on a native 10% acrylamide gel in TBE buffer (100 mM Tris-borate pH 7.6 and 1 mM EDTA) at 4 °C, electroeluted from gel slices and concentrated in an Amicon device with 30 kDa cut-off. For DNA2 nuclease assay, the 3′ Cy5-labelled Y substrate (31-base-pair dsDNA and 44 nt overhang) annealed product of PSOL13487 (Supplementary Table 1) was used.
Helicase assays, resection assays and EMSA
Standard DNA helicase and end resection assays with BLM, WRN, Sgs1 and DNA2, RPA and yRPA were performed at 37 °C (30 °C for Sgs1-yRPA) in buffer R (20 mM Na-HEPES pH 7.5, 2 mM ATP, 0.1 mM DTT, 100 μg ml−1 bovine serum albumin (BSA), 0.05% Triton X-100, 2 mM MgCl2 and either 100 or 50 mM KCl for BLM and WRN, respectively, containing the 32P-labelled, 2 kbp DNA substrate (0.5 nM ends). Testing of BRCA1–BARD1 and RPA on the nuclease activity of DNA2 was conducted in the same buffer with 3′ Cy5-labelled Y DNA (5 nM) as substrate. All reactions containing BLM, WRN or Sgs1 also included an ATP-regenerating system consisting of 10 mM creatine phosphate and 50 μg ml−1 creatine kinase. EXO1 was tested with the 32P-labelled, 2 kbp dsDNA substrate under the same conditions. We also examined EXO1 and BRCA1–BARD1 with an 80-base-pair dsDNA (2.5 nM) either 3′ or 5′ end-labelled with 32P. The ATP-regenerating system was omitted from these EXO1 reactions. Similarly, yeast Exo1, lambda exonuclease and T7 exonuclease were tested with BRCA1–BARD1. An equal volume of SDS (0.4%) and proteinase K (0.5 μg μl−1), with Orange G dye (0.16%) and glycerol (20%), was added to the reactions at the end of incubation. Following deproteinization (5 min at 37 °C), unreacted substrate and reaction products were separated on either agarose gels (for the 2 kbp substrate) run in TAE buffer (40 mM Tris-acetate pH 7.4 and 0.5 mM EDTA) or acrylamide gels (for oligonucleotide-based substrates) in TBE buffer. Gels were dried onto Hybond membrane on top of Whatman filter paper (GE) and then analysed in a Typhoon Imager (Cytiva). For EMSA, the indicated amount of 5′ Cy5 dsDNA 80 base pairs (PSOL13337) (Supplementary Table 1) was incubated with BRCA1–BARD1 on ice for 10 min and nucleoprotein complexes were resolved on a 6% TBE gel. BRCA1 and BARD1 DNA-binding fragments were incubated with 5′ Cy5 dsDNA for 15 min at 37 °C and resolved on 6% TAE gel.
Affinity pulldown assay
Affinity-tagged ‘bait’ protein was mixed with an equimolar amount of ‘prey’ protein and TurboNuclease (Sigma, no. T4330) for 1 h in 20 μl of buffer (30 mM Tris-HCl pH 7.5 and 0.5 mM EDTA) with 100 mM KCl at 4 °C. Next, 5 μl of the indicated resin was gently mixed with the reaction for 30 min at 4 °C. The resin was pelleted and washed twice with 100 μl of the same buffer before bound proteins were released from the resin with SDS–PAGE sample buffer and then analysed following electrophoresis by Coomassie blue staining or immunoblotting with the indicated antibody (Supplementary Table 1).
ATPase assay
Either BLM (10 nM) or DNA2 (100 nM) was incubated with or without BRCA1–BARD1 (100 nM) and unlabelled 2 kbp dsDNA (64 nM ends) in 10 μl of buffer containing 20 mM HEPES-KOH pH 7.5, 5 mM magnesium acetate, 1 mM DTT, 0.2 mM ATP and 0.4 μCi γ−32P-ATP. At the indicated times, 2 μl of the reaction mixture was withdrawn and mixed with an equal volume of 0.5 M EDTA to halt ATP hydrolysis. ATP hydrolysis was examined by thin-layer chromatography using PEI cellulose (Select Scientific) developed in 0.15 M formic acid and 0.15 M LiCl, followed by phosphorimaging analysis in a Typhoon phosphorimager (Cytiva) and quantification with ImageQuant software.
Mass photometry
Mass photometry analysis in this study followed previously established procedures as described in ref. 37 and was performed with a Refeyn TwoMP instrument. Proteins were diluted in 1× PBS buffer to reach a final concentration of 5 nM, data were collected with AcquireMP software (Refeyn) and mass distribution was analysed using DiscoverMP software (Refeyn) v.1.45.0. This analysis yielded mass values for each individual detected particle, which were then plotted as normalized counts.
Ubiquitination assay
The ubiquitination reaction (10 μl) contained 50 nM UBA1, 0.5 μM UBE2D3, 180 nM VSVG-tagged H2A and 10 μM ubiquitin in buffer comprising 25 mM Tris-HCl pH 7.5, 0.01% IGEPAL CA-630, 0.5 mM DTT, 100 μg ml−1 BSA, 100 mM KCl, 2.5 mM MgCl2 and 2.5 mM ATP. Following incubation at 37 °C for 60 min, the reaction was halted by the addition of an equal volume of 2× SDS–PAGE sample buffer. Immunoblotting was performed to detect ubiquitinated H2A with HRP anti-VSVG tag antibody (abcam, no. ab3556; Supplementary Table 1).
Single-molecule DNA curtain analyses
All experiments were conducted with a prism-type total internal reflection fluorescence microscope (Nikon) equipped with a 488 nm laser (Coherent Sapphire, 200 mW), a 561 nm laser (Coherent Sapphire, 200 mW) and two Andor iXon EMCCD cameras. The λ DNA substrate for single-molecule assays contained a 30 nt 3′ overhang that was made by annealing the oligonucleotide PSOL13464 (Supplementary Table 1) to the end of the λ DNA. Flow cells and dsDNA curtains were prepared as previously described34,38. In brief, lipid bilayers were prepared with 91.5% 1,2-dioleoyl-sn-glycero-3-phosphocholine (Avanti Polar Lipids, catalogue no. 850375 C), 0.5% biotinylated-1-palmitoyl-2-oleoyl-sn-glycero-3-phosphoethanolamine (Avanti Polar Lipids, catalogue no. 860562 C) and 8% mPEG 2000–1,2-dioleoyl-sn-glycero-3-phosphoethanolamine-N-[4-(p-(cysarginylglycyl–aspartate–maleimidomethyl) cyclohexane-carboxamide] (Avanti Polar Lipids, catalogue no. 880130 C), and deposited onto the surface of the sample chamber as described. The biotinylated λ DNA substrate bearing a 30 nt 3′ end overhang was then injected into the sample chamber and attached to the bilayer through a biotin–streptavidin linkage. The flow cell was then connected to a microfluidic system and sample delivery controlled using a syringe pump (Kd Scientific). All experiments were performed at 37 °C.
For BLM experiments, BLM (0.05 nM), GFP–BLM (0.2 nM), mCherry–BLM (0.05 nM), 0.4 nM DNA2 or GFP–DNA2, 2 nM RPA or GFP–RPA in BLM buffer (20 mM Tris-HCl pH 7.5, 1 mM MgCl2, 2 mM ATP, 1 mM DTT and 0.2 mg ml−1 BSA) was injected into the flow cell through a 150 μl loop at a flow rate of 0.15 ml min−1. Next, 2 ml of BLM salt buffer (20 mM Tris-HCl pH 7.5, 1 mM MgCl2, 2 mM ATP, 1 mM DTT, 0.2 mg ml−1 BSA and 100 mM NaCl) was injected into the sample chamber at a flow rate of 1 ml min−1. Reactions were initiated by injection of the indicated proteins (0.2 nM DNA2, 2 nM RPA–mCherry with or without 0.2 nM BRCA1–BARD1) in BLM buffer at 0.25 ml min−1.
For GFP–EXO1 experiments, GFP–EXO1 (0.2 nM) in EXO1 buffer (20 mM Tris-HCl pH 7.5, 1 mM MgCl2, 2 mM ATP, 1 mM DTT, 0.2 mg ml−1 BSA and 60 mM NaCl) was injected into the flow cell through a 150 μl loop at a rate of 0.15 ml min−1. Flow rate was increased to 0.25 ml min−1 with or without 0.2 nM BRCA1–BARD1 in EXO1 buffer. For GFP–EXO1 end-binding retention assays, GFP–EXO1 (0.2 nM) either alone or with BRCA–BARD1 (0.2 nM) was injected into the flow cell in EXO1 buffer and chased with RPA–mCherry (2 nM) in EXO1 buffer with no NaCl.
End-resection assays containing BRCA1–BARD1–GFP were performed at 37 °C in BLM buffer. The set-up of the experiment was as follows: first, 0.2 nM BLM was injected into the flow cell through a 150 μl loop and incubated for 5 min. Then, 0.2 nM of BRCA1–BARD1–GFP was flowed into the sample chamber at a rate of 1 ml min−1 for 4 min, followed by a salt wash with BLM buffer containing 100 mM NaCl for 2 min at a flow rate of 1 ml min−1. The flow cell was re-equilibrated by flowing in BLM buffer for 1 min at a rate of 1 ml min−1. Resection was initiated by the addition of 0.2 nM DNA2 and 2 nM RPA–mCherry at a flow rate of 0.25 ml min−1 and monitored by collection of images at one frame per 20 s. Single-molecule data were collected using NIS-Elements v.5.11 (Nikon)
Single-molecule data analysis
Raw TIFF images were imported as image stacks into ImageJ (v.1.54 J) and images corrected for drift using the StackReg function in ImageJ. Kymographs were then generated from the corrected image stacks by defining a one-pixel-wide region of interest encompassing individual dsDNA molecules, and these kymographs were used for analysis of processivity, velocity and survival probability as previously described34. For evaluation of the binding distribution of BRCA1–BARD1–GFP, DNA was fully extended at a flow rate of 0.25 ml min−1 and the mean length of DNA was observed to be 14.7 ± 0.3 μm imaged at ×60 magnification, showing that each DNA spanned a distance of around 55 pixels. The total length of the λ DNA substrate, including 30 nucleotide 3′ overhang, is 48,532 base pairs, which corresponds to the measured length of 882 base pairs of DNA per pixel. The distance of BRCA1–BARD1–GFP was measured on fully extended DNA and binding distribution plotted following bootstrap analysis.
Cell culture and irradiation
HeLa cells were acquired directly from ATCC. HeLa Dox-shBARD1 (ref. 22), STR-authenticated U2OS–DR–GFP cells (a gift from J. Stark) were maintained in DMEM medium supplemented with 10% fetal bovine serum and penicillin/streptomycin in a humidified atmosphere with 5% CO2. Cells were irradiated using the X-Rad320 irradiator (Precision X-ray). All cell lines were tested for mycoplasma contamination and found to be free of contamination.
Cell transfection
BARD1 protein levels were depleted by treatment with doxycycline for 3 days in HeLa–Dox-shBARD1. In U2OS–DR-GFP cells, transient depletion of BARD1 was carried out by transfection with BARD1 siRNA (GTCATTGTACTGTTTTTAATGTTCA; Sigma) using Lipofectamine RNAiMAX (Invitrogen). Cells were transfected with scrambled siRNA as control. For ectopic expression of BARD1 in cells with knockdown of endogenous BARD1, cells were transfected with Myc–BARD1–pcDNA using Lipofectamine 2000 (Invitrogen).
Flow cytometry
Cells were fixed at 3 h post IR and stained with propidium iodide. Cell cycle stage was determined by flow cytometry using the BD LSR II Flow Cytometer (Becton Dickinson). Data were analysed using FlowJo v.10.8.1.
Immunofluorescence staining
Cells were seeded onto chamber slides (Falcon) and irradiated with 6 Gy of X-rays. For RPA foci, cells were incubated for 3 h and then first pre-extracted with buffer I (10 mM PIPES pH 7.0, 100 mM NaCl, 300 mM sucrose, 3 mM MgCl2, 1 mM EGTA and 0.5% Triton X-100) and then with buffer II (10 mM Tris pH 7.5, 10 mM NaCl, 3 mM MgCl2, 1% Tween-40 and 0.5% sodium deoxycholate), as previously described23. Cells were fixed with 4% paraformaldehyde/PBS and permeabilized with 0.5% Triton X-100 before incubation with anti-RPA antibody. For RAD51 foci, cells were immunostained with anti-RAD51 antibody 4 h following irradiation, as previously described39. For quantification of DSB repair kinetics, cells were irradiated with 1 Gy of X-rays and co-immunostained with anti-53BP1 antibody and Cyclin A antibody at different time points post IR. Images were captured using a Zeiss LSM710 confocal fluorescence microscope (×40 objective lens). At least 300 nuclei from three independent experiments were scored to determine the numbers of RPA, RAD51 and 53BP1 foci. Statistical analysis was carried out using GraphPad Prism software. See Supplementary Table 1 for details of antibodies used. Data were analysed using ImageJ.
BrdU/ssDNA assay
Cells grown in the presence of 10 μM BrdU (Sigma, catalogue no. B5002) for 16 h were treated with 6 Gy of X-rays and incubated for 3 h, subjected to pre-extraction and immunofluorescence stained with anti-BrdU antibody under non-denaturing conditions (for detection of BrdU incorporated into ssDNA), as previously described23. Images were captured using a Zeiss LSM710 confocal fluorescence microscope (×40 objective lens). The numbers of BrdU/ssDNA foci were determined after scoring at least 300 nuclei from three independent experiments. See Supplementary Table 1 for details of antibodies used.
Immunoblotting and antibodies
Whole-cell extracts were prepared by resuspension of cell pellets in lysis buffer (67.5 mM Tris pH 6.8, 25 mM NaCl, 0.5 mM EDTA, 12.5% glycerol, 0.25% SDS and 1 mM DTT). The following primary antibodies were used: BARD1 (abcam), Myc and beta-actin (Proteintech); the following secondary antibodies were used: horseradish peroxidase-conjugated secondary antibodies (Cell Signaling). See Supplementary Table 1 for details of antibodies used.
DR–GFP reporter assay
For measurement of HR efficiency, GFP expression in U2OS cells with an integrated DR–GFP reporter was quantified by flow cytometry. Cells were depleted of endogenous BARD1 using siRNA and transfected with the Myc–BARD1 (wild-type or 7KE) expression plasmid; after 24 h, cells were transfected with an I-SceI expression vector and GFP expression was quantified by flow cytometry after an additional 72 h. GFP-positive frequencies were corrected for transfection efficiencies (quantified by parallel transfection with a wild-type GFP expression vector).
Colony formation assay
Cells were plated in triplicate onto 60 mm dishes (500 cells per dish) and irradiated 4 h later with graded doses of radiation. Surviving colonies were stained with crystal violet approximately 10–14 days later, as previously described40
Metaphase chromosome preparations
Cells were treated with 4 Gy of X-rays and incubated for 8 h, after which the medium was replaced with colcemid (Sigma) along with 1 mM caffeine (Sigma), to bypass G2/M arrest. Metaphase chromosome spreads were prepared 16 h later, as previously described41.
Statistical analysis
For single-molecule assays, error bars in velocity and processivity data (Fig. 3c,d,f,g and Extended Data Fig. 4b,c,e,f) represent standard deviation of the mean calculated from three independent experiments. For binding distribution assays (Fig. 3i and Extended Data Fig. 4m,n), error bars represent 95% confidence intervals calculated from bootstrap analysis of the data. The n values for each of the experiments are presented in the corresponding figure panels reporting the number of single DNA molecules analysed for each experiment; the cumulative number provided is from at least three separate flow cells. P values for biochemical assays were calculated using a two-tailed Student’s t-test. For the DR–GFP reporter assay (Fig. 6e), the percentages of GFP-positive cells were calculated by analysis of at least 10,000 cells. Data points represent mean ± s.d. from three independent experiments. Data points for the metaphase spread assay (Fig. 6g) represent mean ± s.d. from three independent experiments. At least 50 metaphases were scored for each data point. P values for cellular assays were calculated using Student’s t-test for all experiments.
Extended Data
Extended Data Fig. 1 |. Influence of BRCA1-BARD1 on BLM and DNA2 activities.
a, SDS-PAGE analysis of BRCA1-BARD1 purified as described6. b, Mass photometry profile of BRCA1-BARD1, n = 3. c, Testing of BLM helicase mutant with BRCA1-BARD1. BRCA1-BARD1 was incubated with wild-type (8 nM) or the K695R (8 nM) variant of BLM and RPA (200 nM) with the 32P-labeled 2-kbp dsDNA substrate, n = 2. d, BRCA1-BARD1 (100 nM) was tested for its influence on ATP hydrolysis by BLM (10 nM). Following incubation of proteins with γ32P-ATP and unlabeled 2-kbp dsDNA (64 nM ends), reactions were analyzed by thin layer chromatography, n = 3. e, BRCA1-BARD1 was tested for its effect on the unwinding of a 2-kbp 32P-labeled dsDNA by Sgs1 (25 nM) and yRPA (200 nM) in a 20 min reaction. HD, heat-denatured DNA. Error bars show mean ± SEM; n = 3. f, BRCA1-BARD1 (20 nM) and DNA2 were incubated with 3′ Cy5-labeled Y DNA with and without RPA (20 nM) and then analyzed, n = 3. g, BRCA1-BARD1 (100 nM) was tested for its effect on ATP hydrolysis by DNA2 (100 nM). Reactions were analyzed following incubation of proteins with γ32P-ATP and unlabeled 2-kbp dsDNA (64 nM ends), n = 2. h, BRCA1-BARD1 (10 nM), BLM (1 nM), DNA2 (15 nM), RPA (200 nM) were incubated with the 32P-labeled 2-kbp dsDNA substrate. Reactions were subjected to heat denaturation prior to gel electrophoresis for 2 h followed by data quantification. Error bars show mean ± SEM; n = 3. i, dsDNA or j, ssDNA generated by heat denaturation of the dsDNA substrate was incubated with BLM (1 nM), DNA2 (15 nM), RPA (200 nM) with or without BRCA1-BARD1 (10 nM). Results were quantified and plotted. Error bars show mean ± SD; n = 3. In k, results from the 10 min and 15 min time points of experiments in panel i and j were graphed. n=number of independent experiments. Uncropped gel images are provided in Supplementary Fig. 1.
Extended Data Fig. 2 |. Characterization of WRN-DNA2 resection stimulation by BRCA1-BARD1.
a, His6-tagged BRCA1-BARD1 was tested for DNA2 interaction by affinity pulldown using Talon resin (specific for the His6 tag). The supernatant (S), wash (W) and SDS eluate (E) fractions were analyzed by SDS-PAGE and Coomassie blue staining, n = 2. b, c, Interaction between BRCA1-BARD1 and BLM fragments was assessed by affinity pulldown. Indicated GST-tagged BLM fragments immobilized on glutathione resin were incubated with BRCA1-BARD1. Proteins were eluted from the resin and analyzed by SDS-PAGE with Coomassie blue staining. S, supernatant and E, SDS eluate of resin, n = 2. d, Wild-type WRN (2 nM) or WRNK577A (2 nM) was tested with BRCA1-BARD1, RPA (200 nM), and the 2-kbp 32P-labeled dsDNA for helicase activity, n = 2. e, Effect of BRCA1-BARD1 (10 nM) on DNA end resection mediated by WRN (2 nM)-DNA2 (20 nM), RPA (200 nM), reaction mixtures were subjected to heat denaturation prior to gel electrophoresis for 2 h followed by data quantification. Error bars show mean ± SEM; n = 4. f, dsDNA or g, ssDNA generated by heat denaturation of the 2-kbp dsDNA substrate was incubated with WRN (2 nM), DNA2 (20 nM), RPA (200 nM) with or without BRCA1-BARD1 (10 nM) for the indicated times. Results from each dsDNA resection or ssDNA digestion experiment were quantified and plotted. Error bars show mean ± SD; n = 3. h, results from the 10 min and 15 min time points of experiments testing WRN-DNA2 from panel f and g were plotted as bar graphs. HD, heat-denatured DNA substrate. n=number of independent experiments. Uncropped gel images are provided in Supplementary Fig. 1.
Extended Data Fig. 3 |. Stimulation of EXO1 by BRCA1-BARD1.
a, BRCA1-BARD1 and EXO1 (5 nM) were incubated with 3′ 32P-labeled 80-mer dsDNA (2.5 nM) for 10 min and then analyzed. The results were quantified and plotted. Error bars show mean ± SEM; n = 3. b, Influence of BRCA1-BARD1 on removal of the 5′ nucleotide by EXO1 (5 nM). BRCA1-BARD1 and EXO1 were incubated with 5′ end labeled 30-mer dsDNA (2.5 nM) for 10 min and then analyzed. The results were quantified and plotted. Error bars show mean ± SEM; n = 3. c, BRCA1-BARD1 and yExo1 (5 nM) were incubated with 3′ 32P-labeled 80-mer dsDNA for 10 min and then analyzed. The results were quantified and plotted. Error bars show mean ± SEM; n = 3. d, e, BRCA1-BARD1 was tested with Lambda or T7 exonuclease (0.5 U) (NEB) using the 3′ 32P-labeled 80-mer dsDNA (2.5 nM) for 10 min and then analyzed. The results were quantified and plotted. Error bars show mean ± SEM; n = 3. n=number of independent experiments. Uncropped gel images are provided in Supplementary Fig. 1.
Extended Data Fig. 4 |. Single molecule analysis of Sgs1-Dna2.
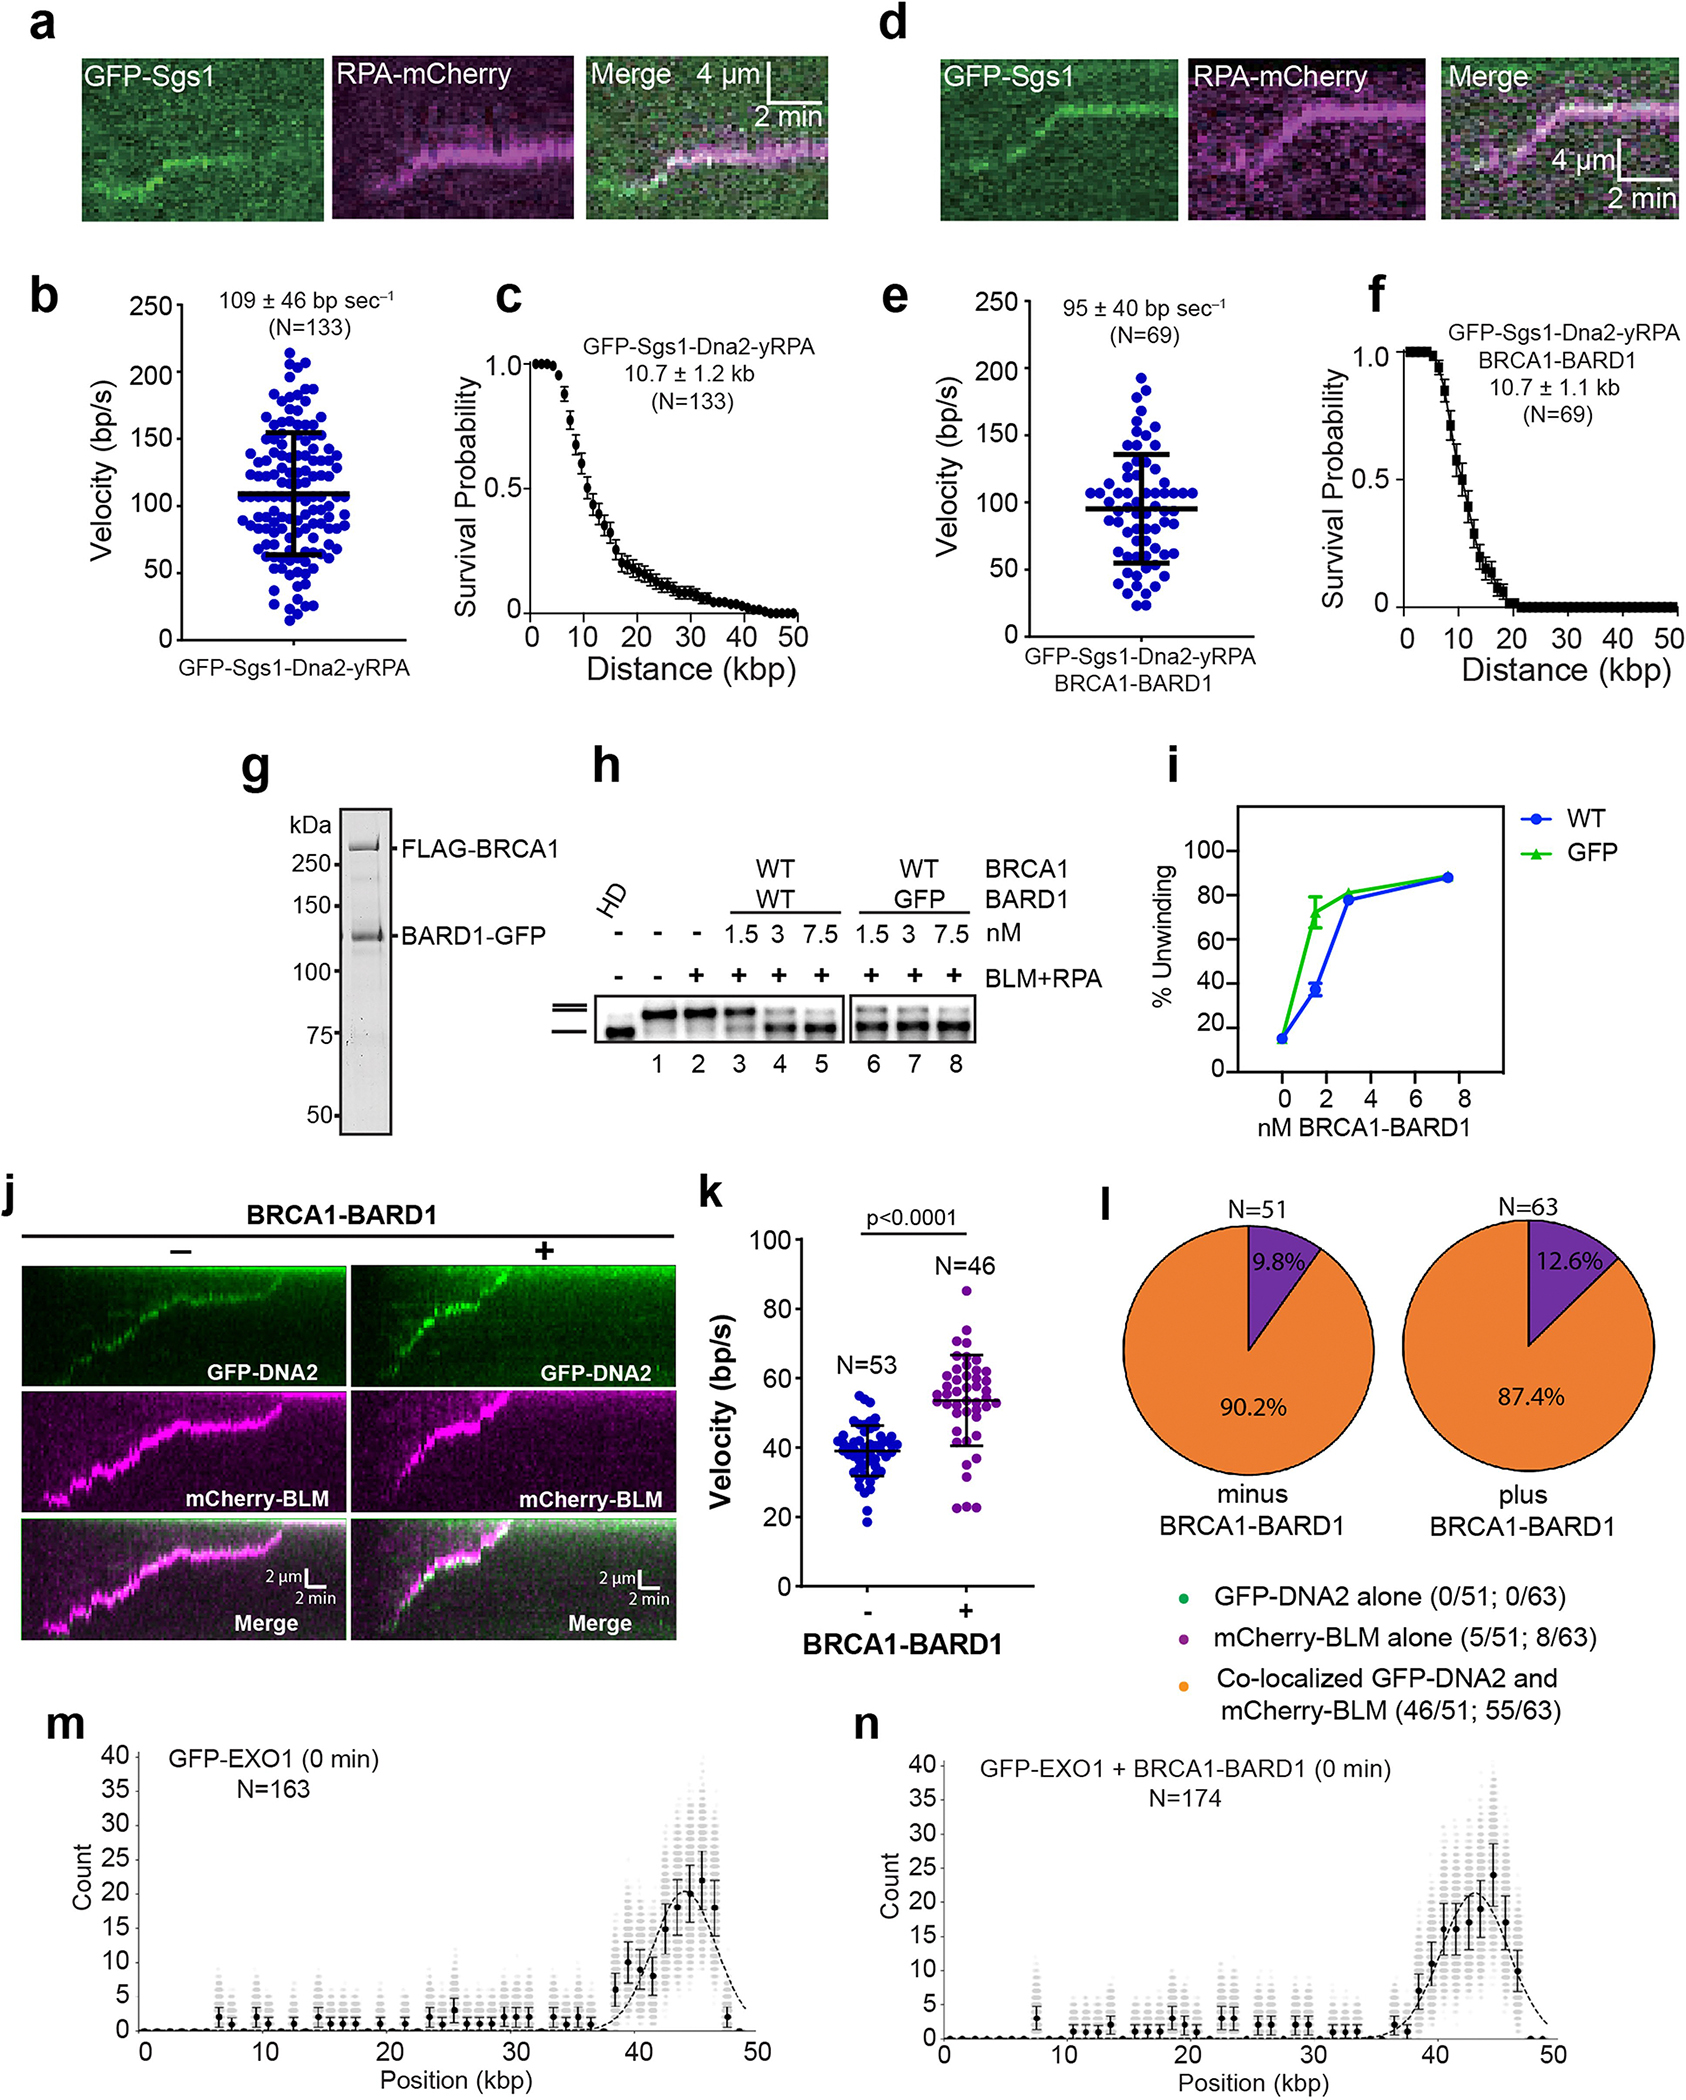
a, Kymograph showing the movement of GFP-Sgs1 pre–bound to unlabeled dsDNA when chased with yeast Dna2, yeast RPA-mCherry (2 nM) and ATP with b, corresponding velocity distribution (N = 133;n = 3), and c, processivity plot (N = 133;n = 3). d, Kymograph showing the movement of GFP-Sgs1 pre-bound to unlabeled dsDNA when chased with yeast Dna2, yeast RPA-mCherry, BRCA1-BARD1 and ATP with e, corresponding velocity distribution (N = 69;n = 3) and f, processivity plot (N = 69;n = 3). g, Purified BRCA1-BARD1 with a C-terminal GFP tag on BARD1 was analyzed by SDS-PAGE. h, GFP-tagged BRCA1-BARD1 was incubated with BLM (5 nM), RPA (200 nM), and the 2-kbp 32P-labeled dsDNA substrate for 20 min. HD denotes heat-denatured DNA. i, Quantification of the results in panel h. Error bars show mean ± SEM from 3 experiments. j, Kymographs of DNA end resection by mCherry-BLM, GFP-DNA2, RPA and +/− BRCA1-BARD1. k, Velocity of resection reactions containing mCherry-BLM, GFP-DNA2, RPA and +/− BRCA1-BARD1. p < 0.0001; from two-tailed unpaired-t-test. l, Pie charts summarizing the localization pattern of mCherry-BLM and GFP-DNA2 from panel j. m, n, Binding distribution of GFP-EXO1 at 0 min with (N = 174; n = 3) and without BRCA1-BARD1 (N = 163; n = 3). Individual data points correspond to the dataset generated by bootstrap analysis; Error bars represent SD from the mean. N=number of DNA molecules analyzed; n=number of flow cell repeats. Uncropped gel images are provided in Supplementary Fig. 1.
Extended Data Fig. 5 |. BRCA1 and BARD1 DNA binding fragments and internal deletion mutants.
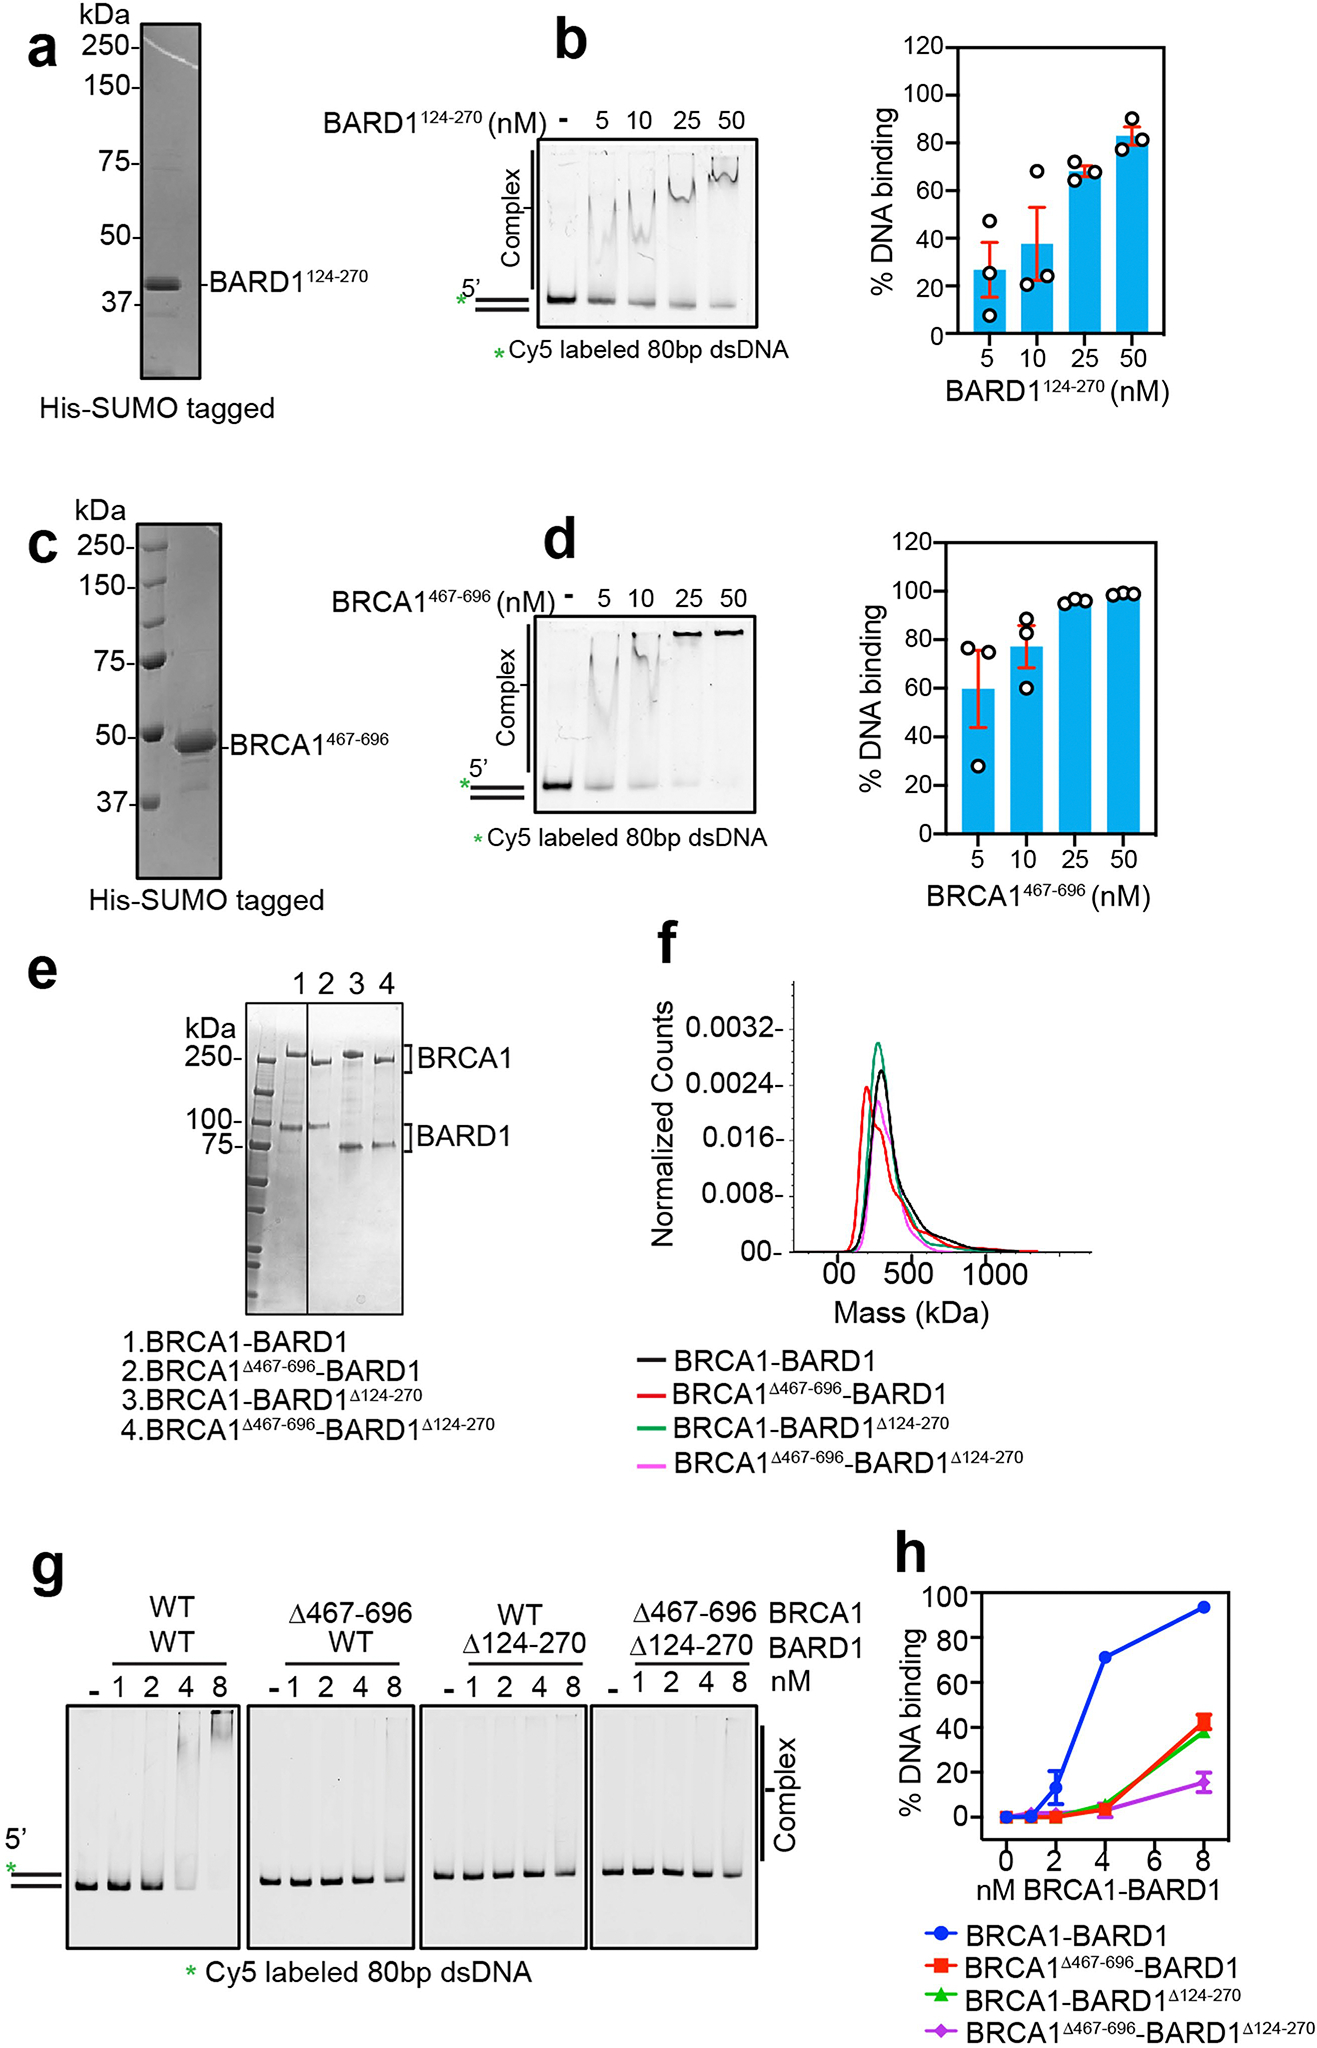
a, SDS-PAGE analysis of purified BARD1124–270. b, Testing of BARD1124–270 for DNA binding using Cy5-labeled 80 bp (3 nM) DNA as substrate. Results were quantified and plotted. Error bars show mean ± SEM; n = 3. c, SDS-PAGE analysis of purified BRCA1467–696. d, Testing of BRCA1467–696 for DNA binding using Cy5-labeled 80 bp (3 nM) DNA as substrate. Results were quantified and plotted. Error bars show mean ± SEM; n = 3. e, SDS-PAGE analysis of BRCA1-BARD1, BRCA1Δ467–696-BARD1, BRCA1-BARD1Δ124–270, and BRCA1Δ467–696-BARD1Δ124–270. f, Mass photometry profiles of wild type and mutant BRCA1-BARD1 species, n = 2. g, BRCA1-BARD1 and the indicated mutants were tested for DNA binding using Cy5-labeled 80 bp dsDNA (5 nM) as substrate. The reaction time was 10 min. h, Quantification of results from panel g, Error bars show mean ± SEM; n = 3. n=number of independent experiments. Uncropped gel images are provided in Supplementary Fig. 1.
Extended Data Fig. 6 |. Testing of BRCA1-BARD1 internal deletion mutants in DNA end resection.
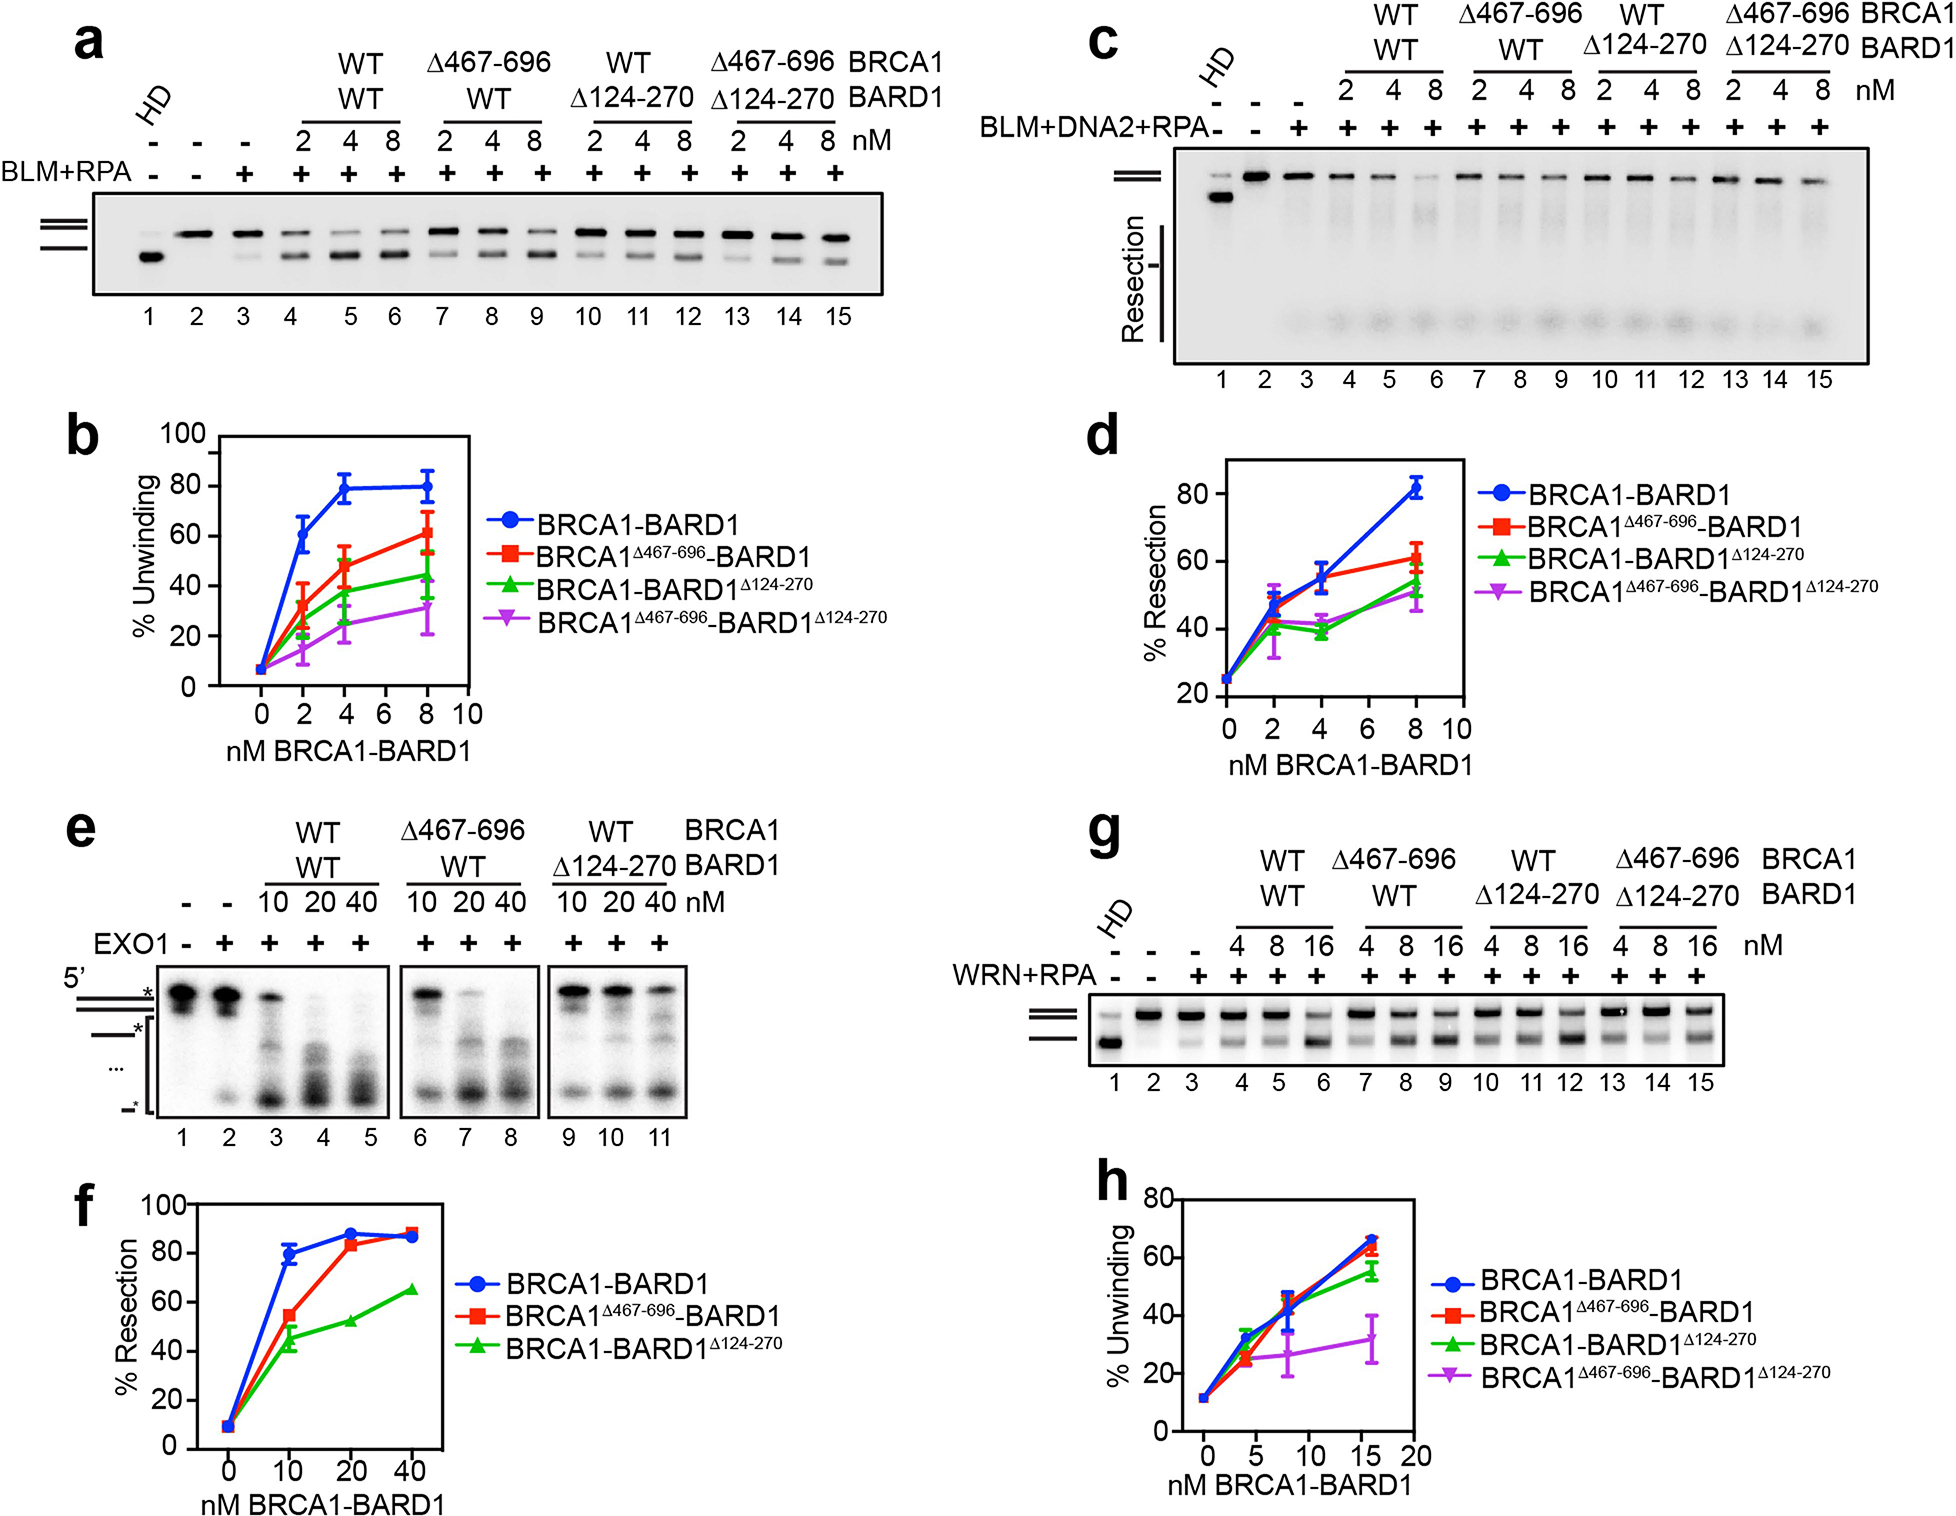
a, Testing of BRCA1-BARD1 and the indicated mutants on the helicase activity of BLM (1 nM), RPA (200 nM) using the 32P-labeled 2-kbp dsDNA substrate (0.5 nM ends). The reaction time was 30 min. b, Quantification of results from panel a. Error bars show mean ± SEM; n = 3. c, Testing of BRCA1-BARD1 and the indicated mutants for their influence on DNA end resection mediated by BLM (1 nM), DNA2 (15 nM) and RPA (200 nM) using the 32P-labeled 2-kbp dsDNA substrate. The reaction time was 30 min. d, Quantification of results from panel c. Error bars show mean ± SEM; n = 3. e, Testing of BRCA1-BARD1 and the indicated mutants for their influence on DNA end resection mediated by EXO1 (5 nM) using the 3′ 32P-labeled 80-mer dsDNA (2.5 nM) substrate. f, Quantification of results from panel e. Error bars show mean ± SEM; n = 3. g, Testing of BRCA1-BARD1 and the indicated mutants on the helicase activity of WRN (2 nM), RPA (200 nM) using the 32P-labeled 2-kbp dsDNA substrate. The incubation time was 20 min. h, Quantification of results from panel g. Error bars show mean ± SEM; n = 5. n=number of independent experiments.
Extended Data Fig. 7 |. Testing of BRCA1 and BARD1 DNA binding domains on BLM and WRN helicase activity.
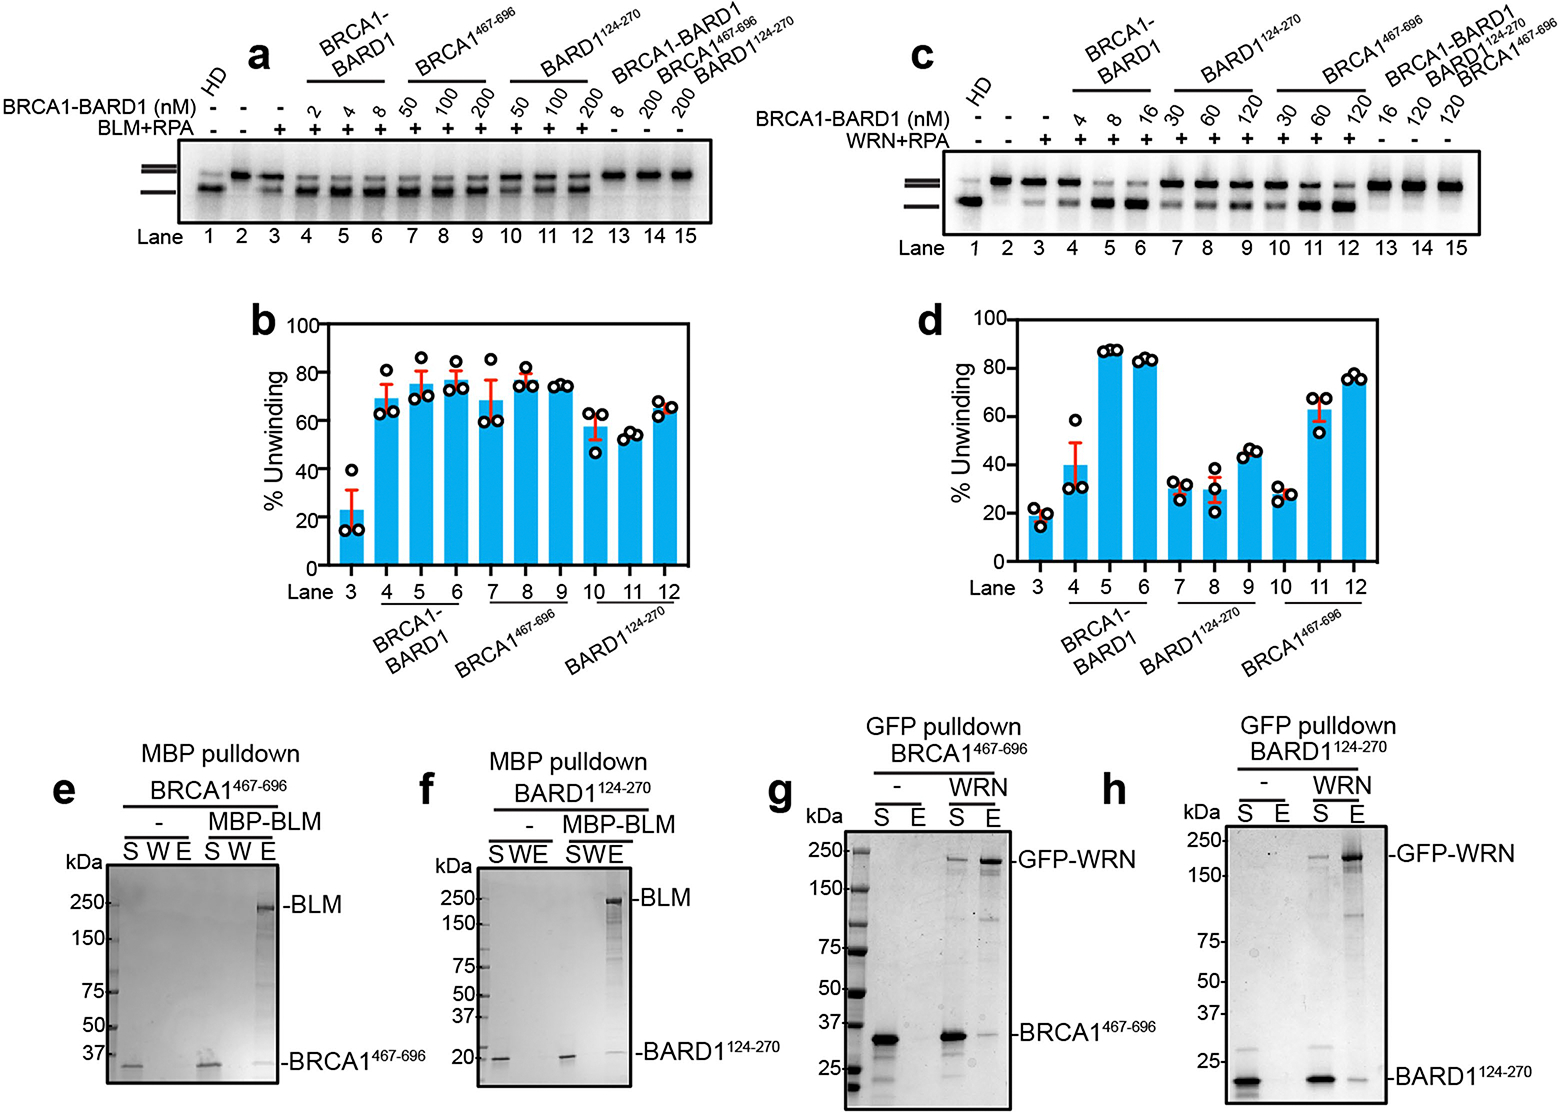
a, Testing of BRCA1467–696 and BARD1124–270 on the helicase activity of BLM (2 nM), RPA (200 nM) using the 32P-labeled 2-kbp dsDNA substrate. The reaction time was 30 min. b, Quantification of results from panel a. Error bars show mean ± SEM; n = 3. c, Testing of BRCA1467–696 and BARD1124–270 on the helicase activity of WRN (2 nM), RPA (200 nM) using the 32P-labeled 2-kbp dsDNA substrate. The incubation time was 20 min. d, Quantification of results from panel c. Error bars show mean ± SEM; n = 3. e, f, Interaction between BLM and BRCA1467–696 and BARD1124–270 was assessed by affinity pulldown (n = 2). MBP-BLM immobilized on amylose resin was incubated with BRCA1467–696 or BARD1124–270. Proteins were eluted from the resin and analyzed by SDS-PAGE with Coomassie blue staining. S, supernatant, W, wash and E, SDS eluate of resin. g, h, Interaction between GFP-WRN and BRCA1467–696 and BARD1124–270 was assessed by affinity pulldown assays (n = 2). GFP-WRN immobilized on anti-GFP resin was incubated with BRCA1467–696 and BARD1124–270. Proteins were eluted from the resin and analyzed by SDS-PAGE with Coomassie blue staining. S, supernatant, and E, SDS eluate of resin. n=number of independent experiments. Uncropped gel images are provided in Supplementary Fig. 1.
Extended Data Fig. 8 |. Construction and characterization of the BARD17KE DNA binding mutant.
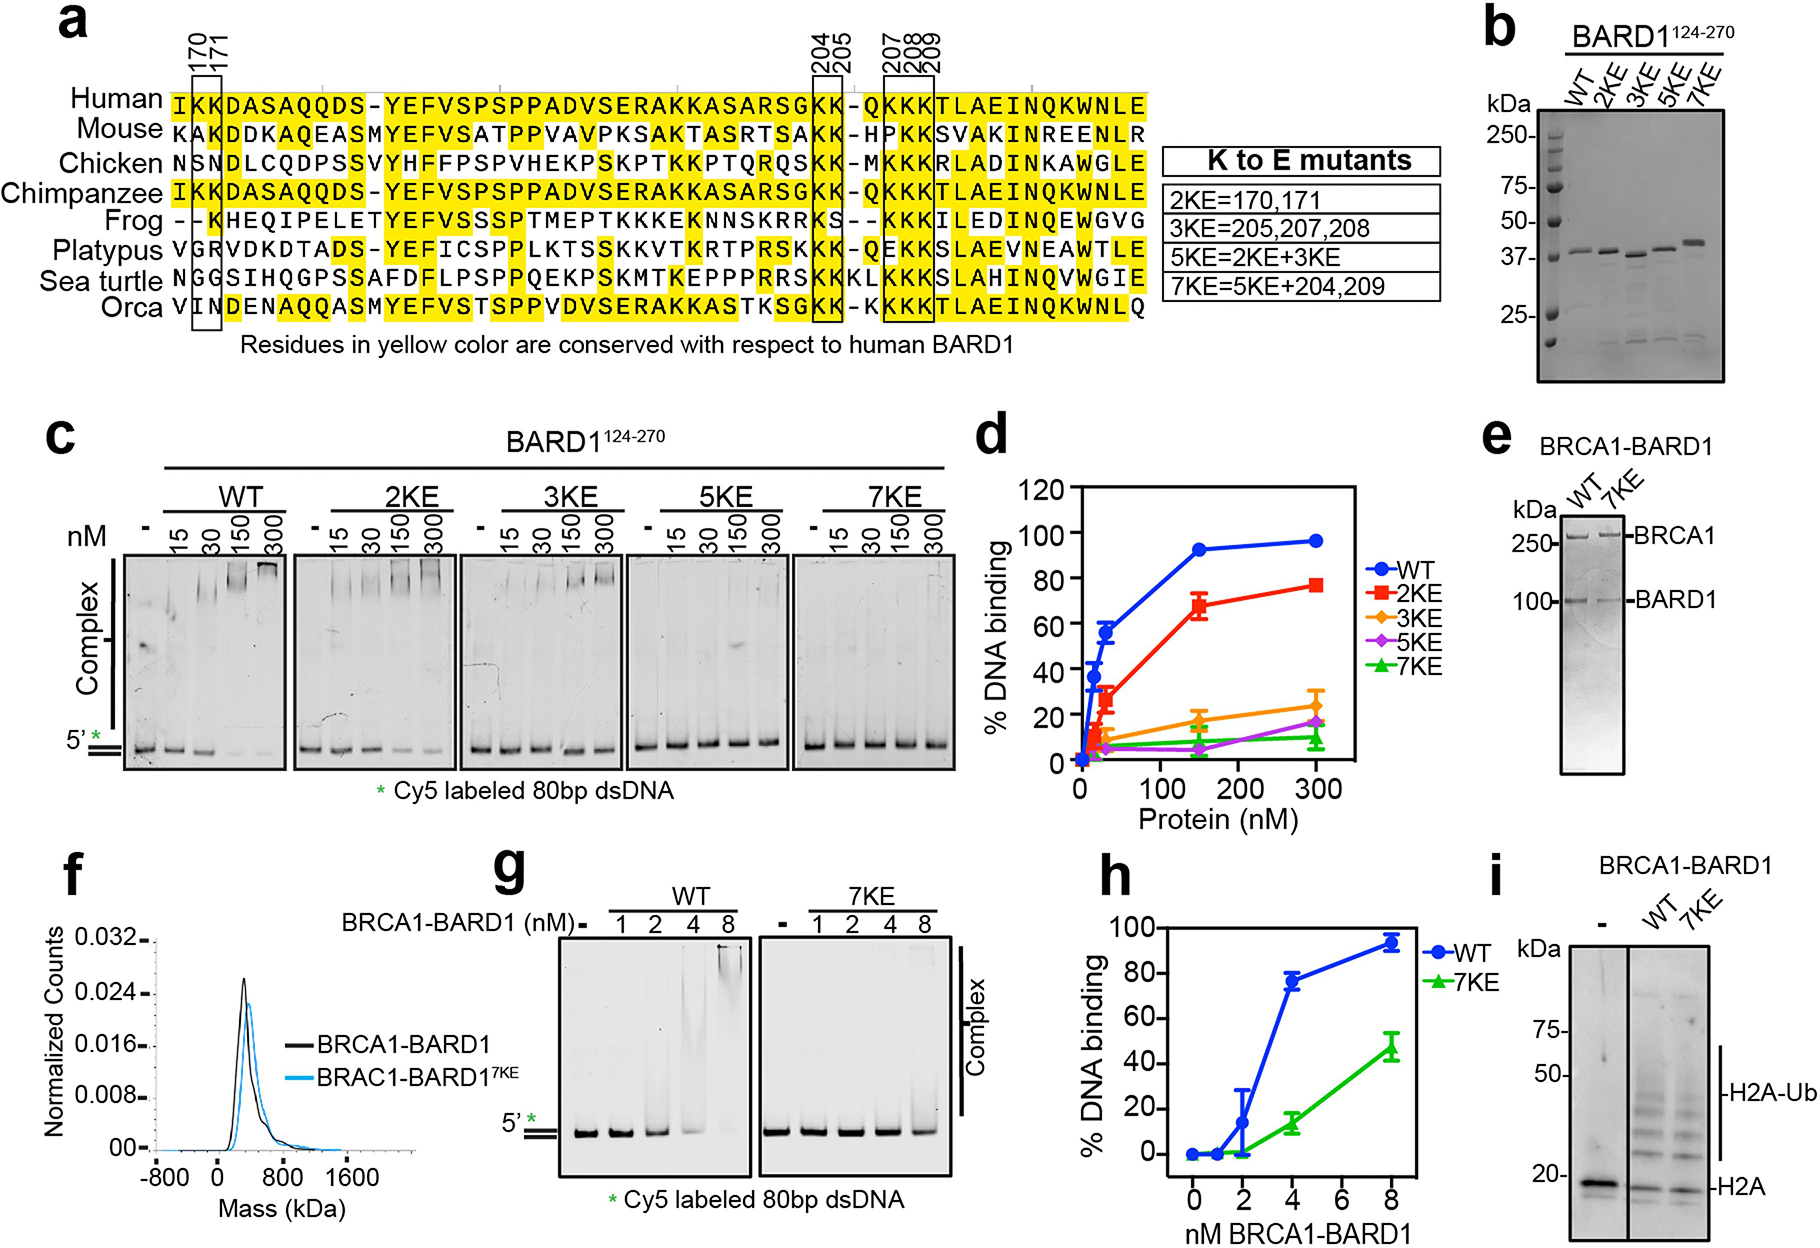
a, Alignment of the human BARD1 DNA binding domain encompassing amino acid residues 124–270 with the equivalent region of the indicated BARD1 orthologues. Conserved residues with respect to human BARD1 are highlighted with yellow shade. Boxed lysine residues were changed in various combinations to glutamate to yield the 2KE, 3KE, 5KE, and 7KE mutants. b, SDS-PAGE analysis of BARD1WT and BARD1124–270 mutant species. c, Testing of the BARD1124–270 mutants for DNA binding using the Cy5-labeled 80 bp dsDNA (3 nM) substrate. d, Quantification of results from panel c. Error bars show mean ± SEM; n = 3. e, SDS-PAGE gel of purified BRCA1-BARD1 and BRCA1-BARD17KE. f, Profile of BRCA1-BARD1 and BRCA1-BARD17KE from mass photometry analysis, n = 2. g, Testing of BRCA1-BARD1 and BRCA1-BARD17KE using the a Cy5-labeled 80 bp dsDNA (5 nM) as substrate. h, Quantification of data from panel g. Error bars show mean ± SEM; n = 3. i, Testing BRCA1-BARD1 and BRCA1-BARD17KE for E3 ubiquitin ligase activity with histone H2A as substrate, n = 2. n=number of independent experiments. Uncropped gel images are provided in Supplementary Fig. 1.
Extended Data Fig. 9 |. Testing of BRCA1-BARD17KE with EXO1, WRN and WRN-DNA2.
a, BRCA1-BARD17KE was tested for interaction with EXO1. GFP-EXO1-FLAG and FLAG-BRCA1-BARD17KE. were incubated and EXO1 was captured using anti-GFP resin, n = 2. The supernatant and SDS eluate of the pulldown reaction were probed by immunoblotting for BRCA1 and EXO1 using anti-FLAG antibody. b, BRCA1-BARD17KE was tested for interaction with BLM, n = 2. FLAG-BRCA1-BARD17KE was preincubated with His6-BLM and captured using anti-FLAG resin. The supernatant and SDS eluate of the pulldown reaction were probed by immunoblotting for BRCA1 and BLM using anti-FLAG antibody and anti-His antibody. c, Testing of BRCA1-BARD1 and BRCA1-BARD17KE for their influence on the helicase activity of WRN (2 nM) with RPA (200 nM) and the 32P-labeled 2-kbp dsDNA substrate. The reaction time was 20 min. d, Quantification of results from panel c. Error bars show mean ± SEM; n = 3. e, Testing of BRCA1-BARD1 and BRCA1-BARD17KE DNA end resection mediated by WRN (2 nM), DNA2 (20 nM), and RPA (200 nM) using the 32P-labeled 2-kbp dsDNA substrate. f, Quantification of results from panel e. Error bars show mean ± SEM; n = 3. g, BRCA1-BARD17KE was tested for interaction with WRN, n = 2. BRCA1-BARD17KE was incubated with GFP-WRN and the latter was captured using anti-GFP resin. The supernatant and SDS eluate of the pulldown reaction were probed by immunoblotting for BARD1 and WRN using anti-BARD1 and anti-GFP antibody. n=number of independent experiments. Uncropped gel images are provided in Supplementary Fig. 1.
Extended Data Fig. 10 |. Cell biological characterization of BARD17KE cells.
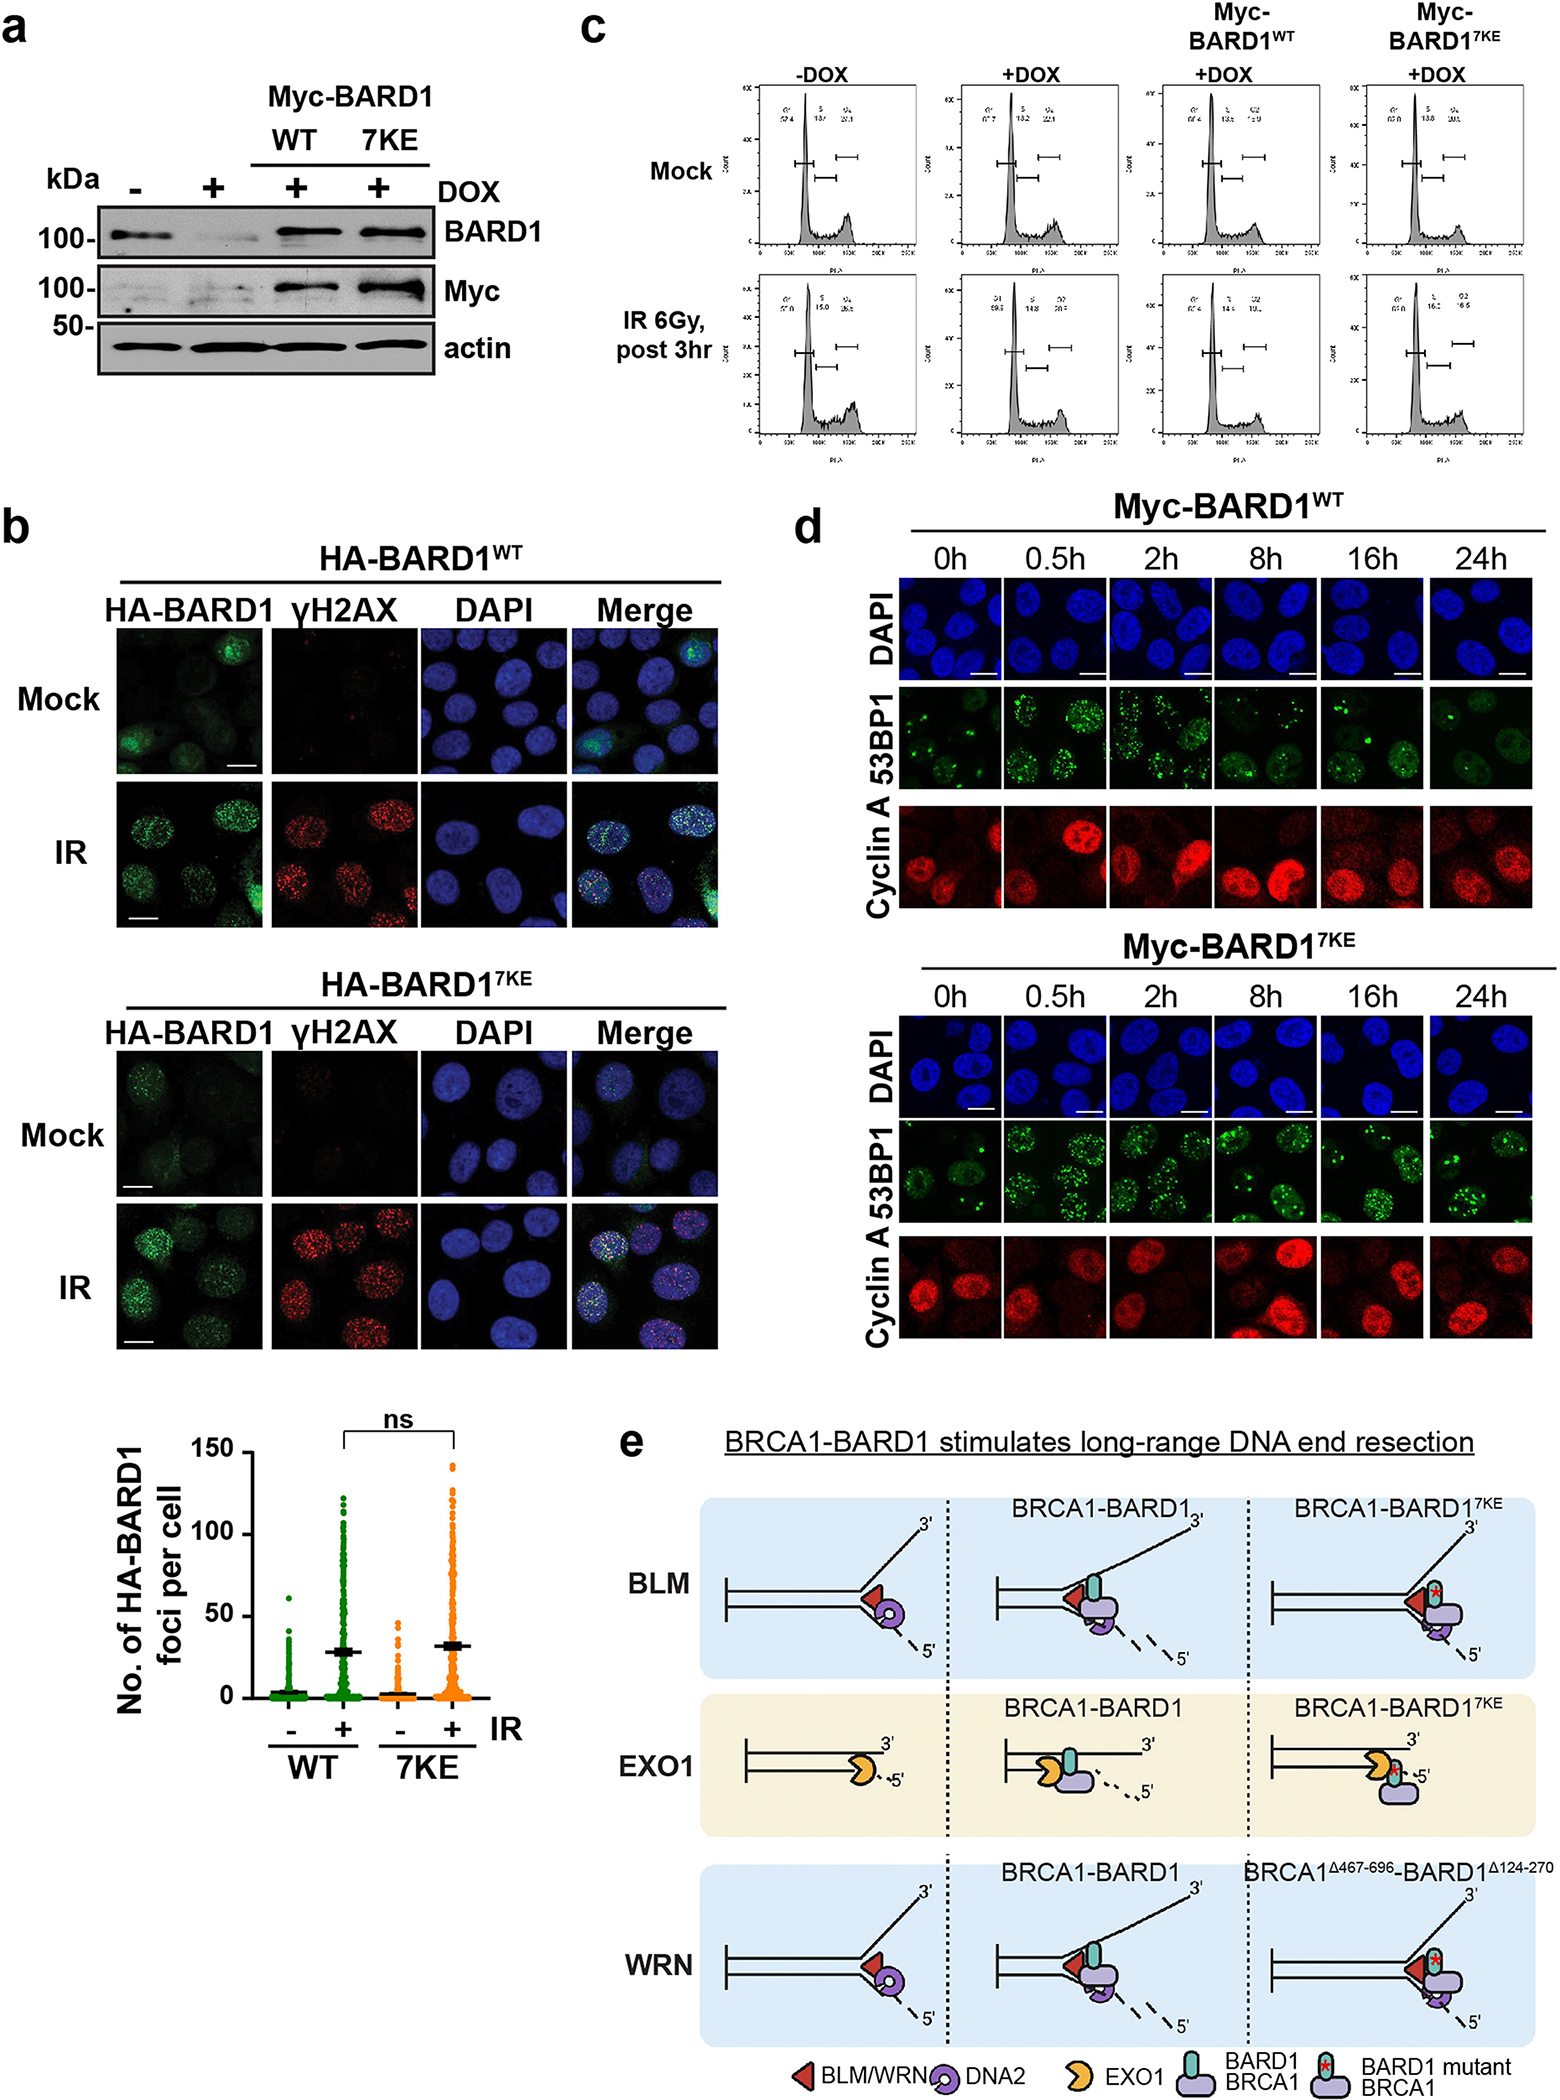
a, Immunoblot analysis of lysates from HeLa cells with shRNA-mediated knockdown of BARD1 complemented with Myc-tagged BARD1WT or BARD17KE. b, Representative images of immunostaining of HeLa cells depleted of endogenous BARD1 by doxycycline treatment and expressing HA tagged BARD1WT or BARD17KE either mock-treated or exposed to ionizing radiation (6 Gy IR). Cells were pre-extracted and immunostained with anti-HA antibody (green), anti-γH2AX (red) and with DAPI (blue) to identify nuclei. Dot plot shows HA-BARD1 foci per cell (370, 349, 397 and 353 number of cells counted from left to right) from 3 independent experiments. Error bars show mean ± SEM;, ns=not significant. Scale bars, 10 μm. c, HeLa cells depleted of endogenous BARD1 by doxycycline treatment and expressing BARD1WT or BARD17KE were either mock-treated or exposed to ionizing radiation, and analyzed by single parameter flow cytometry after propidium iodide staining for DNA content (x-axis). See Supplementary fig. 2 for gating strategy. d, HeLa cells depleted of endogenous BARD1 and expressing BARD1 or BARD17KE were exposed to ionizing radiation and incubated for the indicated times. Cells were co-immunostained for 53BP1 foci (green) and cyclin A (to demarcate cells in S/G2, red). Nuclei were stained with DAPI (blue). e, Working model: our results demonstrate that BRCA1-BARD1 associates with DNA ends as well as with BLM, WRN, and EXO1 to accelerate long range resection. Mechanistically, we show that BRCA1-BARD1 translocates with the resection machinery and examination of various BRCA1-BARD1 mutants provides evidence that the DNA binding attribute of BRCA1-BARD1 is needed for efficient end resection by BLM-DNA2, WRN-DNA2, and EXO1. Schematic in e was created using BioRender (https://BioRender.com). Uncropped gel images are provided in Supplementary Fig. 1.
Supplementary Material
Acknowledgements
This study was supported by NIH award nos. R50 CA265315 (Y.K.), R01 GM141091 (W.Z.), R01 CA246807 (S.B.), R01 GM140127 (D.S.L.), R01 GM136717, R01 CA23728 (A.V.M.), F30 CA278370, T32 GM145432 (A.M.J.), R01 CA244212 and R01 NS119225 (A.A.H.), R01 CA219836 (D.Z.), R01 CA221858, R01 CA236606 and R35 GM118026 (E.C.G.), R00 GM140264 (E.V.W.), R01 GM115568 and R01 GM128731 (S.K.O.), R01 CA139429 (R.H.) and R01 CA168635, R01 ES007061 and R35 CA241801 (P.S.); by DOD award no. BC191160 (A.V.M.), ACS award nos. RSG-22-721675-01-DMC (W.Z.) and PF-22-034-01-DMC (C.M.R.) and CPRIT award nos. RP210102 (W.Z.), RP220269 (R.H.), RR200030 (S.K.O.), RR220068 (E.V.W.) and RR210023 (A.V.M.). S.B. is holder of the Mays Family Foundation Distinguished Chair in Oncology. P.S. is the holder of the Robert A. Welch Distinguished Chair in Chemistry (no. AQ-0012). Mass photometry analysis was performed at the Center for Innovative Drug Discovery and the Mays Cancer Center Drug Discovery and Structural Biology Shared Resource at University of Texas Health San Antonio, supported by CPRIT Core Facility Award no. RP210208 and National Cancer Institute Cancer Center Support Grant no. P30 CA054174. The Flow Cytometry Shared Resource at University of Texas Health San Antonio is supported by National Cancer Institute Cancer Center Support Grant no. P30 CA054174, a CPRIT Core Facility Award (no. RP210126) and an instrumentation grant from the National Institutes of Health (no. S10 OD030432). Cell biological images were generated at the Core Optical Imaging Facility at University of Texas Health San Antonio, supported by National Cancer Institute Cancer Center Support Grant no. P30 CA054174. We thank T. Rao for initial work on BRCA1–BARD1 DNA-binding fragments and V. A. Bohr for providing the WRN plasmid.
Footnotes
Competing interests The authors declare no competing interests.
Reporting summary
Further information on research design is available in the Nature Portfolio Reporting Summary linked to this article.
Peer review information Nature thanks Maria Spies and the other, anonymous, reviewer(s) for their contribution to the peer review of this work.
Supplementary information The online version contains supplementary material available at https://doi.org/10.1038/s41586-024-07910-2.
Data availability
Data supporting the findings of this study are available within the paper and its Supplementary Information. All reagents are available from the corresponding authors on reasonable request. Source data are provided with this paper.
References
- 1.Daley JM, Gaines WA, Kwon Y & Sung P Regulation of DNA pairing in homologous recombination. Cold Spring Harb. Perspect. Biol. 6, a017954 (2014). [DOI] [PMC free article] [PubMed] [Google Scholar]
- 2.Tarsounas M & Sung P The antitumorigenic roles of BRCA1-BARD1 in DNA repair and replication. Nat. Rev. Mol. Cell Biol. 21, 284–299 (2020). [DOI] [PMC free article] [PubMed] [Google Scholar]
- 3.Cejka P & Symington LS DNA end resection: mechanism and control. Annu. Rev. Genet. 55, 285–307 (2021). [DOI] [PubMed] [Google Scholar]
- 4.Prakash R, Zhang Y, Feng W & Jasin M Homologous recombination and human health: the roles of BRCA1, BRCA2, and associated proteins. Cold Spring Harb. Perspect. Biol. 7, a016600 (2015). [DOI] [PMC free article] [PubMed] [Google Scholar]
- 5.Sung P Catalysis of ATP-dependent homologous DNA pairing and strand exchange by yeast RAD51 protein. Science 265, 1241–1243 (1994). [DOI] [PubMed] [Google Scholar]
- 6.Sung P, Krejci L, Van Komen S & Sehorn MG Rad51 recombinase and recombination mediators. J. Biol. Chem. 278, 42729–42732 (2003). [DOI] [PubMed] [Google Scholar]
- 7.Bunting SF et al. 53BP1 inhibits homologous recombination in Brca1-deficient cells by blocking resection of DNA breaks. Cell 141, 243–254 (2010). [DOI] [PMC free article] [PubMed] [Google Scholar]
- 8.Zhao W et al. BRCA1-BARD1 promotes RAD51-mediated homologous DNA pairing. Nature 550, 360–365 (2017). [DOI] [PMC free article] [PubMed] [Google Scholar]
- 9.Kawale AS & Sung P Mechanism and significance of chromosome damage repair by homologous recombination. Essays Biochem. 64, 779–790 (2020). [DOI] [PubMed] [Google Scholar]
- 10.Cunniff C, Bassetti JA & Ellis NA Bloom’s syndrome: clinical spectrum, molecular pathogenesis, and cancer predisposition. Mol. Syndromol. 8, 4–23 (2017). [DOI] [PMC free article] [PubMed] [Google Scholar]
- 11.Brosh RM Jr DNA helicases involved in DNA repair and their roles in cancer. Nat. Rev. Cancer 13, 542–558 (2013). [DOI] [PMC free article] [PubMed] [Google Scholar]
- 12.Bernstein KA, Gangloff S & Rothstein R The RecQ DNA helicases in DNA repair. Annu. Rev. Genet. 44, 393–417 (2010). [DOI] [PMC free article] [PubMed] [Google Scholar]
- 13.Nimonkar AV et al. BLM-DNA2-RPA-MRN and EXO1-BLM-RPA-MRN constitute two DNA end resection machineries for human DNA break repair. Genes Dev. 25, 350–362 (2011). [DOI] [PMC free article] [PubMed] [Google Scholar]
- 14.Wang Y et al. BASC, a super complex of BRCA1-associated proteins involved in the recognition and repair of aberrant DNA structures. Genes Dev. 14, 927–939 (2000). [PMC free article] [PubMed] [Google Scholar]
- 15.Sturzenegger A et al. DNA2 cooperates with the WRN and BLM RecQ helicases to mediate long-range DNA end resection in human cells. J. Biol. Chem. 289, 27314–27326 (2014). [DOI] [PMC free article] [PubMed] [Google Scholar]
- 16.Cheng WH et al. Collaboration of Werner syndrome protein and BRCA1 in cellular responses to DNA interstrand cross-links. Nucleic Acids Res. 34, 2751–2760 (2006). [DOI] [PMC free article] [PubMed] [Google Scholar]
- 17.Tomimatsu N et al. Phosphorylation of EXO1 by CDKs 1 and 2 regulates DNA end resection and repair pathway choice. Nat. Commun. 5, 3561 (2014). [DOI] [PMC free article] [PubMed] [Google Scholar]
- 18.Orans J et al. Structures of human exonuclease 1 DNA complexes suggest a unified mechanism for nuclease family. Cell 145, 212–223 (2011). [DOI] [PMC free article] [PubMed] [Google Scholar]
- 19.Xue C et al. Bloom helicase mediates formation of large single-stranded DNA loops during DNA end processing. Nat. Commun. 13, 2248 (2022). [DOI] [PMC free article] [PubMed] [Google Scholar]
- 20.Xue C et al. Regulatory control of Sgs1 and Dna2 during eukaryotic DNA end resection. Proc. Natl Acad. Sci. USA 116, 6091–6100 (2019). [DOI] [PMC free article] [PubMed] [Google Scholar]
- 21.Yan Z et al. Rad52 restrains resection at DNA double-strand break ends in yeast. Mol. Cell 76, 699–711 e696 (2019). [DOI] [PMC free article] [PubMed] [Google Scholar]
- 22.Wang M et al. Crucial roles of the BRCA1-BARD1 E3 ubiquitin ligase activity in homology-directed DNA repair. Mol. Cell 83, 3679–3691 (2023). [DOI] [PMC free article] [PubMed] [Google Scholar]
- 23.Mukherjee B, Tomimatsu N & Burma S Immunofluorescence-based methods to monitor DNA end resection. Methods Mol. Biol. 1292, 67–75 (2015). [DOI] [PMC free article] [PubMed] [Google Scholar]
- 24.Gunn A & Stark JM I-SceI-based assays to examine distinct repair outcomes of mammalian chromosomal double strand breaks. Methods Mol. Biol. 920, 379–391 (2012). [DOI] [PubMed] [Google Scholar]
- 25.Whelan DR & Rothenberg E Super-resolution mapping of cellular double-strand break resection complexes during homologous recombination. Proc. Natl Acad. Sci. USA 118, e2021963118 (2021). [DOI] [PMC free article] [PubMed] [Google Scholar]
- 26.Morris JR & Solomon E BRCA1: BARD1 induces the formation of conjugated ubiquitin structures, dependent on K6 of ubiquitin, in cells during DNA replication and repair. Hum. Mol. Genet. 13, 807–817 (2004). [DOI] [PubMed] [Google Scholar]
- 27.Bouwman P et al. 53BP1 loss rescues BRCA1 deficiency and is associated with triple-negative and BRCA-mutated breast cancers. Nat. Struct. Mol. Biol. 17, 688–695 (2010). [DOI] [PMC free article] [PubMed] [Google Scholar]
- 28.Ceppi I et al. Mechanism of BRCA1-BARD1 function in DNA end resection and DNA protection. Preprint at 10.21203/rs.3.rs-3639256/v1 (2024). [DOI] [PMC free article] [PubMed] [Google Scholar]
References
- 29.Raynard S et al. Functional role of BLAP75 in BLM-topoisomerase IIIalpha-dependent Holliday junction processing. J. Biol. Chem. 283, 15701–15708 (2008). [DOI] [PMC free article] [PubMed] [Google Scholar]
- 30.Niu H et al. Mechanism of the ATP-dependent DNA end-resection machinery from Saccharomyces cerevisiae. Nature 467, 108–111 (2010). [DOI] [PMC free article] [PubMed] [Google Scholar]
- 31.Bussen W, Raynard S, Busygina V, Singh AK & Sung P Holliday junction processing activity of the BLM-Topo IIIalpha-BLAP75 complex. J. Biol. Chem. 282, 31484–31492 (2007). [DOI] [PubMed] [Google Scholar]
- 32.Orren DK et al. Enzymatic and DNA binding properties of purified WRN protein: high affinity binding to single-stranded DNA but not to DNA damage induced by 4NQO. Nucleic Acids Res. 27, 3557–3566 (1999). [DOI] [PMC free article] [PubMed] [Google Scholar]
- 33.Daley JM, Chiba T, Xue X, Niu H & Sung P Multifaceted role of the Topo IIIalpha-RMI1-RMI2 complex and DNA2 in the BLM-dependent pathway of DNA break end resection. Nucleic Acids Res. 42, 11083–11091 (2014). [DOI] [PMC free article] [PubMed] [Google Scholar]
- 34.Xue C et al. Single-molecule visualization of human BLM helicase as it acts upon double- and single-stranded DNA substrates. Nucleic Acids Res. 47, 11225–11237 (2019). [DOI] [PMC free article] [PubMed] [Google Scholar]
- 35.Mukherjee S et al. Werner syndrome protein and DNA replication. Int. J. Mol. Sci. 19, 3442 (2018). [DOI] [PMC free article] [PubMed] [Google Scholar]
- 36.Tadokoro T, Kulikowicz T, Dawut L, Croteau DL & Bohr VA DNA binding residues in the RQC domain of Werner protein are critical for its catalytic activities. Aging 4, 417–429 (2012). [DOI] [PMC free article] [PubMed] [Google Scholar]
- 37.Rawal Y et al. Structural insights into BCDX2 complex function in homologous recombination. Nature 619, 640–649 (2023). [DOI] [PMC free article] [PubMed] [Google Scholar]
- 38.Greene EC, Wind S, Fazio T, Gorman J & Visnapuu ML DNA curtains for high-throughput single-molecule optical imaging. Methods Enzymol. 472, 293–315 (2010). [DOI] [PMC free article] [PubMed] [Google Scholar]
- 39.Tomimatsu N, Mukherjee B & Burma S Distinct roles of ATR and DNA-PKcs in triggering DNA damage responses in ATM-deficient cells. EMBO Rep. 10, 629–635 (2009). [DOI] [PMC free article] [PubMed] [Google Scholar]
- 40.Mukherjee B et al. EGFRvIII and DNA double-strand break repair: a molecular mechanism for radioresistance in glioblastoma. Cancer Res. 69, 4252–4259 (2009). [DOI] [PMC free article] [PubMed] [Google Scholar]
- 41.McEllin B et al. PTEN loss compromises homologous recombination repair in astrocytes: implications for glioblastoma therapy with temozolomide or poly(ADP-ribose) polymerase inhibitors. Cancer Res. 70, 5457–5464 (2010). [DOI] [PMC free article] [PubMed] [Google Scholar]
Associated Data
This section collects any data citations, data availability statements, or supplementary materials included in this article.
Supplementary Materials
Data Availability Statement
Data supporting the findings of this study are available within the paper and its Supplementary Information. All reagents are available from the corresponding authors on reasonable request. Source data are provided with this paper.