

Abstract
Introduction
Spinal cord stimulation (SCS) represents an established interventional pain therapeutic; however, the SCS effects of SCS waveforms on motor neuron recruitment of the lower limbs of chronic pain patients remain largely unknown.
Methods
We investigated these effects by performing isometric ankle-dorsal flexions at varying force levels under four SCS conditions: SCS Off (1 week), burst SCS (40 Hz), SCS Off (acute), and tonic SCS (130 Hz). Muscle activity was recorded via high-density surface electromyography (64-electrode grid) on the tibialis anterior muscle. Motor unit action (MUs) potentials were analyzed for recruitment and de-recruitment thresholds, discharge rate, inter-spike interval, and common synaptic input.
Results
In this prospective study, we included nine patients (five females; four males; mean age 59 years) with chronic pain treated with thoracic (Th7–Th8) epidural spinal stimulation. A total of 97 MUs were found for 15% maximal voluntary torque (MVT) and 83 for 30%MVT, an average of 10.8 ± 3.7 for 15%MVT and 10.4 ± 3.5 for 30%MVT. While a few subject-specific variations were observed, our study suggests that the different SCS frequencies applied do not significantly influence motor unit discharge characteristics in the TA muscle among the participants (p values at 15%MVT were 0.586 (Chi2 = 1.933), 0.737 (Chi2 = 1.267), 0.706 (Chi2 = 1.4) and 0.586 (Chi2 = 1.933), respectively. The p values of the Friedman test at 30%MVT were 0.896 (Chi2 = 0.6), 0.583 (Chi2 = 1.95), 0.896 (Chi2 = 0.6) and 0.256 (Chi2 = 4.05). No significant difference was found for the different stimulation types for the delta (0–5 Hz), alpha (5–12 Hz), and beta (15–30 Hz) bands at both force levels.
Conclusions
In summary, we did not observe any changes in motor unit oscillatory activity at any low and high bandwidths, indicating that SCS using different waveforms (tonic/burst) does not significantly influence motor neuron recruitment for non-motor individuals with chronic pain.
Supplementary Information
The online version contains supplementary material available at 10.1007/s40122-024-00670-x.
Keywords: Spinal cord stimulation (SCS), Burst/tonic stimulation waveforms, High-density surface electromyogram (HD-EMG), Motor unit recruitment (MUR), Chronic pain
Key Summary Points
| Spinal cord stimulation (SCS) is conventionally used to treat chronic refractory pain disorders. |
| Effects of different SCS waveforms on motor neuron response in chronic pain remains largely unknown. |
| This study determined the impact of burst and tonic spinal modulation pattern on motor neuron units in the lower limb. |
| Different SCS frequencies did not significantly alter motor neuron activity in chronic pain patients. |
Introduction
Spinal cord epidural stimulation (SCS) involves applying electrical currents intended to stimulate neural circuits within the spinal cord with the capability to exert therapeutical effects on pain perception, sensory, and motor function in spinal cord injury (SCI) patients [1] (data originate from a preprint), [2–4].
Chronic pain is defined by the International Association for the Study of Pain as “an unpleasant sensory and emotional experience associated with, or resembling that associated with, actual or potential tissue damage” [5]. More widely, SCS has been used for over five decades to treat patients with chronic pain disorders for which pharmacological and/or behavioral treatment options were ineffective. Besides the therapeutical effect on chronic pain levels and processing (e.g., back pain, leg pain, phantom limb, ischemic pain), SCS has been shown to ameliorate impaired motor function of the lower limbs [6–8]. Some uncontrolled in-human studies indicated that SCS improves motor performance in patients with refractory orthostatic tremor, movement disorders such as Parkinson’s disease, SCI, and spasticity [1] (data originate from a preprint), [2–4, 9–11]. However, how exactly SCS promotes motor function recovery and affects motor neuron recruitment still remains unclear. Several SCS chronic pain studies have investigated the impact of SCS on sensory neural circuits and have addressed these open questions, scoping to unveil on how SCS may interfere with brain circuits relevant for pain by using electrophysiological and/or neuroimaging outcome measures [12–22].
Force and, thus, movement are conditioned by the activation and coordination of the motoneurons and their muscle fibers through action potentials. According to the Henneman principle, motor units (MU) (alpha-motoneuron with all the muscle fibers it innervates) are recruited according to their size. This means, smaller MUs are recruited before larger ones, requiring lower stimulation intensity to be recruited [23, 24]. Previous studies have investigated the effect of SCS on motor neuron recruitment for individuals recovering from SCI [1] (data originate from a preprint), [2–4]. Ibañez and colleagues [3] studied the recruitment order of motoneurons in SCI patients with epidural stimulation, finding that there is orderly as well as inverse recruitment of motoneurons. A computational model by Capogrosso and co-workers [25] also investigated the recruitment of neurons with epidural stimulation, which showed the absence of direct influence on motoneurons. Balaguer et al. [1] (data originate from a preprint) found that the efficacy of SCS in enhancing motor control correlated with the extent of preserved supraspinal input. Greiner et al. [26] showed that SCS applied to the upper part of the spinal cord could activate specific nerve cells that control muscle through the direct stimulation of sensory nerves, following a specific pattern in the spinal cord.
Existing research in chronic pain patients treated with SCS has primarily focused on neurophysiological measures, such as somatosensory-evoked potentials, laser-evoked potential, quantitative sensory testing, and/or changes in EEG patterns mainly using tonic (130 Hz) SCS [12, 13, 19, 27].
Despite these findings, it remains largely unknown if SCSs intentionally applied to inhibit the spinal pain transmission in chronic pain patients interfere with motor unit function of the lower limbs. Therefore, the purpose of this prospective study was to investigate the effects of different SCS waveforms comparing tonic, burst, and sham stimulation on motor neuron activity in chronic pain patients quantified by high-density electromyography.
Methods
Study Design and Cohort Characteristics
In this prospective, single-center study, we included nine chronic pain patients with surgically implanted SCS, consisting of five females and four males with a mean age 64.67 ± 12.61 years. The research protocol was complying with the Declaration of Helsinki and was approved by the University of Erlangen Ethics Approvals Sub-Committee (approval no. 19-339_2-B). All recruited subjects signed a written informed consent for participation in the study.
All the participants were reviewed by an interdisciplinary pain board and defined as refractory to pharmacological and/or behavioral therapies suffering from chronic leg and/or lower back pain, with one subject having phantom limb pain. We specifically selected chronic pain disorder due to the anatomical structural integrity of the spinal cord and its efferent pathways in contrast to SCI patients. The notable difference is the voluntary nature of movement compared to previous investigations in SCI patients, where SCS was applied to study motor function recovery. SCS electrode implantation targeted thoracic spinal cord level between 7 and 8 (Th 7/8) in each participant. A single 16-contact surgical paddle type lead (Penta; Abbott, Plano, TX, USA) was implanted in general anesthesia at spinal level Th 7/8. The paddle type lead was connected to an extension wire and was externalized for each subject to allow a trial of stimulation lasting 7 days. Those patients achieving 30% pain relief at the end of the trial period, compared to baseline, went on for permanent implantation of the pulse generator (Prodigy; Abbott). Adjustment of stimulation parameters were optimized to preserve pain reduction operating with sub-perceptional thresholds. Patient characteristics, age, sex, duration of SCS therapy, contact configuration and number of identified motor units are summarized in Table 1.
Table 1.
Study participants characteristics
| Age (y) |
Sex (M/F) |
Leg (R/L) |
Time since implantation (m) |
SCS level | Pain origin |
VAS pre-/post-SCS | PSQI pre-/post- SCS |
BDI pre-/post- SCS |
Number of MUs | MVT (n) |
||
|---|---|---|---|---|---|---|---|---|---|---|---|---|
| 15%MVT | 30%MVT | |||||||||||
| 1 | 71 | F | R | 19 | Th 7/8 | NP | – 38% (8/5) | – 23% (13/ 10) | – 18% (17/ 14) | 9 | – | 97.3 |
| 2 | 76 | M | R | 25 | Th 7/8 | PSPS-2 | – 67% (9/3) | – 17% (6/5) | – 45% (20/11) | 12 | 8 | 132.1 |
| 3 | 68 | M | L | 30 | Th 7/8 | NP | – 50% (8/4) | – (4/4) | – 44% (9/5) | 10 | 6 | 262.2 |
| 4 | 53 | F | R | 26 | Th 7/8 | PNP | – 30% (10/7) | – 17% (18/15) | – 23% (22/17) | 15 | 15 | 134.1 |
| 5 | 76 | F | R | 28 | Th 7/8 | PSPS-2 | – 14% (7/6) | – (12/17) | – (26/26) | 9 | 9 | 79.5 |
| 6 | 71 | F | R | 3 | Th 7/8 | PSPS-2 | – 29% (7/5) | – 21% (14/11) | – 17% (18/15) | 12 | 10 | 166.8 |
| 7 | 72 | M | L | 21 | Th 7/8 | PSPS-2 | – 25% (8/6) | – 10% (10/9) | – 17% (23/19) | 8 | 8 | 243.3 |
| 8 | 56 | M | L | 21 | Th 7/8 | NP-2 | – 50% (10/5) | – 40% (20/12) | – 71% (17/5) | 17 | 16 | 264.1 |
| 9 | 39 | F | L | 22 | Th 7/8 | PSPS-2 | – 33% (9/6) | – (8/8) | – 29% (24/17) | 5 | 11 | 204.6 |
BDI Beck Depression Inventory, F female, L left, M male, m months, MU motor unit, MVT maximal voluntary torque, n Newton, NP neuropathic pain, PNP polyneuropathy, PSPS-2 Chronic Persistent Spinal Pain Type 2, PSQI Pittsburgh Sleep Quality Inventory, R right, SCS spinal cord stimulation, VAS visual analog scale, y years
Overview of the Study and Experimental Protocol
This study consisted of one experimental session, with measurements of the tibialis anterior (TA) muscle of the pain patient´s dominant leg. The preference of the TA was due to its accessibility permitting a reliable and reproducible decomposition [28, 29]. As a baseline, we asked the participants to turn off the stimulation 5–7 days prior to the study session. The measurements were performed for four different stimulation types of SCS and in the respective order: SCS “Off” (1 week), SCS burst mode (40 Hz, intraburst rate 500 Hz, a pulse width of 1 ms, interspike interval 1 ms), SCS “Off” (acute), and SCS tonic mode (130 Hz). The participants were not aware of this order, as burst SCS operates at a sub-perceptional level and therefore switching SCS Off to burst SCS was not perceived, except for tonic SCS, evoking paresthesia in the painful lower extremity (Table 2).
Table 2.
Stimulation parameters (frequency (Hz), pulse width (µs), contact conficguration (bipolar), and amplitude (mA)) for each of the subjects given in the order of the HD-EMG measurements (SCS “off”, burst SCS, tonic SCS).
| SCS off (1 week) | SCS burst mode/bipolar | SCS tonic mode/bipolar | Lead | Contacts | |
|---|---|---|---|---|---|
| 1 | 0 Hz/ 0 µs/ 0 mA | 40 Hz/ 1000 µs/ 0.05 mA | 130 Hz/ 500 µs/ 1.6 mA | P-Lead | 8 + / 13– |
| 2 | 0 Hz/ 0 µs/ 0 mA | 40 Hz/ 1000 µs/ 0.35 mA | 130 Hz/ 500 µs/ 1.4 mA | P-Lead | 3– / 5 + / 8 + |
| 3 | 0 Hz/ 0 µs/ 0 mA | 40 Hz/ 1000 µs/ 0.10 mA | 130 Hz/ 350 µs/0.9 mA | P-Lead | 1 + / 2 + / 4– |
| 4 | 0 Hz/ 0 µs/ 0 mA | 40 Hz/ 1000 µs/ 0.40 mA | 130 Hz/ 500 µs/ 7.1 mA | P-Lead | 13 + / 14 + / 16– |
| 5 | 0 Hz/ 0 µs/ 0 mA | 40 Hz/ 1000 µs/ 0.55 mA | 130 Hz/ 350 µs/ 5.1 mA | P-Lead | 1 + /2– |
| 6 | 0 Hz/ 0 µs/ 0 mA | 40 Hz/ 1000 µs/ 0.50 mA | 130 Hz/ 350 µs/ 2.3 mA | P-Lead | 8– / 9– / 10 + |
| 7 | 0 Hz/ 0 µs/ 0 mA | 40 Hz/ 1000 µs/ 0.60 mA | 130 Hz/ 500 µs/ 2.2 mA | P-Lead | 1– / 2 + |
| 8 | 0 Hz/ 0 µs/ 0 mA | 40 Hz/ 1000 µs / 0.15 mA | 130 Hz/ 500 µs/ 1.0 mA | P-Lead | 1– / 2 + |
| 9 | 0 Hz/ 0 µs/ 0 mA | 40 Hz/ 1000 µs/ 0.35 mA | 130 Hz/ 350 µs/1.9 mA | P-Lead | 13– / 16 + |
Hz Hertz, mA milliamperes, P-Lead 5-column paddle type lead consisting of 16 active contacts (electrode array width 9 mm, electrode array length 25 mm), SCS spinal cord stimulation, µs microseconds
Clinical SCS outcome measures included data collection of SCS parameters and assessment of pain intensity quantified by the visual analog scale (VAS), mood by the Beck Depression Inventory (BDI) and sleep architecture using the Pittsburgh Sleep Quality Inventory (PSQI) before and after SCS therapy.
First, a warm-up phase was performed. During this, we asked the subjects to perform an ankle dorsiflexion with their perceived maximal voluntary torque (MVT). Then, the participants performed 3–5 isometric trapezoidal ramp contractions with 15% of the measured MVT and another 3–5 ramps with 30%MVT. After that, we measured the MVT 3 more times and took the highest value as reference followed by a short rest phase of 2–3 min before starting to record. For the recordings of the muscle activity of the TA muscle, we used high-density surface electromyography (HDsEMG) using a multichannel amplifier (Quattrocento; OT Bioelettronica, Torino, Italy).
For the main part of the experimental session, the participants performed isometric ramp contractions (ankle dorsiflexion) at two different force levels, 15% and 30% of their MVT. The ramp slope was set at 10%MVT per second (1.5 s for 15%MVT and 3 s for 30%MVT). Between each ramp contraction, there was a rest of 20 s. The plateau was 10 s for 15%MVT and 5 s for 30%MVT.
The order of the contractions 15%MVT and 30%MVT was randomized. In total, three measurements were performed for each force level (one measure for each stimulation type), in which the participants had to follow 3–4 isometric trapezoidal ramp contractions as precisely as possible. Between each set of ramps and each stimulation type, there was a rest phase of 2–3 min to avoid muscle fatigue. The order of measurements was SCS “Off” (1 week), burst SCS, SCS “Off” (acute), and tonic SCS.
HDsEMG and Force Recordings
We recorded the HDsEMG signals with a 2048 Hz sampling frequency and bandpass filter of 20–500 Hz. Several studies have shown the reliability of non-invasive assessment of MU for force levels up to 70%MVT [30–33]. To measure EMG activity during ankle dorsiflexion, we placed an electrode grid (64 electrodes, interelectrode distance 8 mm, 13 × 5 electrodes; OT Bioelettronica) above the muscle belly of the TA muscle of the participant's dominant leg or the leg with the least pain (Fig. 1b). For the participant with the prosthetic leg, we used the intact limb. A second electrode grid (64 electrodes, inter-electrode distance 10 mm, 8 × 8 electrodes; OT Bioelettronica) was placed above the gastrocnemius muscle, which is the antagonist muscle of the TA. Before placing the grids, we located the muscle belly, shaved the skin when necessary, and cleaned it with 70% alcohol solution. The grids were prepared with a bi-adhesive foam layer and conduction paste (SpesMedica, Battipaglia, Italy). A reference electrode was placed on the ankle and a ground electrode on the wrist. The force was recorded using an ankle ergometer and a force amplifier ×100 (OT Bioelettronica) (Fig. 1).
Fig. 1.
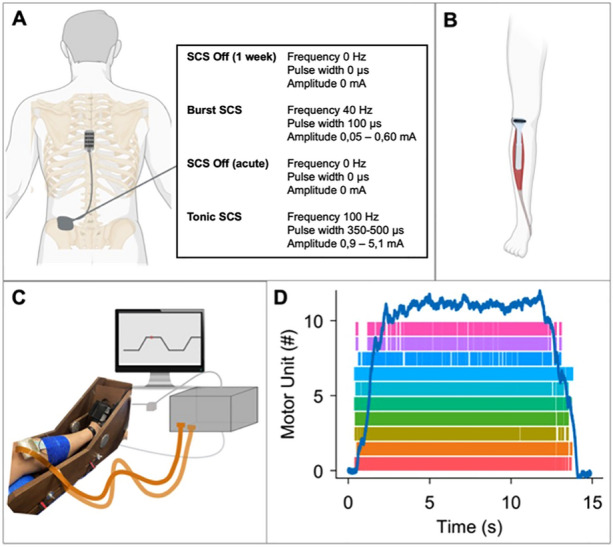
A Placement of the electrodes TH7/8 and the implanted pulse generator with the stimulation types used in our study. B Placement of the EMG electrodes above the muscle belly of the tibialis anterior muscle. C Setup of the experiment with an ankle dynamometer with a force amplifier, the HDsEMG and the ramps to be performed shown on the screen. D Example of a ramp at 15%MVT performed by subject 3 with the number of MU activated. (A–C created with BioRender.com)
The force feedback was displayed in a computer monitor positioned in front of the participants. We recorded the force signals with the OTBioLab + software (OT Bioelettronica) concurrent with the EMG recordings.
HDsEMG: Decomposition and Analysis
Before decomposing the data, we chose two isometric ramps for each stimulation type and force level considering the best performance at the ramp up phase. In total, 8 isometrics ramps (2 of each stimulation type at the same force level) were combined in one file, in order to track the same motor units across the conditions. We then decomposed the data with the convolution kernel compensation (CKC) method in DEMUSE, a decomposition technique by Holobar and Zazula [32]. With this method, it is possible to extract individual MUs discharge patterns [32, 34]. Afterwards, the data had to be inspected visually and cleaned manually according to the tutorial by Del Vecchio et al. [35]. We eliminated the MUs with a pulse-to-noise ratio (PNR) below 26 decibels (dB). PNR is the ratio between baseline noise and spikes identified with the CKC method. The higher the ratio, the higher the sensitivity [30, 32].
We analyzed the MU activity for each force level, computing: recruitment threshold (minimum level of muscle activation required to activate a MU) de-recruitment threshold (level of muscle activation below which a previously recruited MU becomes inactive again), discharge rate (frequency at which individual MUs fire action potentials) at recruitment, plateau, de-recruitment, across the contraction and inter-pulse interval variability (assesses how consistent or irregular the timing is between the electrical signals produced by different MUs).
In addition, we calculated the coherence, which represents the common synaptic input to the motor neuron. The coherence was analyzed within groups of motor units, consisting of the cross-correlation of the spike trains of motor unit groups in the frequency domain. This analysis was performed only for the steady part of the contractions. The motor units were split into two equally sized groups, which were then randomly rearranged 100 times. With each iteration, the group sizes increased, with at least one motor unit per group and a maximum of half of the total number of motor units. Subsequently, we calculated the cross-correlation of each group pair, and the average coherence after the 100 permutations was employed for analysis [36]. We averaged the coherence and calculated the coherence area (area under the curve) across stimulation conditions for the different bandwidths: delta (1–5 Hz), alpha (5–12 Hz), beta (15–30 Hz), and gamma (30–80 Hz). We calculated the coherence threshold as the average value between the frequencies 100–250 Hz.
Statistical Analysis
We applied non-parametric statistics in this study, as our sample size was small (n = 9 for 15%MVT and n = 8 for 30%MVT) and the data were not normally distributed (Shapiro–Wilk test, p > 0.05). To compare the four groups SCS “Off” (1 week), burst SCS, SCS “Off” (acute), and tonic SCS we used the Friedman Test. For each subject, we selected two ramps for each stimulation type, during which a subset of MUs was activated. The average of each analyzed variable across of all the MUs for both ramps was calculated, resulting in a single value per stimulation type and per subject. Subsequently, the Friedman test was conducted employing one value per stimulation type and subject. Nine values were used for 15%MVT for the Friedman test and eight for 30%MVT. In case there was a significant difference, we performed the Dunn–Bonferroni post hoc test for pairwise comparison. For all statistical tests, a level of significance of 0.05 was applied.
Results
SCS Stimulation Parameters and Clinical Responsiveness
At the first HD-EMG measurements, all the participants were 7 days under SCS “Off”, at the second HD-EMG measurements operating under a burst SCS mode (0.05–0.6 mA; intensity five 1-ms pulses with 500-Hz intra-burst frequency delivered with 40-Hz frequency; passive recharge balance), and the third HD-EMG measurement tonic SCS mode was active under the following conditions: intensity 0.9–7.1 mA; frequency 130–150 Hz; amplitude 350–500 μsec; bipolar active configuration. Clinical improvement comparing pre- versus post-SCS observed changes in pain intensity VAS reduction [average 37% reduction (14–67%)], mood [BDI decline 29% (18–71%)], and sleep quality [PSQI 14% decrease (10–40%)] after an average of 22 months (ranging from 3 to 30 months) with adjunctive SCS therapy (Table 1).
Number of Identified Motor Units
Figure 1 presents the experimental setup, the position of the electrodes in the epidural space with a description of the stimulation types used in our study as well as an example of a ramp at 15%MVT with the MUs activated during this ramp.
In total, 97 MUs were found for 15%MVT and 83 for 30%MVT, an average of 10.8 ± 3.7 for 15%MVT and 10.4 ± 3.5 for 30%MVT. Table 1 shows the number of MUs found for each patient and their MVT.
Recruitment and De-recruitment Threshold
Interestingly, we found no significant difference of the recruitment and de-recruitment threshold between the stimulation types and the SCS Off conditions at 15%MVT and 30%MVT. For the recruitment threshold, the p value of the Friedman test was 0.706 (Chi2 = 1.4) at 15%MVT and 0.789 (Chi2 = 1.05) at 30%MVT. The p value for the de-recruitment threshold at 15%MVT was 0.115 (Chi2 = 5.933) and 0.717 (Chi2 = 1.35) at 30%MVT (Fig. 2).
Fig. 2.
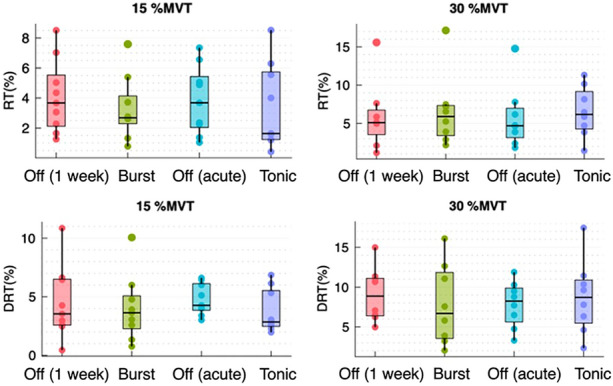
Boxplots at 15%MVT and 30%MVT for the recruitment and de-recruitment threshold using the average of MU across the subjects comparing the Off conditions and the different stimulation types. RT recruitment threshold, DRT de-recruitment threshold
Discharge Rate and Interpulse Interval Variabilities
Neither the discharge rate across contraction nor at recruitment, plateau, or de-recruitment, showed significant differences at 15%MVT and 30%MVT. The p values at 15%MVT were 0.586 (Chi2 = 1.933), 0.737 (Chi2 = 1.267), 0.706 (Chi2 = 1.4) and 0.586 (Chi2 = 1.933), respectively. The p values of the Friedman test at 30%MVT were 0.896 (Chi2 = 0.6), 0.583 (Chi2 = 1.95), 0.896 (Chi2 = 0.6) and 0.256 (Chi2 = 4.05) (Fig. 3).
Fig. 3.

Boxplots of discharge rate across contraction, at plateau, at recruitment and de-recruitment at 15%MVT and 30%MVT comparing SCS “Off” (1 week), burst SCS, SCS “Off” (acute), and tonic SCS using the average of MUs across the nine subjects. DR discharge rate
The variability of the interspike interval at 15%MVT showed median values of 17.534 (IQR 8.226) for SCS “Off” (1 week), 14.115 (IQR 7.465) for burst SCS, 13.369 (IQR 6.161) for SCS “Off” (acute), and 15.596 (IQR 5.278) for tonic SCS. At 30%MVT, a median of 13.743 (IQR 7.691) for SCS “Off” (1 week), 14.14 (IQR 3.169) for burst SCS, 16.076 (IQR 6.342) for SCS “Off” (acute), and 17.534 (IQR 6.556) for tonic SCS was observed. For the interpulse interval variability, we did not find a significant difference at 15%MVT and 30%MVT (p = 0.392, Chi2 = 3 (15%MVT); p = 0.494, Chi2 = 2.4 (30%MVT)).
Coherence Analysis
For the coherence, there was no significant difference (p > 0.05) between the different stimulation types for the delta (0–5 Hz), alpha (5–12 Hz), and beta (15–30 Hz) bands at both force levels. There was only a significant difference for the gamma band (30–80 Hz) for 30%MVT between burst SCS and tonic SCS (p = 0.004) (Fig. 4).
Fig. 4.

A Coherence of subject 8 at 15%MVT in the order SCS Off (1 week), burst SCS, SCS Off (acute), and tonic SCS. B Boxplots of the coherence for the delta (1–5 Hz), alpha (5–12 Hz), beta (15–30 Hz), and gamma (30–80 Hz) bands comparing the conditions SCS “Off” (1 week), burst SCS, SCS “Off” (acute), and tonic SCS at 15%MVT and 30%MVT, using the average of MUs across the subjects,
Although we did not find significant differences across the subjects, we found that there were significant subject specific differences between the stimulation types (‘Supplementary Material’).
Discussion
Brief Summary and Interpretation of Study Findings
Our results indicate that thoracic stimulation of the spinal cord using different waveforms (burst vs. tonic vs. acute and chronic off) has no significant effect on the recruitment, discharge rate, and coherence of the motoneurons in chronic pain patients. Although the stimulation was not targeted to motor neurons innervating the tibialis anterior muscle, we expected that some oscillatory activity would still be present at the motor unit level at specific bandwidths according to the stimulation parameters.
Recruitment and de-recruitment thresholds exhibited no statistical differences among SCS tonic versus burst mode compared to the SCS Off condition, reflecting comparable excitability patterns. In contrast, Ibañez et al. [3] observed that epidural stimulation of the spinal cord in individuals with SCI can induce motor neuron recruitment patterns characterized by both orderly, size-dependent recruitment, and inverse recruitment trends. Other neurostimulation types such as neuromuscular electrostimulation does not conform to Henneman's size principle in terms of MU recruitment [23, 37].
Analysis of discharge rates throughout different contraction phases revealed no significant variations at 15%MVT and 30%MVT. This suggests stability in MU firing patterns irrespective of the applied stimulation paradigm. Moreover, interspike interval variability analysis indicated no significant differences, signifying temporal consistency in MU discharge patterns under various spinal cord stimulation patterns. In addition, examining the coherence across different frequency bands, we found no substantial differences at either force levels.
Comparison with Published Experimental and Clinical Data
Computational models and other experimental studies have demonstrated that SCS especially affects large-diameter afferent fibers of the spinal cord, which are responsible for the sensory input, and motoneurons are not directly influenced by SCS using the frequency range present in our study protocol, which is in accordance with our results [4, 25, 38, 39]. However, a computer simulation study showed that epidural stimulation having larger pulse widths can influence the motor system [40]. In an experimental approach, a previous study using adult cats has also shown that epidural stimulation operating at a lower amplitude current and long pulse width can interfere with motor neuron pathways [41].
A comprehensive examination combining computational models, intraspinal electrophysiological measures in monkeys, and single motor unit recordings in humans with motor paralysis (SCI) revealed that SCS activates motoneuron action potentials, and that residual supraspinal inputs might be of relevance for this activity. This study implies that the efficacy of SCS in facilitating motor control may be inversely proportional to the severity of supraspinal axon loss [1] (data originate from a preprint). However, in our study, we did not see an impact of SCS on motor unit behavior in chronic pain patients supposedly not having supraspinal axon loss. Overall, our findings align with results of prior investigations employing distinct forms of non-invasive brain stimulation technique. A study employing transcranial alternating current stimulation specifically targeting the motor cortex area yielded concordant results, revealing no statistically significant alternations in motoneuron activity [42]. Our results demonstrated some intra-individual variabilities; however, there was no specific pattern, and, for each subject, we found diverse differences between the stimulation conditions (‘Supplementary Material’).
These differences could occur due to a training effect over time, as the participants' performance improved in following the ramps, even though they practiced following the ramps during the warmup. Notably, some participants complained increased pain levels at the beginning, leading to difficulties while executing the movement due to the 7 days with the SCS Off condition. These observations supported the therapeutic effects of the SCS therapy as an adjunctive pain intervention.
Limitations and Biasing Considerations
Finally, several potential limitations need to be considered. First, the small sample size promotes potential biases in the results and limits the statistical power of the conclusions of our study. Secondly, the TA muscle is innervated by the segments L5/S1, and the SCS leads in our study were intentionally implanted and applied for pain at level Th7/8, explaining the lack of observed effects and highlighting the sensory-focused nature of SCS in this context. Lastly, the heterogeneity of the study cohort, the duration and variability of the applied stimulation parameters and waveforms, along with the lack of HD-EMG measures after significantly upregulated SCS amplitudes and intensities. However, it cannot be excluded, that intensity, frequency, and amplitude at a higher range may have evoked an increased motoneurons recruitment in our chronic pain cohort. In other studies, analyzing the TA muscle and assessing SCI participants or using computational models, stimulation was located above lumbosacral segments of the spinal cord [3, 25, 38]. A study by Rattay et al. [38] demonstrated that the recruitment threshold of muscles in the legs relies on the placement of the cathode electrode. Greiner et al. [26] showed that the efficacy of SCS in eliciting muscle-controlling nerve cell activation in the upper signal region is contingent upon the direct stimulation of sensory nerves in a specific spinal pattern, necessitating optimal electrode placement on the lateral aspect of the spine. However, in our study, the epidural electrodes were placed in the anatomical midline of the spinal cord confirmed by intra-operative image guidance, which could in part explain our findings. This is of importance as the anatomic mid-line may not represent the neurophysiological midline. These findings are in line with another study using transcutaneous stimulation of the spinal cord observing that motor fibers are more likely to be activated by caudal stimulation over L5/S1 [43]. It is noteworthy that, although the participants in this study did not suffer from motor impairment of the lower extremities (contrary to the patients with SCI receiving SCS), their motoneurons could still differ from healthy patients, as chronic pain can lead to protective posture and over time promoting abnormal and/or altered motor function [44]. For instance, Martinez-Valdes et al. [45], among other studies, demonstrated that pain could modify synaptic input of the motor neuron pool leading to the assumption that deteriorated motor unit behavior could present in chronic pain patients [45–48].
Conclusions
Our study's findings indicate that thoracic spinal cord stimulation does not appear to exert any discernible influence on the recruitment of motoneurons across diverse spinal cord stimulation patterns compared to SCS “off”. Although generalization of the study findings is limited and does not provide high-class evidence, the rationale of the study appears to be reasonable, as structural and functional alterations of peripheral nerves may promote altered movement patterns, muscle imbalances, or deterioration of posture, which in turn could drive chronic pain maintenance.
However, these paucities may not limit the value, and efforts undergone to execute this study as these objective measures may hold valuable clinical potential. This study protocol should be re-examined under large-scale and randomized study protocols specifically assessing several levels of the spinal cord (e.g., cervical, thoracal, and lumbosacral), which could yield a higher evidence level.
Supplementary Information
Below is the link to the electronic supplementary material.
Acknowledgements
The present work was performed in fulfillment of the requirements for obtaining the degree "Dr. med." of Carolyn Riera at the Medical Faculty Erlangen, Friedrich-Alexander-University Erlangen-Nürnberg. Gratitude is expressed to the patients, which participated in this study.
Medical Writing/Editorial Assistance
We thank Patricia Bayer for her assistance with the experiments.
Author Contributions
All authors contributed to the study conception and design. Material preparation, data collection and analysis were performed by Carolyn Riera, Daniela Souza de Oliveira, Alessandro Del Vecchio and Thomas Kinfe. The first draft of the manuscript was written by Carolyn Riera and Daniela Souza de Oliveira and accordingly revised by Matthias Borutta, Martin Regensburger, Steffen Brenner, Yining Zhao, Alessandro Del Vecchio and Thomas Kinfe. All authors approved the final manuscript.
Funding
No funding or sponsorship was received for this study or publication of this article.
Data Availability
The data generated or analyzed during this study are included in this published article/as supplementary information files.
Declarations
Conflict of Interest
Thomas Kinfe is an Editorial Board member of Pain & Therapy. Thomas Kinfe was not involved in the selection of peer reviewers for the manuscript nor any of the subsequent editorial decisions. Thomas M. Kinfe received speaker´s fee and consulting honoraria from Abbott Inc.. Carolyn Riera, Daniela Souza de Oliveira, Alessandro Del Vecchio, Matthias Borutta, Martin Regensburger, Steffen Brenner and Yining Zhao have no conflict of interest to declare.
Ethical Approval
The research protocol was complying with the Declaration of Helsinki and was approved by the University of Erlangen Ethics Approvals Sub-Committee (IRB No. 19-339_2-B). All recruited subjects signed a written informed consent for participation in the study.
Footnotes
Carolyn Riera and Daniela Souza de Oliveira have contributed equally to this work.
References
- 1.Balaguer JM, Prat-Ortega G, Verma N, et al. Supraspinal control of motoneurons after paralysis enabled by spinal cord stimulation. medRxiv. 2023;24:1677. [Google Scholar]
- 2.Harkema S, Gerasimenko Y, Hodes J, et al. Effect of epidural stimulation of the lumbosacral spinal cord on voluntary movement, standing, and assisted stepping after motor complete paraplegia: a case study. Lancet. 2011;377:1938–47. [DOI] [PMC free article] [PubMed] [Google Scholar]
- 3.Ibáñez J, Angeli CA, Harkema SJ, Farina D, Rejc E. Recruitment order of motor neurons promoted by epidural stimulation in individuals with spinal cord injury. J Appl Physiol. 2021;131:1100–10. [DOI] [PMC free article] [PubMed] [Google Scholar]
- 4.Minassian K, Persy I, Rattay F, Pinter MM, Kern H, Dimitrijevic MR. Human lumbar cord circuitries can be activated by extrinsic tonic input to generate locomotor-like activity. Hum Mov Sci. 2007;26:275–95. [DOI] [PubMed] [Google Scholar]
- 5.Raja SN, Carr DB, Cohen M, Finnerup NB, Flor H, Gibson S, Keefe FJ, Mogil JS, Ringkamp M, Sluka KA, Song XJ, Stevens B, Sullivan MD, Tutelman PR, Ushida T, Vader K. The revised International Association for the Study of Pain definition of pain: concepts, challenges, and compromises. Pain. 2020;161(9):1976–82. 10.1097/j.pain.0000000000001939. [DOI] [PMC free article] [PubMed] [Google Scholar]
- 6.Fogel GR, Esses SI, Calvillo O. Management of chronic limb pain with spinal cord stimulation. Pain Pract. 2003;3:144–51. [DOI] [PubMed] [Google Scholar]
- 7.Kilchukov M, Kiselev R, Gorbatykh A, Klinkova A, Murtazin V, Kamenskaya O, Orlov K. High-frequency versus low-frequency spinal cord stimulation in treatment of chronic limb-threatening ischemia: short-term results of a randomized trial. Stereotact Funct Neurosurg. 2023;101(1):1–11. 10.1159/000527309. [DOI] [PubMed] [Google Scholar]
- 8.Shealy CN, Mortimer JT, Reswick JB. Electrical inhibition of pain by stimulation of the dorsal columns: preliminary clinical report. Anesth Analg. 1967;46:489–91. [PubMed] [Google Scholar]
- 9.Zhou L, Chen F, Pan Y, Wang L, Xu L, Huang P, Wang L, Luo N, Li P, Li D, Liu J. Spinal cord stimulation for postural abnormalities in Parkinson’s disease: 1-year prospective pilot study. BMC Neurol. 2024;24(1):167. 10.1186/s12883-024-03673-5. [DOI] [PMC free article] [PubMed] [Google Scholar]
- 10.Blahak C, Sauer T, Baezner H, et al. Long-term follow-up of chronic spinal cord stimulation for medically intractable orthostatic tremor. J Neurol. 2016;263:2224–8. [DOI] [PubMed] [Google Scholar]
- 11.Pinter MM, Gerstenbrand F, Dimitrijevic MR. Epidural electrical stimulation of posterior structures of the human lumbosacral cord: 3. Control of spasticity. Spinal Cord. 2000;38:524–31. [DOI] [PubMed] [Google Scholar]
- 12.Ahmed SU, Zhang Y, Chen L, St Hillary K, Cohen A, Vo T, et al. Effects of spinal cord stimulation on pain thresholds and sensory perceptions in chronic pain patients. Neuromodulation. 2015;18:355–60. [DOI] [PubMed] [Google Scholar]
- 13.Bordeleau M, Carrondo Cottin S, Cantin L, Gaudin D, Alnemari A, Canuel JF, Fugère F, Fournier-Gosselin MP, Vollert J, Prud’Homme M. Effects of tonic spinal cord stimulation on external mechanical and thermal stimuli perception using quantitative sensory testing: a multicenter stimulation ON-OFF study on chronic pain patients. Clin J Pain. 2020;36(3):189–96. 10.1097/AJP.0000000000000791. [DOI] [PubMed] [Google Scholar]
- 14.Yue JJ, Gilligan CJ, Falowski S, Jameson J, Desai MJ, Moeschler S, Pilitsis J, Heros R, Tavel E, Wahezi S, Funk R, Buchanan P, Christopher A, Weisbein J, Patterson D, Levy R, Antony A, Miller N, Scarfo K, Kreiner S, Wilson D, Lim C, Braun E, Dickerson D, Duncan J, Xu J, Candido K, Mohab I, Michael F, Blomme B, Okaro U, Deer T. Surgical treatment of refractory low back pain using implanted BurstDR spinal cord stimulation (SCS) in a cohort of patients without options for corrective surgery: findings and results from the DISTINCT study, a prospective randomized multi-center-controlled trial. N Am Spine Soc J. 2024;19: 100508. 10.1016/j.xnsj.2024.100508. [DOI] [PMC free article] [PubMed] [Google Scholar]
- 15.Chakravarthy KV, Chaturvedi R, Agari T, Iwamuro H, Reddy R, Matsui A. Single arm prospective multicenter case series on the use of burst stimulation to improve pain and motor symptoms in parkinson’s disease. Bioelectron Med. 2020;6:18. [DOI] [PMC free article] [PubMed] [Google Scholar]
- 16.Deer TR, Russo M, Grider JS, Sayed D, Lamer TJ, Dickerson DM, Hagedorn JM, Petersen EA, Fishman MA, FitzGerald J, Baranidharan G, De Ridder D, Chakravarthy KV, Al-Kaisy A, Hunter CW, Buchser E, Chapman K, Gilligan C, Hayek SM, Thomson S, Strand N, Jameson J, Simopoulos TT, Yang A, De Coster O, Cremaschi F, Christo PJ, Varshney V, Bojanic S, Levy RM. The neurostimulation appropriateness consensus committee (NACC)®: recommendations for spinal cord stimulation long-term outcome optimization and salvage therapy. Neuromodulation. 2024;27(6):951–76. 10.1016/j.neurom.2024.04.006. [DOI] [PubMed] [Google Scholar]
- 17.Kinfe T, von Willebrand N, Stadlbauer A, et al. Quantitative sensory phenotyping in chronic neuropathic pain patients treated with unilateral L4-dorsal root ganglion stimulation. J Transl Med. 2020;18:403. [DOI] [PMC free article] [PubMed] [Google Scholar]
- 18.Menezes JR, Nunes GA, Carra RB, et al. Trans-spinal theta burst magnetic stimulation in parkinson’s disease and gait disorders. Mov Disord. 2024;39:1048–53. [DOI] [PubMed] [Google Scholar]
- 19.Morgalla MH, Filho MFDB, Chander BS, Soekadar SR, Tatagiba M, Lepski G. Neurophysiological effects of dorsal root ganglion stimulation (DRGS) in pain processing at the cortical level. Neuromodulation. 2019;22:36–43. [DOI] [PubMed] [Google Scholar]
- 20.Urasaki E, Miyagi Y, Muramatsu S, Ezaki Y. Comparison of the interference effects on somatosensory evoked potential from tonic, burst, and high-dose spinal cord stimulations. Neurol Med Chir (Tokyo). 2022;62:313–21. [DOI] [PMC free article] [PubMed] [Google Scholar]
- 21.Vanneste S, de Ridder D. BurstDR spinal cord stimulation rebalances pain input and pain suppression in the brain in chronic neuropathic pain. Brain Stimul. 2023;16:1186–95. [DOI] [PubMed] [Google Scholar]
- 22.Yearwood T, de Ridder D, Yoo HB, et al. Comparison of neural activity in chronic pain patients during tonic and burst spinal cord stimulation using fluorodeoxyglucose positron emission tomography. Neuromodulation. 2020;23:56–63. [DOI] [PubMed] [Google Scholar]
- 23.Henneman E. Relation between size of neurons and their susceptibility to discharge. Science. 1957;126:1345–7. [DOI] [PubMed] [Google Scholar]
- 24.Monti RJ, Roy RR, Edgerton VR. Role of motor unit structure in defining function. Muscle Nerve. 2001;24:848–66. [DOI] [PubMed] [Google Scholar]
- 25.Capogrosso M, Wenger N, Raspopovic S, et al. A computational model for epidural electrical stimulation of spinal sensorimotor circuits. J Neurosci. 2013;33:19326–40. [DOI] [PMC free article] [PubMed] [Google Scholar]
- 26.Greiner N, Barra B, Schiavone G, et al. Recruitment of upper-limb motoneurons with epidural electrical stimulation of the cervical spinal cord. Nat Commun. 2021;12:435. [DOI] [PMC free article] [PubMed] [Google Scholar]
- 27.Niso G, Tjepkema-Cloostermans MC, Lenders M, de Vos CC. Modulation of the somatosensory evoked potential by attention and spinal cord stimulation. Front Neurol. 2021;12: 694310. [DOI] [PMC free article] [PubMed] [Google Scholar]
- 28.Negro F, Muceli S, Castronovo AM, Holobar A, Farina D. Multi-channel intramuscular and surface EMG decomposition by convolutive blind source separation. J Neural Eng. 2016;13: 026027. [DOI] [PubMed] [Google Scholar]
- 29.Vecchio AD, Farina D. Interfacing the neural output of the spinal cord: robust and reliable longitudinal identification of motor neurons in humans. J Neural Eng. 2020;17: 016003. [DOI] [PubMed] [Google Scholar]
- 30.Holobar A, Minetto MA, Farina D. Accurate identification of motor unit discharge patterns from high-density surface EMG and validation with a novel signal-based performance metric. J Neural Eng. 2014;11: 016008. [DOI] [PubMed] [Google Scholar]
- 31.Holobar A, Minetto MA, Botter A, Negro F, Farina D. Experimental analysis of accuracy in the identification of motor unit spike trains from high-density surface EMG. IEEE Trans Neural Syst Rehabil Eng. 2010;18:221–9. [DOI] [PubMed] [Google Scholar]
- 32.Holobar A, Zazula Z. Multichannel blind source separation using convolution kernel compensation. IEEE Trans Signal Process. 2007;55:4487–96. [Google Scholar]
- 33.Martinez-Valdes E, Laine CM, Falla D, Mayer F, Farina D. High-density surface electromyography provides reliable estimates of motor unit behavior. Clin Neurophysiol. 2016;127:2534–41. [DOI] [PubMed] [Google Scholar]
- 34.Holobar A, Farina D, Gazzoni M, Merletti R, Zazula D. Estimating motor unit discharge patterns from high-density surface electromyogram. Clin Neurophysiol. 2009;120:551–62. [DOI] [PubMed] [Google Scholar]
- 35.del Vecchio A, Holobar A, Falla D, Felici F, Enoka RM, Farina D. Tutorial: analysis of motor unit discharge characteristics from high-density surface EMG signals. J Electromyogr Kinesiol. 2020;53: 102426. [DOI] [PubMed] [Google Scholar]
- 36.del Vecchio A, Sylos-Labini F, Mondì V, et al. Spinal motoneurons of the human newborn are highly synchronized during leg movements. Sci Adv. 2020;6: eabc3916. [DOI] [PMC free article] [PubMed] [Google Scholar]
- 37.Jubeau M, Gondin J, Martin A, Sartorio A, Maffiuletti NA. Random motor unit activation by electrostimulation. Int J Sports Med. 2007;28:901–4. [DOI] [PubMed] [Google Scholar]
- 38.Rattay F, Minassian K, Dimitrijevic MR. Epidural electrical stimulation of posterior structures of the human lumbosacral cord: 2. Quantitative analysis by computer modeling. Spinal Cord. 2000;38:473–89. [DOI] [PubMed] [Google Scholar]
- 39.Hofstoetter US, Danner SM, Freundl B, et al. Periodic modulation of repetitively elicited monosynaptic reflexes of the human lumbosacral spinal cord. J Neurophysiol. 2015;114:400–10. [DOI] [PMC free article] [PubMed] [Google Scholar]
- 40.Xu Q, Kong L, Zhou H, He J. Epidural stimulation of rat spinal cord at lumbosacral segment using a surface electrode: a computer simulation study. IEEE Trans Neural Syst Rehabil Eng. 2017;25:1763–72. [DOI] [PubMed] [Google Scholar]
- 41.Iwahara T, Atsuta Y, Garcia-Rill E, Skinner RD. Spinal cord stimulation-induced locomotion in the adult cat. Brain Res Bull. 1992;28:99–105. [DOI] [PubMed] [Google Scholar]
- 42.Ibáñez J, Zicher B, Brown KE, et al. Standard intensities of transcranial alternating current stimulation over the motor cortex do not entrain corticospinal inputs to motor neurons. J Physiol. 2023;601:3187–99. [DOI] [PubMed] [Google Scholar]
- 43.Roy FD, Gibson G, Stein RB. Effect of percutaneous stimulation at different spinal levels on the activation of sensory and motor roots. Exp Brain Res. 2012;223:281–9. [DOI] [PubMed] [Google Scholar]
- 44.Lund JP, Donga R, Widmer CG, Stohler CS. The pain-adaptation model: a discussion of the relationship between chronic musculoskeletal pain and motor activity. Can J Physiol Pharmacol. 1991;69:683–94. [DOI] [PubMed] [Google Scholar]
- 45.Martinez-Valdes E, Negro F, Farina D, Falla D. Divergent response of low- versus high-threshold motor units to experimental muscle pain. J Physiol. 2020;598:2093–108. [DOI] [PubMed] [Google Scholar]
- 46.Farina D, Arendt-Nielsen L, Graven-Nielsen T. Experimental muscle pain reduces initial motor unit discharge rates during sustained submaximal contractions. J Appl Physiol. 2005;98:999–1005. [DOI] [PubMed] [Google Scholar]
- 47.Farina D, Arendt-Nielsen L, Merletti R, Graven-Nielsen T. Effect of experimental muscle pain on motor unit firing rate and conduction velocity. J Neurophysiol. 2004;91:1250–9. [DOI] [PubMed] [Google Scholar]
- 48.Sohn MK, Graven-Nielsen T, Arendt-Nielsen L, Svensson P. Inhibition of motor unit firing during experimental muscle pain in humans. Muscle Nerve. 2000;23:1219–26. [DOI] [PubMed] [Google Scholar]
Associated Data
This section collects any data citations, data availability statements, or supplementary materials included in this article.
Supplementary Materials
Data Availability Statement
The data generated or analyzed during this study are included in this published article/as supplementary information files.