

Abstract
The evolutionary transition from solitary life to group‐living in a society with cooperative brood care, reproductive division of labor and morphological castes is associated with increased cognitive demands for task‐specialization. Associated with these demands, the brains of eusocial Hymenoptera divide transcriptomic signatures associated with foraging and reproduction to different populations of cells and also show diverse astrocyte and Kenyon cell types compared with solitary non‐hymenopteran insects. The neural architecture of subsocial bees, which represent evolutionary antecedent states to eusocial Hymenoptera, could then show how widely this eusocial brain is conserved across aculeate Hymenoptera. Using single‐nucleus transcriptomics, we have created an atlas of neuron and glial cell types from the brain of a subsocial insect, the small carpenter bee (Ceratina calcarata). The proportion of C. calcarata neurons related to the metabolism of classes of neurotransmitters is similar to that of other insects, whereas astrocyte and Kenyon cell types show highly similar gene expression patterns to those of eusocial Hymenoptera. In the winter, the transcriptomic signature across the brain reflected diapause. When the bee was active in the summer, however, genes upregulated in neurons reflected foraging, while the gene expression signature of glia associated with reproductive functions. Like eusocial Hymenoptera, we conclude that neural components for foraging and reproduction in C. calcarata are compartmentalized to different parts of its brain. Cellular examination of the brains of other solitary and subsocial insects can show the extent of neurobiological conservation across levels of social complexity.
Keywords: brain evolution, cell type evolution, diapause, neurotransmitters, single cell, sociality
Single‐cell gene expression was used to develop the first brain atlas for a small carpenter bee describing neurons and glia cell types for this species. Astrocytes and Kenyon cell types are conserved across Hymenoptera in comparison to Diptera. Gene expression related to foraging and reproduction are separated to different brain cell populations.

1. INTRODUCTION
The brains of many social animals differ in size and structure from those that are not social ( 5 ; reviewed in 6 ). Due to a number of correlated factors, the evolutionary drivers of the social brain can be challenging to identify. Because group size is correlated with brain size in some social vertebrates, the need for communication among group members may have influenced the size of the brain. 7 Conversely, regions of the insect brain involved in communication and recognition of others depend on group size (reviewed in 8 , 9 ). Associated traits of a social animal's lifestyle can also influence its neural architecture (reviewed in 10 ). For instance, the ability to create a nest and the degree of task‐specialization are linked to the size of regions of a social insect's brain. 11 , 12 An animal's foraging preferences may also drive brain evolution of social animals: the dietary preferences of mammals is associated with their brain size 13 ; and the degree of foraging specialization is linked to the size of brain regions in some beetle and bee species. 14 , 15 While the size of specific regions of the brain related to social living is generally dependent on the size of an animal's body, 16 a brain region can also be influenced by the development of other portions of the brain. 17 , 18 These compartments of the brain therefore show allometric relationships that differ by the taxon (reviewed in 8 ).
While the sizes of specific regions of the brain differ by an animal's social environment in multiple lineages, 19 , 20 , 21 , 22 cellular data can suggest cell types that are associated with social behavior. 23 Gene expression specific to populations of neurons likely emerged from the regulation of genetic programs in ancestral secretory cells. 24 , 25 While some vertebrate neuron types are conserved over evolution, the diversification of neuron cell types follows a model of duplication followed by functional divergence of gene regulatory programs. 26 , 27 , 28 In hymenopteran insects, the duplication and divergence model of cell type evolution is also supported for the evolution of Kenyon cells that reside in the Mushroom Body (MB), 29 a brain region thought to be involved in the recognition of others (reviewed in 30 ). Complex animal brains have also evolved a diversity of glia ( 31 ; reviewed in 32 ). One type of glia, astrocytes, have diversified into multiple types in mammals as well as in social insects. 3 , 33 The evolution of myelination and ensheathment functions in glia facilitated more efficient information transfer by neurons (reviewed in 34 ), suggesting that both neurons and glia could have diversified in response to the cognitive demands of social life.
The brains of solitary animals were thought to differ from those that are eusocial due to life‐history traits, 35 like a division of reproduction among individuals, overlapping generations and cooperative care of brood. 36 Diapause, a period of diminished metabolism, behavioral activity and ovarian activity (reviewed in 37 ), exerts different effects on solitary and eusocial bees. 38 For instance, the experience of diapause for larvae of some bee and wasp species determines whether they become queens as opposed to workers. 39 , 40
Unlike eusocial organisms, solitary females raise brood without the help of others. 41 Solitary insects can be distinguished from subsocial ones who extend parental care beyond the brood's egg phase of development (reviewed in 42 ). Subsociality is thought to be a prerequisite and evolutionary antecedent to eusocial life from solitary ancestors in Hymenoptera (reviewed in 41 , 43 ). The foraging that contributes to the prolonged brood care behavior of subsociality may have become uncoupled from reproduction in an ancestral insect to facilitate group‐living. 44 Because brood care is also prominent in eusociality, 36 the neural architecture of eusocial insects may be shared with a subsocial mother bee that provides extended care for her offspring.
Using the growing number of insect genomes as references for mapping gene transcription, 45 single‐cell transcriptomics of the insect brain has showed various types of neurons (reviewed in 46 ). Visual information is captured by insect photoreceptors that interact with other neurons in the optic lobe, which replicate into adulthood. 47 , 48 Optic lobe cells of the pharaoh ant, Monomorium pharaonsis, are transcriptionally‐similar to the fruit fly, Drosophila melanogaster. 4 Neurophysiological activity in these cells precedes attention to visual stimuli in both the honey bee, Apis mellifera and D. melanogaster, suggesting highly conserved function. 49 , 50 In D. melanogaster, three types of Kenyon cells (e.g. α/β, α′/β′, γ 51 ), are involved in learning and memory. 52 In contrast, four types of Kenyon cells have been identified in A. mellifera, consisting of class II neurons and three categories of class I neurons (large, medium, small 53 ).
The relative abundance of neurons that synthesize and release specific neurotransmitters can be associated with specific neurophysiological and behavioral functions in insects. 54 , 55 Acetylcholine is excitatory, stimulating body growth and food intake in D. melanogaster. 56 Gamma‐aminobutyric acid (GABA) is an inhibitory neurotransmitter related to learning in D. melanogaster, 57 but also feeding in D. melanogaster and in A. mellifera. 58 , 59 In these species, glutamate, another neurotransmitter, can be inhibitory in the antennal lobe. 60 , 61 Monoaminergic neurons, comprising those that release the neurotransmitters serotonin, dopamine, tyramine, octopamine, and histamine, are related to aggression in many insects (reviewed in 62 ), but seem to only be linked to reproduction in social ones (reviewed in 63 ). In D. melanogaster and A. mellifera, the abundance of classes of neurons that express neurotransmitters are similar: cholinergic neurons are the most abundant and monoaminergic neurons are the rarest; and GABAergic and glutamatergic neurons show intermediate abundance. 55 , 64
Non‐neuronal cells in the insect brain vary in their location and function. Glia relate to homeostasis and consist of cortex glia, ensheathing glia, astrocytes, and surface glia in solitary and social insects ( 4 ; reviewed in 32 ). Cortex glia cover somata of neurons, astrocytes contact synapses, and ensheathing glia ensconce axons of D. melanogaster (reviewed in 32 ). Surface glia, comprised of perineurial and subperineurial subtypes, comprise the blood–brain barrier that regulates the traffic of molecules like hemocyte cells of the immune system between the brain and hemolymph. 65 In addition to glia, hemocytes have been found in the brain of D. melanogaster as well as A. mellifera. 1 , 48
The expression of genes characteristic of specific insect brain cell types have been used to demarcate homologous cell types in the brains of solitary and social insect species. 4 , 48 , 66 For instance, multiple astrocyte cell types exist in eusocial insects like the Indian jumping ant Harpegnathos saltator, M. pharaonsis and A. mellifera compared with the solitary D. melanogaster. 1 , 3 , 4 , 48 Among neurons, Kenyon cells can be divided into two broad classes, A and B. 4 Kenyon cells Class B (KCB) consist of class I‐small, class I‐medium and class II Kenyon cells of A. mellifera as well as α′/β′ and γ types of D. melanogaster. 4 The diverse class I Kenyon cells of eusocial Hymenoptera likely originated from an increase in the number of cell types linked to parasitism in Apocrita, followed by at least a second diversification event associated with nidification in Aculeata. 67
In contrast to the expression of reproductive genes that is similar across brain cell types of D. melanogaster, 2 genes linked to foraging and reproduction are expressed in distinct population of brain cells of eusocial insects that resemble brain compartments. 1 , 64 As an example, the reproductive activity of individual H. saltator and A. mellifera is associated with specific transcriptomic signatures in ensheathing glia. 3 , 64 Foraging and non‐foraging workers of the Florida carpenter ant, Camponotus floridanus, however, differ in the gene expression of their surface glia. 68 It remains unclear if this transcriptomic compartmentalization of reproduction and foraging also exists in the brain cells of non‐eusocial Hymenoptera.
Because the brain of a subsocial insect represents a simple form of insect sociality, 41 the subsocial hymenopteran brain may share characteristics with social Hymenoptera. The small carpenter bee, Ceratina calcarata, shows subsociality by caring for its offspring as they develop, especially by provisioning them with food as adults. 69 Brain gene expression, neuroanatomy and biogenic amine examination of C. calcarata suggest that learning is associated with foraging behavior. 70 , 71 , 72 , 73 Other work has characterized the gene expression in the brain during a quiescent diapause state while overwintering. 74 The reference genome models assembled for this species allow mapping of transcriptomes from single‐cell analysis. 75 , 76
Using bioinformatic techniques, we evaluate if the diversity of cell types observed in the eusocial hymenopteran brain is present in a less socially complex insect with rudimentary behaviors needed for group‐living. We first characterize the cell types in the C. calcarata brain by integrating samples from adult females collected during the summer, when they are reproductive and foraging, as well as those from winter when the bee undergoes diapause. Then, we analyze gene expression and enrichment across cell types to evaluate where the transcriptomic signals for reproduction, foraging and diapause emerge in the brain. Finally, we assess the transcriptional similarity of groups of brain cells in C. calcarata to cell types in solitary D. melanogaster and in the eusocial aculeate Hymenoptera species A. mellifera, H. saltator and M. pharaonsis.
2. MATERIALS AND METHODS
Detailed methods on field collection, data processing and bioinformatics are provided in the supplement. We collected samples of six C. calcarata adult females from raspberry and sumac stems in Toronto, Canada at two time points in 2022 (Table S1). The two time points comprised a winter sample of three bees from one nest and three bees from three additional nests when they underwent diapause (Biosample: SAMN38226699); and a summer sample of six reproductive and foraging mothers each from different nests (Biosample: SAMN38227370). From fresh‐frozen brains of each sample, personnel from the Princess Margaret Genomics Centre isolated, barcoded and lysed nuclei with 10X Genomics technology to prepare dual index paired‐end cDNA libraries for sequencing. We then mapped reads to the C. calcarata genome, 75 and filtered the gene expression matrices of ambient RNA, empty droplets and doublets. 77 We then normalized counts for variation in the sequencing depth of nuclei by fitting counts to a negative binomial model according to recommended techniques with the package SCTransform 78 , 79 , 80 in Seurat (v. 4.3.0; 81 ) in R (v. 4.2.3, 82 ).
With canonical correlation analysis in Seurat, 83 we then created an integrated object of 8495 nuclei and 13,374 genes to account for differences in each sample. Using a gene annotation of C. calcarata supplemented by 8 D. melanogaster and 82 A. mellifera orthologs, we identified markers of hemocyte, glia and neuron cell types in the C. calcarata object. 63 , 64 Using highly‐variable genes to calculate principal components, we then clustered the nuclei of the C. calcarata object in two dimensions of variance with the Louvain algorithm using Seurat::FindClusters. From violin plots, we identified and removed one cluster of 145 hemocytes before re‐clustering the remaining 8350 nuclei into 10 clusters of neurons and glia cell types. We compared the relative gene expression of orthologs in each cluster to all other nuclei to label them as cell types, a recommended method that balances precision and recall. 84 To characterize gene functions in each C. calcarata neuron and glia cell type associated with diapause in the winter as well as reproduction and foraging in the summer, we calculated Gene Ontology (GO) enrichment in each cell type with topGO (v. 2.48.0, 85 ) between the summer and winter samples from the associated GO annotations of differentially‐expressed genes (DEGs) calculated using Wilcoxon tests in Seurat. 86
Using orthologs of D. melanogaster, we then estimated the proportion of neurons involved in the metabolism of different classes of neurotransmitters in the brains of different species. For C. calcarata (this study), H. saltator, 3 and A. mellifera, 1 , 29 , 86 we estimated orthologs related to the synthesis and release of neurotransmitters with BLAST (v. 2.14.0, 87 ; Table S22). We used D. melanogaster orthologs for M. pharaonsis calculated in another study. 4 Using Seurat, we then estimated the abundance of cholinergic, GABAergic, glutamatergic and monoaminergic neurons relative to all neurons in the brain for cell‐type atlases of C. calcarata, A. mellifera, 1 M. pharaonsis, 4 H. saltator, 3 and D. melanogaster. 2
To evaluate the degree of analogy of the cell types in the C. calcarata brain to those in the brains of solitary and social insects, we then re‐clustered specific cell type clusters from the integrated brain atlas (Figure 1) into subclusters and assessed the similarity of the transcriptional signatures of D. melanogaster orthologs to brain cell types from other species. Specifically, we used Metaneighbor (v. 1.16.0, 88 ) to calculate AUROC scores that indicate the transcriptional similarity of C. calcarata subclusters to clusters of solitary D. melanogaster 2 and social Hymenoptera that include M. pharaonsis, 4 H. saltator, 3 and A. mellifera. 1 , 29 , 86
FIGURE 1.

The brain atlas of 8350 nuclei, divided into 10 clusters using Seurat that are then annotated with cell types using the relative expression of canonical markers, some of which are mentioned in Table 1. The cluster number is listed in the legend and the corresponding cell type of each cluster is indicated.
3. RESULTS
3.1. Integrated C. calcarata brain atlas and comparison to other insect brains
We integrated the gene expression of 13,374 annotated genes across 8495 nuclei from the brains of bees collected in the winter and in the summer to create an atlas of neuron and glia cell types of C. calcarata. After quality‐control filtering, we clustered 8350 nuclei into seven neural and three glial cell types based on the expression of orthologs that serve as markers for specific cell types (Figure 1). Kenyon cells, photoreceptors and non‐photoreceptor optic lobe cells could be identified among the neurons, while glia consisted of astrocytes, cortex, surface and ensheathing glia (Table 1). The proportions of neurons that express markers indicative of the synthesis and/or release of different classes of neurotransmitters is similar in the C. calcarata brain and those of D. melanogaster, H. saltator, M. pharaonsis and A. mellifera: cholinergic neurons are the most common; GABAergic and glutamatergic neurons are less abundant; and monoaminergic neurons are the rarest (Figure 2).
TABLE 1.
The cluster number, cell‐type label and notable markers for each cluster of 8350 total cells in the integrated C. calcarata brain atlas.
| Cluster number | Cell type | Notable markers | Winter cells | Summer cells | DEGs upregulated in winter | DEGs upregulated in summer |
|---|---|---|---|---|---|---|
| 0,6,7 | Unidentified neurons | nSyb, Syt1, elav | 1482 | 1809 | 116 | 90 |
| 1 | Kenyon cells‐Class B (KCB) | mub, tk | 721 | 808 | 53 | 49 |
| 2 | Kenyon cells‐Class A (KCA) | CamKii, Mblk‐1, mub, tk, Fas2 | 530 | 548 | 150 | 182 |
| 3 | Ensheathing glia | idgf4; tsf1 | 442 | 462 | 50 | 71 |
| 4 | Optic lobe cells (non‐photoreceptors) | Nlg2; SoxN; Lim1 | 361 | 245 | 107 | 88 |
| 5 | Cortex glia/astrocytes | Cortex: wrapper, zyd Astrocyte: Eaat1, Gs2 | 372 | 180 | 116 | 108 |
| 8 | Surface glia | Tret1, svp; Mdr49 | 85 | 152 | 286 | 157 |
| 9 | Photoreceptors | ninaB, ninaC, trp | 44 | 109 | 162 | 65 |
Note: The quantity of cells in each cluster as well as the differentially expressed genes (DEGs) significantly upregulated in the winter sample compared with the summer sample are also indicated for each cluster.
Note: Bold indicate a group of cells where more genes are upregulated in the summer rather than in the winter sample.
FIGURE 2.
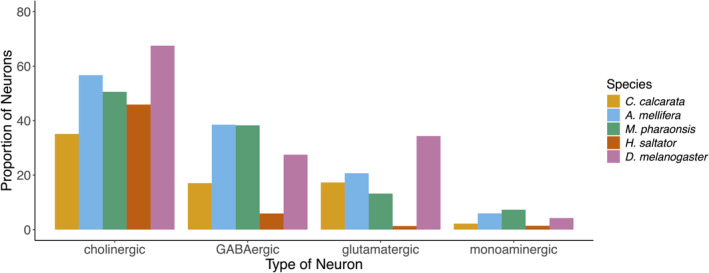
Proportion of neurons that express genes indicating the synthesis and/or release of classes of neurotransmitters estimated from the brain atlases of C. calcarata (this study), A. mellifera, 1 M. pharaonsis, 4 H. saltator, 3 and D. melanogaster. 2
3.2. Comparison of gene expression in brain cell types between the summer and winter samples
To evaluate how gene expression changes in C. calcarata brain cell types as it progresses from an overwintering diapause phenotype to a reproductive and foraging one, we calculated the number of differentially expressed genes (DEGs) and the enrichment of GO terms linked to these genes between the summer and winter samples in the integrated brain atlas. Sixty‐six DEGs were significantly upregulated in the summer sample in all neurons, including apisimin and the potassium voltage‐gated channel protein Shab (shab) (Figure 3, Table S23). Neurons showed GO term enrichment for TORC1 signaling (GO:0038202) and various metabolic or biosynthetic processes (Tables 2 and S25). A total of 182 DEGs were upregulated in the summer sample in Kenyon cells‐Class A (KCA) that were enriched for visual learning (GO:0008542; Tables 2 and S25). This enrichment is supported by the expression of fasciculation and elongation protein zeta‐2 (fez2) and the calcium‐activated potassium channel slowpoke (slo) (Tables 2 and S23). In non‐photoreceptor optic lobe cells, 88 DEGs were upregulated in the summer sample. Cognition (GO:0050890) was enriched in these cells, which is supported by the upregulation of scoloptoxin SSD14 and the sodium channel protein 60E (NaCP60E; Table 2). Tachykinin receptor signaling (GO:0007217) and neuropeptide signaling (GO:0007218) were also enriched in non‐photoreceptor optic lobe cells, which is supported by two DEGs: the SH2 domain‐containing adapter protein F (shf); and the programmed cell death protein 2‐like (pdcd2l). Optic lobe cell enrichment also included positive regulation of axon guidance (GO:1902669) and positive regulation of canonical Wnt signaling pathway (GO:0090263; Tables 2 and S25). Sixty‐five DEGs were upregulated in the summer sample in photoreceptor cells. Photoreceptor enrichment included dendrite development (GO:0016322), regulation of multicellular organism growth (GO:0040014), neuron remodeling (GO:0016322), steroid hormone mediated signaling pathway (GO:0043401), torso signaling pathway (GO:0008293) and positive regulation of ERK1 and ERK2 cascade (GO:0070374; Table 2). Enrichment for neuron remodeling was supported by slo, while the enrichment for steroid hormone mediated signaling pathway was underpinned by expression of retinal degeneration B (rdgB), peroxisomal acyl‐coenzyme A oxidase 3 (acox3) and catenin delta‐2 (ctnnd2). Enrichment for torso signaling pathway and positive regulation of ERK1 and ERK2 cascade was supported by the expression of one gene of unknown function and inositol hexakisphosphate and diphosphoinositol‐pentakisphosphate kinase (i(1)G0196I; Table 2).
FIGURE 3.

Volcano plots showing log2 fold change difference in normalized expression on the x‐axis of 13,374 genes between the winter (W) and summer (S) samples. Significance indicated on the y‐axis by −log10 adjusted p‐values using Bonferroni correction (i.e. false detection rate, FDR) for genes in the integrated brain atlas of (A) 6657 neuron cells combined from clusters 0, 1, 2, 4, 6, 7 and 9 in Figure 1; and (B) 1693 glia cells combined from clusters 3, 5 and 8 in Figure 1. Negative log2 fold change indicates upregulation in W, whereas positive values indicate upregulation in S. Orange indicates those genes judged to be significantly differentially expressed and significantly upregulated to winter or summer with FDR <0.05 demarcated with the horizontal dashed line and log2 fold change >0.05 or < −0.05 indicated by the vertical dashed line. Purple indicates those genes with a FDR ≥0.05, while pink indicates those genes with FDR <0.05, but log2 fold change ≥ −0.5 and ≤0.5. The number of significantly differentially‐expressed genes that are upregulated in each phenotype is indicated.
TABLE 2.
Gene Ontology (GO) term enrichment in the summer sample for different brain cell types in C. calcarata. Cell cluster number refers to Table 1.
| GO | Term | Cell type | Cell cluster # |
|---|---|---|---|
| GO:1901136 | Carbohydrate derivative catabolic process | Neurons | 0,6,7,1,2,4,9 |
| GO:0009262 | Deoxyribonucleotide metabolic process | ||
| GO:0008299 | Isoprenoid biosynthetic process | ||
| GO:0038202 | TORC1 signaling | ||
| GO:0006520 | Cellular amino acid metabolic process |
Neurons Kenyon cells |
0,6,7,1,2,4,9 1,2 |
| GO:0006189 | de novo' IMP biosynthetic process | ||
| GO:0005977 | Glycogen metabolic process | ||
| GO:0045725 | Positive regulation of glycogen biosynthetic process | ||
| GO:0006268 | DNA unwinding involved in DNA replication | Kenyon cells | 1,2 |
| GO:0000161 | Osmosensory signaling MAPK cascade | ||
| GO:0008542 | Visual learning | Kenyon cells‐Class A (KCA) | 2 |
| GO:0090263 | Positive regulation of canonical Wnt signaling pathway |
Kenyon cells Optic lobe cells |
1,2 4 |
| GO:0050890 | Cognition | Optic lobe cells | 4 |
| GO:0007218 | Neuropeptide signaling pathway | ||
| GO:1902669 | Positive regulation of axon guidance | ||
| GO:0007217 | Tachykinin receptor signaling pathway | ||
| GO:0016358 | Dendrite development | Photoreceptors | 9 |
| GO:0016322 | Neuron remodeling | ||
| GO:0070374 | Positive regulation of ERK1 and ERK2 cascade | ||
| GO:0040014 | Regulation of multicellular organism growth | ||
| GO:0043401 | Steroid hormone mediated signaling pathway | ||
| GO:0008293 | Torso signaling pathway | ||
| GO:0007618 | Mating |
Glia Astrocyte/Cortex |
3,5,8 5 |
| GO:2000130 | Positive regulation of octopamine signaling pathway | ||
| GO:0060279 | Positive regulation of ovulation | ||
| GO:0046692 |
Sperm competition |
In glia, 94 genes including ecdysteroid UDP‐glucosyltransferase (egt) and vitellogenin (Vg) were significantly upregulated in the summer sample (Figure 3). Glia enrichment included mating (GO:0007618), sperm competition (GO:0046692), as well as the positive regulation of ovulation (GO:0060279) and the positive regulation of the octopamine signaling pathway (GO:2000130; Table S25). This enrichment was underpinned by the expression of three genes of unknown function as well as major royal jelly protein 1 (mrjp1; Table 2). The cluster of astrocyte and cortex glia cells showed 108 DEGs upregulated in the summer sample. These cells were also enriched for the regulation of octopamine signaling and ovulation (GO:0060279; GO:2000130; Table S25). This enrichment was supported by one gene of unknown function, mrjp1, as well as two other genes: collagen alpha chain (CG42342); and the immunoglobulin domain‐containing protein (oig‐4; Table 2).
In neurons, 80 DEGs were upregulated in the winter sample. These were enriched for cellular nitrogen compound biosynthetic process (GO:0044271) and various metabolic processes (Table S26). Enrichment in both clusters of Kenyon cells included positive regulation of phagocytosis (GO:0050766) and signaling (GO:0023052). In KCA, 150 DEGs were upregulated in the winter sample, including ubiquitin carboxyl‐terminal hydrolase 34 (usp34; Table S24). Usp34 is also included in the 162 DEGs upregulated in photoreceptors in the winter sample that were enriched for gene expression (GO:0010467), cytolysis (GO:0019835), negative regulation of neural apoptotic process (GO:0043524) and negative regulation of multicellular organism growth (GO:0040015; Table 3).
TABLE 3.
Gene Ontology (GO) term enrichment in the winter sample for different brain cell types in C. calcarata. Cell cluster number refers to Table 1.
| GO | Term | Cell type | Cell cluster # |
|---|---|---|---|
| GO:0044271 | Cellular nitrogen compound biosynthetic process | Neurons | 0,6,7,1,2,4,9 |
| GO:0006071 | Glycerol metabolic process | ||
| GO:0006796 | Phosphate‐containing compound metabolic process | ||
| GO:0019805 | Quinolinate biosynthetic process |
Neurons Kenyon Cells |
0,6,7,1,2,4,9 1,2 |
| GO:0006114 | Glycerol biosynthetic process | Kenyon Cells | 1,2 |
| GO:0046168 | Glycerol‐3‐phosphate catabolic process | ||
| GO:0006072 | Glycerol‐3‐phosphate metabolic process | ||
| GO:0050766 | Positive regulation of phagocytosis | ||
| GO:0023052 | Signaling | ||
| GO:0019835 | Cytolysis | Photoreceptors | 9 |
| GO:0010467 | Gene expression | ||
| GO:0040015 | Negative regulation of multicellular organism growth | ||
| GO:0043524 | Negative regulation of neuron apoptotic process | ||
| GO:0006950 | Response to stress |
Glia Surface Glia |
3,5,8 8 |
| GO:0032922 | Circadian regulation of gene expression | Surface Glia | 8 |
| GO:0043153 | Entrainment of circadian clock by photoperiod | ||
| GO:0008286 | Insulin receptor signaling pathway | ||
| GO:0048519 | Negative regulation of biological process | ||
| GO:0016055 | Wnt signaling pathway | ||
| GO:0051782 | Negative regulation of cell division |
Glia Ensheathing Glia |
3,5,8 3 |
| GO:0040017 | Positive regulation of locomotion | Ensheathing Glia | 3 |
Eighty‐three DEGs were upregulated in glia in the winter sample including 97 kDa heat shock protein (hsp110) and held out wings (how). Glia were enriched for response to stress (GO:0006950) as well as negative regulation of cell division (GO:0051782). The latter enrichment was supported by 40S ribosomal protein S5 (rps5) and hydroperoxide glutathione peroxidase (gpx4; Table 3). Fifty DEGs were upregulated in the winter sample in ensheathing glia (Table 1). Ensheathing glia enrichment for positive regulation of locomotion (GO:0040017) as well as negative regulation of cell division (GO:0051782) was supported by 60S ribosomal protein L9 (rpl9) and gpx4 (Table S24). Of the 286 DEGs upregulated in surface glia cells in the winter sample, enrichment includes the response to stress (GO:0006950), negative regulation of cell division (GO:0051782), insulin receptor signaling pathway (GO:0008286), circadian regulation of gene expression (GO:0032922) and entrainment of circadian clock by photoperiod (GO:0043153; Table S26). Insulin receptor signaling pathway (GO:0008286) enrichment of surface glia cells was supported by five genes: RCC1 and BTB domain‐containing protein 1 (rcbtb1); trifunctional enzyme subunit alpha 2C mitochondrial (hadha); U2 snRNP‐associated SURP motif‐containing protein (u2SURP); thioredoxin reductase 1%2C mitochondrial (trxr‐1); and probable G‐protein coupled receptor 158 (gpr158). Enrichment of circadian regulation of gene expression (GO:0032922) and entrainment of circadian clock by photoperiod (GO:0043153) were supported by a gene of unknown function, Hadha and ceramide glucosyltransferase (ugcg; Tables S24 and S26).
3.3. Transcriptional similarity to solitary and eusocial species
To evaluate the degree to which C. calcarata cell types are analogous to brain cell types of other insects, we subclustered the cell types identified in the integrated C. calcarata atlas and compared the expression of genes in these subclusters to orthologs in the cell types of A. mellifera, H. saltator, M. pharaonsis and D. melanogaster. Distinct C. calcarata subclusters of the KCB could be annotated to KCB cell types from two A. mellifera 29 , 86 and one D. melanogaster 2 datasets. All eight C. calcarata subclusters were highly similar to one or more KCB types of A. mellifera: small; medium; and class II (Figure 4, Table S21). Subclusters 5 and 6 also showed high transcriptional similarity to the D. melanogaster KCB types α′‐ß′ and γ, respectively.
FIGURE 4.

Putative identities of subclusters of C. calcarata KCB (Figure 1—cluster 1) inferred from the transcriptional similarity calculated with MetaNeighbor of 4718 orthologs to small, medium and class II Kenyon cell types of A. mellifera 29 , 64 , 86 and from the similarity of C. calcarata to α′/β′ and γ Kenyon cell types from D. melanogaster. 2 Number in the legend indicates the number of the subcluster referred to in the text. Small = small Kenyon cells; med = medium Kenyon cells.
To identify specific neuron cell types not apparent in the C. calcarata integrated atlas, we compared subclusters of the unidentified neurons (clusters 0, 6 and 7) to olfactory projection neurons, monoaminergic and unidentified neuron cell clusters identified in datasets from other species (Tables S20, S21). The subclusters 6 and 12 from C. calcarata could be unambiguously annotated to the anterodorsal and lateral olfactory projection neurons, respectively, from A. mellifera (Figure S1A, Table S21). Olfactory projection neuron clusters of A. mellifera were also similar to C. calcarata subclusters 9, 11 and 16 at lower AUROC values. These C. calcarata subclusters, however, also showed similarity to other types of neurons and were therefore not annotated as olfactory projection neurons. Analogously, clusters of olfactory projection neurons from M. pharaonsis, H. saltator and D. melanogaster were similar to C. calcarata subclusters 4, 10, 13 and 14, but showed AUROC values less than 0.9. These subclusters also showed similarity to different neuron cell types, making their characterization as olfactory projection neurons less clear. In contrast, C. calcarata subclusters 8, 13, 14, 16 and 17 were annotated as histaminergic because of their high similarity with at least one histaminergic neuron cluster from A. mellifera (Figure S1A).
We then divided the combined cluster of astrocytes and cortex glia of the integrated C. calcarata brain atlas (cluster 5) into subclusters to determine whether these nuclei were similar to astrocyte and cortex glia cell types from other species (Figure S1B, Table S21). Cortex glia from other species showed high similarity to subcluster 5 of C. calcarata. Additionally, subcluster 5 showed upregulation of the canonical markers of cortex glia, wrapper and zyd (Table S28). Subclusters 1 and 3 showed similarity to cortex glia of other species, but also to astrocyte glia, making the cell‐type annotation of these subclusters difficult. Subclusters 0, 2 and 6 were only similar to astrocyte glia clusters from other species (Table S21). Each of these subclusters showed similarity to different combinations of astrocyte glia cell types of H. saltator, M. pharaonsis and A. mellifera. Only subclusters 0 and 2 showed similarity to the same astrocyte glia cell type of D. melanogaster. (Figure S1B). Therefore, three C. calcarata subclusters show transcriptional similarity to the astrocytes of eusocial insects, whereas only two subclusters show similarity to solitary insect astrocytes.
Because multiple types of surface glia have been characterized in other insects, we divided the surface glia cluster of the integrated brain atlas of C. calcarata (cluster 8) into subclusters and compared these to perineurial, subperineurial and unknown glia cell types of other species (Figure S1C, Table S21). Subcluster 2 of C. calcarata is similar to perineurial clusters from A. mellifera as well as D. melanogaster, while subcluster 1 is similar to a subperineurial cluster from A. mellifera as well as a general surface glia cluster from M. pharaonsis. Although subcluster 3 shows similarity to two different D. melanogaster subperineurial clusters, it also shows high similarity to unknown glia from ants, making its characterization in C. calcarata challenging.
4. DISCUSSION
Our results suggest that the transcriptomic compartmentalization to different cell types observed in eusocial insect brains are shared in a subsocial bee. After integrating single‐cell brain transcriptomes from summer and winter samples of C. calcarata, we created a cellular brain atlas of a subsocial hymenopteran insect consisting of neurons, glia and hemocytes. We found that the proportion of neurons linked to specific neurotransmitters was similar to that of other insects. While we found transcriptional similarity of both neuron and glial cell clusters in the C. calcarata brain to cell types from other insect brains, C. calcarata cell clusters could be most clearly annotated to the Kenyon cells, astrocytes and surface glia cell types of eusocial insects. Transcriptomic signals of the response to cold temperature were found in neurons and glia in the winter sample. In contrast, the gene expression in the summer sample suggests that reproduction functions may be localized to glia cells, whereas foraging may be attributable largely to neurons.
4.1. Conserved cell types among insects
With analysis of single‐nucleus transcriptomic data, we created a cell‐type atlas for the brain of female C. calcarata that encompasses gene expression during adult diapause in the winter as well as during the development of reproduction, foraging, mating and flight in the summer. 69 From the expression of canonical markers in the brains found in other insects, we characterized C. calcarata clusters as Kenyon cells, photoreceptors, non‐photoreceptor optic lobe neurons, hemocytes and glia that include ensheathing, cortex, astrocytes and the subperineurial and perineurial groups of surface glia (Figures 1 and S1). Hemocytes have been identified in the brains of A. mellifera and D. melanogaster, 2 , 64 but have not yet been reliably identified in ants. 3 , 4 , 68 Optic lobe cell types show high transcriptional similarity across A. mellifera and D. melanogaster, supporting their high conservation among insects. 4 Using estimates of transcriptional similarity to A. mellifera and D. melanogaster, C. calcarata neurons from the antennal lobe that project medially could also be distinguished from those that project anterodorsally (Figure S1A, 1 , 48 , 89 ). Histaminergic C. calcarata neurons were also identified based on their transcriptional similarity to those of A. mellifera.
The proportion of neurons involved in the metabolism of different classes of neurotransmitters was similar between C. calcarata and other insects (Figure 2). Cholinergic neurons are involved in the regulation of nutrient‐dependent pathways in D. melanogaster, 56 while GABAergic neurons relate to feeding across insects. 58 , 59 The monoaminergic neurons in C. calcarata may regulate behaviors such as aggression, like homologous neurons do in other insects (reviewed in 62 ). Future work could evaluate if the function of these types of neurons are also conserved in C. calcarata.
4.2. Kenyon cell and astrocyte types conserved with eusocial Hymenoptera
We found two groups of Kenyon cells in C. calcarata: those characterized as Class A 4 that are highly similar to the large Kenyon Cells of class I characterized in A. mellifera 53 ; and those similar to Class B 4 (Figure 1). Whereas two KCB types from D. melanogaster 2 were transcriptionally similar to two C. calcarata subclusters from KCB, all eight C. calcarata KCB subclusters were transcriptionally similar to the small, medium, or the class II types of KCB identified in A. mellifera. 53 The presence of KCB cell types in the C. calcarata brain suggests that Kenyon cell types are conserved beyond eusocial taxa to aculeate Hymenoptera more generally. 67 With additional cellular neuroanatomical data from other solitary bee species, future work can test whether the C. calcarata KCB cell architecture is a shared feature among social taxa or among bees and Hymenoptera more broadly.
In addition, more subclusters of C. calcarata were similar to astrocyte glia cell types from social insects rather than to the single astrocyte cell type of solitary D. melanogaster. Social Hymenoptera brains show three astrocyte glia clusters. 1 , 3 , 4 These astrocyte glia clusters show high transcriptional similarity to three different C. calcarata subclusters. In contrast, single‐cell brain atlases of solitary Diptera, including Aedes aegypti and D. melanogaster, show a single astrocyte cluster. 2 , 90 Unlike the astrocytes of eusocial Hymenoptera, the astrocyte cell type from D. melanogaster was highly similar to only two C. calcarata subclusters. 2 Analyses from the brains of additional solitary and subsocial taxa are needed, however, to evaluate the extent of astrocyte cell type conservation within Hymenoptera.
4.3. Neuron gene expression associated with foraging
While season, reproduction and foraging affects gene expression in the whole brain of C. calcarata, 74 , 91 it was previously unclear how gene expression of C. calcarata neurons specifically responds to foraging and reproduction. The upregulation of shab in summer in all C. calcarata neurons, a gene critical to D. melanogaster neuron repolarization, 92 may then reflect the elevated electrophysiological activity associated with foraging. 69 Apisimin, another gene upregulated in neurons in the summer sample that also encodes a protein found in royal jelly in A. mellifera, 93 shows expression across brain cells of foraging C. calcarata. 91 In addition, we found neurons in the summer sample enriched for TORC1 signaling (Table 2), a pathway that allocates nutrients to vitellogenesis (reviewed in 94 ). Neuron transcription in C. calcarata in summer then likely reflects foraging activity to support its reproduction.
4.4. Conservation of optic lobe gene expression associated with neurogenesis
Gene expression in the optic lobe is highly conserved among insects. 4 Therefore, photoreceptors in C. calcarata in summer likely transduce visual cues like photoperiod to the rest of the brain (reviewed in 95 ), as suggested by the expression of D. melanogaster orthologs in photoreceptors: rdgB relates to photoreceptor function 96 ; and slo is needed for visual information processing. 97 , 98 Neurogenesis occurs in the optic lobe of adult D. melanogaster, 47 which is also reflected in the C. calcarata optic lobe that is enriched for neuron development and various signaling pathways in summer. Neurogenesis may also be reflected by Ctnnd2 that is upregulated in photoreceptors in C. calcarata and is a D. melanogaster ortholog of the gene p120ctn required for vertebrate nervous system development. 99 , 100
4.5. Learning associated to Kenyon cells and cognition linked to the optic lobe
In the summer sample, the optic lobe cells were enriched for cognition, whereas visual learning was enriched in Kenyon cells. Optic lobe enrichment is supported by the expression of NaCP60E, a sodium voltage‐gated channel responsible for information‐processing in D. melanogaster. 101 , 102 Activity in the optic lobe precedes selective attention to stimuli in both A. mellifera as well as D. melanogaster. 49 , 50 Therefore, the cognition linked to optic lobe activity in C. calcarata may be associated with the discrimination of visual stimuli. In contrast, KCA in the summer sample were enriched for neuronal function and learning, supported by expression of slo, a gene that facilitates calcium sensitivity in D. melanogaster neurons. 103 Kenyon cells in summer may thus reflect the spatial learning and floral recognition of foraging C. calcarata mothers. 72 Like other insects (reviewed in 104 ), visual information captured by photoreceptors in C. calcarata is likely processed in the optic lobe before additional processing for learning in more central parts of the brain, such as Kenyon cells in the MB.
4.6. Reproduction reflected in astrocytes and cortex glia
C. calcarata shows elevated ovarian activity in summer, 69 which is mirrored by the enrichment of glia for GO terms related to reproduction, such as mating and sperm competition (Table 2). In addition, two upregulated genes in summer, Vg and egt, are upregulated in the brains of reproductive adult C. calcarata as well as A. mellifera females compared with non‐reproductive ones. 64 , 91 Mrjp1 is upregulated in C. calcarata glia in summer and is also involved in A. mellifera queen determination. 105 The transcriptomic signal associated with reproduction in the C. calcarata brain therefore seems to be concentrated in glia. Within glia, the cluster of astrocyte and cortex glia cells showed enrichment for reproduction. They are also enriched for octopaminergic signaling, which is linked to reproduction in the brains of C. calcarata. 70 Octopaminergic signaling also regulates reproduction in D. melanogaster, 106 strengthening its link with reproduction in astrocytes and cortex glia of C. calcarata.
Intraspecific changes in the brain size of animals depend on many factors, like seasonality in vertebrates. 107 Reproductive phenology is associated to shifts in neural architecture in Ceratina that is independent of their sociality. 108 We extend this pattern to the cellular level, finding that C. calcarata reproductive foragers in the summer have transcriptomic signatures associated with specific brain cell types unlike inactive winter bees. Because species of solitary bees also exhibit seasonal variability in their foraging and reproduction, it is possible that they may also show transcriptomic compartmentalization to specific brain cell types at specific times of the year.
4.7. Winter Kenyon cells and photoreceptors linked to regulation of cell death
KCA in winter were enriched for GO terms related to cell death (Table 3). This may reflect apoptosis during overwintering as long durations of cold can cause significant cell death in D. melanogaster. 109 Enrichment of photoreceptors in winter for the regulation of cell death may reflect cellular mechanisms to avoid cell death associated with diapause. 110 The upregulation of usp34 in photoreceptors in winter, a gene involved in DNA repair in D. melanogaster, 111 may then reflect the inhibition of apoptosis after mild cold stress (reviewed in 112 ).
4.8. Glial enrichment and gene expression in the winter sample is associated with diapause
The enrichment and gene expression in glia in the winter sample indicates diapause. All glia were enriched for both stress response and negative regulation of cell division (Table 3), which are both related to diapause. Diapause enables mitigation of cold stress, 110 that may be reflected by the upregulation of hsp110, a gene involved in the freezing tolerance of the gall fly Eurosta solidaginis. 64 Negative regulation of cell division may reflect the cell cycle arrest characteristic of insect diapause. 113 This enrichment is supported by the upregulation of Gpx4, a gene that inhibits programmed cell death in D. melanogaster, 114 in C. calcarata glia in winter. Gpx4 expression in ensheathing glia is also associated with enrichment for regulation of locomotion and cell growth that reflect the decreased metabolism, apoptosis and ovarian activity associated with diapause (Table 3, 113 ). Detection of photoperiod by cells in the nervous system that express circadian clock genes can lead to insulin signaling that facilitates the expression of diapause in multiple fly species. 115 Therefore, the enrichment of surface glia in the winter sample for GO terms related to circadian gene regulation as well as insulin signaling implicates these cells in the regulation of diapause (Table 3).
4.9. Limitations and future directions
The finding that cell types in the C. calcarata brain bear high similarity to those of eusocial Hymenoptera must also be considered within the context of phylogenetic distance of insects. Independent of social context, ants and bees may thus show more similar neuroanatomy to one another than to non‐hymenopteran insects. 116 The closer transcriptional similarity of C. calcarata's neurons and glia cell types to those of A. mellifera, H. saltator and M. pharaonsis than to those of the dipteran D. melanogaster might therefore be expected based on phylogenetic distance. Given that lifestyle as well as phylogeny influences various parts of the insect brain (reviewed in 117 ), the cellular neuroanatomy of solitary bee species could help to clarify our findings.
Our measurements of transcriptional similarity relied on orthologs that can reliably distinguish conserved cell types across taxa. 80 The use of orthologs omits taxonomically‐restricted genes that may improve the resolution of cell‐types, however. While paralogs that include taxonomically‐restricted genes have been used to estimate cell type conservation between pairs of taxa of smaller datasets, 118 this method would not be effective for a simultaneous comparison of C. calcarata to both solitary and eusocial species. 78 Moreover, with current bioinformatic techniques, orphan genes restricted to one species that lack homology to another species in a comparison (reviewed in 119 ) cannot inform the conservation of cell‐types from single‐cell data. Therefore, future bioinformatic identification of cell types that explicitly consider these orphan genes may allow for expanded insights into the evolutionary divergence of brain cell types.
5. CONCLUSIONS
Using the information from a growing number of single‐cell transcriptomic insect brain atlases, we have characterized neuron, glia and hemocyte cell types in the C. calcarata brain using single‐nucleus RNA sequencing. The C. calcarata brain shares features with other insects, such as the presence of rare cell types and the proportion of neurons releasing specific neurotransmitters. The diversity of Kenyon cell subtypes and the number of astrocyte glia cell types in C. calcarata also align with those of eusocial Hymenoptera. Additional sampling from other solitary bee brains could be used to evaluate how widespread the characteristics of the eusocial brain are across Hymenoptera.
Gene expression and GO enrichment in winter C. calcarata reflects cell death and diapause in several brain cell types. When the bee was active in the summer, however, astrocytes and cortex glia showed transcription related to reproduction, while neuronal gene expression was linked to foraging. The segregation of foraging from reproduction in a subsocial brain is analogous to a social insect brain, where some cell populations express genes linked to reproduction and others show gene expression associated with foraging. The molecular neuroanatomy from solitary bees could help to clarify these findings in a phylogenetic context.
Future work in C. calcarata can examine how social experience, reproduction and foraging influences gene expression in specific brain cell types. Collectively, this work provides the first detailed single‐cell brain atlas in a subsocial insect and therefore acts as a baseline for comparison of the brains of other animals showing prolonged parental care.
CONFLICT OF INTEREST STATEMENT
The authors declare no conflicts of interest.
Supporting information
Data S1: Supporting Information.
Figure S1. Putative identities of C. calcarata cell subclusters from transcriptional similarity to known cell types in A. mellifera, 1 D. melanogaster ( 2 ; Skinnider et al. 2021), H. saltator, 3 and/or M. pharaonsis 4 for (A) unidentified neurons (Clusters 0,6,7 from Figure 1); (B) astrocyte and cortex glia (Cluster 5 from Figure 1); and (C) surface glia (Cluster 8 from Figure 1). Number in the legend indicates the number of the C. calcarata subcluster referred to as “ccalc_subcluster_num” in Table S21. AG = astrocyte glia; CG = cortex glia; OPN‐adPN = anterodorsal olfactory projection neurons; OPN‐lPN = lateral olfactory projection neurons. Indicated references correspond to those in the Supplementary methods.
Table S1: Supporting Information.
ACKNOWLEDGMENTS
We thank Phuong Nguyen and Mariam Shamekh for assistance with bee collection and nest dissections. Thanks to Troy Ketela and Mandy Xu from Princess Margaret Genomics Centre for assistance with nuclei extractions, library preparation and sequencing. We also thank the following individuals for providing advice, code, and data used in our analyses: Roberto Bonasio, Haynes Heaton, Sarah Kocher, Takayoshi Kuwabara, Qiye Li, Emily Shields, Ian Traniello, Guojie Zhang, Wenxin Zhang, two anonymous reviewers and other members of the Rehan Lab. This work was supported by an Ontario Ministry of Colleges and Universities, York University and a Natural Sciences and Engineering Research Council of Canada to JLH.
Pyenson BC, Huisken JL, Gupta N, Rehan SM. The brain atlas of a subsocial bee reflects that of eusocial Hymenoptera. Genes, Brain and Behavior. 2024;23(6):e70007. doi: 10.1111/gbb.70007
DATA AVAILABILITY STATEMENT
Fastq files generated and analyzed in this study are available under BioProject PRJNA1039807 at NCBI (https://www.ncbi.nlm.nih.gov/). Code and input files used for this study are available at https://doi.org/10.5281/zenodo.12557898.
REFERENCES
- 1. Traniello IM, Bukhari SA, Dibaeinia P, et al. Single‐cell dissection of aggression in honeybee colonies. Nat Ecol Evol 2023;7:1232‐1244. doi: 10.1038/s41559-023-02090-0 [DOI] [PubMed] [Google Scholar]
- 2. Davie K, Janssens J, Koldere D, et al. A single‐cell transcriptome atlas of the aging drosophila brain. Cell. 2018;174:982‐998.e20. doi: 10.1016/j.cell.2018.05.057 [DOI] [PMC free article] [PubMed] [Google Scholar]
- 3. Sheng L, Shields EJ, Gospocic J, et al. Social reprogramming in ants induces longevity‐associated glia remodeling. Sci Adv. 2020;6:eaba9869. doi: 10.1126/sciadv.aba9869 [DOI] [PMC free article] [PubMed] [Google Scholar]
- 4. Li Q, Wang M, Zhang P, et al. A single‐cell transcriptomic atlas tracking the neural basis of division of labour in an ant superorganism. Nat Ecol Evol. 2022;6:1191‐1204. doi: 10.1038/s41559-022-01784-1 [DOI] [PMC free article] [PubMed] [Google Scholar]
- 5. Dunbar RIM. The social brain hypothesis and its implications for social evolution. Ann Hum Biol. 2009;36:562‐572. doi: 10.1080/03014460902960289 [DOI] [PubMed] [Google Scholar]
- 6. Lihoreau M, Latty T, Chittka L. An exploration of the social brain hypothesis in insects. Front Physiol. 2012;3:442. doi: 10.3389/fphys.2012.00442 [DOI] [PMC free article] [PubMed] [Google Scholar]
- 7. Dunbar RIM. Structure of social relationships in a captive gelada group: a test of some hypotheses derived from studies of a wild population. Primates. 1982;23:89‐94. doi: 10.1007/bf02381440 [DOI] [Google Scholar]
- 8. Gronenberg W, Riveros AJ. Social brains and behavior—past and present. In: Gadau J, Fewell J, eds. Organization of Insect Societies; Harvard University Press; 2009:377‐401. doi: 10.2307/j.ctv228vr0t.23 [DOI] [Google Scholar]
- 9. Pahlke S, Seid MA, Jaumann S, Smith A. The loss of sociality is accompanied by reduced neural investment in mushroom body volume in the sweat bee Augochlora pura (Hymenoptera: Halictidae). Ann Entomol Soc Am. 2020;114:637‐642. doi: 10.1093/aesa/saaa019 [DOI] [PMC free article] [PubMed] [Google Scholar]
- 10. Rosati AG. Foraging cognition: reviving the ecological intelligence hypothesis. Trends Cogn Sci. 2017;21:691‐702. doi: 10.1016/j.tics.2017.05.011 [DOI] [PubMed] [Google Scholar]
- 11. Farris SM, Schulmeister S. Parasitoidism, not sociality, is associated with the evolution of elaborate mushroom bodies in the brains of hymenopteran insects. Proc R Soc B Biol Sci. 2011;278:940‐951. doi: 10.1073/pnas.91.21.9911 [DOI] [PMC free article] [PubMed] [Google Scholar]
- 12. O'Donnell S, Bulova SJ, DeLeon S, Khodak P, Miller S, Sulger E. Distributed cognition and social brains: reductions in mushroom body investment accompanied the origins of sociality in wasps (Hymenoptera: Vespidae). Proc R Soc B: Biol Sci. 2015;282:20150791. doi: 10.1098/rspb.2015.0791 [DOI] [PMC free article] [PubMed] [Google Scholar]
- 13. Gittleman JL. Carnivore brain size, behavioral ecology, and phylogeny. J Mammal. 1986;67:23‐36. doi: 10.2307/1380998 [DOI] [Google Scholar]
- 14. Farris SM, Roberts NS. Coevolution of generalist feeding ecologies and gyrencephalic mushroom bodies in insects. Proc Natl Acad Sci. 2005;102:17394‐17399. doi: 10.1073/pnas.0508430102 [DOI] [PMC free article] [PubMed] [Google Scholar]
- 15. Sayol F, Collado MÁ, Garcia‐Porta J, et al. Feeding specialization and longer generation time are associated with relatively larger brains in bees. Proc R Soc B. 2020;287:20200762. doi: 10.1098/rspb.2020.0762 [DOI] [PMC free article] [PubMed] [Google Scholar]
- 16. Eberhard WG, Wcislo WT. Grade changes in brain–body allometry: morphological and behavioural correlates of brain size in miniature spiders, insects and other invertebrates. Adv Insect Physiol. 2011;40:155‐214. doi: 10.1016/b978-0-12-387668-3.00004-0 [DOI] [Google Scholar]
- 17. Finlay BL, Darlington RB. Linked regularities in the development and evolution of mammalian brains. Science. 1995;268:1578‐1584. doi: 10.1126/science.7777856 [DOI] [PubMed] [Google Scholar]
- 18. Gronenberg W, Hölldobler B. Morphologic representation of visual and antennal information in the ant brain. J Comp Neurol. 1999;412:229‐240. [DOI] [PubMed] [Google Scholar]
- 19. Barton RA, Harvey PH. Mosaic evolution of brain structure in mammals. Nature. 2000;405:1055‐1058. doi: 10.1038/35016580 [DOI] [PubMed] [Google Scholar]
- 20. Moore JM, DeVoogd TJ. Concerted and mosaic evolution of functional modules in songbird brains. Proc R Soc B: Biol Sci. 2017;284:20170469. doi: 10.1098/rspb.2017.0469 [DOI] [PMC free article] [PubMed] [Google Scholar]
- 21. Penick CA, Ghaninia M, Haight KL, et al. Reversible plasticity in brain size, behaviour and physiology characterizes caste transitions in a socially flexible ant (Harpegnathos saltator). Proc R Soc B. 2021;288:20210141. doi: 10.1098/rspb.2021.0141 [DOI] [PMC free article] [PubMed] [Google Scholar]
- 22. Yopak KE, Lisney TJ, Darlington RB, Collin SP, Montgomery JC, Finlay BL. A conserved pattern of brain scaling from sharks to primates. Proc Natl Acad Sci. 2010;107:12946‐12951. doi: 10.1073/pnas.1002195107 [DOI] [PMC free article] [PubMed] [Google Scholar]
- 23. Godfrey RK, Swartzlander M, Gronenberg W. Allometric analysis of brain cell number in Hymenoptera suggests ant brains diverge from general trends. Proc R Soc B. 2021;288:20210199. doi: 10.1098/rspb.2021.0199 [DOI] [PMC free article] [PubMed] [Google Scholar]
- 24. Musser JM, Schippers KJ, Nickel M, et al. Profiling cellular diversity in sponges informs animal cell type and nervous system evolution. Science. 2021;374:717‐723. doi: 10.1126/science.abj2949 [DOI] [PMC free article] [PubMed] [Google Scholar]
- 25. Najle SR, Grau‐Bové X, Elek A, et al. Stepwise emergence of the neuronal gene expression program in early animal evolution. Cell. 2023;186:4676‐4693.e29. doi: 10.1016/j.cell.2023.08.027 [DOI] [PMC free article] [PubMed] [Google Scholar]
- 26. Hain D, Gallego‐Flores T, Klinkmann M, et al. Molecular diversity and evolution of neuron types in the amniote brain. Science. 2022;377:eabp8202. doi: 10.1126/science.abp8202 [DOI] [PubMed] [Google Scholar]
- 27. Kebschull JM, Richman EB, Ringach N, et al. Cerebellar nuclei evolved by repeatedly duplicating a conserved cell‐type set. Science. 2020;370:1–10. doi: 10.1126/science.abd5059 [DOI] [PMC free article] [PubMed] [Google Scholar]
- 28. Tosches MA, Yamawaki TM, Naumann RK, Jacobi AA, Tushev G, Laurent G. Evolution of pallium, hippocampus, and cortical cell types revealed by single‐cell transcriptomics in reptiles. Science. 2018;360:881‐888. doi: 10.1126/science.aar4237 [DOI] [PubMed] [Google Scholar]
- 29. Kuwabara T, Kohno H, Hatakeyama M, Kubo T. Evolutionary dynamics of mushroom body Kenyon cell types in hymenopteran brains from multifunctional type to functionally specialized types. Sci Adv. 2023;9:eadd4201. doi: 10.1126/sciadv.add4201 [DOI] [PMC free article] [PubMed] [Google Scholar]
- 30. Strausfeld NJ, Hansen L, Li Y, Gomez RS, Ito K. Evolution, discovery, and interpretations of arthropod mushroom bodies. Learn Memory. 1998;5:11‐37. doi: 10.1101/lm.5.1.11 [DOI] [PMC free article] [PubMed] [Google Scholar]
- 31. Hartline DK. The evolutionary origins of glia. Glia. 2011;59:1215‐1236. doi: 10.1002/glia.21149 [DOI] [PubMed] [Google Scholar]
- 32. Verkhratsky A, Arranz AM, Ciuba K, Pękowska A. Evolution of neuroglia. Ann N York Acad Sci. 2022;1518:120‐130. doi: 10.1111/nyas.14917 [DOI] [PubMed] [Google Scholar]
- 33. Zeisel A, Hochgerner H, Lönnerberg P, et al. Molecular architecture of the mouse nervous system. Cell. 2018;174:999‐1014.e22. doi: 10.1016/j.cell.2018.06.021 [DOI] [PMC free article] [PubMed] [Google Scholar]
- 34. Nave K‐A, Werner HB. Ensheathment and myelination of axons: evolution of glial functions. Annu Rev Neurosci. 2021;44:1‐23. doi: 10.1146/annurev-neuro-100120-122621 [DOI] [PubMed] [Google Scholar]
- 35. Jaffe K, Perez E. Comparative study of brain morphology in ants. Brain. Behav Evol. 1989;33:25‐33. doi: 10.1159/000115895 [DOI] [PubMed] [Google Scholar]
- 36. Batra SWT. Nests and social behavior of halictine bees of India (Hymenoptera: Halictidae). Indian J Entomol. 1966;28:375‐393. [Google Scholar]
- 37. Denlinger DL. Regulation of diapause. Annu Rev Entomol. 2002;47:93‐122. doi: 10.1146/annurev.ento.47.091201.145137 [DOI] [PubMed] [Google Scholar]
- 38. Santos PKF, Arias MC, Kapheim KM. Loss of developmental diapause as prerequisite for social evolution in bees. Biol Lett. 2019;15:20190398. doi: 10.1098/rsbl.2019.0398 [DOI] [PMC free article] [PubMed] [Google Scholar]
- 39. Hunt JH, Kensinger BJ, Kossuth JA, et al. A diapause pathway underlies the gyne phenotype in Polistes wasps, revealing an evolutionary route to caste‐containing insect societies. Proc Nat Acad Sci. 2007;104:14020‐14025. doi: 10.1073/pnas.0705660104 [DOI] [PMC free article] [PubMed] [Google Scholar]
- 40. Yanega D. Caste determination and differential diapause within the first brood of Halictus rubicundus in New York (Hymenoptera: Halictidae). Behav Ecol Sociobiol. 1989;24:97‐107. doi: 10.1007/bf00299641 [DOI] [Google Scholar]
- 41. da Silva J. Life history and the transitions to eusociality in the Hymenoptera. Front Ecol Evol. 2021;9:727124. doi: 10.3389/fevo.2021.727124 [DOI] [Google Scholar]
- 42. Tallamy DW, Wood TK. Convergence patterns in subsocial insects. Annu Rev Entomol. 1986;31:369‐390. doi: 10.1146/annurev.en.31.010186.002101 [DOI] [Google Scholar]
- 43. Rehan SM, Toth AL. Climbing the social ladder: the molecular evolution of sociality. Trends Ecol Evol. 2015;30:426‐433. doi: 10.1016/j.tree.2015.05.004 [DOI] [PubMed] [Google Scholar]
- 44. West‐Eberhard MJ. Flexible strategy and social evolution. In: Ito Y, Brown JL, Kikkawa J, eds. Animal Societies: Theories and Facts. Japan Scientific Society Press; 1987:35‐51. [Google Scholar]
- 45. Mei Y, Jing D, Tang S, et al. InsectBase 2.0: a comprehensive gene resource for insects. Nucleic Acids Res. 2021;50:D1040‐D1045. doi: 10.1093/nar/gkab1090 [DOI] [PMC free article] [PubMed] [Google Scholar]
- 46. Svensson V, da Beltrame EV, Pachter L. A curated database reveals trends in single‐cell transcriptomics. Database. 2020;2020:baaa073. doi: 10.1093/database/baaa073 [DOI] [PMC free article] [PubMed] [Google Scholar]
- 47. Fernández‐Hernández I, Rhiner C, Moreno E. Adult neurogenesis in Drosophila . Cell Rep. 2013;3:1857‐1865. doi: 10.1016/j.celrep.2013.05.034 [DOI] [PubMed] [Google Scholar]
- 48. Li H, Janssens J, de Waegeneer M, et al. Fly cell atlas: a single‐nucleus transcriptomic atlas of the adult fruit fly. Science. 2022;375:eabk2432. doi: 10.1126/science.abk2432 [DOI] [PMC free article] [PubMed] [Google Scholar]
- 49. Paulk AC, Stacey JA, Pearson TWJ, et al. Selective attention in the honeybee optic lobes precedes behavioral choices. Proc Natl Acad Sci. 2014;111:5006‐5011. doi: 10.1073/pnas.1323297111 [DOI] [PMC free article] [PubMed] [Google Scholar]
- 50. Tang S, Juusola M. Intrinsic activity in the fly brain gates visual information during behavioral choices. PLoS One. 2010;5:e14455. doi: 10.1371/journal.pone.0014455 [DOI] [PMC free article] [PubMed] [Google Scholar]
- 51. Lee T, Lee A, Luo L. Development of the drosophila mushroom bodies: sequential generation of three distinct types of neurons from a neuroblast. Development. 1999;126:4065‐4076. doi: 10.1242/dev.126.18.4065 [DOI] [PubMed] [Google Scholar]
- 52. Vasmer D, Pooryasin A, Riemensperger T, Fiala A. Induction of aversive learning through thermogenetic activation of Kenyon cell ensembles in drosophila . Front Behav Neurosci. 2014;8:174. doi: 10.3389/fnbeh.2014.00174 [DOI] [PMC free article] [PubMed] [Google Scholar]
- 53. Suenami S, Oya S, Kohno H, Kubo T. Kenyon cell subtypes/populations in the honeybee mushroom bodies: possible function based on their gene expression profiles, differentiation, possible evolution, and application of genome editing. Front Psychol. 2018;9:1717. doi: 10.3389/fpsyg.2018.01717 [DOI] [PMC free article] [PubMed] [Google Scholar]
- 54. Allen AM, Neville MC, Birtles S, et al. A single‐cell transcriptomic atlas of the adult drosophila ventral nerve cord. Elife. 2020;9:e54074. doi: 10.7554/elife.54074 [DOI] [PMC free article] [PubMed] [Google Scholar]
- 55. Croset V, Treiber CD, Waddell S. Cellular diversity in the drosophila midbrain revealed by single‐cell transcriptomics. Elife. 2018;7:e34550. doi: 10.7554/elife.34550 [DOI] [PMC free article] [PubMed] [Google Scholar]
- 56. Okamoto N, Nishimura T. Signaling from glia and cholinergic neurons controls nutrient‐dependent production of an insulin‐like peptide for drosophila body growth. Dev Cell. 2015;35:295‐310. doi: 10.1016/j.devcel.2015.10.003 [DOI] [PubMed] [Google Scholar]
- 57. Zhou M, Chen N, Tian J, et al. Suppression of GABAergic neurons through D2‐like receptor secures efficient conditioning in drosophila aversive olfactory learning. Proc Natl Acad Sci. 2019;116:5118‐5125. doi: 10.1073/pnas.1812342116 [DOI] [PMC free article] [PubMed] [Google Scholar]
- 58. Bestea L, Paoli M, Arrufat P, et al. The short neuropeptide F regulates appetitive but not aversive responsiveness in a social insect. iScience. 2022;25:103619. doi: 10.1016/j.isci.2021.103619 [DOI] [PMC free article] [PubMed] [Google Scholar]
- 59. Cheung SK, Scott K. GABAA receptor‐expressing neurons promote consumption in Drosophila melanogaster . PLoS One. 2017;12:e0175177. doi: 10.1371/journal.pone.0175177 [DOI] [PMC free article] [PubMed] [Google Scholar]
- 60. Barbara GS, Zube C, Rybak J, Gauthier M, Grünewald B. Acetylcholine, GABA and glutamate induce ionic currents in cultured antennal lobe neurons of the honeybee. Apis mellifera J Comp Physiol A. 2005;191:823‐836. doi: 10.1007/s00359-005-0007-3 [DOI] [PubMed] [Google Scholar]
- 61. Liu WW, Wilson RI. Glutamate is an inhibitory neurotransmitter in the drosophila olfactory system. Proc Natl Acad Sci. 2013;110:10294‐10299. doi: 10.1073/pnas.1220560110 [DOI] [PMC free article] [PubMed] [Google Scholar]
- 62. Kravitz EA, Huber R. Aggression in invertebrates. Curr Opin Neurobiol. 2003;13:736‐743. doi: 10.1016/j.conb.2003.10.003 [DOI] [PubMed] [Google Scholar]
- 63. Barbero F, Mannino G, Casacci LP. The role of biogenic amines in social insects: with a special focus on ants. Insects. 2023;14:386. doi: 10.3390/insects14040386 [DOI] [PMC free article] [PubMed] [Google Scholar]
- 64. Zhang W, Wang L, Zhao Y, et al. Single‐cell transcriptomic analysis of honeybee brains identifies vitellogenin as caste differentiation‐related factor. iScience. 2022;25:104643. doi: 10.1016/j.isci.2022.104643 [DOI] [PMC free article] [PubMed] [Google Scholar]
- 65. Mickael M‐E, Kubick N, Klimovich P, Flournoy PH, Bieńkowska I, Sacharczuk M. Paracellular and transcellular leukocytes diapedesis are divergent but interconnected evolutionary events. Genes. 2021;12:254. doi: 10.3390/genes12020254 [DOI] [PMC free article] [PubMed] [Google Scholar]
- 66. Jones BM, Rubin BER, Dudchenko O, et al. Convergent and complementary selection shaped gains and losses of eusociality in sweat bees. Nat Ecol Evol. 2023;7:557‐569. doi: 10.1038/s41559-023-02001-3 [DOI] [PMC free article] [PubMed] [Google Scholar]
- 67. Oya S, Kohno H, Kainoh Y, Ono M, Kubo T. Increased complexity of mushroom body Kenyon cell subtypes in the brain is associated with behavioral evolution in hymenopteran insects. Sci Rep. 2017;7:13785. doi: 10.1038/s41598-017-14174-6 [DOI] [PMC free article] [PubMed] [Google Scholar]
- 68. Ju L, Glastad KM, Sheng L, et al. Hormonal gatekeeping via the blood‐brain barrier governs caste‐specific behavior in ants. Cell. 2023;186:4289‐4309.e23. doi: 10.1016/j.cell.2023.08.002 [DOI] [PMC free article] [PubMed] [Google Scholar]
- 69. Rehan SM, Richards MH. Nesting biology and subsociality in Ceratina calcarata (Hymenoptera: Apidae). Can Entomol. 2010;142:65‐74. doi: 10.4039/n09-056 [DOI] [Google Scholar]
- 70. Cook CN, Lawson SP, Brent CS, Rehan SM. Biogenic amines shift during the pre‐reproductive to reproductive transition in the small carpenter bee, Ceratina calcarata . Apidologie. 2019;50:90‐99. doi: 10.1007/s13592-018-0624-9 [DOI] [Google Scholar]
- 71. Jaumann S, Rehan SM, Schwartz K, Smith AR. Reduced neural investment in post‐reproductive females of the bee Ceratina calcarata . Sci Rep. 2022;12:8256. doi: 10.1038/s41598-022-12281-7 [DOI] [PMC free article] [PubMed] [Google Scholar]
- 72. Lawson SP, Ciaccio KN, Rehan SM. Maternal manipulation of pollen provisions affects worker production in a small carpenter bee. Behav Ecol Sociobiol. 2016;70:1891‐1900. doi: 10.1007/s00265-016-2194-z [DOI] [Google Scholar]
- 73. Shell WA, Rehan SM. Social modularity: conserved genes and regulatory elements underlie caste‐antecedent behavioural states in an incipiently social bee. Proc R Soc B. 2019;286:20191815. doi: 10.1098/rspb.2019.1815 [DOI] [PMC free article] [PubMed] [Google Scholar]
- 74. Durant DR, Berens AJ, Toth AL, Rehan SM. Transcriptional profiling of overwintering gene expression in the small carpenter bee, Ceratina calcarata . Apidologie. 2016;47:572‐582. doi: 10.1007/s13592-015-0402-x [DOI] [Google Scholar]
- 75. Brasil SNR, Kelemen EP, Rehan SM. Historic DNA uncovers genetic effects of climate change and landscape alteration in two wild bee species. Conserv Genet. 2023;24:85‐98. doi: 10.1007/s10592-022-01488-w [DOI] [Google Scholar]
- 76. Rehan SM, Glastad KM, Lawson SP, Hunt BG. The genome and methylome of a subsocial small carpenter bee, Ceratina calcarata . Genome Biol Evol. 2016;8:1401‐1410. doi: 10.1093/gbe/evw079 [DOI] [PMC free article] [PubMed] [Google Scholar]
- 77. Hong R, Koga Y, Bandyadka S, et al. Comprehensive generation, visualization, and reporting of quality control metrics for single‐cell RNA sequencing data. Nat Commun. 2022;13:1688. doi: 10.1038/s41467-022-29212-9 [DOI] [PMC free article] [PubMed] [Google Scholar]
- 78. Church SH, Mah JL, Dunn CW. Integrating phylogenies into single‐cell RNA sequencing analysis allows comparisons across species, genes, and cells. PLoS Biol. 2024;22:e3002633. doi: 10.1371/journal.pbio.3002633 [DOI] [PMC free article] [PubMed] [Google Scholar]
- 79. Hafemeister C, Satija R. Normalization and variance stabilization of single‐cell RNA‐seq data using regularized negative binomial regression. Genome Biol. 2019;20:296. doi: 10.1186/s13059-019-1874-1 [DOI] [PMC free article] [PubMed] [Google Scholar]
- 80. Song Y, Miao Z, Brazma A, Papatheodorou I. Benchmarking strategies for cross‐species integration of single‐cell RNA sequencing data. Nat Commun. 2023;14:6495. doi: 10.1038/s41467-023-41855-w [DOI] [PMC free article] [PubMed] [Google Scholar]
- 81. Butler A, Hoffman P, Smibert P, Papalexi E, Satija R. Integrating single‐cell transcriptomic data across different conditions, technologies, and species. Nat Biotechnol. 2018;36:411‐420. doi: 10.1038/nbt.4096 [DOI] [PMC free article] [PubMed] [Google Scholar]
- 82. R Core Team . R: A Language and Environment for Statistical Computing. R Foundation for Statistical Computing; 2023. https://www.R-project.org/ [Google Scholar]
- 83. Stuart T, Butler A, Hoffman P, et al. Comprehensive integration of single‐cell data. Cell. 2019;177:1888‐1902.e21. doi: 10.1016/j.cell.2019.05.031 [DOI] [PMC free article] [PubMed] [Google Scholar]
- 84. Pullin JM, McCarthy DJ. A comparison of marker gene selection methods for single‐cell RNA sequencing data. Genome Biol. 2024;25:56. doi: 10.1186/s13059-024-03183-0 [DOI] [PMC free article] [PubMed] [Google Scholar]
- 85. Alexa A, Rahnenführer J, Lengauer T. Improved scoring of functional groups from gene expression data by decorrelating GO graph structure. Bioinformatics. 2006;22:1600‐1607. doi: 10.1093/bioinformatics/btl140 [DOI] [PubMed] [Google Scholar]
- 86. Traniello IM, Bukhari SA, Kevill J, et al. Meta‐analysis of honey bee neurogenomic response links deformed wing virus type a to precocious behavioral maturation. Sci Rep. 2020;10:3101. doi: 10.1038/s41598-020-59808-4 [DOI] [PMC free article] [PubMed] [Google Scholar]
- 87. Altschul SF, Gish W, Miller W, Myers EW, Lipman DJ. Basic local alignment search tool. J Mol Biol. 1990;215:403‐410. doi: 10.1016/s0022-2836(05)80360-2 [DOI] [PubMed] [Google Scholar]
- 88. Crow M, Paul A, Ballouz S, Huang ZJ, Gillis J. Characterizing the replicability of cell types defined by single cell RNA‐sequencing data using MetaNeighbor. Nat Commun. 2018;9:884. doi: 10.1038/s41467-018-03282-0 [DOI] [PMC free article] [PubMed] [Google Scholar]
- 89. Li H, Horns F, Wu B, et al. Classifying drosophila olfactory projection neuron subtypes by single‐cell RNA sequencing. Cell. 2017;171:1206‐1220.e22. doi: 10.1016/j.cell.2017.10.019 [DOI] [PMC free article] [PubMed] [Google Scholar]
- 90. Cui Y, Behura SK, Franz AWE. Cellular diversity and gene expression profiles in the male and female brain of Aedes aegypti . BMC Genomics. 2022;23:119. doi: 10.1186/s12864-022-08327-9 [DOI] [PMC free article] [PubMed] [Google Scholar]
- 91. Huisken JL, Rehan SM. Brain gene expression of foraging behavior and social environment in Ceratina calcarata. Genome Biol Evol. 2023;15:evad117. doi: 10.1093/gbe/evad117 [DOI] [PMC free article] [PubMed] [Google Scholar]
- 92. Pongs O. Molecular biology of voltage‐dependent potassium channels. Physiol Rev. 1992;72:S69‐S88. doi: 10.1152/physrev.1992.72.suppl_4.s69 [DOI] [PubMed] [Google Scholar]
- 93. Bilikova K et al. Apisimin, a new serine‐valine‐rich peptide from honeybee (Apis mellifera L.) royal jelly: purification and molecular characterization. FEBS Lett. 2002;528:125‐129. [DOI] [PubMed] [Google Scholar]
- 94. Smykal V, Raikhel AS. Nutritional control of insect reproduction. Curr Opin Insect Sci. 2015;11:31‐38. doi: 10.1016/j.cois.2015.08.003 [DOI] [PMC free article] [PubMed] [Google Scholar]
- 95. Goto SG. Photoperiodic time measurement, photoreception, and circadian clocks in insect photoperiodism. Appl Èntomol Zoöl. 2022;57:193‐212. doi: 10.1007/s13355-022-00785-7 [DOI] [Google Scholar]
- 96. Lev S. The role of the Nir/rdgB protein family in membrane trafficking and cytoskeleton remodeling. Exp Cell Res. 2004;297:1‐10. doi: 10.1016/j.yexcr.2004.02.033 [DOI] [PubMed] [Google Scholar]
- 97. Jaramillo AM, Zheng X, Zhou Y, et al. Pattern of distribution and cycling of SLOB, slowpoke channel binding protein, in drosophila. BMC Neurosci. 2004;5:3. doi: 10.1186/1471-2202-5-3 [DOI] [PMC free article] [PubMed] [Google Scholar]
- 98. Li X, Abou Tayoun A, Song Z, et al. Ca 2+ −activated K + channels reduce network excitability, improving adaptability and energetics for transmitting and perceiving sensory information. J Neurosci. 2019;39:7132‐7154. doi: 10.1523/jneurosci.3213-18.2019 [DOI] [PMC free article] [PubMed] [Google Scholar]
- 99. Israely I, Costa RM, Xie CW, Silva AJ, Kosik KS, Liu X. Deletion of the neuron‐specific protein delta‐catenin leads to severe cognitive and synaptic dysfunction. Curr Biol. 2004;14:1657‐1663. doi: 10.1016/j.cub.2004.08.065 [DOI] [PubMed] [Google Scholar]
- 100. Magie CR, Pinto‐Santini D, Parkhurst SM. Rho1 interacts with p120ctn and α‐catenin, and regulates cadherin‐based adherens junction components in drosophila. Development. 2002;129:3771‐3782. doi: 10.1242/dev.129.16.3771 [DOI] [PubMed] [Google Scholar]
- 101. Kulkarni NH, Yamamoto AH, Robinson KO, Mackay TFC, Anholt RRH. The DSC1 channel, encoded by the smi60E locus, contributes to odor‐guided behavior in Drosophila melanogaster . Genetics. 2002;161:1507‐1516. doi: 10.1093/genetics/161.4.1507 [DOI] [PMC free article] [PubMed] [Google Scholar]
- 102. Okamoto H, Sakai K, Goto S, Takasu‐Ishikawa E, Hotta Y. Isolation of drosophila genomic clones homologous to the eel sodium channel gene. Proc Jpn Acad, Ser B. 1987;63:284‐288. doi: 10.2183/pjab.63.284 [DOI] [Google Scholar]
- 103. Lagrutta A, Shen KZ, North RA, Adelman JP. Functional differences among alternatively spliced variants of slowpoke, a drosophila calcium‐activated potassium channel. J Biol Chem. 1994;269:20347‐20351. doi: 10.1016/s0021-9258(17)31998-1 [DOI] [PubMed] [Google Scholar]
- 104. Thiagarajan D, Sachse S. Multimodal information processing and associative learning in the insect brain. Insects. 2022;13:332. doi: 10.3390/insects13040332 [DOI] [PMC free article] [PubMed] [Google Scholar]
- 105. Buttstedt A, Ihling CH, Pietzsch M, Moritz RFA. Royalactin is not a royal making of a queen. Nature. 2016;537:E10‐E12. doi: 10.1038/nature19349 [DOI] [PubMed] [Google Scholar]
- 106. White MA, Chen DS, Wolfner MF. She's got nerve: roles of octopamine in insect female reproduction. J Neurogenet. 2021;35:132‐153. doi: 10.1080/01677063.2020.1868457 [DOI] [PMC free article] [PubMed] [Google Scholar]
- 107. Gonda A, Herczeg G, Merilä J. Evolutionary ecology of intraspecific brain size variation: a review. Ecol Evol. 2013;3:2751‐2764. doi: 10.1002/ece3.627 [DOI] [PMC free article] [PubMed] [Google Scholar]
- 108. Rehan SM, Bulova SJ, O'Donnell S. Cumulative effects of foraging behavior and social dominance on brain development in a facultatively social bee (Ceratina australensis). Brain Behav Evol. 2015;85:117‐124. doi: 10.1159/000381414 [DOI] [PubMed] [Google Scholar]
- 109. Yi S‐X, Lee RE. Rapid cold‐hardening blocks cold‐induced apoptosis by inhibiting the activation of pro‐caspases in the flesh fly Sarcophaga crassipalpis . Apoptosis. 2011;16:249‐255. doi: 10.1007/s10495-010-0570-0 [DOI] [PubMed] [Google Scholar]
- 110. King AM, MacRae TH. Insect heat shock proteins during stress and diapause. Annu Rev Èntomol. 2015;60:1‐17. doi: 10.1146/annurev-ento-011613-162107 [DOI] [PubMed] [Google Scholar]
- 111. Páhi ZG, Kovács L, Szűcs D, Borsos BN, Deák P, Pankotai T. Usp5, Usp34, and Otu1 deubiquitylases mediate DNA repair in Drosophila melanogaster . Sci Rep. 2022;12:5870. doi: 10.1038/s41598-022-09703-x [DOI] [PMC free article] [PubMed] [Google Scholar]
- 112. Teets NM, Denlinger DL. Physiological mechanisms of seasonal and rapid cold‐hardening in insects. Physiol Èntomol. 2013;38:105‐116. doi: 10.1111/phen.12019 [DOI] [Google Scholar]
- 113. Hand SC, Denlinger DL, Podrabsky JE, Roy R. Mechanisms of animal diapause: recent developments from nematodes, crustaceans, insects, and fish. Am J Physiol‐Regul, Integr Comp Physiol. 2016;310:R1193‐R1211. doi: 10.1152/ajpregu.00250.2015 [DOI] [PMC free article] [PubMed] [Google Scholar]
- 114. Li J, Cao F, Yin HL, et al. Ferroptosis: past, present and future. Cell Death Dis. 2020;11:88. doi: 10.1038/s41419-020-2298-2 [DOI] [PMC free article] [PubMed] [Google Scholar]
- 115. Sim C, Denlinger DL. Insulin signaling and the regulation of insect diapause. Front Physiol. 2013;4:189. doi: 10.3389/fphys.2013.00189 [DOI] [PMC free article] [PubMed] [Google Scholar]
- 116. Farris SM. Evolution of brain elaboration. Philos Trans R Soc B: Biol Sci. 2015;370:20150054. doi: 10.1098/rstb.2015.0054 [DOI] [PMC free article] [PubMed] [Google Scholar]
- 117. Bouchebti S, Arganda S. Insect lifestyle and evolution of brain morphology. Curr. Opin. Insect Sci. 2020;42:90‐96. doi: 10.1016/j.cois.2020.09.012 [DOI] [PubMed] [Google Scholar]
- 118. Tarashansky AJ, Musser JM, Khariton M, et al. Mapping single‐cell atlases throughout Metazoa unravels cell type evolution. Elife. 2021;10:e66747. doi: 10.7554/elife.66747 [DOI] [PMC free article] [PubMed] [Google Scholar]
- 119. Johnson BR. Taxonomically restricted genes are fundamental to biology and evolution. Front Genet. 2018;9:407. doi: 10.3389/fgene.2018.00407 [DOI] [PMC free article] [PubMed] [Google Scholar]
Associated Data
This section collects any data citations, data availability statements, or supplementary materials included in this article.
Supplementary Materials
Data S1: Supporting Information.
Figure S1. Putative identities of C. calcarata cell subclusters from transcriptional similarity to known cell types in A. mellifera, 1 D. melanogaster ( 2 ; Skinnider et al. 2021), H. saltator, 3 and/or M. pharaonsis 4 for (A) unidentified neurons (Clusters 0,6,7 from Figure 1); (B) astrocyte and cortex glia (Cluster 5 from Figure 1); and (C) surface glia (Cluster 8 from Figure 1). Number in the legend indicates the number of the C. calcarata subcluster referred to as “ccalc_subcluster_num” in Table S21. AG = astrocyte glia; CG = cortex glia; OPN‐adPN = anterodorsal olfactory projection neurons; OPN‐lPN = lateral olfactory projection neurons. Indicated references correspond to those in the Supplementary methods.
Table S1: Supporting Information.
Data Availability Statement
Fastq files generated and analyzed in this study are available under BioProject PRJNA1039807 at NCBI (https://www.ncbi.nlm.nih.gov/). Code and input files used for this study are available at https://doi.org/10.5281/zenodo.12557898.