Abstract
The widespread implementation of low-dose computed tomography (LDCT) in lung cancer screening has led to the increasing detection of pulmonary nodules. However, precisely evaluating the malignancy risk of pulmonary nodules remains a formidable challenge. Here we propose a triage-driven Chinese Lung Nodules Reporting and Data System (C-Lung-RADS) utilizing a medical checkup cohort of 45,064 cases. The system was operated in a stepwise fashion, initially distinguishing low-, mid-, high- and extremely high-risk nodules based on their size and density. Subsequently, it progressively integrated imaging information, demographic characteristics and follow-up data to pinpoint suspicious malignant nodules and refine the risk scale. The multidimensional system achieved a state-of-the-art performance with an area under the curve (AUC) of 0.918 (95% confidence interval (CI) 0.918–0.919) on the internal testing dataset, outperforming the single-dimensional approach (AUC of 0.881, 95% CI 0.880–0.882). Moreover, C-Lung-RADS exhibited a superior sensitivity compared with Lung-RADS v2022 (87.1% versus 63.3%) in an independent cohort, which was screened using mobile computed tomography scanners to broaden screening accessibility in resource-constrained settings. With its foundation in precise risk stratification and tailored management, this system has minimized unnecessary invasive procedures for low-risk cases and recommended prompt intervention for extremely high-risk nodules to avert diagnostic delays. This approach has the potential to enhance the decision-making paradigm and facilitate a more efficient diagnosis of lung cancer during routine checkups as well as screening scenarios.
Subject terms: Lung cancer, Computed tomography, Physical examination
Trained on a cohort of 45,064 cases and validated on data acquired from mobile computed tomography scanners deployed in rural China, a lung cancer screening deep learning model is shown to outperform existing lung cancer risk scores.
Main
Pulmonary nodule is one of the most frequently detected abnormalities in chest imaging and the critical aspect of diagnosis is to distinguish malignant nodules clinically relevant to lung cancer from benign nodules1,2. Despite numerous efforts, lung cancer persists as a predominant malignant tumor in terms of mortality rate with the highest economic burden globally, with a particularly significant impact in China3–5. Individuals diagnosed with early-stage diseases are more likely to receive curative treatment and experience superior prognosis compared with patients diagnosed at advanced stage6. In China, there remains a gap in early-stage lung cancer detection rates compared with high-income countries (stage I: 17.3% in China versus 25.3% in the United States)7,8. This situation underscores the urgent need for widespread lung cancer screening in China to confirm the cases detected at an early stage.
Low-dose computed tomography (LDCT) has been confirmed as an effective tool for lung cancer screening2,9. Pivotal studies such as the National Lung Screening Trial (NLST) and Nederlands–Leuvens Longkanker Screenings Onderzoek (NELSON) cohorts have demonstrated that LDCT significantly reduced lung cancer mortality10,11. In addition, a prospective multicenter cohort study in China has indicated that one-off LDCT screening reduced lung cancer mortality by 31% in high-risk populations12. With the widespread application of LDCT, the detection rate of pulmonary nodules has gradually improved13,14. However, at least 95% of pulmonary nodules screened are benign, necessitating precise management strategies to ensure appropriate intervention1. For instance, only 3.6% of detected lung nodules were diagnosed as malignant in the NLST, and the baseline false-positive rate (FPR) was as high as 26.6% according to original NLST criteria10,15. Therefore, it is crucial to accurately estimate the malignancy risk of pulmonary nodules detected on LDCT to avoid missed diagnosis, late diagnosis and unnecessary biopsy procedures.
Existing guidelines for nodule management primarily classify nodules based on their density and size16–20. According to the density, pulmonary nodules are divided into solid and subsolid ones and the latter are further categorized into pure ground-glass nodules (pGGNs; no solid component) and mixed ground-glass nodules (mGGNs; both ground-glass and solid components)21. The size of the nodules would also affect the assessment of their properties. As one of the most popular guidelines, the Lung CT Screening Reporting and Data System (Lung-RADS) recommends considering solid nodules of 6 mm or smaller and pGGNs under 30 mm as benign15,22. Moreover, several risk prediction models such as the Mayo Clinic model and Brock University model integrate clinical and nodule profiles to evaluate pulmonary nodules23,24. However, these models have shown suboptimal performance in the Chinese population and require manual assessment, which is time consuming and labor intensive25,26. Therefore, automated risk assessment tools for pulmonary nodules are urgently demanded to reduce intergrader variability.
The accelerated advances of artificial intelligence (AI) have revolutionized medical processes, which have delivered remarkable effects in imaging recognition tasks such as skin cancer subtype classification, pneumonia differentiation diagnosis and cancer prognosis prediction27–31. Several deep learning-based products have been applied in the clinical workflow to detect pulmonary nodules32–34. The exploitation of AI technology for malignancy assessment of pulmonary nodules is a burgeoning direction35–39. For instance, an end-to-end deep learning model was constructed based on computed tomography (CT) volumes to predict the probability of malignancy for lung nodules in the NLST cohort with an area under the curve (AUC) of 0.944, which slightly outperformed professional physicians35. However, considering the low proportion of malignant pulmonary nodules, not all require extensive computational resources for evaluation. In areas with limited medical resources, the deployment of AI models could potentially widen healthcare disparities40. Furthermore, a comprehensive assessment for malignant nodules that integrates multidimensional information is necessary to align with clinical scenarios.
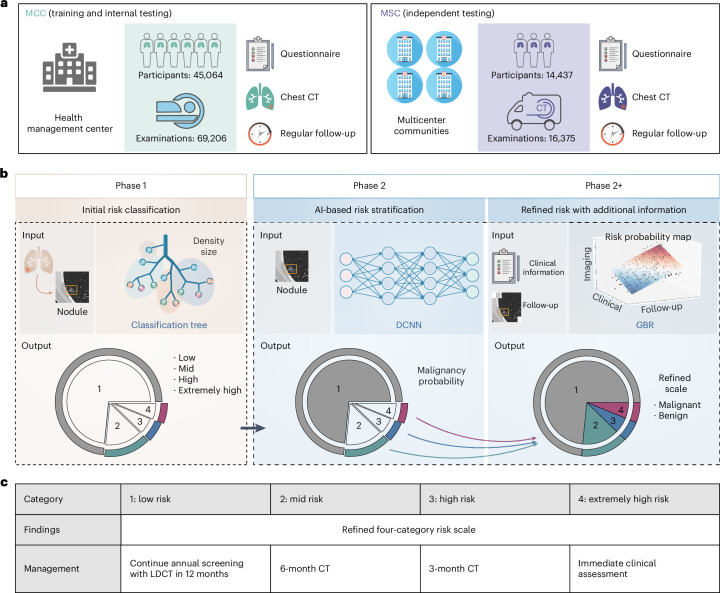
In this study, we proposed a triage-driven Chinese Lung Nodules Reporting and Data System (C-Lung-RADS) to estimate the malignancy risk of lung nodules based on large-scale datasets (Fig. 1a). This system operated in two consequent phases with different tasks (Fig. 1b). It distinguished low-, mid-, high- and extremely high-risk nodules through an automatic acquisition of nodule size and density at the initial phase. Furthermore, it integrated multimodal features such as imaging, clinical and follow-up data to identify malignant nodules and refine the risk scale. Subsequently, the performance of C-Lung-RADS was validated in an independent testing cohort acquired with mobile CT, and the accessibility of precision management strategies was further explored (Fig. 1c).
Fig. 1. Overview of the study design.
a, The C-Lung-RADS training and internal testing datasets were obtained from the MCC at the health management center in West China Hospital of Sichuan University, and the independent testing data were obtained from the MSC at multicenter communities in Western China. The subset included in the study was determined based on the inclusion and exclusion criteria, as shown in Extended Data Fig. 1. b, C-Lung-RADS pipeline architecture: phase 1 initially classified the risk of nodules by evaluating nodule size and density through decision tree models, phase 2 distinguished suspicious malignant nodules through CT images and phase 2+ targeted suspicious malignant nodules through multimodal data fusion. c, Management of nodules with different risk levels was performed accordingly.
Results
Dataset characteristics
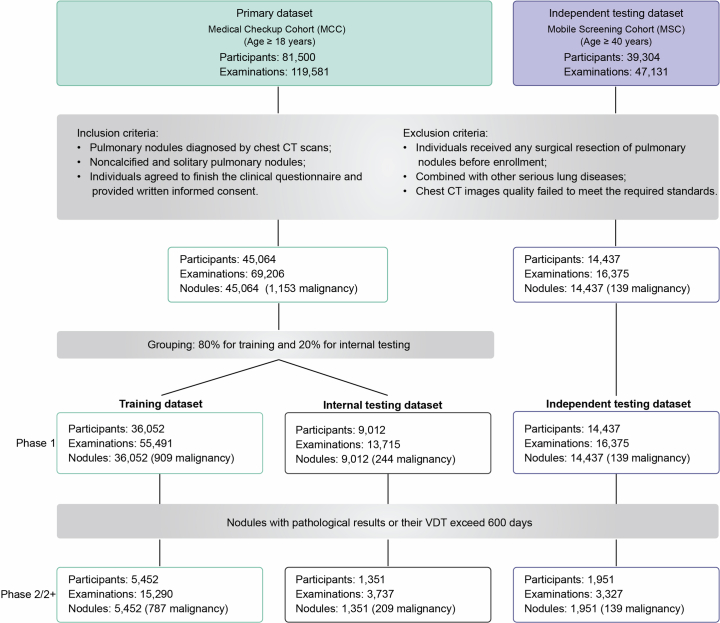
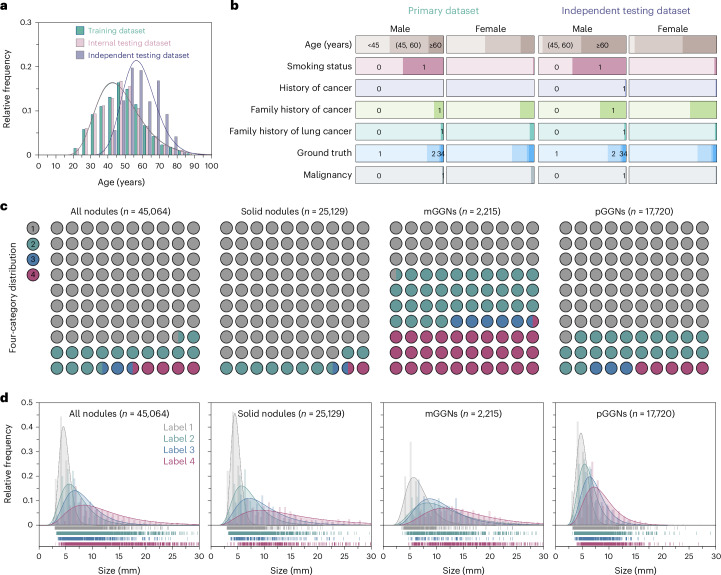
We recruited 45,064 participants from the medical checkup cohort (MCC) at the health management center in West China Hospital of Sichuan University between 2013 and 2022 as the primary dataset, and 14,437 participants in a mobile screening cohort (MSC) across multiple communities in Western China for independent testing dataset between 2019 and 2022 (Extended Data Fig. 1). The median age in both the training and internal testing datasets was 47 years, whereas the median age of the independent testing dataset was 57 years (Fig. 2a and Supplementary Table 1). Additionally, we observed a strong association between sex and smoking status, with fewer subjects having a history of cancer, family history of cancer or family history of lung cancer (Fig. 2b).
Extended Data Fig. 1. Preprocessing and filtering of lung cancer screening datasets.
Diagram describing the inclusion and exclusion in this study.
Fig. 2. Characteristics of the participants and nodules.
a, The age distribution and corresponding Gaussian fitted curves in different datasets. b, The distribution of demographic characteristics. For smoking status, history of cancer, family history of cancer, family history of lung cancer and malignancy, 0 represents no and 1 represents yes. c, The distribution of nodules with different risk levels in the primary dataset. d, Histograms of nodule size distribution and corresponding Gaussian fitted curves in the primary dataset.
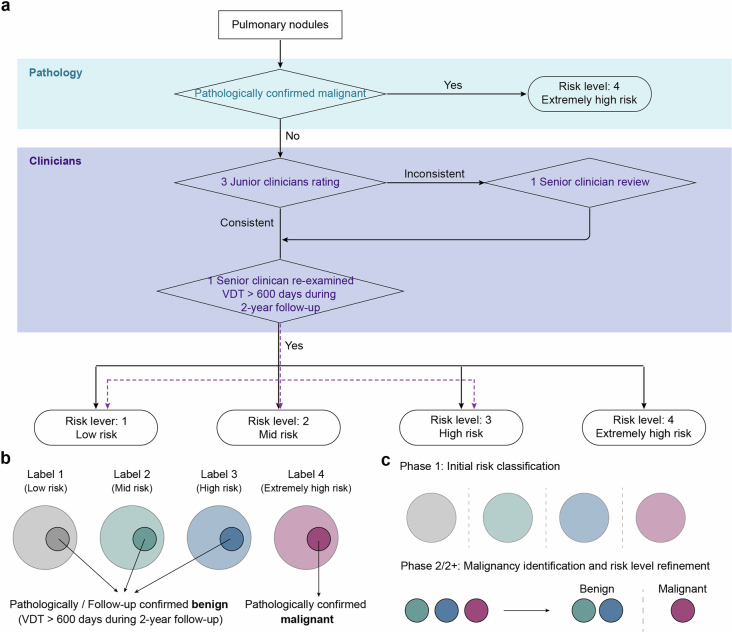
The study utilized our previously published AI detection system to identify the largest lung nodules and automatically extract their size and density, including solid nodules, mGGNs and pGGNs41. The gold standard for malignancy risk of pulmonary nodules was pathological finding or clinician ratings (Extended Data Fig. 2 and Supplementary Table 2). Nodules confirmed as malignant through pathology were directly classified as label 4. Pulmonary nodules with minor longitudinal changes, as those displaying volume doubling time (VDT) exceeding 600 days during 2-year follow-up, were classified as labels 1–3 by senior clinicians. The remaining nodules without pathology and longitudinal information were graded by the professional clinicians (labels 1–4).
Extended Data Fig. 2. The ground truth for determining the risk of malignancy in pulmonary nodules.
a, The flowchart of evaluation of the pulmonary nodules. b, The ground truth of the malignancy risk of pulmonary nodules annotated by clinicians. c, Purposes and ground truth of the two phases of C-Lung-RADS system. Phase 1 aimed to classify initial risk of nodules; Phase 2/2+ aimed to identify suspicious malignant nodules and refine risk level of nodules.
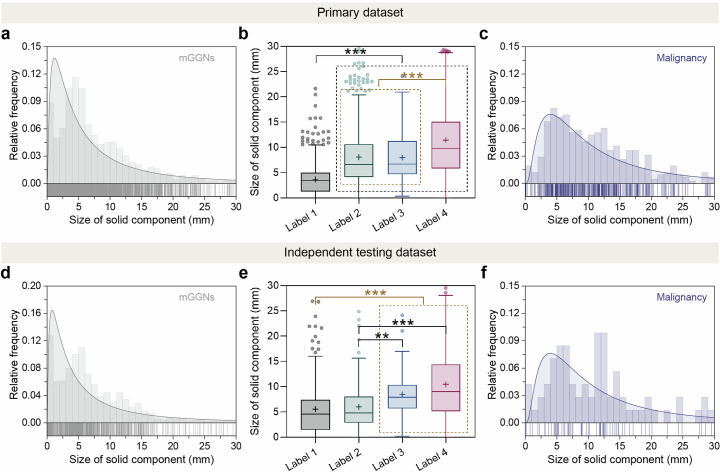
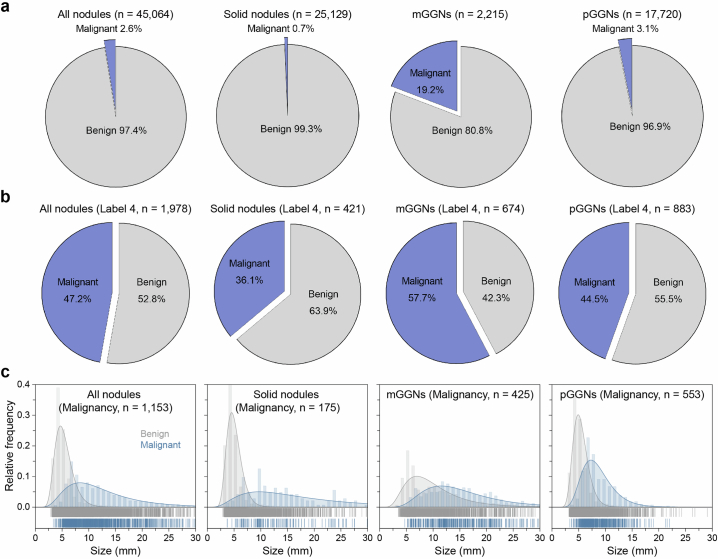
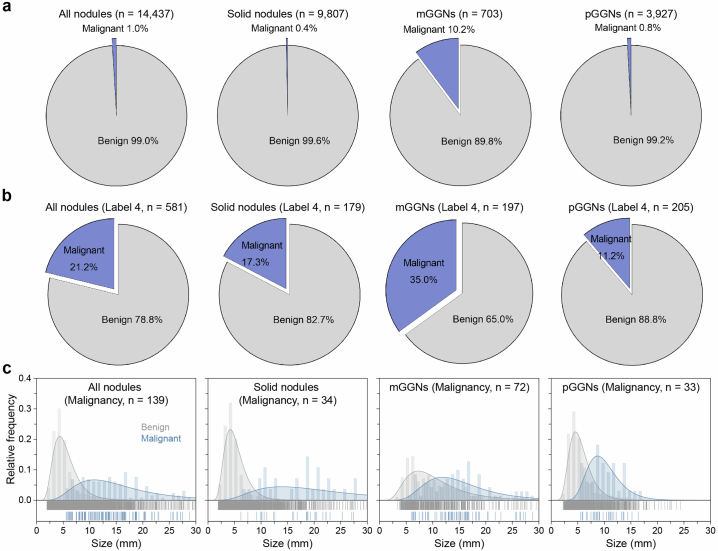
The initial dataset consisted of 25,129 solid nodules, 2,215 mGGNs and 17,720 pGGNs including label 1 (low risk), label 2 (mid risk), label 3 (high risk) and label 4 (extremely high risk) (Fig. 2c and Supplementary Table 3). The median length of nodules increased with escalating risk levels, measuring 4.68 mm, 6.10 mm, 7.30 mm and 10.22 mm for labels 1, 2, 3 and 4, respectively (Fig. 2d and Supplementary Table 4). Notably, the solid component in mGGNs were 3.42 mm, 6.62 mm, 6.70 mm and 9.80 mm for low-, mid-, high- and extremely high-risk groups, respectively (Extended Data Fig. 3). In the independent testing dataset, the distribution of nodule size exhibited slight variations compared with the primary dataset (Extended Data Fig. 4). Only 1,153 nodules (2.6%) were pathologically confirmed malignant in the MCC, while 139 malignant nodules (1.0%) were present in the MSC (Extended Data Figs. 5 and 6). The proportion and size distribution of malignant nodules also varied across different risk level groups.
Extended Data Fig. 3. Size distribution of solid components of mGGNs in the primary dataset and independent testing dataset.
a, d, Size distribution of solid component in all mGGNs in the primary dataset and independent testing dataset, respectively (gray line, Gaussian fitting curve). b, e, Size of solid components of mGGNs with different ratings in the primary dataset and independent testing dataset, respectively. The lines and plus signs in the box-and-whisker plots represent the median and mean values, respectively. The whiskers range from 25th percentile minus 1.5 times interquartile range (IQR) to 75th percentile plus 1.5 times IQR, and outliers below and above the whiskers are drawn as individual dots. The number of mGGNs with different ratings in the primary dataset and independent testing dataset could be referred to Supplementary Table 3. Statistical analyses were performed among four categories using Kruskal-Wallis H tests followed by Dunnett’s multiple comparison tests. Asterisks represent two-tailed adjusted P value, with * indicating P < 0.05, ** indicating P < 0.01, and *** indicating P < 0.001. The P values in (b) for the size of solid component between Label 2 and Label 3 was 0.999. The P values in (e) in Label 1 vs. Label 2, Label 1 vs. Label 3, Label 1 vs. Label 4, Label 2 vs. Label 3¸ Label 2 vs. Label 4¸ Label 3 vs. Label 4 were 0.929, < 0.001, < 0.001, 0.005, < 0.001, 0.999, respectively. c, f, Size distribution of the solid component of the malignancy in mGGNs, respectively (purple line, Gaussian fitting curve).
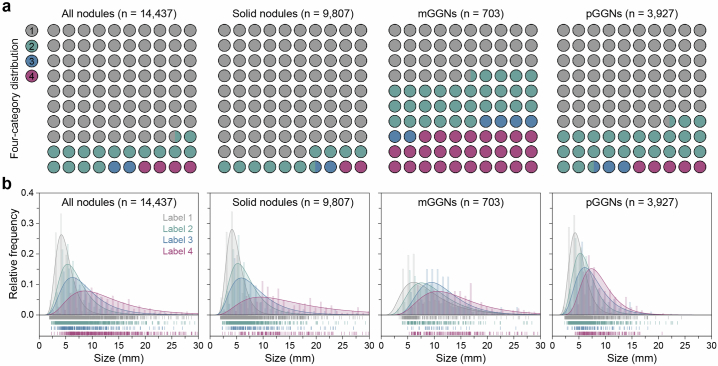
Extended Data Fig. 4. Risk and size distribution of nodules in the independent testing dataset.
a, Four-category risk distribution of all nodules, solid nodules, mGGNs, and pGGNs. b, Size distribution of nodules with different risk ratings.
Extended Data Fig. 5. Proportion and size of malignant nodules in the primary dataset.
a, The proportion of malignancy in all nodules, solid nodules, mGGNs, and pGGNs. b, The proportion of malignant nodules in different groups labeled 4. c, Size distribution of the malignant nodules in different groups including all nodules, solid nodules, mGGNs, and pGGNs.
Extended Data Fig. 6. Proportion and size of malignant nodules in the independent testing dataset.
a, The proportion of malignancy in all nodules, solid nodules, mGGNs, and pGGNs. b, The proportion of malignant nodules in different groups labeled 4. c, Size distribution of the malignant nodules in different groups including all nodules, solid nodules, mGGNs, and pGGNs.
C-Lung-RADS multiphase architecture
The development of the C-Lung-RADS pipeline consisted of two phases, in which phase 1 was to preliminarily screen the different risk nodules merely based on size and density and phase 2/2+ was to precisely identify the suspicious malignant nodules and refine scale by fusing multidimensional information (Methods). During phase 1, a classification tree was constructed and utilized to assign a risk level to each nodule. Non-low-risk nodules (labels 2, 3 and 4) were advanced to phase 2 for accurate malignancy identification and risk level refinement. An image-level malignant probability was generated through the development of a deep convolutional neural network (DCNN). Furthermore, a multidimensional regression model was constructed in phase 2+ to comprehensively evaluate the likelihood of malignancy of non-low-risk nodules. This model incorporated the AI-predicted malignant probability, clinical information and follow-up characteristics. The output probability of malignancy was mapped to a risk level such that nodules with a probability of malignancy below 0.5 were predicted to be benign and retain their original risk levels. Conversely, nodules with a higher probability of malignancy were designated as suspicious malignant and assigned a risk level of 4.
Evaluation of phase 1 model performance
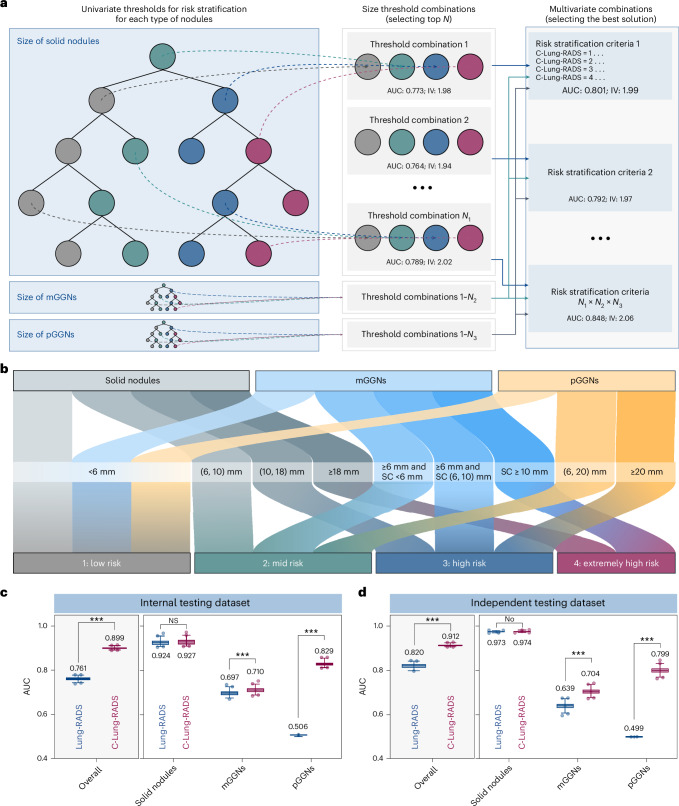
In phase 1, the density of nodules and the diameter and size of solid component in mGGNs were input to the classification tree. A grid research strategy was introduced to search for the optimal size splitting nodes of the classification tree to achieve the best four-category risk stratification (Fig. 3a). The ultimate multivariate classification tree is defined in Fig. 3b, in which the optimal size thresholds for risk stratification of three types of nodules were determined. For solid nodules, the cutoff values were 6, 10 and 18 mm to differentiate among the four risk categories. For pGGNs, the cutoff values for low, mid and high risk were set at 6 and 20 mm. As for mGGNs, the cutoff values were determined by considering both the nodule size (6 mm) and the size of the solid component (6 and 10 mm).
Fig. 3. A multivariate classification tree constructed for initial stratification of nodules in phase 1.
a, The process of building a multivariate classification tree, in which a grid research approach was introduced to tune parameters of the tree. b, The optimal size thresholds for three types of nodules in risk stratification (label 1: low risk; label 2: mid risk; label 3: high risk; and label 4: extremely high risk). c,d, AUC values of the classification tree used for identifying extremely high-risk nodules in the internal testing dataset (c) and the independent testing dataset (d). The AUC values are shown in box and whisker plots, in which the line and the plus sign represent the median and the mean values, respectively. The numbers in the plot are the mean AUC values. The whiskers range from the 2.5th to the 97.5th percentile, and points below and above the whiskers are drawn as individual dots. The stratification performance of the classification tree (C-Lung-RADS) was compared with Lung-RADS v2022 (based on intrinsic nodule’s density and size). Statistical analyses in c and d were performed using ordinary two-way ANOVA followed by Sidak’s multiple comparison tests, with n = 100 replicates per condition. The asterisks represent two-tailed adjusted P values, with ***P < 0.001. For solid nodules, the P values of AUC values between Lung-RADS v2022 and C-Lung-RADS in c and d were 0.163 and 0.764, respectively. NS, not significant; SC, solid component.
Compared with Lung-RADS v2022, C-Lung-RADS (classification tree in phase 1) showed better classification performance in overall nodules (AUC of 0.899, 95% CI 0.898–0.900), especially in pGGNs (Fig. 3c and Supplementary Table 5) in the internal testing dataset. Similar results were also obtained in the independent testing dataset, where AUC values of C-Lung-RADS and Lung-RADS v2022 were 0.912 (95% CI 0.911–0.913) and 0.820 (95% CI 0.817–0.822) for overall nodules, respectively (Fig. 3d). The false-negative rates for the internal and independent testing datasets were 7.4% (18/244) and 3.6% (5/139) (Supplementary Table 6). These results confirmed that C-Lung-RADS provided excellent risk stratification and was suitable for the initial screening of varying risk nodules. The estimated proportion of the low-risk nodule population is 78.2% in the primary dataset, whereas the proportion of the extremely high-risk nodule population is 1.8% (Table 1). A more comprehensive assessment methodology was required for accurate stratification.
Table 1.
C-Lung-RADS assessment categories
| C-Lung-RADS | Category descriptor | Findings | Management | Risk of malignancy | Estimated population prevalence |
|---|---|---|---|---|---|
| 0 | Negative | Calcifications | Continue annual screening with LDCT in 12 months | – | – |
| 1 | Low risk |
Solid nodule: • <6 mm |
Continue annual screening with LDCT in 12 months | 0.3% | 78.2% |
|
Part-solid nodule (mGGN): • <6 mm | |||||
|
Non-solid nodule (pGGN): • <6 mm | |||||
| 2 | Mid risk |
Solid nodule: • ≥6 to <10 mm |
Six-month CT | 3.2% | 17.4% |
|
Part-solid nodule (mGGN): • ≥6 mm total mean diameter with solid component <6 mm | |||||
|
Non-solid nodule (pGGN): • ≥6 to <20 mm | |||||
| 3 | High risk |
Solid nodule: • ≥10 to <18 mm |
Three-month CTa | 6.2% | 2.6% |
|
Part-solid nodule (mGGN): • ≥6 mm total mean diameter with solid component ≥6 to <10 mm | |||||
|
Non-solid nodule (pGGN): • ≥20 mm | |||||
| 4 | Extremely high risk |
Solid nodule: • ≥18 mm |
Immediate clinical assessmentb | 24.3% | 1.8% |
|
Part-solid nodule (mGGN): • Solid component ≥10 mm | |||||
| Category 2 or 3 nodules with a multidimensional model-predicted malignant probability ≥0.5 |
aFor label 3 nodules, high-resolution CT or PET/CT may be considered.
bFor label 4 nodules, a comprehensive clinical assessment is warranted, which may include a diagnostic chest CT with or without contrast enhancement, PET/CT scanning particularly when there is a solid nodule or solid component measuring 8 mm or larger, tissue sampling such as biopsies, and/or referral for additional clinical evaluation. The decision to proceed with these assessments should be based on a careful clinical evaluation, taking into account the patient’s preferences and the estimated likelihood of malignancy.
Evaluation of phase 2/2+ models performance
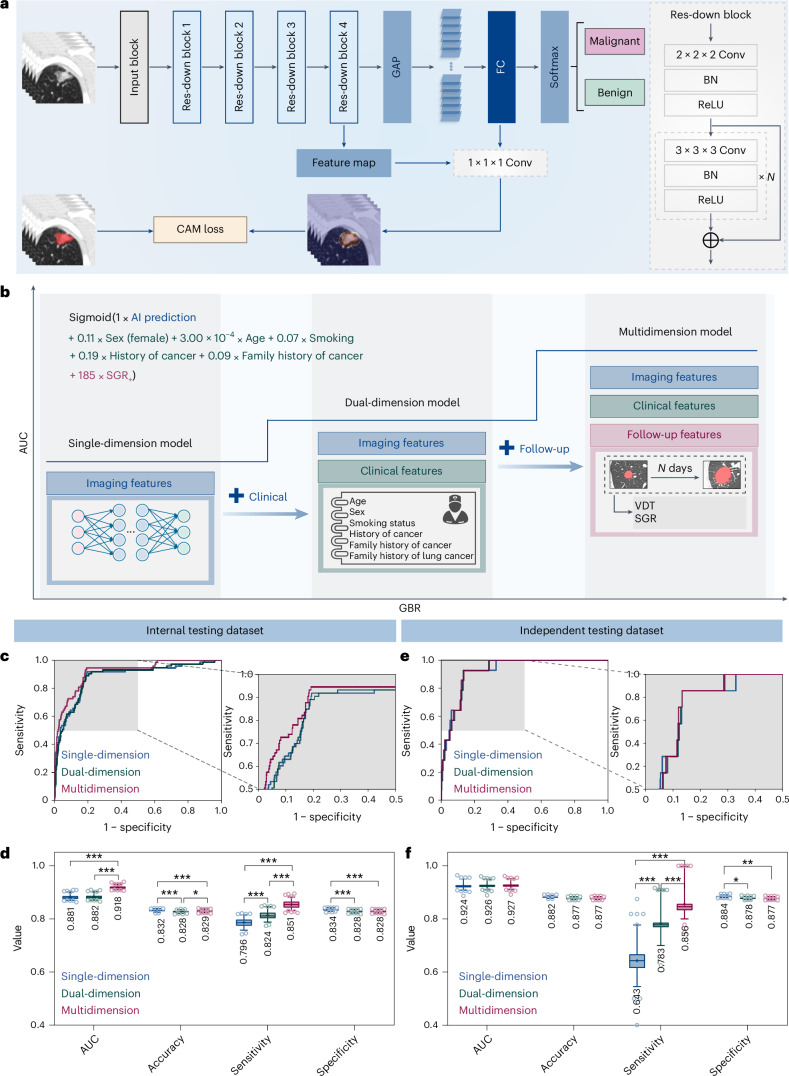
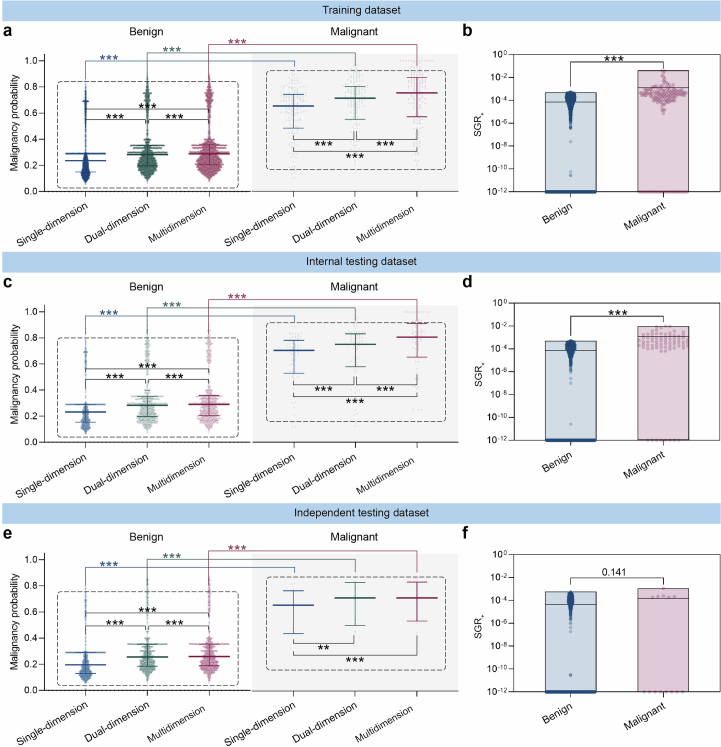
To obtain a more precise risk level, nodules with pathological results or stable follow-up were used for construction of phase 2/2+ models (Supplementary Table 7). In phase 2, a DCNN was developed to generate an image-level malignant probability (Fig. 4a). In phase 2+, the DCNN-predicted malignant probability, clinical information and follow-up features were incorporated to construct a multidimensional regression model to comprehensively assess the probability of malignancy for nodules (Fig. 4b). These single-, dual- and multidimensional models were able to achieve benign and malignant differentiation of lung nodules with significant differences in their predicted malignancy probability (all P < 0.001; Extended Data Fig. 7 and Supplementary Table 8).
Fig. 4. GBR model incorporating multidimensional information in phase 2 used to identify the malignant nodules.
a, A DCNN was used to differentiate malignant nodules from the benign ones. b, The AUC of the GBR model increased with algorithm iterations. The GBR model based solely on AI-predicted malignant probability was refined with clinical information and follow-up features to achieve more precise risk levels. c–f, The discriminatory performance of single-, dual- and multidimensional GBR models in the internal testing dataset (c and d) and independent testing dataset (e and f) was visualized. ROC curves of the three models (c and e), with specified regions zoomed in. Quantitative metrics (d and f) of the three models in classifying malignant nodules. All metrics are shown in box and whisker plots, in which the line and the plus sign represent the median and the mean values, respectively. The numbers in the plot are the mean values. The whiskers range from the 2.5th to the 97.5th percentile, and points below and above the whiskers are drawn as individual dots. Statistical analyses in d and f were performed using ordinary two-way ANOVA followed by Tukey’s multiple comparison tests, with n = 100 replicates per condition. The asterisks represent two-tailed adjusted P values, with *P < 0.05, **P < 0.01 and ***P < 0.001. The P values in d for single-dimension versus dual-dimension, single-dimension versus multidimension and dual-dimension versus multidimension were 0.451, <0.001 and <0.001 for AUC; <0.001, <0.001 and 0.025 for accuracy; <0.001, <0.001 and <0.001 for sensitivity; and <0.001, <0.001 and 1.000 for specificity, respectively. The P values in f for single-dimension versus dual-dimension, single-dimension versus multidimension and dual-dimension versus multidimension were 0.876, 0.565 and 0.857 for AUC; 0.067, 0.068 and 1.000 for accuracy; <0.001, <0.001 and <0.001 for sensitivity; and 0.012, 0.004 and 0.946 for specificity, respectively. Res, residual; Conv, convolution; FC, fully connected; BN, batch normalization; ReLU, rectified linear unit.
Extended Data Fig. 7. The malignancy probability and SGR+ distribution of the benign and malignant nodules in the three datasets predicted with single-, dual-, and multidimensional features.
The distribution of the benign and malignant nodules in the training dataset (a, b); internal testing dataset (c, d); independent testing dataset (e, f). The malignancy probability predicted by three models are visualized in scatter plots (a, c, e) with distribution (median with interquartile range). Statistical analyses in (a, c, e) were performed using Mann-Whitney U tests to compare the benign and the malignant for the same model, and using Friedman tests followed by Dunnett’s multiple comparison tests to compare the single-, dual-, and multidimension models. Asterisks represent two-tailed adjusted P value, with ** indicating P < 0.01 and *** indicating P < 0.001. The P values in (e) for malignancy probabilities of the malignant in single-dimension vs. dual-dimension and dual-dimension vs. multidimension were 0.002 and 0.771, respectively. SGR+ distributions are plotted as floating bars with min to max (b, d, f), where the line is the mean. Statistical analyses in (b, d, f) were performed using Mann-Whitney U tests to compare the SGR+ of the benign and the malignant used in the multidimension model. Asterisks represent two-tailed P value, with *** indicating P < 0.001. The P value in (f) was 0.141.
Better performance was achieved for the model considering multidimensional information compared with single-dimensional information. For the internal testing dataset, the multidimensional model yielded a higher AUC value of 0.918 (95% CI 0.918–0.919) than that of single-dimension one (AUC of 0.881, 95% CI 0.880–0.882), and its sensitivity greatly improved from 79.6% (95% CI 79.4–79.7%) to 85.1% (95% CI 85.0–85.3%) (Fig. 4c,d and Supplementary Table 9). In the independent testing dataset, the multidimension model outperformed the single-dimension one with an absolute improvement of 21.3% in sensitivity from 64.3% (95% CI 63.6–65.1%) to 85.6% (95% CI 85.1–86.1%). The AUC value of the multidimension model was 0.927 (95% CI 0.926–0.928), which was better than that of single-dimension one (AUC 0.924, 95% CI 0.923–0.926). The validity of multidimensional information was also assessed in the independent testing dataset, and the findings were consistent with those from the internal testing dataset (Fig. 4e,f). On the basis of these results, the overall C-Lung-RADS pipeline for the four-category risk stratification of nodules was developed, which integrated the classification tree in phase 1, the DCNN model in phase 2 and the gradient-boosting regression (GBR) model in phase 2+, executed sequentially to enable the identification of extremely high-risk nodules and true malignancies. According to the four-category risk classes, corresponding management has also been designed to recommend individualized intervention strategy (Table 1).
Estimated performance of realistic programs
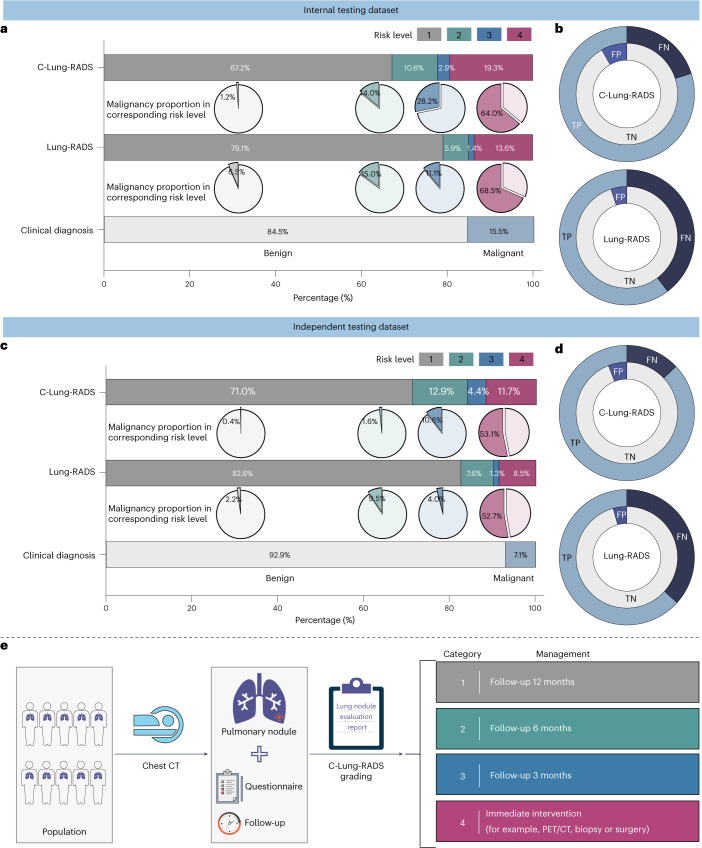
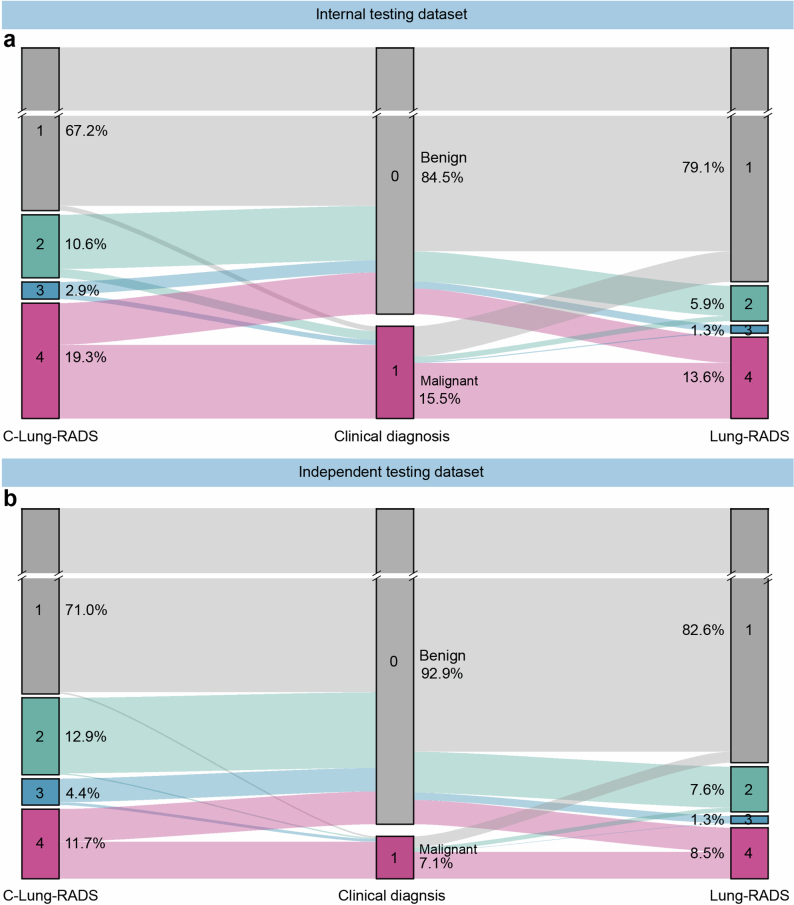
Next, the classification performance of the entire C-Lung-RADS pipeline for the four-category stratification of lung nodules was compared with Lung-RADS v2022 criteria on datasets with malignant and benign nodules. In the internal testing dataset, the proportion of high-risk populations (with a risk level of 3) detected by C-Lung-RADS and Lung-RADS v2022 was 2.9% and 1.4%, respectively, and the proportion of the extremely high-risk populations (with a risk level of 4) detected by C-Lung-RADS and Lung-RADS v2022 was 19.3% and 13.6%, respectively (Fig. 5a and Extended Data Fig. 8). Table 2 summarizes the quantitative results, showing that in the internal testing dataset, C-Lung-RADS exhibited a sensitivity of 79.9% (95% CI 74.0–84.8%), significantly higher than the 60.3% (95% CI 53.5–66.7%) sensitivity observed for Lung-RADS v2022 (P < 0.001). The corresponding FPR for C-Lung-RADS was 8.2% (95% CI 6.8–10.0%) compared with 5.1% (95% CI 3.9–6.5%) for Lung-RADS v2022 (P = 0.003). These results verified that C-Lung-RADS had a comparable risk stratification performance to the clinical diagnosis and outperformed Lung-RADS v2022, suggesting that C-Lung-RADS was more suitable for risk stratification of lung nodules in the Chinese population with a higher true positive value (Fig. 5b).
Fig. 5. Performance of the C-Lung-RADS pipeline for the malignancy risk stratification and management of lung nodules.
a, The distribution of the four risk classes identified by C-Lung-RADS and Lung-RADS v2022, and malignancy proportion in each category of risk levels in the internal testing dataset. b, The detection performance of different methods for lung cancer in the internal testing dataset. c, The distribution of the four risk classes and malignancy proportion in each category of risk levels identified by C-Lung-RADS and Lung-RADS v2022 in the independent testing dataset. For a and c, for clinical diagnosis, malignant nodules are confirmed by pathology, and benign nodules are confirmed by pathology or stable follow-up. d, The detection performance of different methods for lung cancer in the independent testing dataset. e, The pulmonary nodules detected on chest CT were assessed through C-Lung-RADS and managed according to the appropriate protocol. TP, true positive; TN, true negative; FP, false positive; FN, false negative.
Extended Data Fig. 8. The distribution of nodules with four risk classes identified by C-Lung-RADS and Lung-RADS V2022.
a,b, The proportion of nodules at different risk levels in the internal testing dataset (a) and the independent testing dataset (b).
Table 2.
Sensitivity, false-positive rate, positive predictive value and negative predictive value of the C-Lung-RADS and Lung-RADS v2022
| Variables | C-Lung-RADS | Lung-RADS | P value | ||
|---|---|---|---|---|---|
| Percentage (95% CI) | n/N | Percentage (95% CI) | n/N | ||
| Internal testing dataset | |||||
| SEN | 79.9 (74.0–84.8) | 167/209 | 60.3 (53.5–66.7) | 126/209 | <0.001 |
| FPR | 8.2 (6.8–10.0) | 94/1,142 | 5.1 (3.9–6.5) | 58/1,142 | 0.003 |
| PPV | 64.0 (58.0–69.6) | 167/261 | 68.5 (61.5–74.8) | 126/184 | 0.325 |
| NPV | 96.1 (94.8–97.1) | 1,048/1,090 | 92.9 (91.3–94.2) | 1,084/1,167 | <0.001 |
| Independent testing dataset | |||||
| SEN | 87.1 (80.5–91.7) | 121/139 | 63.3 (55.0–70.9) | 88/139 | <0.001 |
| FPR | 5.9 (4.9–7.1) | 107/1,812 | 4.4 (3.5–5.4) | 79/1,812 | 0.035 |
| PPV | 53.1 (46.6–59.4) | 121/228 | 52.7 (45.2–60.1) | 88/167 | 0.941 |
| NPV | 99.0 (98.4–99.3) | 1,705/1,723 | 97.1 (96.3–97.8) | 1,733/1,784 | <0.001 |
Statistical analyses were performed using chi-square tests, with two-tailed P values presented. SEN, sensitivity; PPV, positive predictive value; NPV, negative predictive value.
Additionally, the superior performance of C-Lung-RADS was further validated in the independent testing dataset. The proportions of high-risk populations detected by C-Lung-RADS and Lung-RADS v2022 were 4.4% and 1.3%, while the proportions of the suspected malignancy (extremely high risk) detected by the these approaches were 11.7% and 8.5%, respectively (Fig. 5c,d). In the independent testing dataset, the sensitivity for C-Lung-RADS was 87.1% (95% CI 80.5–91.7%) versus 63.3% (95% CI 55.0–70.9%) for Lung-RADS v2022 (P < 0.001) and the associated FPR for C-Lung-RADS was 5.9% (95% CI 4.9–7.1%) versus 4.4% (95% CI 3.5–5.4%) for Lung-RADS v2022 (P = 0.035) (Table 2). Therefore, C-Lung-RADS may substantially improve the sensitivity, albeit with an increase in FPR. These findings validated the favorable generalizability of the C-Lung-RADS pipeline and suggested its anticipated efficacy across a broader spectrum of Chinese data.
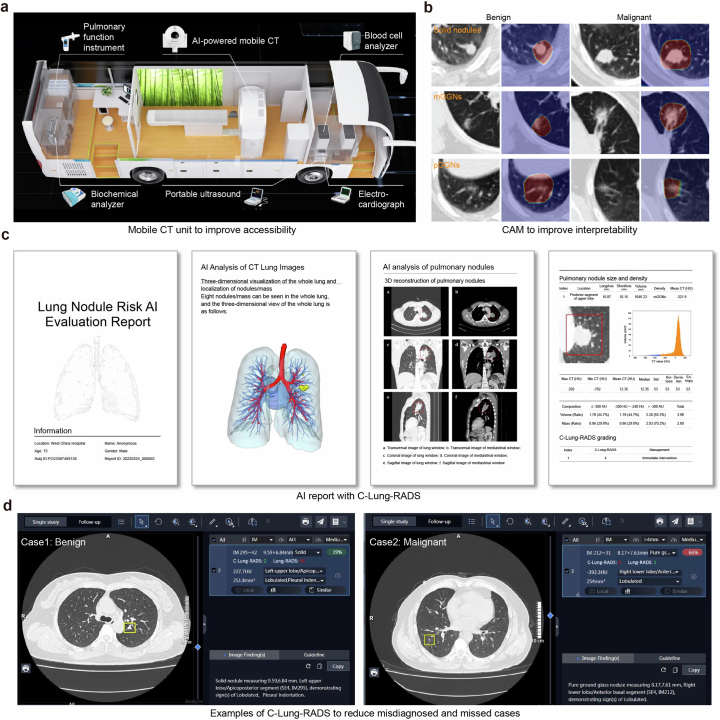
Precise stratification laid the foundation for personalized management of nodules (Fig. 5e). Nodules of the low-risk category (label 1) were advised to undergo annual monitoring. For those at labels 2 and 3, semi-annual and quarterly follow-ups were recommended. Label 4 nodules, deemed to pose an extremely high risk, were necessitated immediate clinical action. The choice of intervention including enhanced CT scans, positron emission tomography (PET)/CT imaging, biopsies or surgical procedures was carefully considered with regard to the safety of the testing, the potential informativeness of additional diagnostics and patient preferences. Moreover, the mobile CT units and class activation map (CAM) of DCNN have, respectively, enhanced the accessibility and interpretability of the C-Lung-RADS (Extended Data Fig. 9). Physicians could utilize AI reports with C-Lung-RADS to inform their decision-making, thereby striving to minimize the chances of overlooking or misjudging diagnoses. These explorations demonstrated the clinical potential of C-Lung-RADS and its readiness for broader application in clinical scenarios.
Extended Data Fig. 9. The application of C-Lung-RADS.
a, The detail of mobile CT unit equipment. b, CAM diagram of deep learning model. c, The AI report with C-Lung-RADS generated corresponding imaging analysis and assessed pulmonary nodules. d, Examples of C-Lung-RADS to reduce misdiagnosed and missed cases. CAM, class activation map.
Discussion
This study presented the C-Lung-RADS, a system for assessing the malignancy risk of pulmonary nodules by applying stepwise to lung cancer screening datasets. Employing a multiphase framework, the system adeptly identified a substantial number of low-risk pulmonary nodules to alleviate patient anxiety. Additionally, it accurately distinguished malignant pulmonary nodules by integrating multimodal information to optimize healthcare resource allocation. The utilization of mobile CT scanners alongside C-Lung-RADS has the potential for broader adoption in resource-limited areas.
Based upon large-scale real-world data, C-Lung-RADS identified 6, 10 and 18 mm as the cutoff values for the four risk types of solid nodules, and 6 and 20 mm as the cutoff values for low-, mid- and high-risk pGGNs in phase 1. Notably, C-Lung-RADS systematically classified subsolid nodules in detail, highlighting the progression risk associated with the solid component42. Under such size thresholds, C-Lung-RADS demonstrated significantly superior classification performance in subsolid nodules compared with Lung-RADS v2022. Inevitably, this phase encountered cases of false negatives. The majority of missed cancers in phase 1 exhibited ground-glass density, with an average diameter of approximately 6 mm, and the pathology revealed predominantly noninvasive adenocarcinoma. Previous studies have corroborated that pGGNs are mostly indolent, with patients exhibiting a favorable prognosis after surgery and not requiring immediate treatment43,44. The size of the solid components correlates with the pathological type, and the emergence of solid components may raise suspicions of invasive adenocarcinoma45–47. In clinical practice, physicians could swiftly identify a substantial portion of low-risk nodules by assessing their size and density, advising these patients to undergo routine annual checkups and alleviating unnecessary concerns.
In terms of high-risk nodules, it is difficult to make an accurate assessment based solely on size and density. Therefore, C-Lung-RADS incorporated AI-predicted probabilities, demographic factors and follow-up change characteristics in phase 2. These medical data of different modalities provide patient information from distinct perspectives, with both overlapping and complementary information, and the clinical multimodal data features serve as the foundation for precise disease diagnosis48–51. In particular, deep learning algorithms have effectively identified imaging characteristics associated with the risk of pulmonary nodules52,53. A range of clinical factors, such as smoking status and age, have been confirmed to be significantly correlated with malignant pulmonary nodules54,55. Additionally, the VDT of nodules as observed during follow-up is a critically important prognostic indicator for predicting malignancy56,57. Multimodal C-Lung-RADS would offer healthcare professionals a powerful tool for auxiliary decision-making, helping to mitigate delays in the treatment of malignant nodules.
It was reported that the detection rate of pulmonary nodules in chest CT scans ranges from 30% to 50%, yet the vast majority of these nodules are benign13,14. Numerous previous studies have harnessed the power of AI to evaluate the risk of malignancy in pulmonary nodules identified through LDCT35–38. Compared with these one-time assessment models that require the collection of comprehensive information for all detected nodules, the multiphase system utilized as few resources as possible to evaluate nodules in clinical settings. The predictive performance of the single-assessment model can be compromised once dimensional information is missing48. Initially, the first phase identified nodules of different risks based on nodule size and density, effectively filtering out the majority of low-risk individuals. Other non-low-risk nodules accounted for a minority and then advanced to the second phase, which involved the collection of multimodal information and computation by deep learning models. This refined strategy ensures that only the most complex cases require intensive resources, thereby enhancing both efficiency and scalability in lung nodule management.
C-Lung-RADS was evaluated in an independent testing dataset of a screening cohort using mobile CT units. It is reported that the uptake rate of LDCT for lung cancer screening in China stands at 33%, associated with factors such as structural delays and navigation assistance58. Therefore, we have proposed a screening protocol that combines mobile CT scanners and AI software to maximize lung cancer screening participation and minimize structural delays through an assessment-to-timely-screening approach in these areas59. Mobile CT units break through geographic limitations and have been applied in medical programs across Kenya, UK communities and Brazil60–62. Furthermore, the proportion of female and non-smoking individuals among lung cancer patients is gradually increasing, necessitating greater attention63. The hierarchical risk stratification protocol for pulmonary nodules requires further validation through randomized controlled trials to ascertain its clinical utility.
A stratified management strategy was advocated for pulmonary nodules based on their risk profiles. Drawing on current guidelines and the expertise of professional physicians, annual surveillance is recommended for low-risk nodules1. Mid- and high-risk nodules warrant more frequent monitoring, with follow-ups scheduled for 6 and 3 months, respectively, to detect any evolution that may necessitate further action64. Immediate intervention is advised for extremely high-risk nodules as timely intervention is crucial for the prognosis of lung cancer65. The choice of specific clinical intervention, including PET/CT scans, biopsy or surgery, should emerge from multidisciplinary discussions, taking into account the patient’s individual preferences to make a personalized decision66. Furthermore, molecular biomarkers play a pivotal role in augmenting the risk stratification of pulmonary nodules67–71. A novel model named PulmoSeek Plus combines clinical, imaging and cell-free DNA methylation biomarkers to accurately classify pulmonary nodules, providing better discrimination capacity than single radiomic and methylation models, showing clinical application potential69. By harnessing the collective power of these diverse modalities, healthcare professionals will be better equipped to manage lung nodules, ultimately leading to improved patient outcomes in the early detection and treatment of lung cancer.
Several limitations exist for this study. First, the system as a risk stratification approach would inevitably produce false negatives. At the initial assessment stage, the vast majority of false-negative cases were indolent lung cancer, but it is still necessary to explore methods such as incorporating molecular biomarkers to improve the accuracy of model prediction. Secondly, the existing follow-up intervals were categorized into 3, 6 and 12 months, and more precision intervention schema for patients with screen-detected pulmonary nodules warrant exploration. Furthermore, the system was constructed based on a population in Western China and generalization to other regions is necessary to broaden the applicability of the model. In the future, we are committed to ongoing iteration of C-Lung-RADS to enhance its performance and broaden its application scope.
The C-Lung-RADS served as a multiphase approach to assess the malignancy risk of pulmonary nodules, enhancing early lung cancer detection while optimizing healthcare resources. Further adopting multimodal data fusion has enhanced the diagnostic accuracy of extremely high-risk nodules. This implemented standardized monitoring or intervention strategies for patients with pulmonary nodules of varying risk levels, thereby preventing unnecessary invasive procedures and delays in diagnosis. Anticipated to supplement conventional screening methods, C-Lung-RADS is set to propel a revolutionary shift in the paradigm of lung cancer management.
Methods
Participant recruitment
The retrospective primary dataset comprised participants from the MCC in the West China Hospital of Sichuan University, which included subjects aged 18 years and older who underwent a voluntary chest CT imaging examination from 2013 to 2022. The independent testing dataset was derived from the MSC. This cohort was initiated between 2019 and 2022 in various communities across Sichuan Province, China (clinical trial registration number: ChiCTR1900024623). It was conducted at multiple sites, including Longquan District in Chengdu, Pidu District in Chengdu, Mianzhu City and Ganzi Tibetan Autonomous Prefecture. As an observational study, the lung cancer screening program of the MSC enrolled local residents who were 40 years of age or older and volunteered to undergo chest CT scans. The study received ethical clearance from the Ethics Committee of West China Hospital, Sichuan University (no. 2023.2287).
Participants were eligible to be included in the study only if they met all the following criteria: (1) pulmonary nodules diagnosed by chest CT or LDCT scans; (2) noncalcified and solitary pulmonary nodules including solid nodules, mGGNs (both ground-glass and solid components) and pGGNs; (3) agreed to finish the clinical questionnaire; and (4) agreed to provide written informed consent. Participants were excluded from study enrollment if they met any of the following criteria: (1) received any surgical resection of pulmonary nodules before enrollment, (2) combined with other serious lung diseases such as pulmonary fibrosis or bronchiectasis, and (3) chest CT image quality failed to meet the required standards, CT volumes with <50 slices or patients with no qualifying volumes.
Gold standard of risk level
The gold standard for determining the malignancy risk of pulmonary nodules was established by consistently considering pathological findings and clinician ratings, utilizing the rules outlined in Extended Data Fig. 2. First, nodules pathological diagnosed as malignancy were categorized as extremely high risk (label 4). Then, the nodules pathologically confirmed benign or with VDT exceeding 600 days during 2-year follow-up were considered benign and classified as not extremely high risk (labels 1–3). Finally, the nodules were initially assessed by three junior doctors (3–5 years of experience), followed by quality control and final review from two senior physicians (over 10 years of experience).
Clinical information collection
Each participant provided written informed consent and completed a questionnaire on risk factors for lung cancer, including age, sex, smoking status, history of cancer, family history of cancer and family history of lung cancer. The pathological diagnostic outcomes for the participants were obtained from the hospital information system or acquired through telephone follow-up.
Chest CT images were taken using the following equipment: United Imaging Healthcare uCT 960+, uCT 780, uCT 528 (UNICOM vehicle-mounted CT), Siemens Somatom Sensation 16 spiral CT, Somatom Definition Flash dual-source CT, Somatom Sensation AS128 CT, GE Optima CT680, etc. CT image scanning and reconstruction parameters: tube voltage ~100–120 kV, tube current 120 mAs, collimator 128 × 0.6 mm, pitch 0.6, matrix 512 × 512, scan time ~4–5 s, scan layer thickness ~1–5 mm, lung window width ~1,500–1,800 HU and window level ~−500 to −600 HU, mediastinal window width ~250–350 HU and window level ~40–50–HU. CT images stored in digital imaging and communications in medicine (DICOM) format were interpreted by radiological physicians. A panel of three radiologists, including two junior radiologists and one senior radiologist with substantial expertise, collaboratively performed the Lung-RADS v2022 grading for the pulmonary nodules of enrolled participants.
Data preprocessing
Image resampling strategy
The images were resampled to a target spacing of 1 × 1 × 1 mm3 to obtain local structural information using an interpolation strategy. Linear and nearest-neighbor interpolation methods were applied for isotropic and anisotropic images, respectively, to suppress resampling artifacts.
Intensity normalization
Images were normalized with lung window (window width: 1,500 HU and window level: −600 HU) using the z-score standardization method, and the normalized intensity values were clipped to (−1, 1) to achieve fast convergence of the model.
Handling imbalanced data
Imbalanced data distribution occurred in the lung cancer screening data, where the majority of the data (~98%) were benign, while the minority were malignant. To address this challenge, we calculated weights for each class based on the inverse frequency of the class in the dataset. This means that classes with fewer samples receive higher weights, making them more influential in the learning process72.
Details in AI detection model
A convolutional neural network was used for the intelligent detection of each pulmonary nodule, resulting in a patch with a size of 96 × 96 × 96, as detailed previously41. The resulting patches were then used as inputs to develop the risk stratification model.
Model development
The development of the C-Lung-RADS pipeline comprised two phases: phase 1 for initial risk classification and phase 2/2+ for identifying the suspicious malignant nodules.
Phase 1: initial risk classification of nodules by a classification tree
A classification tree model was developed to identify various risks of nodules considering nodal intrinsic properties (that is, density and size). A grid search was applied to define optimal thresholds for four-category risk stratification.
Construction of the classification tree
In phase 1 training, a classification tree was constructed with 36,052 pulmonary nodules from as many participants, where the inputs were nodule’s density, size and solid component’s size in mGGNs, and the output was the risk level (~1–4). A grid search approach was introduced to determine the optimal splitting nodes of the classification tree for effective four-category discrimination. The process involved three steps:
First, all the continuous variables were discretized to establish the classification rules.
Second, for each density type of nodule, a univariate classification tree was trained using nodule size as the sole feature. Rules such as maximum depth, minimum samples for node splitting and class weight were recorded. Size splitting points between adjacent risk levels and their neighbor size were considered as alternative thresholds. A grid search identified top-performing threshold combinations for risk stratification, resulting in N threshold candidates for each nodule type.
Finally, for all density types of nodules, a multivariate classification tree was trained. Based on the threshold candidates of three types of nodules, grid research was conducted to create comprehensive combinations. The performance was calculated for each combination, with the best-performing one regarded as the final rule for risk stratification in phase 1.
Evaluation metrics
The performance of the risk stratification rule was evaluated by classification tree loss, receiver operating characteristic (ROC) curve, the area under the ROC curve (AUC) and information value (IV). The ROC curve reflected the trade-off between the sensitivity and specificity of the model, with a higher AUC representing better performance. IV measured the predictive ability of a categorical variable x to the target binary outcome. The computation of IV depended on the weight of evidence (WOE), which could reflect the difference in the positive–negative ratio between the current group and the overall sample. Detailed definitions of WOE and IV are as follows:
| 1 |
| 2 |
| 3 |
where is the group of categorical variables from 1 to 4, i is the current category, denotes the number, refers to overall positives, refers to the positives in the category, refers to overall negatives and refers to the negatives in the category. A reasonable classification scheme entailed increasing with i, indicating a higher malignancy proportion with escalating risk levels. Therefore, the initial four-category risk stratification rule was achieved in phase 1, with 1 representing low risk, 2 representing mid risk, 3 representing high risk and 4 representing extremely high risk, used for screening of non-low-risk nodules.
Phase 2: malignancy evaluation by a deep learning model
Deep learning algorithms have indeed shown promising results in identifying malignancies, differentiating cancer subtypes and predicting tumor invasiveness73–75. In phase 2, a DCNN model was developed to generate image-level malignant probabilities of nodules.
Construction of the DCNN model
During the training process of phase 2, a DCNN model was developed using 5,452 pulmonary nodules from as many participants. Nodule images were input to predict malignancy probability, aiming to differentiate malignant nodules from benign ones.
The DCNN architecture included an input block, four continuous down-sampling blocks and an output block, referring to a prior publication76. Briefly, (1) the input block was a three-dimensional convolutional layer for converting images into semantic representations, (2) the four down-sampling blocks included four convolutional layers for generating feature maps, (3) a global average pooling (GAP) layer regularized the network to prevent overfitting and (4) a fully connected layer as the output block was adopted to generate the malignancy probability for nodules, which was further translated into a malignant or benign classification. Notably, the CAM served as the attention map to guide the network to focus on the nodule region with visual interpretability. To improve the classification performance of the DCNN, a loss function was calculated, composed of cross-entropy loss () and CAM loss (), as defined below:
| 4 |
| 5 |
| 6 |
| 7 |
where denotes the combined ratio; measures the Dice similarity coefficient between nodule_mask and , driving the network to learn more spatially discriminative feature representations and to focus on nodule regions; and are the minimum–maximum normalization of and , respectively; is defined as the CAM for class i; and indicates the importance of the activation at , leading to an image belonging to class i. H and W denote the height and width of the nodule mask, respectively; l1 is the L1 norm, a type of norm used in mathematics to measure the size of a vector; e is Euler’s number, a mathematical constant approximately equal to 2.71828; zi represents the activation value of class i in the CAM; and j is an index variable used in the softmax function to represent different classes or categories.
During the training process, other parameters were carefully set. The learning rate used to refine the network was reduced from a large initial value (1 × 10⁻³) to a small value (1 × 10⁻⁵). The Adam optimizer was set to betas of (0.9, 0.999) and epsilon of 1 × 10⁻⁸. Data augmentation techniques such as shifting, scaling, flipping, cropping, rotating and adding noise were employed to improve model robustness.
Model calibration
The output of malignancy probability was calibrated by Platt scaling and temperature scaling in the training stage. By adjusting the scaling and intercept parameters of the logistic regression model, the calibrated probabilities could better reflect the true likelihood of each class. Temperature scaling involved adjusting the temperature parameter in softmax function to scale down or up the predicted probabilities of the classes. With these strategies, the output probabilities of the DCNN model could be well calibrated and interpreted as reliable estimates of confidence in its predictions.
Inference configuration
The DCNN was implemented in PyTorch with one Nvidia Tesla V100 graphics processing unit. We randomly selected 20% of the primary dataset as an internal testing dataset, with its loss computed at the end of each training epoch. The training process was considered converged if the loss stopped decreasing within ten epochs.
Phase 2+: multidimensional diagnosis by GBR
To better identify malignant nodules, a multivariable regression model was constructed integrating multidimensional information from imaging, clinical and follow-up features.
Construction of the GBR model
In phase 2+ training, a GBR model was developed to predict the final risk level of nodules by integrating multidimensional information. Specifically, the imaging feature referred to AI-predicted malignant probability from phase 2, and clinical features included lung cancer risk factors (that is, age, sex, smoking status, history of cancer, family history of cancer and family history of lung cancer). Follow-up features consisted of the specific growth rate (SGR) and VDT, calculated from follow-up pair CT images77:
| 8 |
| 9 |
where and are the nodule volumes of a follow-up pair of images quantified from AI-based segmentation results78 and represents the time interval between scans. SGR was decomposed into its positive (SGR+) and negative (SGR−) components. This strategy enabled the model to independently evaluate the trends of growth and reduction in nodule volume changes. Multidimensional features were fused as input for the GBR model to output malignant probability and corresponding risk level. The GBR model was trained on 15,290 CT examinations (including follow-up scans) from 5,452 participants and represented as follows:
| 10 |
where is the output malignancy probability of the GBR model, is the DCNN and the input i is the CT nodal patch to generate the logits of malignancy probability. and represent the clinical features and coefficients, while and represent the nodule follow-up features and coefficients. Three items in the formula served as weak prediction models, trained sequentially to compensate the weakness of their predecessor and assembled together to become the ultimate trained model. The least absolute shrinkage and selection operator (LASSO) algorithm was used to select the most important features and generate optimal coefficients. Logistic loss was used as the classification loss function. Finally, the GBR model was represented as follows:
| 11 |
First, continuous variables were normalized to 0–1. Fivefold cross-validation was applied to avoid grouping bias and model overfitting.
Second, a GBR algorithm started creating a single leaf based on the imaging model (), with the error between the output and label serving as the learning target for the second model.
Third, when training the second model, LASSO regression was used to select the most important clinical features () and generate the optimal coefficients (). To eliminate the strong correlation between sex and smoking, clinical features were fitted in two steps. First, sex was balanced through subsampling to fit the regression model for other clinical features. This step was repeated 50 times, using a bagging strategy to create an ensemble of multiple models. Second, a gradient-boosting strategy was employed for univariate regression on the sex dimension. This updated the model , and the error between the output and label served as the learning target for the third model.
Fourth, LASSO regression was used in training the third model to select critical follow-up features () and optimize coefficients ().
Finally, a more robust multidimensional model was generated () to distinguish malignant nodules effectively compared with single- and dual-dimensional models. The output provided the malignancy probability for each nodule. Nodules with a probability of malignancy below 0.5 were predicted to be benign and retained their original risk levels, while those with a higher probability of malignancy were predicted to be malignant and assigned a risk level of 4. Therefore, the C-Lung-RADS criteria for four-category risk stratification for pulmonary nodules were finalized.
Model validation
Internal testing of models
For phase 1, the internal testing dataset included 9,012 nodules from 9,012 participants, which were screened by the classification tree to identify the initial risk level of nodules. For phases 2 and 2+, the internal testing dataset included 1,351 nodules from 1,351 participants, first graded by the DCNN to generate malignant probability, which combined with clinical and follow-up features as the input of the GBR model to determine the final risk level.
Independent testing of models
In phase 1, a total of 16,375 CT examinations from 14,437 participants were decided by the classification tree. In phase 2, the CT images of 1,951 nodules (from 3,327 examinations) were fed into DCNN model to generate malignancy probability. This, along with clinical and follow-up features, served as input for the GBR model to determine the final risk level.
Evaluation metrics
A variety of metrics were assessed including ROC curves and corresponding AUC values, accuracy, sensitivity, specificity, FPR, positive predictive value and negative predictive value.
Statistical analysis
Shapiro–Wilk tests were used to check the normal distribution of continuous variables. Continuous variables that were approximately normally distributed were represented as mean ± s.d. Continuous variables with asymmetrical distributions were represented as median (25th, 75th percentiles). Categorical variables were expressed as counts and percentages and compared using chi-square tests. The performance of the classification tree was compared with Lung-RADS v2022 using ordinary two-way analysis of variance (ANOVA) followed by Sidak’s multiple comparison tests. To quantitatively compare the size of the solid component between the four different risk nodules, statistical analyses were performed using Kruskal–Wallis H tests followed by Dunnett’s multiple comparison tests. In addition, Mann–Whitney U tests were used to compare the malignancy probability and SGR+ distribution between the benign and the malignant nodules. To compare the malignancy probability among three models (single-, dual- and multidimension models), Friedman tests followed by Dunnett’s multiple comparison tests were applied. Two-tailed adjusted P values were obtained and represented by asterisks, with *P < 0.05, **P < 0.01 and ***P < 0.001. All statistical analyses were implemented using IBM SPSS 26.0. All plots were drawn by GraphPad Prism 9 and Origin 2021. All figures were created by Adobe Illustrator 2023.
Reporting summary
Further information on research design is available in the Nature Portfolio Reporting Summary linked to this article.
Online content
Any methods, additional references, Nature Portfolio reporting summaries, source data, extended data, supplementary information, acknowledgements, peer review information; details of author contributions and competing interests; and statements of data and code availability are available at 10.1038/s41591-024-03211-3.
Supplementary information
Supplementary Tables 1–9.
Acknowledgements
We thank all those who participated in the construction of MCC and MSC. This research was supported by the National Natural Science Foundation of China (grant 92159302 to W.L., grant 82100119 to C.W., grant 82341083 to C.W., grant 62131015 to D.S. and grant U23A20295 to D.S.), National Key Research and Development Program of China (grant 2023YFF1204304 to F.S.), Science and Technology Project of Sichuan (grant 2022ZDZX0018 to W.L.), the Science and Technology Project of Chengdu (grant 2023-YF09-00007-SN to C.W.) and the 1.3.5 Project for Disciplines Excellence of West China Hospital, Sichuan University (grant ZYYC23027 to C.W.).
Extended data
Author contributions
C.W., F.S., D.S. and W.L. conceived the idea and designed the experiments. C.W., J.S., Y.H. and J.W. implemented and performed the experiments. C.W., J.S., Y.H., J.W., X.L., L.Y., Y.W., X.S.Z. and Y.Z. analyzed the data and experimental results. C.W., J.S., Y.H., J.W. and F.S. wrote the paper. All the authors reviewed, edited and approved the paper.
Peer review
Peer review information
Nature Medicine thanks Florian Fintelmann, Colin Jacobs and the other, anonymous, reviewer(s) for their contribution to the peer review of this work. Primary Handling Editor: Lorenzo Righetto, in collaboration with the Nature Medicine team.
Data availability
The clinical data for this study were collected with the approval of the ethics committee and are subject to restrictions for this research. No publicly available datasets were used in this study. De-identified tabular data are strictly for noncommercial academic research and necessitate a formal agreement on data usage. Al requests complying with legal and ethical requirements for data use will be granted. Data requests may be made to the corresponding author (Weimin Li, weimi003@scu.edu.cn). Requests will be processed within 2 months.
Code availability
The code is available on Github (https://github.com/simonsf/C-Lung-RADS).
Competing interests
F.S., Y.H., J.W. and Y.W. are employees of United Imaging Intelligence. The company had no involvement in the design, execution, surveillance, data analysis or interpretation of the study. The other authors have no competing interests.
Footnotes
Publisher’s note Springer Nature remains neutral with regard to jurisdictional claims in published maps and institutional affiliations.
These authors contributed equally: Chengdi Wang, Jun Shao, Yichu He.
Contributor Information
Chengdi Wang, Email: chengdi_wang@scu.edu.cn.
Feng Shi, Email: feng.shi@uii-ai.com.
Dinggang Shen, Email: Dinggang.Shen@gmail.com.
Weimin Li, Email: weimi003@scu.edu.cn.
Extended data
is available for this paper at 10.1038/s41591-024-03211-3.
Supplementary information
The online version contains supplementary material available at 10.1038/s41591-024-03211-3.
References
- 1.Mazzone, P. J. & Lam, L. Evaluating the patient with a pulmonary nodule: a review. JAMA327, 264–273 (2022). [DOI] [PubMed] [Google Scholar]
- 2.Adams, S. J. et al. Lung cancer screening. Lancet401, 390–408 (2023). [DOI] [PubMed] [Google Scholar]
- 3.Bray, F. et al. Global cancer statistics 2022: GLOBOCAN estimates of incidence and mortality worldwide for 36 cancers in 185 countries. CA Cancer J. Clin.74, 229–263 (2024). [DOI] [PubMed] [Google Scholar]
- 4.Chen, S. et al. Estimates and projections of the global economic cost of 29 cancers in 204 countries and territories from 2020 to 2050. JAMA Oncol.9, 465–472 (2023). [DOI] [PMC free article] [PubMed] [Google Scholar]
- 5.Han, B. et al. Cancer incidence and mortality in China, 2022. J. Natl Cancer Cent.4, 47–53 (2024). [DOI] [PMC free article] [PubMed] [Google Scholar]
- 6.Detterbeck, F. C. et al. The International Association for the Study of Lung Cancer lung cancer staging project: proposals for revision of the classification of residual tumor after resection for the forthcoming (ninth) edition of the TNM Classification of Lung Cancer. J. Thorac. Oncol.19, 1052–1072 (2024). [DOI] [PubMed] [Google Scholar]
- 7.Zeng, H. et al. Changing cancer survival in China during 2003–15: a pooled analysis of 17 population-based cancer registries. Lancet Glob. Health6, 555–567 (2018). [DOI] [PubMed] [Google Scholar]
- 8.Zeng, H. et al. Disparities in stage at diagnosis for five common cancers in China: a multicentre, hospital-based, observational study. Lancet Public Health6, 877–887 (2021). [DOI] [PubMed] [Google Scholar]
- 9.Oudkerk, M., Liu, S., Heuvelmans, M. A., Walter, J. E. & Field, J. K. Lung cancer LDCT screening and mortality reduction—evidence, pitfalls and future perspectives. Nat. Rev. Clin. Oncol.18, 135–151 (2021). [DOI] [PubMed] [Google Scholar]
- 10.Aberle, D. R. et al. Reduced lung-cancer mortality with low-dose computed tomographic screening. N. Engl. J. Med.365, 395–409 (2011). [DOI] [PMC free article] [PubMed] [Google Scholar]
- 11.de Koning, H. J. et al. Reduced lung-cancer mortality with volume CT screening in a randomized trial. N. Engl. J. Med.382, 503–513 (2020). [DOI] [PubMed] [Google Scholar]
- 12.Li, N. et al. One-off low-dose CT for lung cancer screening in China: a multicentre, population-based, prospective cohort study. Lancet Respir. Med.10, 378–391 (2022). [DOI] [PubMed] [Google Scholar]
- 13.Gould, M. K. et al. Recent trends in the identification of incidental pulmonary nodules. Am. J. Respir. Crit. Care Med.192, 1208–1214 (2015). [DOI] [PubMed] [Google Scholar]
- 14.Hendrix, W. et al. Trends in the incidence of pulmonary nodules in chest computed tomography: 10-year results from two Dutch hospitals. Eur. Radio.33, 8279–8288 (2023). [DOI] [PMC free article] [PubMed] [Google Scholar]
- 15.Pinsky, P. F. et al. Performance of Lung-RADS in the National Lung Screening Trial: a retrospective assessment. Ann. Intern. Med.162, 485–491 (2015). [DOI] [PMC free article] [PubMed] [Google Scholar]
- 16.Gould, M. K. et al. Evaluation of individuals with pulmonary nodules: when is it lung cancer? Diagnosis and management of lung cancer, 3rd ed: American College of Chest Physicians evidence-based clinical practice guidelines. Chest143, e93S–e120S (2013). [DOI] [PMC free article] [PubMed] [Google Scholar]
- 17.Baldwin, D. R. & Callister, M. E. The British Thoracic Society guidelines on the investigation and management of pulmonary nodules. Thorax70, 794–798 (2015). [DOI] [PubMed] [Google Scholar]
- 18.MacMahon, H. et al. Guidelines for management of incidental pulmonary nodules detected on CT images: from the Fleischner Society 2017. Radiology284, 228–243 (2017). [DOI] [PubMed] [Google Scholar]
- 19.Kastner, J. et al. Lung-RADS version 1.0 versus Lung-RADS version 1.1: comparison of categories using nodules from the National Lung Screening Trial. Radiology300, 199–206 (2021). [DOI] [PubMed] [Google Scholar]
- 20.Bai, C. et al. Evaluation of pulmonary nodules: clinical practice consensus guidelines for Asia. Chest150, 877–893 (2016). [DOI] [PubMed] [Google Scholar]
- 21.Azour, L., Ko, J. P., Naidich, D. P. & Moore, W. H. Shades of gray: subsolid nodule considerations and management. Chest159, 2072–2089 (2021). [DOI] [PMC free article] [PubMed] [Google Scholar]
- 22.American College of Radiology. Lung-RADS 2022. https://www.acr.org/Clinical-Resources/Reporting-and-Data-Systems/Lung-Rads (2022).
- 23.Swensen, S. J., Silverstein, M. D., Ilstrup, D. M., Schleck, C. D. & Edell, E. S. The probability of malignancy in solitary pulmonary nodules. Application to small radiologically indeterminate nodules. Arch. Intern. Med.157, 849–855 (1997). [PubMed] [Google Scholar]
- 24.McWilliams, A. et al. Probability of cancer in pulmonary nodules detected on first screening CT. N. Engl. J. Med.369, 910–919 (2013). [DOI] [PMC free article] [PubMed] [Google Scholar]
- 25.Song, F. et al. Comparison of different classification systems for pulmonary nodules: a multicenter retrospective study in China. Cancer Imag.24, 15 (2024). [DOI] [PMC free article] [PubMed] [Google Scholar]
- 26.Chen, K. et al. Development and validation of machine learning-based model for the prediction of malignancy in multiple pulmonary nodules: analysis from multicentric cohorts. Clin. Cancer Res.27, 2255–2265 (2021). [DOI] [PubMed] [Google Scholar]
- 27.Esteva, A. et al. Dermatologist-level classification of skin cancer with deep neural networks. Nature542, 115–118 (2017). [DOI] [PMC free article] [PubMed] [Google Scholar]
- 28.Zhang, K. et al. Clinically applicable AI system for accurate diagnosis, quantitative measurements, and prognosis of COVID-19 pneumonia using computed tomography. Cell181, 1423–1433 (2020). [DOI] [PMC free article] [PubMed] [Google Scholar]
- 29.Shao, J. et al. A multimodal integration pipeline for accurate diagnosis, pathogen identification, and prognosis prediction of pulmonary infections. Innovation5, 100648 (2024). [DOI] [PMC free article] [PubMed] [Google Scholar]
- 30.Wang, C. et al. Development and validation of an abnormality-derived deep-learning diagnostic system for major respiratory diseases. NPJ Digit. Med.5, 124 (2022). [DOI] [PMC free article] [PubMed] [Google Scholar]
- 31.Chen, R. J. et al. Pan-cancer integrative histology-genomic analysis via multimodal deep learning. Cancer Cell40, 865–878 (2022). [DOI] [PMC free article] [PubMed] [Google Scholar]
- 32.Xu, X., Wang, C., Guo, J., Yang, L. & Yi, Z. DeepLN: a framework for automatic lung nodule detection using multi-resolution CT screening images. Knowl. Based Syst.189, 105128 (2019). [Google Scholar]
- 33.Kann, B. H., Hosny, A. & Aerts, H. Artificial intelligence for clinical oncology. Cancer Cell39, 916–927 (2021). [DOI] [PMC free article] [PubMed] [Google Scholar]
- 34.Shao, J. et al. Novel tools for early diagnosis and precision treatment based on artificial intelligence. Chin. Med J. Pulm. Crit. Care Med.1, 148–160 (2023). [DOI] [PMC free article] [PubMed] [Google Scholar]
- 35.Ardila, D. et al. End-to-end lung cancer screening with three-dimensional deep learning on low-dose chest computed tomography. Nat. Med.25, 954–961 (2019). [DOI] [PubMed] [Google Scholar]
- 36.Baldwin, D. R. et al. External validation of a convolutional neural network artificial intelligence tool to predict malignancy in pulmonary nodules. Thorax75, 306–312 (2020). [DOI] [PMC free article] [PubMed] [Google Scholar]
- 37.Venkadesh, K. V. et al. Deep learning for malignancy risk estimation of pulmonary nodules detected at low-dose screening CT. Radiology300, 438–447 (2021). [DOI] [PubMed] [Google Scholar]
- 38.Massion, P. P. et al. Assessing the accuracy of a deep learning method to risk stratify indeterminate pulmonary nodules. Am. J. Respir. Crit. Care Med.202, 241–249 (2020). [DOI] [PMC free article] [PubMed] [Google Scholar]
- 39.Shi, F. et al. Semi-supervised deep transfer learning for benign-malignant diagnosis of pulmonary nodules in chest CT images. IEEE Trans. Med. Imag.41, 771–781 (2022). [DOI] [PubMed] [Google Scholar]
- 40.Chen, R. J. et al. Algorithmic fairness in artificial intelligence for medicine and healthcare. Nat. Biomed. Eng.7, 719–742 (2023). [DOI] [PMC free article] [PubMed] [Google Scholar]
- 41.Chen, L. et al. An artificial-intelligence lung imaging analysis system (ALIAS) for population-based nodule computing in CT scans. Comput. Med. Imag. Graph.89, 101899 (2021). [DOI] [PubMed] [Google Scholar]
- 42.Ohno, Y. et al. Differentiation of benign from malignant pulmonary nodules by using a convolutional neural network to determine volume change at chest CT. Radiology296, 432–443 (2020). [DOI] [PubMed] [Google Scholar]
- 43.Kakinuma, R. et al. Natural history of pulmonary subsolid nodules: a prospective multicenter study. J. Thorac. Oncol.11, 1012–1028 (2016). [DOI] [PubMed] [Google Scholar]
- 44.Li, D. et al. Ten-year follow-up results of pure ground-glass opacity-featured lung adenocarcinomas after surgery. Ann. Thorac. Surg.116, 230–237 (2023). [DOI] [PubMed] [Google Scholar]
- 45.Chen, H. et al. The 2023 American Association for Thoracic Surgery (AATS) expert consensus document: management of subsolid lung nodules. J. Thorac. Cardiovasc. Surg. (2024). [DOI] [PubMed]
- 46.Azour, L. et al. Subsolid nodules: significance and current understanding. Clin. Chest Med.45, 263–277 (2024). [DOI] [PubMed] [Google Scholar]
- 47.Travis, W. D. et al. The IASLC Lung Cancer Staging Project: proposals for coding T categories for subsolid nodules and assessment of tumor size in part-solid tumors in the forthcoming eighth edition of the TNM Classification of Lung Cancer. J. Thorac. Oncol.11, 1204–1223 (2016). [DOI] [PubMed] [Google Scholar]
- 48.Lipkova, J. et al. Artificial intelligence for multimodal data integration in oncology. Cancer Cell40, 1095–1110 (2022). [DOI] [PMC free article] [PubMed] [Google Scholar]
- 49.Shao, J., Ma, J., Zhang, Q., Li, W. & Wang, C. Predicting gene mutation status via artificial intelligence technologies based on multimodal integration (MMI) to advance precision oncology. Semin. Cancer Biol.91, 1–15 (2023). [DOI] [PubMed] [Google Scholar]
- 50.Boehm, K. M., Khosravi, P., Vanguri, R., Gao, J. & Shah, S. P. Harnessing multimodal data integration to advance precision oncology. Nat. Rev. Cancer22, 114–126 (2022). [DOI] [PMC free article] [PubMed] [Google Scholar]
- 51.Zhou, H. Y. et al. A transformer-based representation-learning model with unified processing of multimodal input for clinical diagnostics. Nat. Biomed. Eng.7, 743–755 (2023). [DOI] [PubMed] [Google Scholar]
- 52.Prosper, A. E., Kammer, M. N., Maldonado, F., Aberle, D. R. & Hsu, W. Expanding role of advanced image analysis in CT-detected indeterminate pulmonary nodules and early lung cancer characterization. Radiology309, e222904 (2023). [DOI] [PMC free article] [PubMed] [Google Scholar]
- 53.Zhou, Y. et al. The application of artificial intelligence and radiomics in lung cancer. Precis. Clin. Med.3, 214–227 (2020). [DOI] [PMC free article] [PubMed] [Google Scholar]
- 54.Wang, F. et al. Risk-stratified approach for never- and ever-smokers in lung cancer screening: a prospective cohort study in China. Am. J. Respir. Crit. Care Med.207, 77–88 (2023). [DOI] [PubMed] [Google Scholar]
- 55.Krist, A. H. et al. Screening for lung cancer: US Preventive Services Task Force recommendation statement. JAMA325, 962–970 (2021). [DOI] [PubMed] [Google Scholar]
- 56.Park, S. et al. Volume doubling times of lung adenocarcinomas: correlation with predominant histologic subtypes and prognosis. Radiology295, 703–712 (2020). [DOI] [PubMed] [Google Scholar]
- 57.Venkadesh, K. V. et al. Prior CT improves deep learning for malignancy risk estimation of screening-detected pulmonary nodules. Radiology308, e223308 (2023). [DOI] [PubMed] [Google Scholar]
- 58.Cao, W. et al. Uptake of lung cancer screening with low-dose computed tomography in China: a multi-centre population-based study. eClinicalMedicine52, 101594 (2022). [DOI] [PMC free article] [PubMed] [Google Scholar]
- 59.Shao, J. et al. Deep learning empowers lung cancer screening based on mobile low-dose computed tomography in resource-constrained sites. Front. Biosci.27, 212 (2022). [DOI] [PubMed] [Google Scholar]
- 60.Dhoot, R. et al. Implementing a mobile diagnostic unit to increase access to imaging and laboratory services in western Kenya. BMJ Glob. Health3, 000947 (2018). [DOI] [PMC free article] [PubMed] [Google Scholar]
- 61.Bartlett, E. C. et al. Baseline results of the west London lung cancer screening pilot study—impact of mobile scanners and dual risk model utilisation. Lung Cancer148, 12–19 (2020). [DOI] [PubMed] [Google Scholar]
- 62.Chiarantano, R. S. et al. Implementation of an integrated lung cancer prevention and screening program using a mobile computed tomography (CT) unit in Brazil. Cancer Control29, 10732748221121385 (2022). [DOI] [PMC free article] [PubMed] [Google Scholar]
- 63.Wang, C. et al. Persistent increase and improved survival of stage I lung cancer based on a large-scale real-world sample of 26,226 cases. Chin. Med J. (Engl.)136, 1937–1948 (2023). [DOI] [PMC free article] [PubMed] [Google Scholar]
- 64.Farjah, F. et al. Association of the intensity of diagnostic evaluation with outcomes in incidentally detected lung nodules. JAMA Intern. Med.181, 480–489 (2021). [DOI] [PMC free article] [PubMed] [Google Scholar]
- 65.Yankelevitz, D. F., Yip, R. & Henschke, C. I. Impact of duration of diagnostic workup on prognosis for early lung cancer. J. Thorac. Oncol.18, 527–537 (2023). [DOI] [PubMed] [Google Scholar]
- 66.Meyer, M. et al. Management of progressive pulmonary nodules found during and outside of CT lung cancer screening studies. J. Thorac. Oncol.12, 1755–1765 (2017). [DOI] [PubMed] [Google Scholar]
- 67.Crosby, D. et al. Early detection of cancer. Science375, eaay9040 (2022). [DOI] [PubMed] [Google Scholar]
- 68.Chabon, J. J. et al. Integrating genomic features for non-invasive early lung cancer detection. Nature580, 245–251 (2020). [DOI] [PMC free article] [PubMed] [Google Scholar]
- 69.He, J. et al. Accurate classification of pulmonary nodules by a combined model of clinical, imaging, and cell-free DNA methylation biomarkers: a model development and external validation study. Lancet Digit. Health5, 647–656 (2023). [DOI] [PubMed] [Google Scholar]
- 70.Mazzone, P. J. et al. Clinical validation of a cell-free DNA fragmentome assay for augmentation of lung cancer early detection. Cancer Discov. (2024). [DOI] [PMC free article] [PubMed]
- 71.Sidorenkov, G. et al. Multi-source data approach for personalized outcome prediction in lung cancer screening: update from the NELSON trial. Eur. J. Epidemiol.38, 445–454 (2023). [DOI] [PMC free article] [PubMed] [Google Scholar]
- 72.King, G. & Zeng, L. Logistic regression in rare events data. Politic. Anal.9, 137–163 (2001). [Google Scholar]
- 73.Zhang, R. et al. Deep learning for malignancy risk estimation of incidental sub-centimeter pulmonary nodules on CT images. Eur. Radio.34, 4218–4229 (2024). [DOI] [PubMed] [Google Scholar]
- 74.Wang, C. et al. Deep learning for predicting subtype classification and survival of lung adenocarcinoma on computed tomography. Transl. Oncol.14, 101141 (2021). [DOI] [PMC free article] [PubMed] [Google Scholar]
- 75.Pan, Z. et al. Predicting invasiveness of lung adenocarcinoma at chest CT with deep learning ternary classification models. Radiology311, e232057 (2024). [DOI] [PubMed] [Google Scholar]
- 76.Ouyang, X. et al. Dual-sampling attention network for diagnosis of COVID-19 from community acquired pneumonia. IEEE Trans. Med. Imag.39, 2595–2605 (2020). [DOI] [PubMed] [Google Scholar]
- 77.Mehrara, E., Forssell-Aronsson, E., Ahlman, H. & Bernhardt, P. Specific growth rate versus doubling time for quantitative characterization of tumor growth rate. Cancer Res.67, 3970–3975 (2007). [DOI] [PubMed] [Google Scholar]
- 78.Shi, F. et al. Deep learning empowered volume delineation of whole-body organs-at-risk for accelerated radiotherapy. Nat. Commun.13, 6566 (2022). [DOI] [PMC free article] [PubMed] [Google Scholar]
Associated Data
This section collects any data citations, data availability statements, or supplementary materials included in this article.
Supplementary Materials
Supplementary Tables 1–9.
Data Availability Statement
The clinical data for this study were collected with the approval of the ethics committee and are subject to restrictions for this research. No publicly available datasets were used in this study. De-identified tabular data are strictly for noncommercial academic research and necessitate a formal agreement on data usage. Al requests complying with legal and ethical requirements for data use will be granted. Data requests may be made to the corresponding author (Weimin Li, weimi003@scu.edu.cn). Requests will be processed within 2 months.
The code is available on Github (https://github.com/simonsf/C-Lung-RADS).


