Abstract
Lung-resident macrophages, which include alveolar macrophages and interstitial macrophages (IMs), exhibit a high degree of diversity, generally attributed to different activation states, and often complicated by the influx of monocytes into the pool of tissue-resident macrophages. To gain a deeper insight into the functional diversity of IMs, here we perform comprehensive transcriptional profiling of resident IMs and reveal ten distinct chemokine-expressing IM subsets at steady state and during inflammation. Similar IM subsets that exhibited coordinated chemokine signatures and differentially expressed genes were observed across various tissues and species, indicating conserved specialized functional roles. Other macrophage types shared specific IM chemokine profiles, while also presenting their own unique chemokine signatures. Depletion of CD206hi IMs in Pf4creR26EYFP+DTR and Pf4creR26EYFPCx3cr1DTR mice led to diminished inflammatory cell recruitment, reduced tertiary lymphoid structure formation and fewer germinal center B cells in models of allergen- and infection-driven inflammation. These observations highlight the specialized roles of IMs, defined by their coordinated chemokine production, in regulating immune cell influx and organizing tertiary lymphoid tissue architecture.
The lungs harbor two distinct types of tissue-resident macrophages, alveolar macrophages (AMs) and IMs, which play critical roles in maintaining homeostasis, metabolism and tissue repair, while also functioning as sentinel phagocytic immune cells1,2. AMs serve as the first line of defense in the alveoli and airways and lung IMs act as gatekeepers of the vasculature and lung interstitium2–4. During inflammation, monocytes recruited to the lungs become part of the lung macrophage pool, known as recruited macrophages (recMacs) and exhibit their own unique transcriptional signature and function2,5,6. In contrast to AMs and recMacs, little is known about the role of IMs at steady state and in various inflammatory lung diseases6–9.
Lung IMs are distinguished by their expression of MerTK, CD64, F4/80 and CD11b. Based on the intensity of CD206 (encoded by the Mrc1 gene) IMs can be categorized into two primary subsets. CD206hi IMs also express CD163 and Folr2, while showing low CX3CR1 levels, whereas CD206lo IMs express CD11c and MHC II and show higher expression of CX3CR1 (refs. 10–13). Most lung IMs reside in the interstitial space around the bronchovascular bundle, with a few found in the airspace and alveolar interstitium9,14. IMs closely interact with non-hematopoietic cells such as neurons, lymphatic vessels and blood vessels, suggesting continuous communication and potential macrophage specialization. IMs are thought to provide essential trophic factors supporting processes such as angiogenesis, neurogenesis and organ development11,15–22; however, studies in mice lacking pulmonary IMs suggest additional functions beyond development and interactions with non-hematopoietic cells18. Furthermore, IMs are not exclusive to the lung but are distributed throughout the body with overlapping transcriptional profiles across multiple organs, implying a conserved and specialized subtissular function regardless of their specific organ location10,11.
Here we investigated the heterogeneity and functions of lung IMs at steady state and during inflammation. Single-cell RNA sequencing (scRNA-seq) performed on enriched IMs, after excluding recent recMacs and neighboring AMs, yielded a comprehensive dataset of naive and activated pulmonary IMs. Inclusion of macrophage data from the airspace, pleural cavity, skin and heart allowed us to delineate and characterize ten conserved chemokine signatures prevalent across different organ-specific IM populations. These signatures were also found in other tissue-resident macrophages, like AMs and Langerhans cells, along with unique chemokine signatures of their own. Based on the observation that all mouse IMs expressed Pf4 (CXCL4), we conditionally depleted CD206hi IMs, targeting four chemokine-expressing IM subsets, and showed that these IMs orchestrated the influx of immune cells during inflammation and organized tertiary lymphoid structures in both allergen and microbial infection models.
Results
Tissue-resident IMs are distinct from recMac
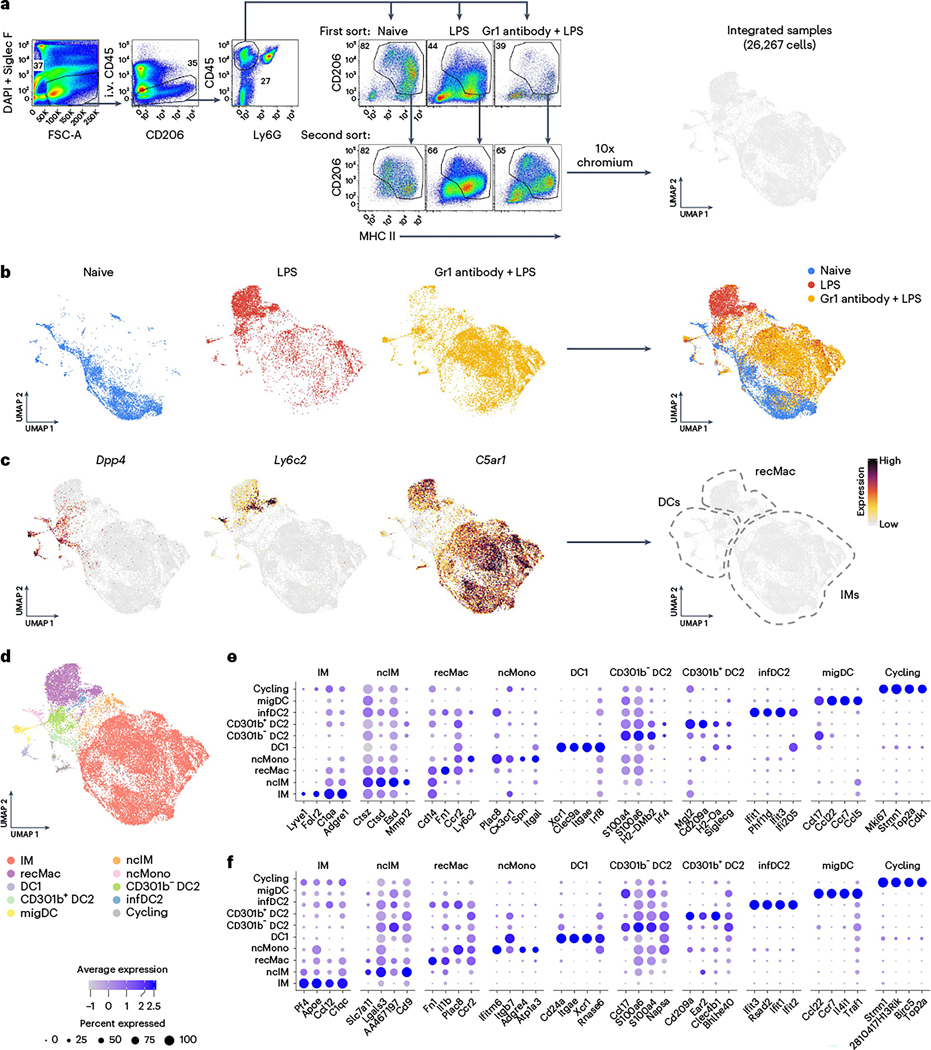
To investigate the functional heterogeneity of IMs under steady-state and inflammatory conditions, CD45+CD11b+CD206lo-hi IMs (hereafter, IMs) were isolated from C57BL/6 naive mice and mice that received one dose of lipopolysaccharide (LPS) intranasally (Fig. 1a). Twenty-four hours after LPS treatment, Ly6c2+C5ar1+ recMacs (hereafter, recMacs) represented the dominant myeloid cell population in the lungs, outnumbering IMs (Fig. 1b). To ensure sufficient capture of LPS-activated IMs on the 10x scRNA-seq platform and to prevent contamination with recMacs, we administered Gr1 antibodies intraperitoneally just before LPS treatment to deplete Ly6C+ monocytes in one group of mice. A total of 26,267 cells were obtained and an integrated Uniform Manifold Approximation and Projection (UMAP) visualization was performed on cells from naive, LPS-treated and Gr1 antibody + LPS-treated mice (Fig. 1a,b). Because a few other myeloid cell types were captured by the scRNA-seq, we used Dpp4 (CD26) and C5ar1 (CD88) to discriminate CD88+ monocyte/macrophages from CD26+ conventional dendritic cells (cDCs) (Fig. 1c)23–25. Within the integrated UMAP, the Ly6c2+C5ar1+ mononuclear phagocyte cluster was identified as recMacs, whereas the Ly6c2−C5ar1+ cluster was identified as IMs (Fig. 1c). After the identification of recMacs, IMs and dendritic cells (DCs), a higher-resolution analysis was performed. Ten clusters were identified using curated gene markers and top differentially expressed genes (DEGs): IMs (C1q, Pf4 and Apoe), nonclassical IMs (lower C5ar1, Pf4 and C1q than IMs), recMacs (Cd14, Fn1, Ccr2 and Ly6c2), nonclassical monocytes (Plac8), cDC1 (Xcr1 and Clec9a), cDC2 (CD209a and Mgl2lo-hi, which was further subdivided into CD301b− and CD301b+ cDC2 subsets), inflammatory DC2 (infDC2; Ifit3 and Ifit2), maturing migratory DCs (migDCs; Ccr7, Ccl5, Ccl22, Il4i1 and Traf1) and cycling cells (Mki67, Stmn1, Top2a and Cdk1) (Fig. 1d–f)9,24. Thus, high-resolution analysis identified a high degree of heterogeneity in mouse lung mononuclear phagocytes.
Fig. 1 |. Tissue-resident IMs are distinct from recMacs.
a, Gating strategy for sorting of intravenous (i.v.) CD45−Siglec F−Ly6G−CD206+MHCII+ macrophages, including tissue-resident IMs and recMacs. Mice were injected i.v. with CD45 antibody 5 min before killing to exclude intravascular leukocytes. Cells were enriched with CD11b beads and sorted before scRNA-seq. UMAP illustrates 26,267 cells. b, UMAP distribution of macrophages sorted as in a from lungs of mice at steady state (naive), 24 h post-treatment with LPS (LPS) and 24 h post-treatment with Gr1 antibody + LPS. c, Feature plots showing Dpp4+ (CD26) dendritic cells (DCs), Ly6c2+C5ar1+ (CD88) recMacs and Ly6c2− IMs in UMAP. d–f, Cell type identification of IMs (C1qc+), non-classic IMs (ncIMs and Ctsz+), recMacs (Fn1+), non-classic monocytes (ncMonos and Plac8+), DC1 (Xcr1+), CD301b− DC2 (Cd209a+S100a4+S), CD301b+ DC2 (Cd209a+Mgl2+), inflammatory DC2 (infDC2 and Ifit3+), migratory DCs (migDCs and Ccr7+) and cycling cells (cycling and Mki67+) (d), based on the gene expression profiles of a selection of curated genes (e) and the top DEGs (f). DAPI, 4,6-diamidino-2-phenylindole.
IMs are classified into two distinct subsets
Based on gene and protein expression, IMs are known to be classified into two main subsets, CD206hiCD163hi IMs and CD206CloCD163lo IMs10–13. First, we confirmed whether the same IMs previously reported were present in our scRNA-seq dataset10–13. Mrc1hi IMs (hereafter, for convenience, CD206hi IMs) expressed Cd163, Folr2, Lyve1 and Timd4, with the latter two being expressed on some, but not all, CD206hi IM subsets, whereas Mrc1lo IMs (hereafter CD206lo IMs) expressed Cx3cr1, Itgax (CD11c), H2-Aa (MHC II) and Ccr2 (Fig. 2a). Additionally, all IMs expressed C1q at both the transcriptional and protein level (Fig. 2b,c). DEG and Gene Ontology (GO) analyses revealed that CD206hi IMs were associated with phagocytic pathways (Fig. 2d,e), whereas CD206lo IMs were involved in antigen processing and presentation (Fig. 2d,e and Extended Data Fig. 1)11,12. In addition, the GO analysis indicated a role for IMs in the chemotaxis of monocytes, neutrophils and eosinophils (Fig. 2e), suggesting that they had the capacity to recruit and direct leukocytes. Based on GO analysis, IMs had roles in phagocytosis, antigen presentation and immune cell recruitment.
Fig. 2 |. IMs are classified into two distinct subsets.
a, Feature plots showing the expression of Mrc1 (CD206), Cd163, Folr2, Lyve1, Timd4, Cx3cr1, Itgax (CD11c), H2-Aa (MHC II) and Ccr2 marker genes for CD206hiCD163hi IMs (CD206hi IMs) and CD206loCD163lo IMs (CD206lo IMs). b, Feature plot showing the expression of C1qc in CD206hi IMs and CD206lo IMs. c, Expression of C1q protein in total IMs (CD64+CD11bhi). Cells were gated on CD45+ myeloid cells. d, Heat map showing the expression of the top 20 DEGs in CD206hi IMs and CD206lo IMs. e, Heat map showing the enrichment of the top 20 biological process-related GO terms in CD206hi IMs and CD206lo IMs. Statistical analysis was conducted using Fisher’s exact test.
Chemokine expression reveals IM heterogeneity
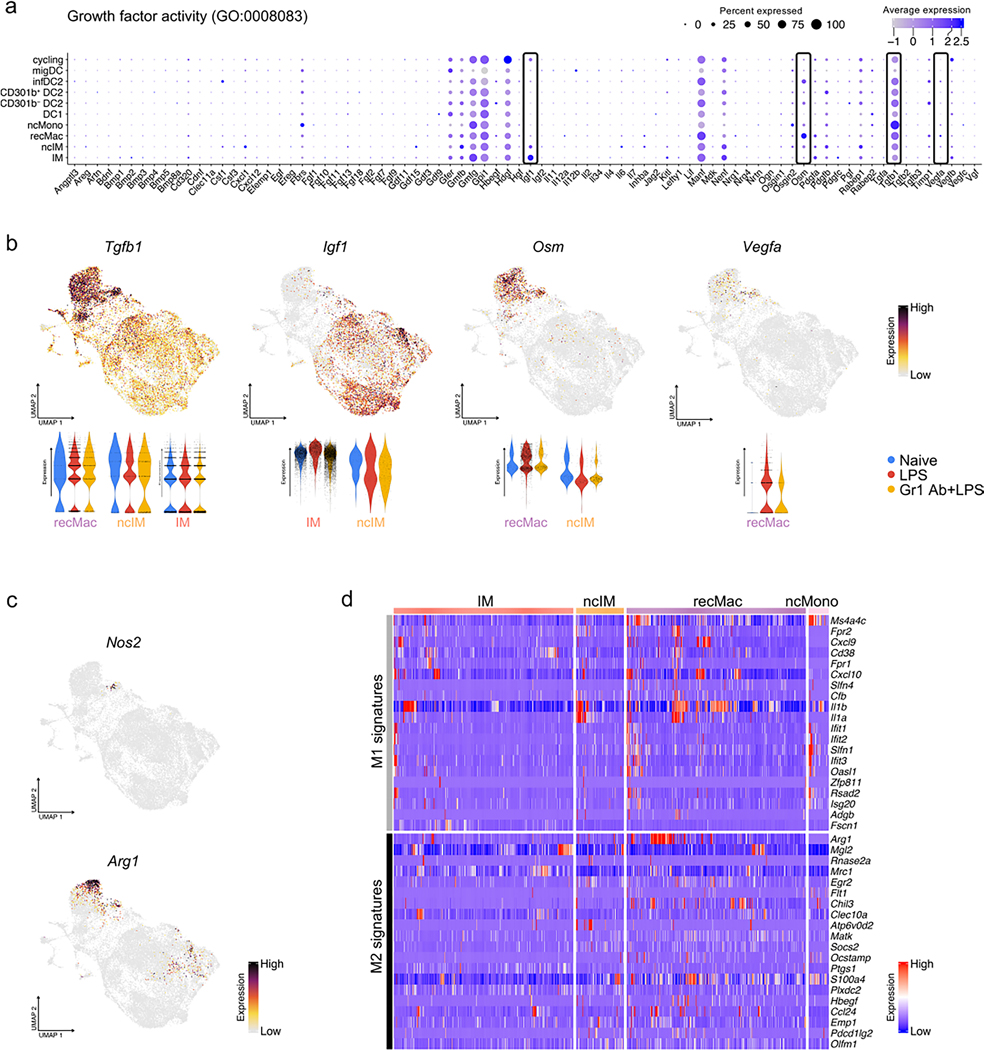
Macrophages maintain tissue homeostasis by communicating with non-hematopoietic cells through the secretion of growth factors. Given the close proximity of macrophages to various non-hematopoietic cells, such as nerves, blood vessels and lymphatic vessels, we investigated the growth factors involved in this crosstalk. We observed broad expression of the macrophage-produced fibroblast growth factors Tgfb1 and Igf1, with Igf1 being almost exclusively expressed in IMs (Extended Data Fig. 2a,b). A few other growth factors, such as Nenf and Vegfb, were also expressed by IMs, whereas the endothelial growth factors Vegfa and Osm (oncostatin M) were mainly expressed by recMacs (Extended Data Fig. 2a,b); however, we did not uncover unique growth factors expressed by IM subsets (Extended Data Fig. 2a). We also did not observe broadly coordinated expression of prototypical pro-inflammatory (M1) and anti-inflammatory (M2) genes (such as Nos2 and Arg1, respectively) in IMs (Extended Data Fig. 2c,d and Supplementary Fig. 1); however, we detected the coordinate expression of the M2 markers Retnla (Fizz1) and Clec10a (Mgl1) in steady-state CD206hi IMs (Supplementary Fig. 1), explaining reports that high expression of CD206 coincides with the expression of M2 markers such as CD163, Folr2 and Tim4 (ref. 26).
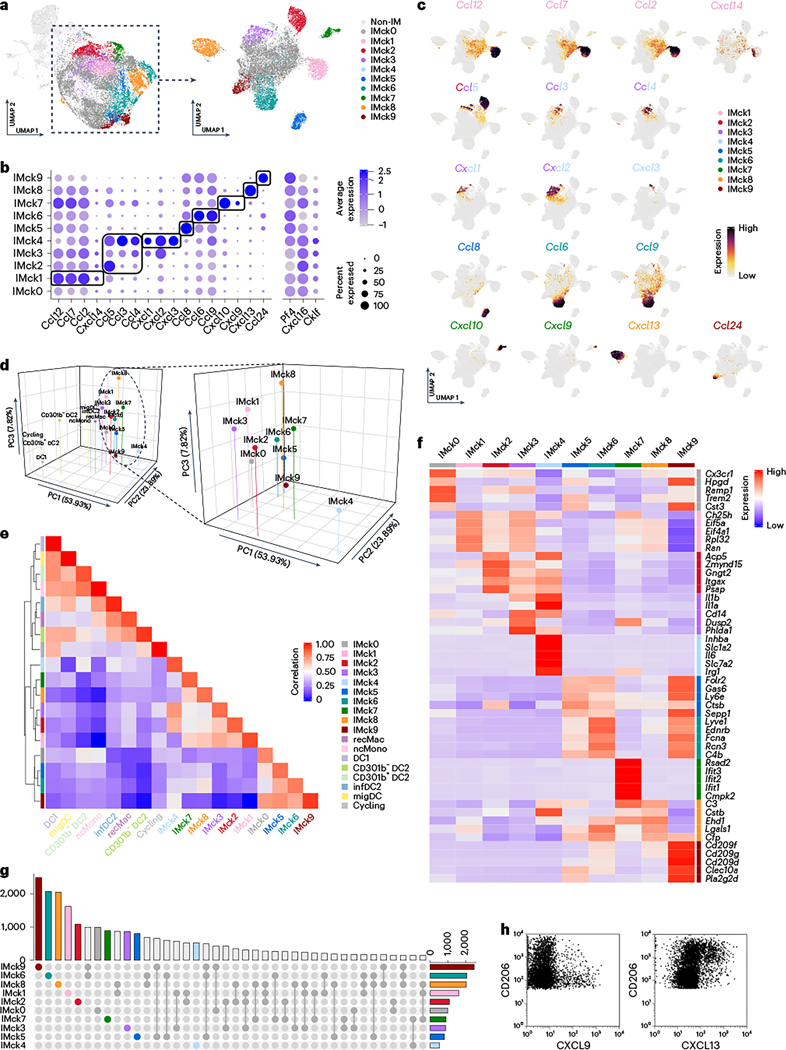
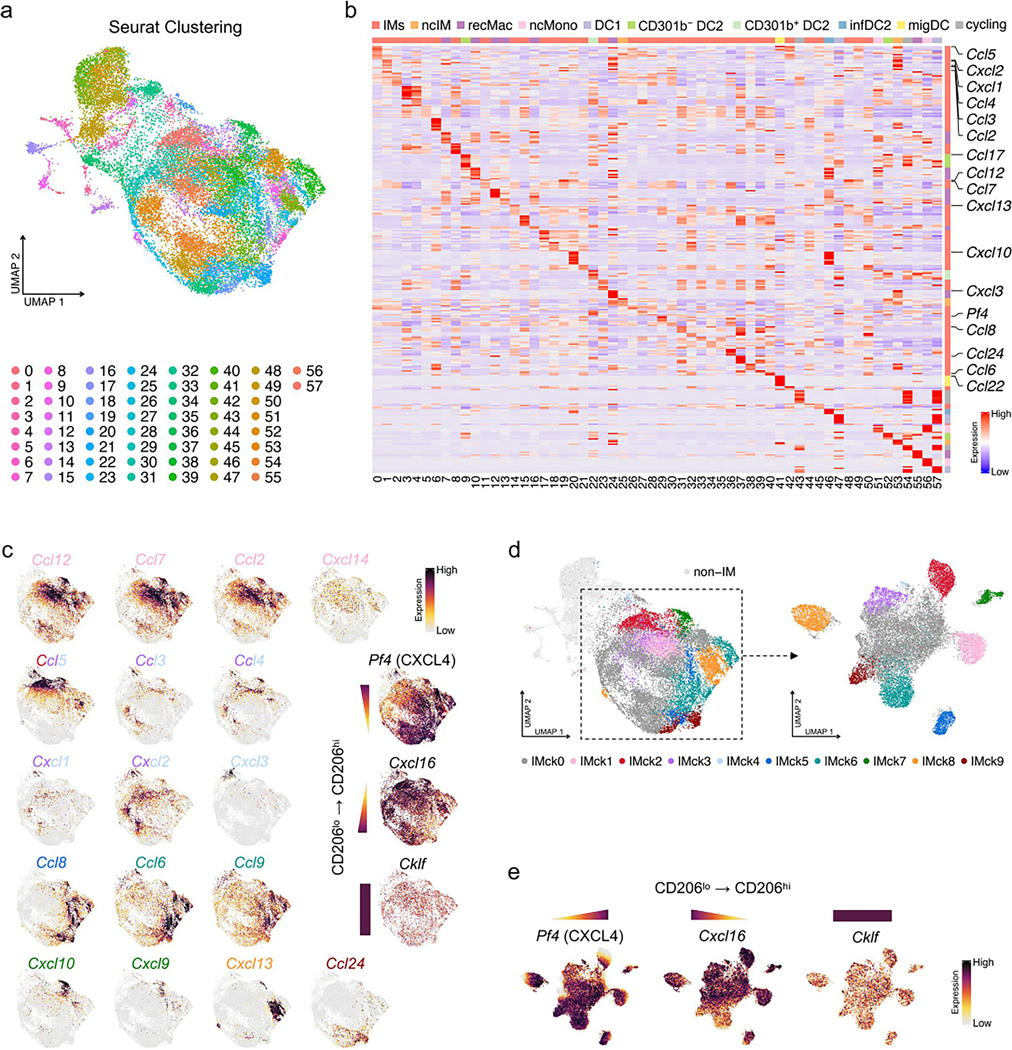
To further assess the heterogeneity of IMs, beyond high and low expression of Mrc1 (CD206), we performed high-resolution unbiased clustering analysis. This resulted in 58 clusters, 38 of which were IM clusters (Extended Data Fig. 3a,b). The subsequent DEG analysis uncovered the enrichment of distinct chemokine genes in the different IM clusters (Extended Data Fig. 3b). Inspired by this result, a lower resolution was adopted, resulting in ten chemokine-expressing IM subsets, including IMck0 (nonspecific chemokine expression), IMck1 (Ccl2, Ccl7, Ccl12 and some Cxcl14), IMck2–IMck4 (Ccl3, Ccl4, Ccl5, Cxcl1, Cxcl2 and Cxcl3), IMck5 (Ccl8), IMck6 (Ccl6 and Ccl9), IMck7 (Cxcl9 and Cxcl10), IMck8 (Cxcl13) and IMck9 (Ccl24) (Fig. 3a–c and Extended Data Fig. 3c,d). Because IMck4 expressed all the chemokines present in IMck2 and IMck3, the IMck2–IMck4 subsets were combined (Fig. 3b). While IMck9 expressing Ccl24, was mainly found in samples collected from naive mice, other chemokines such as Cxcl9 and Cxcl10 were induced by LPS exposure (Fig. 3a–c). Furthermore, the pan-chemokine genes Pf4 (CXCL4) and Cxcl16 were inversely expressed, with Pf4 being most highly expressed in CD206hi IMs and Cxcl16, a resident memory T cell chemoattractant, being most highly expressed in CD206lo IMs (Extended Data Fig. 3c), correlating with its antigen-presenting properties27. On the other hand, the pan-chemokine gene Cklf was expressed at similar levels in both CD206hi IMs and CD206lo IMs (Extended Data Fig. 3c–e).
Fig. 3 |. Chemokine expression reveals IM heterogeneity.
a, UMAP plot of IMck0–IMck9 subsets based on their respective chemokine expression profiles, within the original UMAP plot and re-clustered. b, Dot plot of chemokine gene expressions across the IMck0–IMck9 subsets. c, Feature plots detailing the expression of Ccl12, Ccl7, Ccl2, Cxcl14, Ccl5, Ccl3, Ccl4, Cxcl1, Cxcl2, Cxcl3, Ccl8, Ccl6, Ccl9, Cxcl10, Cxcl9, Cxcl13 and Ccl24 among IMck0–IMck9 subsets. d, 3D PCA plot of IMck0–IMck9 and other major cell types (recMacs, ncMonos, DC1, CD301b− DC2, CD301b+ DC2, infDC2, migDCs and cycling) showing close clustering of IMck subsets (left) and the distinct distribution and intrinsic heterogeneity among IMck subsets (right). e, Heat map showing the correlation among IMck0–IMck9 subsets and other major cell types (recMacs, ncMonos, DC1, CD301b− DC2, CD301b+ DC2, infDC2, migDCs and cycling). f, Heat map showing the expression of the top five DEGs, excluding the chemokines genes, in IMck0–IMck9 subset. g, UpSet plot showing the intersections of DEGs among IMck0–IMck9 subsets to illustrate the distinctiveness of each subset and the minimal overlap among them. h, Flow plots of the differential expression of CXCL9 and CXCL13 proteins in Siglec F−Ly6C−CD64+CD11b+CD206hi IMs (CD206hi IMs) and Siglec F−Ly6C−CD64+CD11b+CD206lo IMs (CD206lo IMs). Three independent experiments were conducted. Cells were gated on all lung IMs.
A three-dimensional (3D) principal-component analysis (PCA) plot segregated the IMck subsets from each other (Fig. 3d), indicating their unique transcriptional signatures. IMck diversity was further supported by a correlation heat map (Fig. 3e). Notably, other genes, not just chemokine genes, were differentially expressed within the IMck subsets (Fig. 3f). For example, IMck7, which was characterized by its expression of Cxcl9 and Cxcl10 (both downstream targets of interferon signaling) exhibited multiple interferon-induced genes, such as Rsad2 and Ifit3 (Fig. 3f). IMck3 and IMck4 subsets, which expressed Cxcl1 and Cxcl2 and some Cxcl3, had elevated expression of Ila and Ilb (Fig. 3f), indicative of a distinct and pronounced inflammatory phenotype. Each IM cluster contained approximately 1,000 DEGs relative to other IM subsets (Fig. 3g), suggesting a minimal overlap in their gene expression profiles. We validated the protein expression of CXLC9 and CXCL13 in the IM subsets. CXCL9 protein expression was predominantly associated with Siglec F−CD64+CD11b+Ly6C−CD206lo IMs (hereafter CD206lo IMs) (Fig. 3h), whereas CXCL13 was primarily expressed in Siglec F−CD64+CD11b+Ly6C−CD206hi IMs (hereafter CD206hi IMs) (Fig. 3h), in agreement with the gene expression data (Extended Data Fig. 3c). Thus, ten unbiasedly derived clusters of IMs were defined by the chemokine combinations that they express, along with other distinguishing genes.
The majority of IMck subsets arise from IMck0
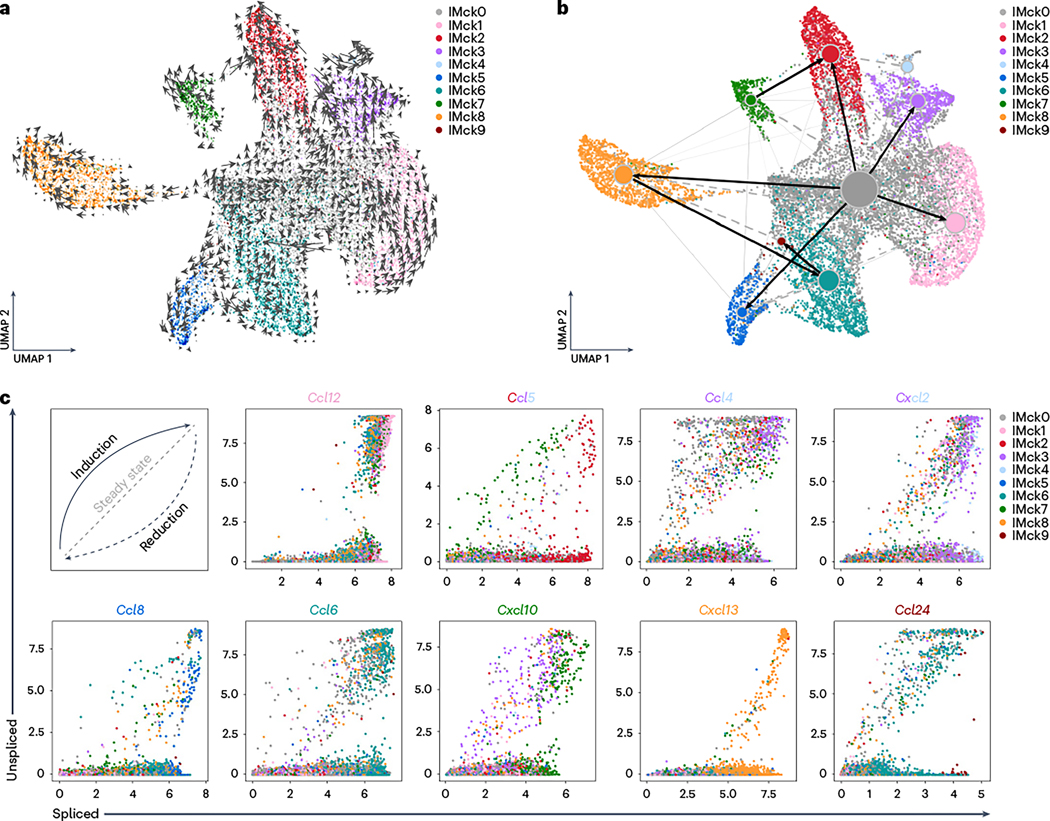
We next explored the temporal dynamics of gene expression in the IMck subsets upon LPS stimulation. RNA velocity deduced that most IMck subsets stemmed from the baseline IMck0 subset, although some subsets indicated a developmental transition toward neighboring subsets (Fig. 4a). For instance, IMck7 transitioned into IMck2 at a high velocity, as denoted by the vector’s length (Fig. 4a)28. A partition-based graph abstraction (PAGA) substantiated a predominant linkage from IMck0 to the other subsets (Fig. 4b), endorsing the temporal precedence of IMck0; however, some deviations were noted, such as the progression from IMck6 to IMck9 (Fig. 4b).
Fig. 4 |. The majority of IMck subsets arise from IMck0.
a, UMAP plot of mRNA velocity from the mLu scRNA-seq dataset using IMs of mice 24 h post-treatment with LPS. The vector field portrays the trajectory of IM differentiation following LPS stimulation. Speed is defined as the length of the velocity vector. b, PAGA connectivity analysis of LPS-stimulated IMs as in a, underlining the hierarchical connections. Stronger connections are accentuated with thicker dark lines and directional indicators are labeled. c, Phase portraits of chemokine genes across IMck0–IMck9, showing the distinct phases inherent to each subset. A diagonal dashed gray line indicates inferred steady state, a solid black arrow indicates the induction stage and a dashed black arrow indicates the repression stage.
Next, we examined chemokine gene dynamics by plotting unspliced versus spliced counts for each chemokine and found that most transcriptional shifts resonated with cluster trajectories (Fig. 4c). As such, Ccl5 displayed an enrichment of unspliced mRNA in IMck7 (induction phase) and spliced mRNA in IMck2 (reduction phase) (Fig. 4c). Similar patterns were discerned for Ccl8 (IMck6 to IMck5), Ccl6 (IMck0 to IMck6), Cxcl10 (IMck3 to IMck7) and Ccl24 (IMck6 to IMck9) (Fig. 4c). Cxcl13 consistently demonstrated a reductive phase in IMck8 (Fig. 4c), hinting at a unique regulatory mechanism. Building on the insights from RNA velocity analysis, pseudotime analysis suggested that the enrichment of chemokine genes progresses from naive to LPS-stimulated IM subsets. For instance, in CD206hi IMs, IMck0 from naive mice upregulate Cxcl13 in their transition to LPS-stimulated IMck8 (Supplementary Fig. 2). In conclusion, while some inter-cluster transitioning occurred, the majority of chemokine-expressing IM subsets originated from a quiescent IMck0 state.
Regulons govern gene expression of IMck subsets
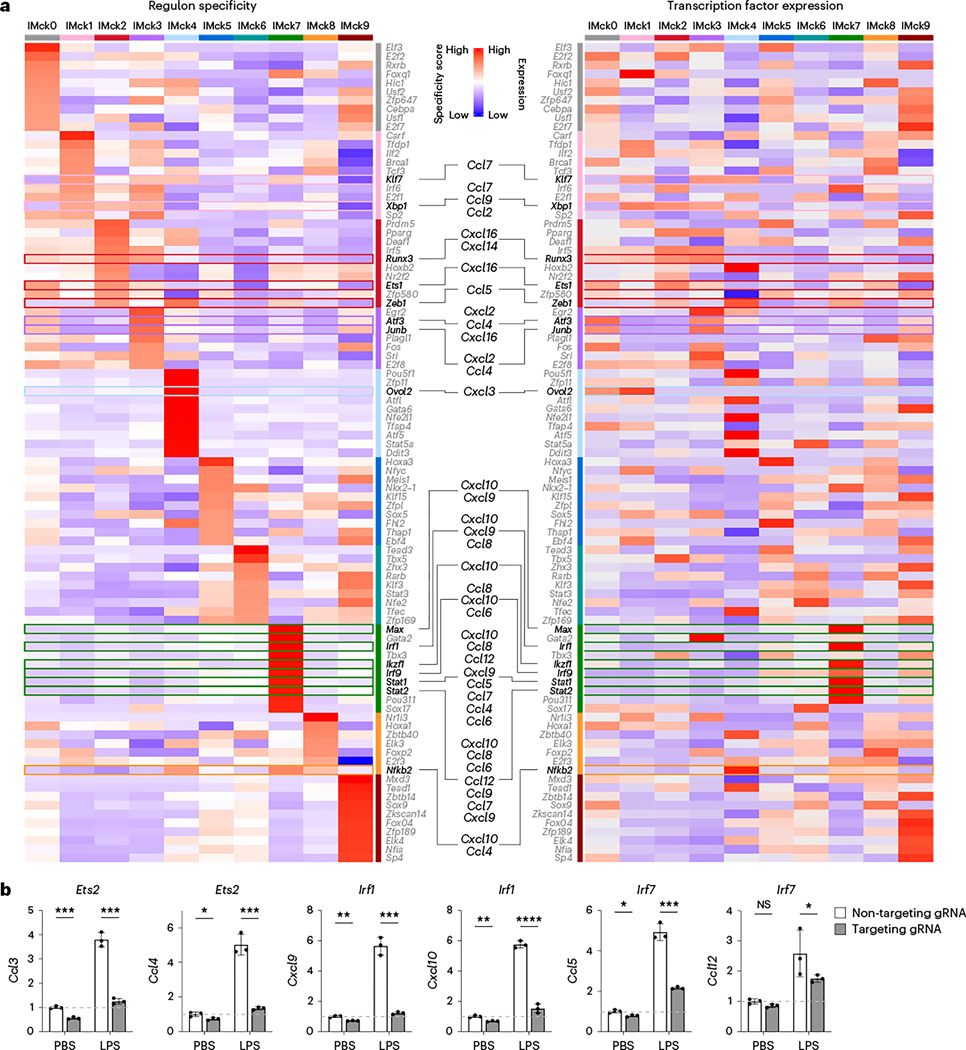
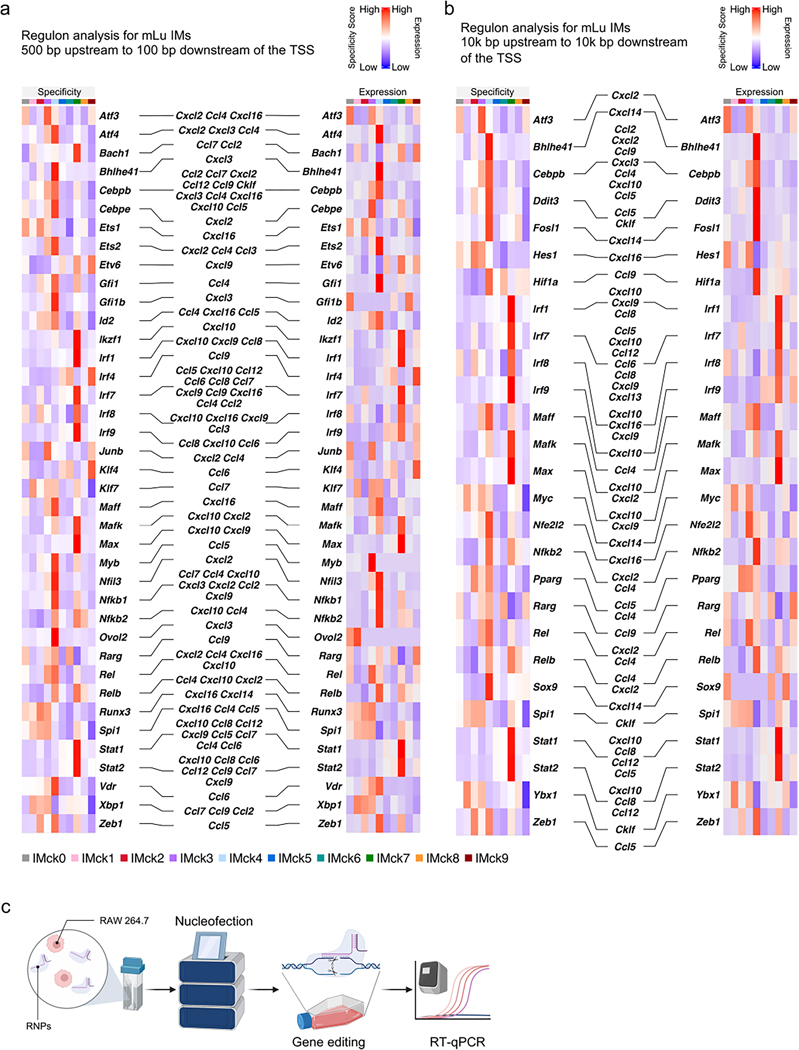
To gain insight into the transcriptional regulation of different IMck subsets, we used SCENIC (single-cell regulatory network inference and clustering) analysis, which infers the transcription factors that directly regulate gene expression profiles based on gene coexpression and cis-regulatory sequences29. SCENIC identified putative transcription factors enriched for each IMck subset, with a focus on transcription factor binding motifs located within 500 bp upstream to 100 bp downstream of the targeted gene transcription start site (TSS) (Fig. 5a) or within 10,000 bp around the TSS (Supplementary Fig. 3). The −500 to +100 bp of TSS SCENIC analysis identified Irf1 and Irf9, which were reported to regulate the transcription of Cxcl9 and Cxcl10 (ref. 30), as well as new candidate regulators, such as Klf7 (Ccl7), Xbp1 (Ccl7, Ccl9 and Ccl2), Runx3 (Cxcl16), Ets1 (Cxcl16), Zeb1 (Ccl5), Atf3 (Cxcl2, Ccl4 and Cxcl16), Junb (Cxcl2 and Ccl4), Ovol2 (Cxcl3), Max (Cxcl10 and Cxcl9), Ikzf1 (Cxcl10), Stat1 (Cxcl10, Ccl8, Ccl12, Cxcl9, Ccl5, Ccl7, Ccl4 and Ccl6), Stat2 (Cxcl10, Ccl8, Ccl6, Ccl12, Ccl9, Ccl7 and Cxcl9) and Nfkb2 (Cxcl10 and Ccl4) (Fig. 5a). The predicted transcription factors were highly expressed within the corresponding IMck subsets (Fig. 5a), which supported the specificity of the regulon analysis. Compared to the −500 to +100 bp regulon analysis, the ±10,000 bp regulon analysis resulted in fewer, but more-specific chemokine-regulating transcription factors, such as Ybx1 and Hes1 (Supplementary Fig. 3). Several chemokine-regulating transcription factors, such as Atf3, Bhlhe41, Irf1 and Irf7, were observed across both regulon analyses (Fig. 5a, Supplementary Fig. 3 and Extended Data Fig. 4a,b). The consistency between regulon specificity and expression of the transcription factor messenger RNA in the IMck subsets suggested that specific targeting of a particular transcription factor could be used to target specific IMck subsets.
Fig. 5 |. Regulons govern gene expression of IMck subsets.
a, Heat map showing the specificity of the top ten regulons enriched in each IMck subset, as identified by SCENIC analysis, with regulons that putatively regulate the indicated chemokine genes accentuated (left) and a heat map showing the transcription factors expression in the top ten enriched regulons in each IMck subset, with the transcription factors that putatively regulate the indicated chemokine genes accentuated (right). b, Relative expression of Ccl3, Ccl4, Cxcl9, Cxcl10, Ccl5 and Ccl12 in RAW 264.7 cells following gRNA-targeted knockout of the transcription factors Ets2, Irf1 and Irf7. Data were normalized to the housekeeping gene Actb and non-targeting gRNA (noncoding) nucleofected RAW 264.7 cells treated with PBS. Two independent experiments were conducted, with a technical replicate size of n = 3 biologically independent samples for each group. Data are shown as mean ± s.d. P values were calculated using two-sided Student’s t-test. *P < 0.05; **P < 0.01; ***P < 0.001; ****P < 0.0001; NS, not significant. Exact P values are listed in Source Data.
To validate the results of the SCENIC analysis, we used CRISPR-Cas9-mediated gene editing31 to knockout the expression of specific transcription factors predicted to regulate downstream chemokine genes in IMck subsets. RAW 264.7 cells, a mouse macrophage cell line, were nucleofected with a ribonucleoprotein (RNP) complex targeting different transcription factors, including Ets2, Irf1 and Irf7. A high editing efficiency (>80%) was ascertained using Sanger sequencing and TIDE software (http://shinyapps.datacurators.nl/tide/) (Extended Data Fig. 4c)31. After LPS stimulation, Ets2 KO RAW 264.7 cells exhibited simultaneous downregulation of Ccl3 and Ccl4 mRNA compared to RAW 264.7 cells treated with RNPs containing non-targeting gRNA (Fig. 5b and Extended Data Fig. 4a), consistent with published ChIP-seq data32. Similarly, deletion of Irf1 was associated with a concurrent reduction in Cxcl9 and Cxcl10 expression (Fig. 5a,b, Supplementary Fig. 3 and Extended Data Fig. 4a,b), while Irf7 deletion led to diminished expression of Ccl5 and Ccl12 in LPS-stimulated RAW 264.7 cells (Fig. 5b, Supplementary Fig. 3 and Extended Data Fig. 4a,b). These results indicate that transcription factors predicted by SCENIC analysis may regulate the induction of chemokine expression in macrophages.
IMck subsets are conserved across mouse and human tissues
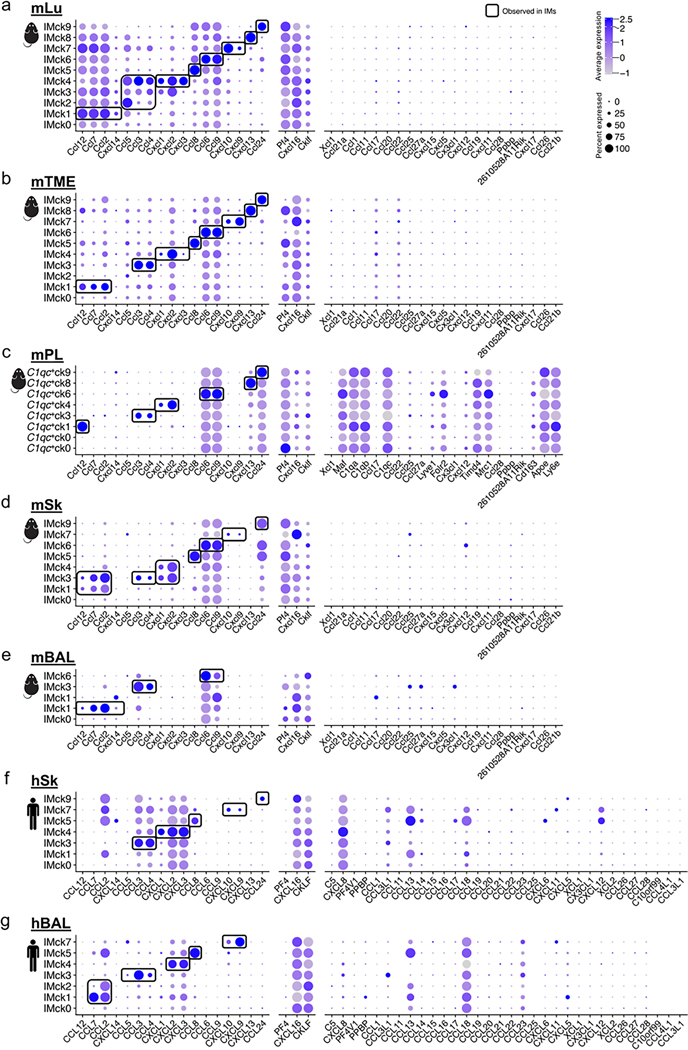
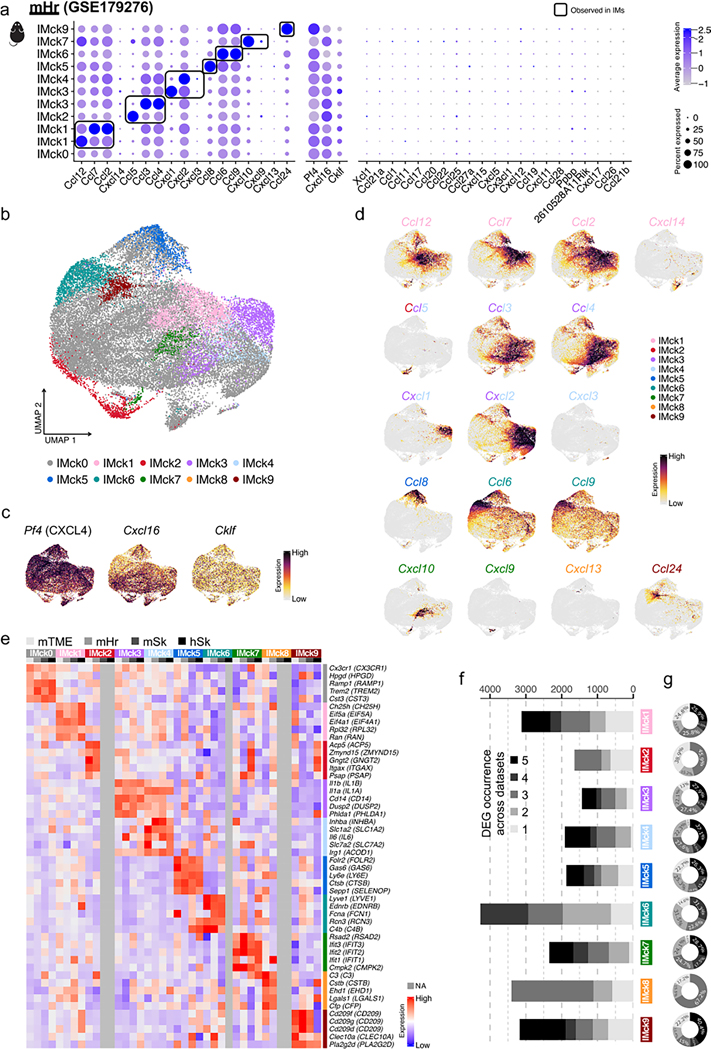
Because IMs exhibit a conserved transcriptional profile across multiple organs and species10,11, we investigated whether the mouse lung (mLu) IMck subsets could be detected in other tissues. Analysis of IMs from six in-house datasets and one publicly available dataset33, including mouse lung tumor microenvironment (mTME), heart (mHr), skin (mSk), peritoneal lavage (mPL), and bronchoalveolar lavage (mBAL), as well as human skin (hSk) and bronchoalveolar lavage (hBAL) showed that IMck subsets similar to those detected in the lung were consistently observed in mTME, mHr, mSk, and hSk (Extended Data Figs. 5 and 6). Some IM subsets, such as IMck3 and IMck6, were present in the lavaged samples, whereas others were not (mPL, mBAL and hBAL; Extended Data Fig. 5)33. To minimize perturbance and capture the true in vivo state of IMs, the in-house-generated mPL, mBAL and hBAL samples were extracted from naive C57BL/6 mice and healthy individuals, centrifuged and directly loaded onto the 10x platform. The mTME dataset was derived from B16F10 lung tumors collected on day 10 and enriched for CD45+ cells, whereas skin samples from mice and humans were obtained from naive C57BL/6 mice and non-diseased humans and enriched for CD11b+ cells. Based on the overall DEGs in mLu, we observed a broad consistency in gene expression patterns, beyond their chemokine expression, in mTME, mHr, mSk and hSk (Extended Data Fig. 6e–g), indicating that the IMck subsets were functionally conserved across organs and species.
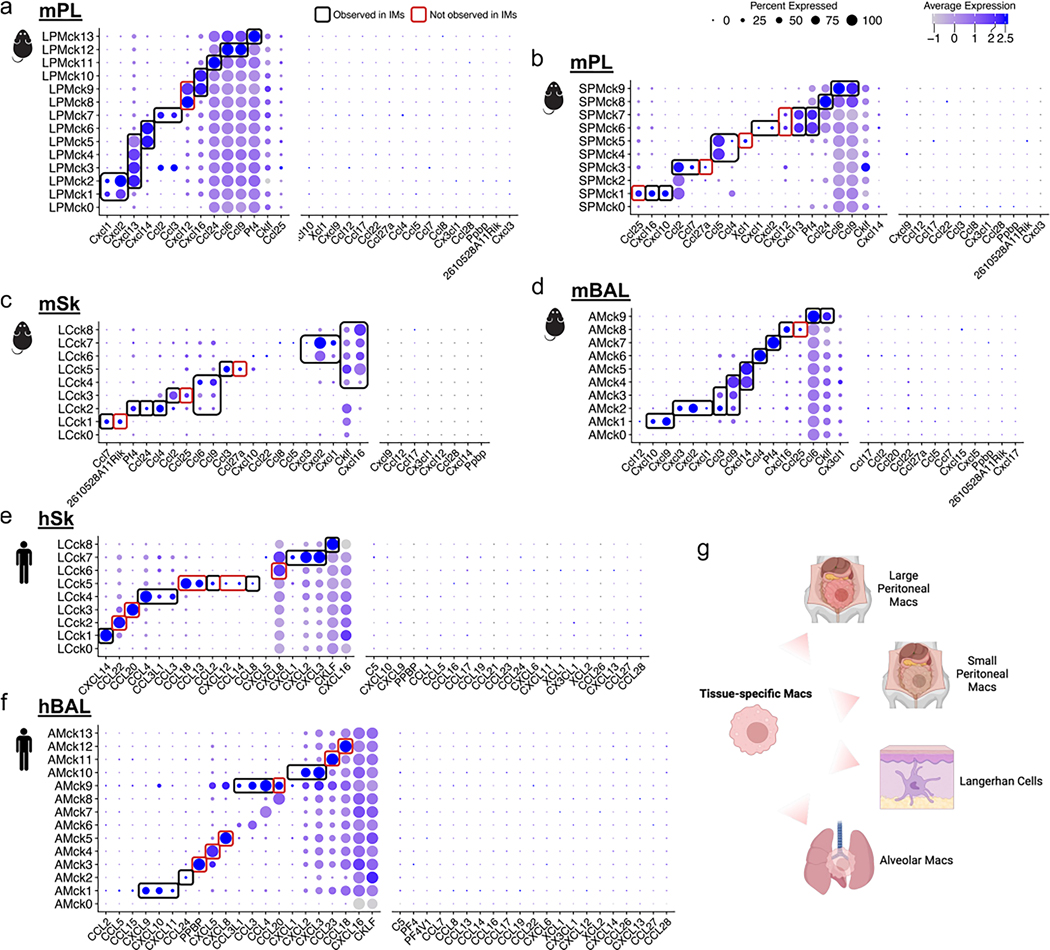
We next investigated whether other tissue-resident macrophages expressed chemokine combinations similar to the IMs, or exhibited unique chemokine combinations. An analysis of chemokine-expressing macrophages was conducted on large and small peritoneal macrophages from the mPL dataset and lung AMs and skin Langerhans cells (LCs) from the mBAL, mSk, hBAL and hSk datasets (Extended Data Fig. 7). Each of these tissue-specific macrophages expressed some of the chemokine combinations observed in the mLu IMck subsets, such as hBAL AMs expressing CXCL9 and CXCL10 (AMck1), CCL24 (AMck2) and CXCL1, CXCL2 and CXCL3 (AMck9) and hSk LCs expressing CXCL1, CXCL2 and CXCL3 (LCck7). There were also tissue-specific chemokine-expressing AMs and LC subsets such as AMck12 (CCL18) (Extended Data Fig. 7f) and LCck2 (CCL22) (Extended Data Fig. 7e). This cross-tissue and cross-species comparison indicates a coordinated regulation of chemokine production in all macrophage populations.
IMs contribute to iBALT formation
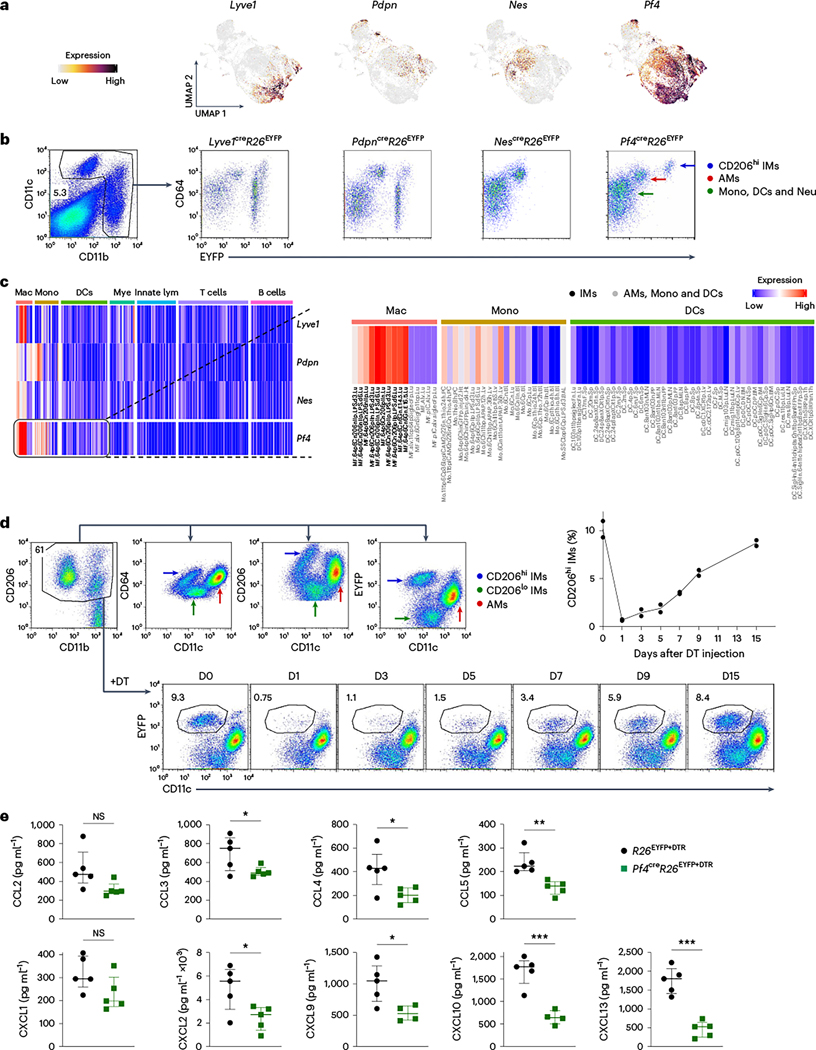
Because IM subsets expressed specific chemokine patterns, we tested whether they had specific roles in coordinating leukocyte recruitment during inflammation. To create a mouse in which we could selectively deplete IMs, we screened Lyve1cre, Pdpncre, Nescre and Pf4cre mice, as Lyve1, Pdpn, Nes and Pf4 were expressed by at least one or all IM subsets (Fig. 6a). We expected that these Cre recombinase constructs would eliminate at least one IMck subset, if not all, when crossed to Rosa26DTR (R26DTR). To determine the cell type specificity of Cre recombinase expression in Lyve1cre, Pdpncre, Nescre and Pf4cre mice, we crossed them to a R26EYFP reporter. All immune cells in Lyve1creR26EYFPand PdpncreR26EYFP mice were labeled with enhanced yellow fluorescent protein (EYFP) (Fig. 6b), indicating a lack of specificity, whereas CD206lo IMs in NescreR26EYFP mice did not express any EYFP (Fig. 6a,b). In Pf4cre R26EYFP mice, EYFP was selectively expressed in CD206hi IMs, but not in other pulmonary immune cells (Fig. 6b and Extended Data Fig. 8a). Based on the Immunological Genome Project (ImmGen, www.immgen.org )34, Pf4 showed significantly higher expression in IMs compared to AMs and other immune cell types (Fig. 6c). Although some Pf4 expression was observed in CD206lo IMs and recMacs (Fig. 6a,c), the intensity of Pf4-driven Cre expression was insufficient to remove the stop cassette in the R26EYFP mice (Fig. 6b).
Fig. 6 |. CD206hi IMs are depleted in Pf4creR26EYFP+DTR mice.
a, Feature plots depicting the expression of Lyve1, Pdpn, Nes and Pf4 in naive and LPS-stimulated IMs. b, Flow plots showing the expression of EYFP in CD11c+ or CD11b+ cells in Lyve1creR26EYFP, PdpncreR26EYFP, NescreR26EYFP and Pf4creR26EYFP mice. Cells were gated on DAPI− live cells. c, Heat maps showing the expression of Pf4 in hematopoietic cells based on ImmGen datasets34. d, Gating strategy showing the expression of EYFP in CD206hi IMs within lung tissue-resident macrophages (including CD11c+CD11blo AMs, CD11b+CD206hi IMs and CD11b+CD206lo IMs) and the time course of CD206hi IMs depletion kinetics in Pf4creR26EYFP+DTR mice following a single i.v. injection of DT. Cells were gated on DAPI−Ly6C−CD64+ lung macrophages. Three independent experiments were conducted. e, Luminex multiplex assay of CCL2, CCL3, CCL4, CCL5, CXCL1, CXCL2, CXCL9 and CXCL10 and an ELISA of CXCL13 in homogenized mouse lung tissues from R26EYFP+DTR mice and Pf4creR26EYFP+DTR mice 24 h post-treatment with DT and LPS. Two independent experiments were conducted with n = 5 biologically independent samples for each group. Data are shown as median with interquartile range. P values were calculated using a two-sided Student’s t-test. *P < 0.05; **P < 0.01; ***P < 0.001; ****P < 0.0001; NS, not significant. Exact P values are listed in Source Data. Mono, monocytes; Neu, neutrophils; Mye, myeloid cells; Mac, macrophages; lym, lymphocytes.
Next, we crossed Pf4creR26EYFP with R26DTR and adoptively transplanted bone marrow from the resulting CD45.2 Pf4creR26EYFPR26DTR mice into CD45.1 wild-type mice to minimize disruptions to non-hematopoietic cells following diphtheria toxin (DT) injection (hereafter, Pf4creR26EYFP+DTR mice). Among the tissue-resident Ly6C−CD64+ macrophages in the Pf4creR26EYFP+DTR lungs, which could be grouped into auto-fluorescent CD11c+CD11blo AMs, CD11b+CD206hi IMs and CD11b+CD206lo IMs, only the CD206hi IMs were EYFP+ (Fig. 6d). CD206hi IMs in Pf4creR26EYFP+DTR mice were depleted for up to 5 days following a single DT injection and gradually replenished by day 15, whereas CD206lo IMs, AMs and DCs remained unaffected (Fig. 6d and Extended Data Fig. 8b). We next examined whether depletion of CD206hi IMs, which targeted the IMck5, IMck6, IMck8 and IMck9 subsets, affected chemokine secretion following LPS exposure. We detected significantly less CCL3, CCL4, CCL5, CXCL2, CXCL9, CXCL10 and CXCL13 in LPS-treated Pf4creR26EYFP+DTR lungs compared to R26EYFP+DTR (Fig. 6e), indicating that the presence of IMs was required for the production of these chemokines.
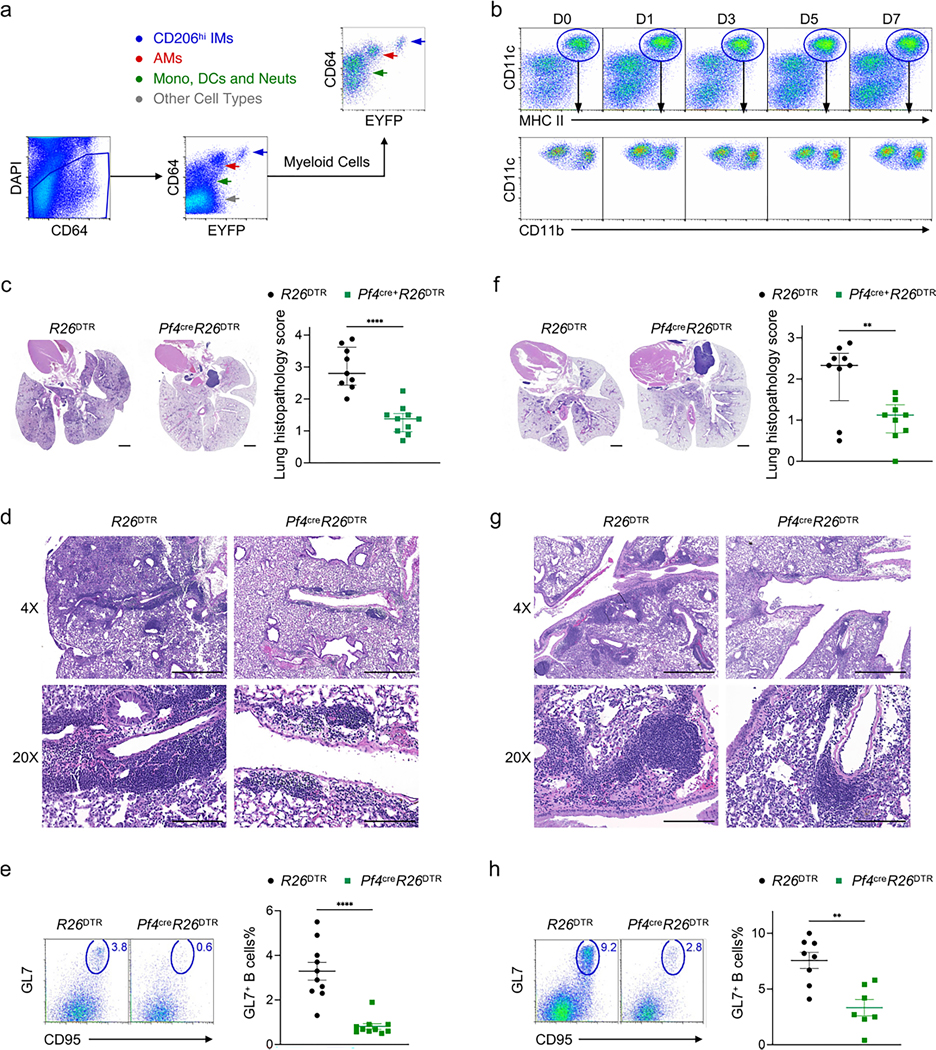
In models of allergen challenge, B cells aggregate to form tertiary lymphoid structures known as inducible bronchus-associated lymphoid tissue (iBALT) near bronchi35. These structures contain germinal centers that promote immunoglobulin class switching. B cell accumulation in iBALTs was reported to be CXCL13-dependent, with lung stromal cells identified as the primary source of CXCL13 (refs. 36,37). Because macrophages can also be a source of CXCL13 (refs. 38,39) and CD206hi IMs, specifically IMck8 expressed Cxcl13 (Fig. 6e and Extended Data Fig. 3c), we examined the role of CD206hi IMs during iBALT formation in a model of house dust mite (HDM) airway inflammation. R26EYFP+DTR and Pf4creR26EYFP+DTR mice were sensitized intranasally with 10 μg Dermatophagoides pteronyssinus extract on day 0, day 3 and day 6. On day 24, 1 day before the intranasal challenge with 25 μg D. pteronyssinus, mice were given DT. Four days post allergen challenge, DT-treated Pf4creR26EYFP+DTR mice exhibited significantly less peribronchial and perivascular leukocyte infiltration and iBALT formation compared to DT-treated R26EYFP+DTR mice (Extended Data Fig. 8c,d). DT-treated Pf4creR26EYFP+DTR mice also had significantly reduced frequency of mature GL7+ germinal center B cells in the lung compared to R26EYFP+DTR mice (Extended Data Fig. 8e). Moreover, the DT-treated Pf4creR26EYFP+DTR mice also had diminished peribronchial and perivascular infiltrates and a reduced frequency of lung GL7+ B cells on day 14 following Mycoplasma pneumoniae infection compared to DT-treated R26EYFP+DTR mice (Extended Data Fig. 8f–h).
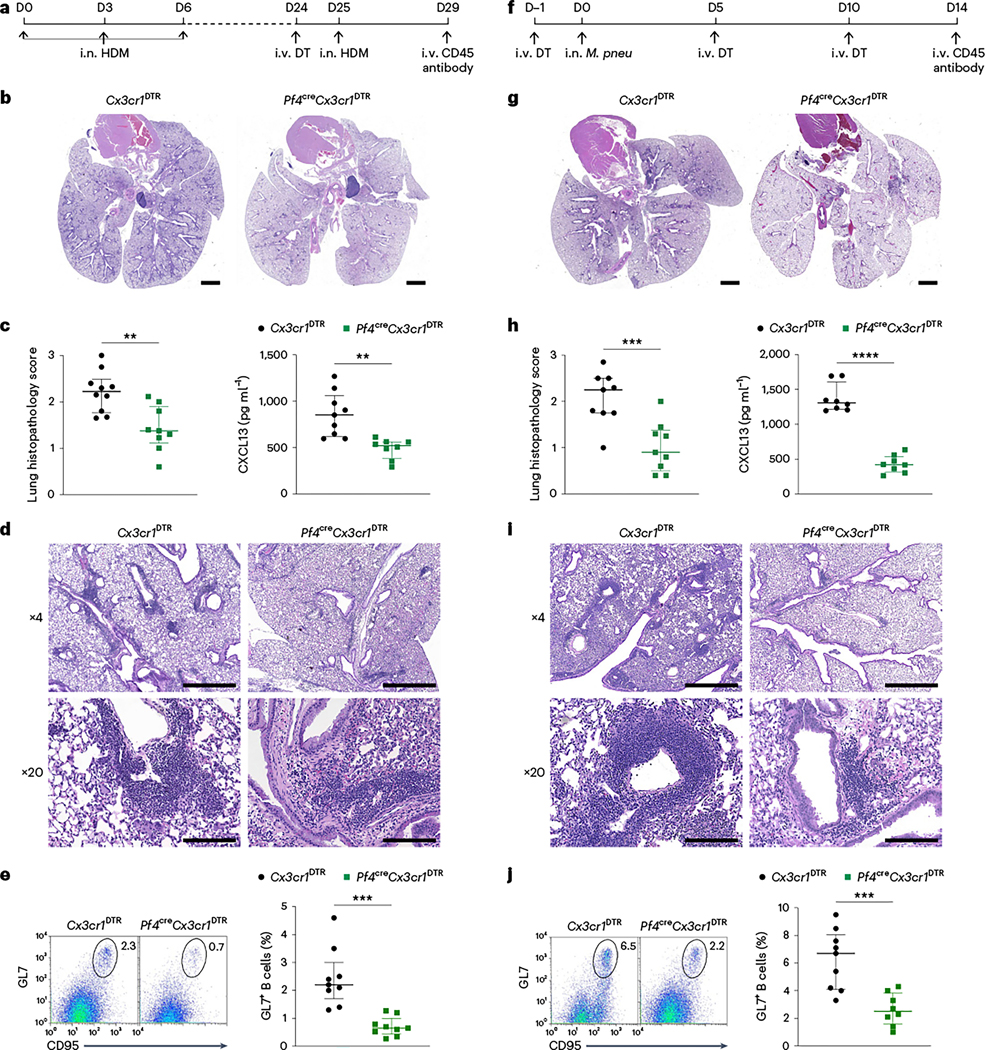
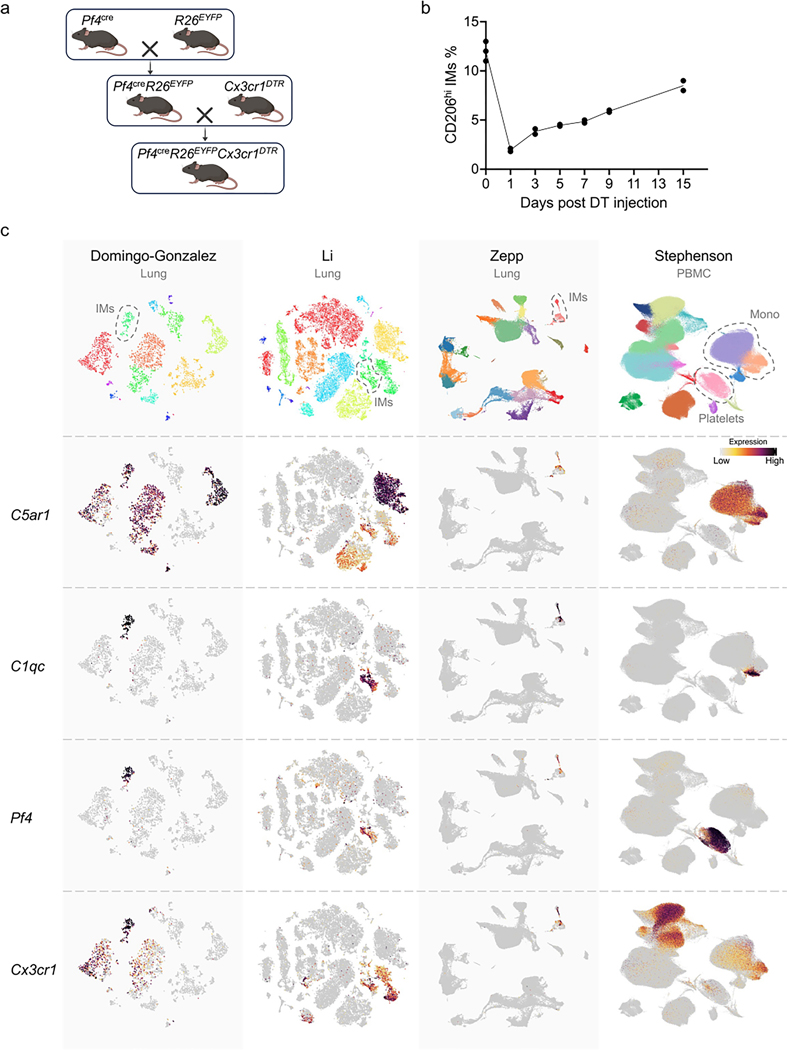
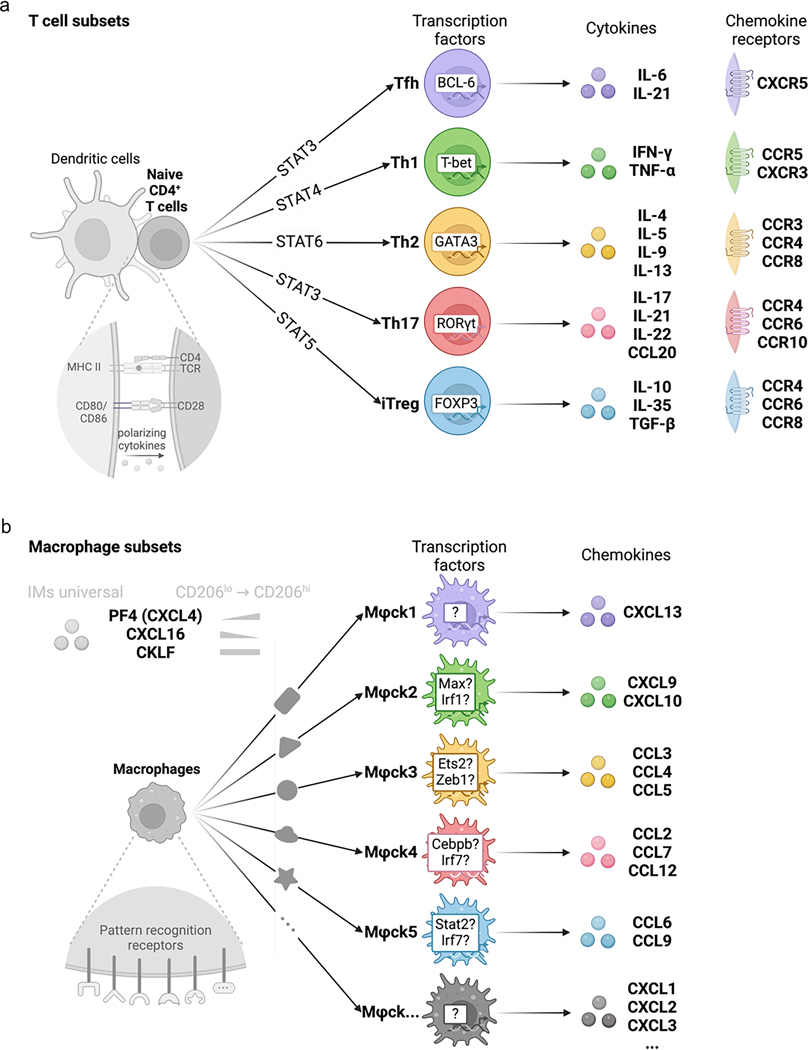
While non-hematopoietic cells are protected from DT-induced depletion in the (bone marrow chimeric) Pf4creR26EYFP+DTR mice, Pf4 is expressed in other hematopoietic cells, such as megakaryocytes and peritoneal macrophages40,41. Because these cells do not express CX3CR1 (refs. 42–45), we crossed Pf4cre mice with Cx3cr1DTR to generate Pf4creCx3cr1DTR mice, in which CD206hi IMs were depleted for up to 5 days following a single DT injection and gradually replenished by day 15 (Extended Data Fig. 9a,b). Intravenously DT-injected Pf4creCx3cr1DTR mice had reduced iBALT formation, reduced frequency of GL7+ B cells and reduced expression of CXCL13 in the lungs at day 29 or day 14 after challenge with HDM or Mycoplasma pneumoniae infection compared to DT-treated Cx3cr1DTR mice (Fig. 7 and Supplementary Figs. 4 and 5). Thus, CXCL13 and other chemokines derived from CD206hi IMs had a predominant role in leukocyte recruitment and tertiary lymphoid structure formation during allergy and microbial infection. Overall, our results indicate that macrophages, like naive T cells (Extended Data Fig. 10), can differentiate into distinct subsets that express specific chemokines in response to corresponding environmental stimuli.
Fig. 7 |. IMs contribute to iBALT formation.
a, Timeline showing the intranasal (i.n.) sensitization of Cx3cr1DTR mice and Pf4creCx3cr1DTR mice with 10 μg D. pteronyssinus (HDM) every 3 days for 7 days followed by i.v. injection of DT on day 24 (D24) and i.n. challenge with 25 μg HDM on day 25. Lungs were analyzed on day 29. b, Representative hematoxylin and eosin (H&E)-stained sections of lungs in Cx3cr1DTR mice and Pf4creCx3cr1DTR mice treated with HDM as in a (scale bars, 1,000 μm). Two independent experiments with n = 4 per group. c, Lung histopathology scores in Cx3cr1DTR mice and Pf4creCx3cr1DTR mice treated with HDM as in a (two independent experiments, n = 9–10 per group) and the CXCL13 protein concentration in lung tissues homogenates analyzed by ELISA from mice receiving the same treatment (two independent experiments, n = 9 per group). d, H&E-stained sections of lungs in Cx3cr1DTR mice and Pf4creCx3cr1DTR mice treated with HDM as in a (×4 camera lens magnification, scale bars, 1,000 μm or ×20 camera lens magnification, scale bars, 200 μm). Two independent experiments were conducted with n = 4 per group. e, Flow plots of lung GL7+CD95+ B cells and the percentage of GL7+ B cells in lung extravascular CD45+ cell population from Cx3cr1DTR mice and Pf4creCx3cr1DTR mice treated with HDM as in a. Two independent experiments were conducted with n = 9 per group. f, Timeline showing the i.v. injection of DT on day −1 followed by i.n. instillation of 5 × 10⁸ colony-changing units (CCU) of M. pneumoniae (M. pneu) on day 0 in Cx3cr1DTR mice and Pf4creCx3cr1DTR mice, followed by two more i.v. injections of DT on day 5 and day 10 and analysis of the lungs on day 14. g, Representative H&E-stained sections of lungs in Cx3cr1DTR mice and Pf4creCx3cr1DTR mice treated with M. pneumoniae as in f (scale bars,1,000 μm). Two independent experiments were conducted with n = 4 per group. h, Lung histopathology scores in Cx3cr1DTR mice and Pf4creCx3cr1DTR mice treated with M. pneumoniae as in f (two independent experiments, n = 9 per group) and CXCL13 protein concentration in lung tissues homogenates analyzed by ELISA from mice receiving the same treatment (two independent experiments with n = 8 biologically independent samples for each group). i, H&Estained sections of lungs in Cx3cr1DTR mice and Pf4creCx3cr1DTR mice treated with M. pneumoniae as in f. Two independent experiments were conducted with n = 4 per group (×4 camera lens magnification, scale bars, 1,000 μm or ×20 camera lens magnification, scale bars, 200 μm). j, Flow plots of lung GL7+CD95+ B cells and the percentage of GL7+ B cells in the lung extravascular CD45+ cell population from Cx3cr1DTR mice and Pf4creCx3cr1DTR mice treated with M. pneumoniae as in f. Two independent experiments were conducted with n = 8–9 per group.
Discussion
Here we investigated the diversity of lung IM subsets by refining their isolation and increasing their abundance for scRNA-seq, which significantly improved the granularity and resolution of our analysis. scRNA-seq analyses of naive and LPS-stimulated IMs revealed two previously reported IM clusters distinguished by the differential expression of various markers, including CD206, each with unique transcriptional signatures. Transcriptional profiling and high-resolution analysis indicated that IMs could be subdivided based on their chemokine expression, resulting in the designation of ten IM clusters (IMck0–IMck9). Mice with specific depletion of IM subsets indicated that IMs functioned as leukocyte recruiters during inflammation due to their chemoattractant properties.
In two inflammatory models that induce tertiary lymphoid structures, HDM and M. pneumoniae, the absence of CD206hi IMs (overlapping with IMck5, IMck6, IMck8 and IMck9 subsets) led to a substantial reduction in leukocyte recruitment and iBALT formation. This observation has implications for other disease settings where the formation of tertiary lymphoid structures is important; however, it is important to note that our observations do not preclude the possibility of additional bone-fide macrophage functions that IMs may perform, including crosstalk with structural cells, clearance of pathogens and cellular debris, and activation of effector T cells and other immune cells.
During inflammation, Ly6C+ monocytes migrate into the lung giving rise to recMacs, which become the overabundant macrophages compared to tissue-resident IMs. To ensure that we focused on activated tissue-resident IMs, we used a Gr1 antibody to deplete circulating Ly6C+ monocytes. This approach enabled us to stimulate IMs in vivo, in their natural environment, rather than extracting and stimulating them ex vivo, where their survival is compromised. Our IM-enriched scRNA-seq dataset identified ten distinct mononuclear phagocyte populations, where IMs were the most abundant population captured. DCs were also captured and showed that cDC1 and cDC2 transcriptionally converged into migDCs during maturation, appearing as one cluster of cells as they lost their top signature genes (Clec9a, Xcr1, Mgl2 and Cd209a) and acquired maturation genes (Ccr7, Ccl5, Ccl22 and Ccl17)24,46; however, once migDCs reach the draining lymph node, they undergo further transcriptional evolution, allowing their distinction into migDC1 and migDC2 subtypes24.
The excision of the EYFP stop cassette in Pf4hi cells in Pf4creR26EYFP mice leads to the permanent activation of EYFP expression in these cells. Given that EYFP expression selectively marked CD206hi IMs, but not CD206lo IMs, this implies that CD206hi IMs represent a terminally differentiated subset within the IM population. Indeed, metastable temporary expression or interconversion between the IM subsets would result in EYFP labeling of all IM subsets, which was not observed. This lineage-tracing property, along with the presence of chemokine-expressing IM subsets in numerous organs, supports the concept that chemokine production can serve as a stable identifier for a specific subset of IMs, with limited evidence of widespread or time-dependent expression patterns. The presence of coordinated chemokine production by specific subsets of IMs in all tissues analyzed in humans and mice, with only minor variations, implies their stability. Nevertheless, further lines of investigation will be required to conclusively determine IM stability, as well as their developmental lineage. An earlier study used Ccl24cre mice to lineage trace IMs, which uniquely labeled a TSLP+ subset of dermal IMs responsible for regulating type 2 immunity47. Consistently, we also observed that our designated Ccl24+ IMs (IMck9) selectively coexpressed TSLP. In the future, these combinatorial chemokine gene-targeting or depletion approaches, including split-Cre-based approaches48, could be used to investigate the division of labor among different chemokine-expressing macrophage subsets. Alternatively, another approach would be to identify the key transcriptional regulators of those subsets for selective targeting, thereby enhancing our understanding of their functional contributions to health and disease.
Online content
Any methods, additional references, Nature Portfolio reporting summaries, source data, extended data, supplementary information, acknowledgements, peer review information; details of author contributions and competing interests; and statements of data and code availability are available at https://doi.org/10.1038/s41590–024-01826–9.
Methods
Ethics statement
All experiments and procedures were conducted in accordance with procedures and protocol no. 00002229 approved by the Dartmouth College Institutional Animal Care and Use Committee. Additionally, the Trustees of Dartmouth College Committee For The Protection Of Human Subjects deemed human tissue used in this study as exempt under STUDY00031863.
Mice
C57BL/6NCrl (C57BL/6) and B6.SJL-PtprcaPepcb/BoyCrl (CD45.1) wild-type mice were purchased from Charles River Laboratories/NCI. B6;129P2-Lyve1tm1.1(EGFP/cre)Cys/J (Lyve1cre), B6.Cg-Tg(Nes-cre)1Kln/J (Nescre), Tg(Pdpn-cre/GFP)1Gco/J (Pdpncre), C57BL/6-Tg(Pf4-icre) Q3Rsko/J (Pf4cre), B6.129X1-Gt(ROSA)26Sor tm1(EYFP)Cos/J (R26EYFP), C57BL/6-Gt(ROSA)26Sortm1(HBEGF)Awai/J (R26DTR) and B6N.129P2-Cx3cr1tm3(Hbegf)Litt/J (Cx3cr1DTR) mice were purchased from Jackson Research Laboratories. All mice were bred in-house. Mice were genotyped or phenotyped before studies and used at 6–12 weeks of age; all experiments were performed on age-matched cohorts. In all experiments, Pf4creDTR+ mice were compared to DTR+ littermate controls in the setting of bone-marrow (BM) chimeras. Both male and female mice were used in each condition of each experiment. Mice were kept in specific-pathogen-free conditions maintained by the Dartmouth Hitchcock Medical College. Facilities were maintained at an ambient temperature of 23–24 °C with a 12-h light–dark cycle. Mice had access to food and water ad libitum.
Bone marrow chimeras
Eight-week-old CD45.1 wild-type mice were lethally irradiated with two rounds of 460 rads with a 10-h interval and reconstituted i.v. with freshly isolated BM cells. CD45.2 Pf4creDTR+ or DTR+ BM cells were prepared by flushing donor femurs and tibias with PBS. Cells were counted and transferred into recipient mice after radiation exposure. Five weeks after reconstitution, mice were assessed for chimerism by congenic markers before use.
Mouse inflammatory models
For LPS, mice were anesthetized with Avertin (Sigma-Aldrich)49 and 25 μg LPS (Sigma-Aldrich) in 50 μl PBS was given i.n.50. Mice were killed 24 h after instillation and lungs were collected for analysis. For the HDM extract, mice were given i.n. delivery of 10 μg for sensitization and 25 μg for challenge with D. pteronyssinus extract (Greer Laboratories) in 50 μl PBS. For M. pneumoniae, a low-passage M. pneumoniae strain PI1428 (ATCC) was cultured using ATCC Medium 243 supplemented with 20% heat-inactivated horse serum (Gibco) and 10% ATCC Yeast Extract no. 3. M. pneumoniae was cultured to high titers and frozen back in 500-μl aliquots containing 5.93 × 10⁹ CCU viable bacteria as determined by the most probable number method. On the day of challenge, frozen aliquots were resuspended in fresh medium and incubated at 37 °C with gentle shaking for 5 h, pelleted, then resuspended at the target concentration. Mice were anesthetized and 50 μl containing 5 × 10⁸ CCU per 50 μl of medium was instilled. The inoculum was verified to contain viable titers to 108 CCU through assessing growth following tenfold serial dilutions.
Preparation of single-cell suspensions from organs
Lung tissues were finely minced with scissors before digestion. Lungs were digested with 500 μg ml−1 Liberase (Roche/Sigma) for 30 min at 37 °C. A total of 100 ml 100 mM EDTA (Gibco) was added to stop 1 ml enzymatic digestion. Single-cell suspensions were obtained by repeated glass pipetting before cells were filtered through a 100-μm nylon filter (Falcon). To differentiate intravascular and extravascular leukocytes, mice were injected i.v. with APC-Cy7-conjugated CD45 antibody 5 min before collection.
Flow cytometry
Single-cell suspensions were resuspended in FACS buffer containing HBSS (Corning) with 0.3 mM EDTA (Gibco) and 0.2% FBS (Corning) and stained for 30 min with antibody master mix. The Reporting Summary outlines the complete list of antibodies used. The viability dye DAPI (Sigma) was added before sample acquisition on a BD Symphony A3 analyzer (BD Biosciences). Data were analyzed using FlowJo (Tree Star). Intracellular chemokine protein staining was performed using the eBioscience Intracellular Fixation & Permeabilization Buffer Set (Invitrogen) according to the manufacturer’s instructions. Dead cells were excluded with eBioscience Fixable Viability Dye eFluor 450 (Invitrogen).
Other protein analysis
A Luminex multiplex assay and traditional ELISA were used to measure chemokine concentration in the lung. Fresh lung tissues were homogenized in 3 ml 1× PBS containing cOmplete Protease Inhibitor Cocktail (Roche) to ensure preservation of protein integrity. The resulting lung homogenates were then centrifuged and the supernatants were collected for chemokine analysis. The Luminex multiplex assay used was the MILLIPLEX Mouse Cytokine/Chemokine Magnetic Bead Panel-Immunology Multiplex Assay (Millipore). This enabled the simultaneous quantification of several chemokines, including CCL2, CCL3, CCL4, CCL5, CXCL1, CXCL2, CXCL9 and CXCL10. The assay was performed strictly adhering to the manufacturer’s instructions. In parallel, a Mouse CXCL13/BLC/BCA-1 Quantikine ELISA kit (R&D Systems) was used to measure CXCL13, carried out as per the kit’s protocol instructions.
Microscopy
Lungs were perfused with 5 ml PBS (Corning), inflated with 10% neutral buffered formalin (Sigma-Aldrich) in placed in 10% neutral buffered formalin (Sigma-Aldrich). Paraffin-embedded sections (5-μm thickness) were stained with H&E (Vector Laboratories). Images were collected at ×200 with a Keyence BZ-X800 Series (Keyence). For histopathological evaluations, sections were blindly scored based on the severity of the peribronchiolar and perivascular infiltrates, which in itself is based on the size, cellularity and organization of the lesions. A score of 0 indicates no infiltrates/lesions; 1 indicates mild infiltrates/lesions (abnormal infiltrates, often with interrupted collar); 2 indicates moderate infiltrates/lesions with complete or crescent collar with <5 cells thickness; 3 indicates marked infiltrates with crescent collar between 5–10 cells thick; and 4 indicates severe infiltrates with complete collars and 5–10 cells thick. Frequency of lesions was also taken into consideration when assigning scores and half-step intervals were used for lesion severities meeting the criteria between two scores. Each visible lobe was scored separately and the average was taken to obtain the HistoPath Score reported per specimen.
CRISPR-Cas9 mediated gene editing
CRISPR-Cas9-mediated gene editing was used to target specific genes in the RAW 264.7 mouse macrophage cell line (ATCC). The transcription factor and target chemokine genes were chosen based on the SCENIC analysis of mouse lung IMs and the mouse lung tumor microenvironment. The gRNA specifically targeting mouse genes was sourced from the IDT Predesigned Alt-R CRISPR-Cas9 gRNA database, including sequences for Ets2 (Mm.Cas9.ETS2.1.AA), Irf1 (Mm.Cas9.IRF1.1.AB) and Irf7 (Mm.Cas9.IRF7.1.AA). In addition, the Alt-R CRISPR-Cas9 tracrRNA and Alt-R S.p. Cas9 Nuclease V3 were also purchased from IDT. For the transfection process, the LONZA AmaxaTM 4D-Nucleofector Protocol specific for RAW 264.7 (ATCC) was strictly followed, employing the 4D-Nucleofector X Unit (LONZA). The quantities of gRNA and Cas9 protein used were determined in reference to the methodology presented in previous research51. Post-nucleofection, the gene editing efficiency of the CRISPR process was evaluated. A high editing efficiency exceeding 80% was ascertained using Sanger sequencing, with the TIDE software (http://shinyapps.datacurators.nl/tide/) being employed to analyze the resultant data52. Subsequent to the CRISPR treatment, a subset of cells, both those subjected to targeted gRNA and those without gRNA, were exposed to 1 μg ml−1 LPS, whereas another subset remained untreated with LPS. This treatment persisted for 24 h to induce expression of chemokine genes. Following this incubation period, RNA was extracted from the cells using an RNeasy Mini kit (QIAGEN) and RT–qPCR was conducted using the SuperScript IV VILO Master Mix with ezDNase Enzyme (Invitrogen) and iTaq Universal SYBR Green One-Step kit (Bio-Rad). The amplification and quantification process was carried out on a CFX Opus 96 real-time PCR system (Bio-Rad). The gene expression data obtained were then normalized to the control gene expression (Actb) and analyzed to discern the impact of the CRISPR-mediated knockouts on cellular responses to LPS stimulation. TrueGuide Synthetic crRNA, Neg Control, Human and Mouse was used as a negative control. The sequences for gRNA and RT–qPCR primers are in Supplementary Data 3.
scRNA-seq analysis of mouse lung
Mouse treatment.
Three groups of C57BL/6 mice (n = 2) were treated for cell collection. LPS (Sigma-Aldrich) was i.n. administrated to mice with 10 μg in 50 μl sterile PBS (Corning) 24 h before collection. Anti-Gr1 was intraperitoneally administrated to mice with 300 μg in 300 μl also 24 h before collection. Mice in group 1 are naive mice without any treatment, where the collected cells are expected to contain only steady-state IMs; mice in group 2 are treated with LPS (Sigma-Aldrich) i.n. to introduce acute inflammatory lung injury, where the collected cells are expected to contain both stimulated IMs and recruited monocytes; mice in group 3 are treated with anti-Gr1 intraperitoneally and LPS (Sigma-Aldrich) i.n. to introduce injury and block the recruitment of blood monocytes, where the collected cells are expected to contain only stimulated tissue-resident IMs. To differentiate intravascular and extravascular leukocytes, mice were injected i.v. with APC-Cy7-conjugated anti-CD45 antibody 5 min before organ collection. The mice were killed using CO2 inhalation.
Sample processing.
IMs were isolated from the lung as previously described. Briefly, the lungs were perfused and finely minced with scissors and digested for 30 min at 37 °C. Single-cell suspensions were obtained by repeated glass pipetting and filtration. Cells were centrifugated at 300g for 5 min at 4 °C and stained with fluorescent labeled antibodies. Stained single-cell suspensions were enriched by MACS bead purification kits (Miltenyi) using anti-CD11b microbeads (Miltenyi) and then FACS sorted using the FACS Aria Fusion (BD Biosciences; strategy shown in Fig. 1a). Sorted cells were centrifugated at 300g for 5 min at 4 °C. Supernatants were aspirated and pellets were resuspended with HBSS (Corning) plus 0.5% BSA (Sigma-Aldrich) at an approximate concentration of 2.5 × 10⁵ cells per ml. Cell quality and viability were assessed with a Cellometer K2 (Nexcelom Bioscience). All samples had a viability >90%. Single cells were then processed using the Chromium Next GEM Single Cell 3′ Platform (10x Genomics). Approximately 6,000 cells were loaded on each channel with an average recovery rate of 5,000 cells. Libraries were sequenced on NextSeq 500/550 (Illumina) with an average sequencing depth of 38,000 reads per cell.
Data preparation.
Raw sequencing reads were demultiplexed, mapped to the GRCm38 mouse reference genome and gene expression matrices were generated using CellRanger v.6.1 (10x Genomics). The following analyses were conducted in R v.4.2 (ref. 53) and Python v.3.6. Seurat package v.4.3 was used for downstream data analyses54 and figures were produced using the package ggplot2. Following the standard Seurat workflow outlined in the Code Availability section, the dataset is analyzed and merged for further analysis.
Differentially expressed genes.
DEGs were calculated with the FindAll-Markers function of Seurat in R v.4.2 to study the different expression profiles in different cell types and upregulated genes in different treatment groups54. The data matrices of the SCT assay were used and the minimal log fold change was set to 0.25. Only genes that were detected in more than 25% of cells in either of the two populations were used to compute the DEGs with a Wilcoxon rank-sum test. Markers were identified as genes exhibiting significant upregulation when compared to all other subsets and having a Bonferroni-adjusted P value < 0.05. The DEGs are ranked by the adjusted P value to select the top DEGs for downstream analysis.
Cell type identification.
To identify cell types, the FindClusters function with the Leiden algorithm with the various resolution from 0.5 to 2.0 in the Seurat package were used for clustering54. The FindAllMarkers function was then applied. The top DEGs of individual clusters were examined for well-studied marker genes across the literature and the clusters were then annotated for the most likely identity until the right resolution was reached so that each cluster had a unique gene expression pattern. Ten distinct cell types were identified, including IMs, non-classic IMs, recruited macrophages, non-classic monocytes, DC1, CD301b− DC2, CD301b+ DC2, inflammatory DC2, migratory DCs and cycling cells.
GO analysis.
Gene set functional analysis was conducted with TopGO55 (Fisher’s exact test) to get a general overview of the more represented functional categories with the DEGs in each cluster. The background genes of gene enrichment assays were defined as all the detected genes in the datasets and the biological process was selected as the target of GO analysis. The DEGs of different cell types were used as the enrichment input. The top five GO terms ranked by P value56 for every cell type were selected and compared to other cell types. Overlaps of those GO terms were removed from the final visualization.
PCA.
For the PCA of scRNA-seq data, pseudobulk counts were first generated by aggregating individual cell transcriptomes of each cell type with the FindAllMarkers function of Seurat in R 4.2 (ref. 54). PCA was then performed on the aggregated counts with the prcomp function of the stats package53 and figures were produced using the package plot3D57 (R package v.1.4.) and ggplot2 (ref. 58, R package v.3.3.3.).
Cell type similarity.
To compare transcriptomes and chemokine-secreting IMs and other cell types, we performed MetaNeighbor analysis among different populations. Summarized experiment objects were constructed using combined ‘data’ matrices of SCT assays and the variableGenes function of the MetaNeighbor package was used to identify the highly variable genes as an input of the correlation assessment59. The cell–cell correlation was represented by the mean area under the receiver operator characteristic curve scores, which is the probability that a certain cell will be ranked above other cell types. The correlation matrices were then passed to ComplexHeatmap package and clustered with the Spearman method60.
Velocity analysis.
For the analysis of RNA velocity, initial sequencing data were processed using the CellRanger v.6.1 (10x Genomics) pipeline to generate BAM files. After alignment, the loom files, which encompass spliced and unspliced mRNA counts, were derived using the velocyto toolkit61. The ReadVelocity function of the SeuratWrappers package was then employed to read in the spliced and unspliced matrices from the aforementioned loom files. Before proceeding with RNA velocity calculations, dimension reduction was performed on the spliced matrix, facilitating effective visualization of the data, as described in earlier sections. The RunVelocity function of the SeuratWrappers package was then utilized to compute the mRNA velocities54. Figures were produced using the combined functionality of the velocyto R61 and ggplot2 R packages54,58.
PAGA analysis.
To elucidate the potential trajectories and interconnectivities among cell states, PAGA analysis was performed using RunPAGA of the SCP package of R62 (R package v.0.5.1). Figures were produced using the combined functionality of the SCP62 (R package v.0.5.1) and ggplot2 R packages58.
Pseudotime analysis.
For the analysis of the single-cell trajectories63–66, Monocle3 was used to learn the sequence of gene expression changes that each cell must go through as part of a dynamic biological process and then arrange each cell in the trajectory63–66. Start nodes were designated within the IMck0 subset from untreated mice, providing a visualization of the pseudotime progression from naive IMs toward their activated states within both CD206hi IMs and CD206lo IMs. To investigate dynamic gene expression, DEGs over the pseudotime were calculated by the graph_test function. By ranking the P value, the top 100 pseudotime DEGs were identified and then visualized and the top ten were labeled.
Regulon analysis.
The regulon specificity of chemokine-expressing IMs was analyzed using the SCENIC package of R v.4.2 and pySCENIC of Python v.3.8 for the IM subsets with count matrices as the input29,67,68. The regulons and transcription factor activity (area under the curve) for each cell were calculated with motif collection v.10 as well as mm10_500bp_up_100bp_down_full_tx_v10_clust.genes_vs_motifs.rankings.feather and mm10_10kbp_up_10kbp_down_full_tx_v10_clust.genes_vs_motifs.rankings.feather databases from cisTarget (https://resources.aertslab.org/cistarget/). The transcription factor regulon prediction was performed using pySCENIC default parameters29,67,68. The resulting area under the curve scores for each cell and adjacency matrices were used for downstream quantification of regulon specificity score. The top ten transcription factors ranked by specificity score for every cell type were selected and compared to other cell types. Overlaps of those transcription factors were removed from the final visualization.
scRNA-seq analysis of other tissues
The methods for scRNA-seq analysis of other tissues are available in the Gene Expression Omnibus under accession code GSE193782 and SuperSeries GSE225668.
Statistics and reproducibility
For scRNA-seq experiments, no statistical method was used to predetermine sample sizes. Sample sizes were chosen on technical manageability and the basis of the availability of target cells. For transgenic mouse experiments, no statistical method was used to predetermine sample sizes, but our experimental cohort size was based on technical manageability and previous cohort size where experiments were performed at least twice with 4–5 mice per group. All measurements were taken from distinct samples and the number of individuals in each experiment or analysis is clearly indicated either in the text or in figure legends. Data distribution was assumed to be normal but this was not formally tested. Significance was evaluated using a two-tailed Student’s t-test. The calculation of DEGs between different clusters in the scRNA-seq data was performed using a two-sided Wilcoxon rank-sum test and P values were corrected for multiple comparisons with the Bonferroni method. Additionally, the gene set enrichment analysis between different clusters in the scRNA-seq data was conducted using Fisher’s exact test. These analyses were performed using R v.4.2 with packages including Seurat v.4.3 and TopGO and Prism GraphPad. P < 0.05 was considered statistically significant. Data distribution for the transgenic mouse experiment was assumed to be normal but this was not formally tested. In the selection of experimental cohorts of mice, randomization was not the dominant driver of the process. Notably, littermate controls were assigned appropriately to match mice that were genetically altered, so that controls were tested side by side with those bearing a different genotype. Experimental analysis was carried out so that for any given length of a protocol, all experimental cohorts were dealt with simultaneously; no one whole group was processed first before the next, but the cohorts were evenly distributed throughout the procedure. All samples were given a code name and this was processed without reference to its cohort features until the end of the experiment. Data collection and analysis were performed blind to the genotypes of the mice. The investigators were blinded to allocations during experiments and outcome assessment. No animals were excluded except in rare cases where BM chimeras became sick before they could be used in an experiment. No samples were excluded from the analysis, except in rare cases when technical issues occurred and no data points were collected. No data points were excluded from the study.
Reporting summary
Further information on research design is available in the Nature Portfolio Reporting Summary linked to this article.
Extended Data
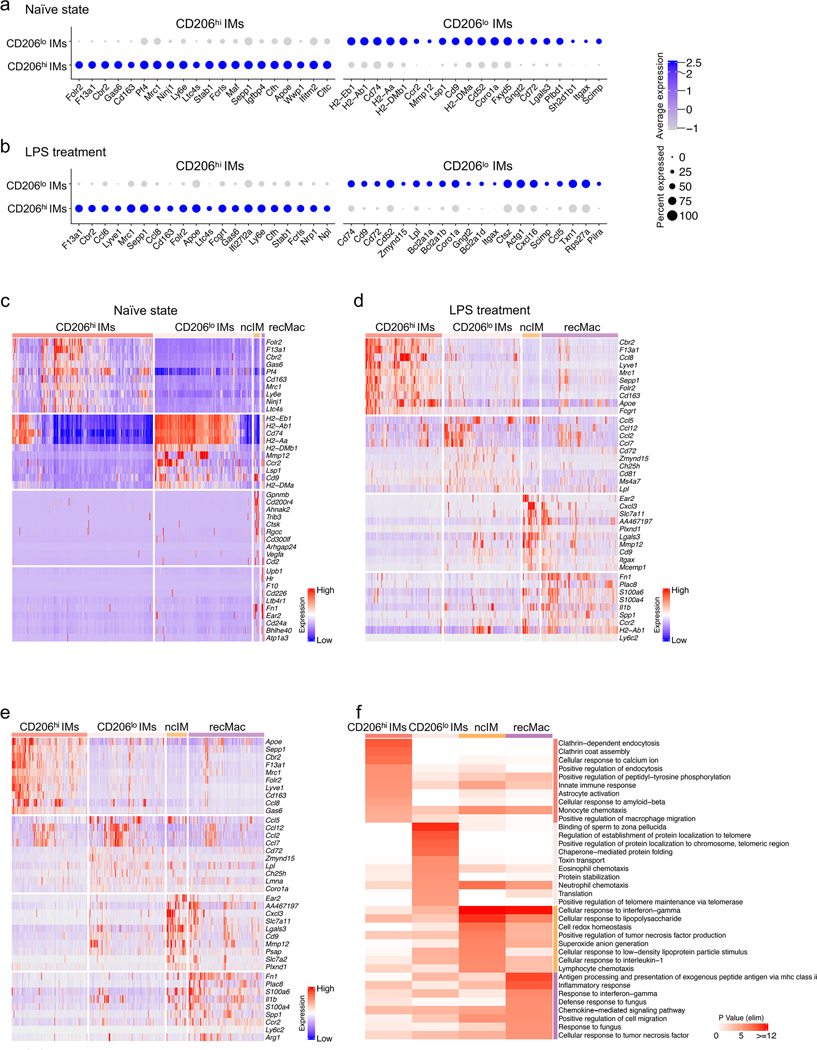
Extended Data Fig. 1 |. Distinct transcriptional profiles and gene ontology enrichment observed in IM subsets.
(a) Dot plot depicts the expression of top 20 DEGs in CD206hi IMs and CD206lo IMs under naïve state. (b) Dot plot depicts the expression of top 20 DEGs in CD206hi IMs and CD206lo IMs under LPS treatment. (c) Heat map shows the expression of top 10 DEGs in CD206hi IMs and CD206lo IMs, ncIM and recMac under naïve state. (d) Heat map shows the expression of top 10 DEGs in CD206hi IMs and CD206lo IMs, ncIM and recMac under LPS treatment. (e) Heat map shows the expression of top 10 overall DEGs in CD206hi IMs and CD206lo IMs, ncIM and recMac. (f) Heat map shows the top 20 biological process-related gene ontology (GO) terms for CD206hi IMs and CD206lo IMs, ncIM and recMac. Statistical analysis was conducted using Fisher’s exact test.
Extended Data Fig. 2 |. Absence of unique growth factor or substantial M1/M2 gene signature expression in IM populations.
(a) Dot plot depicts the expression of growth factor genes (GO: 0008083) in each major cell type. (b) Feature plots depict the expression of selected growth factor genes, complemented by violin plots illustrating the expression of those genes in individual experimental groups. (c) Feature plots depict the expression of Nos2 and Arg1, the markers for M1/M2 macrophages. (d) Heat map shows the expression of M1/M2 signature genes (PMID: 31178859) in CD206hi IMs and CD206lo IMs, ncIM and recMac79.
Extended Data Fig. 3 |. Unbiased clustering analysis with higher resolution shows chemokine gene enrichment in IM subtypes.
(a) UMAP plot illustrates the 58 clusters generated through an unbiased high-resolution clustering analysis, including 38 IM clusters. (b) Heat map shows the expression of top 10 DEGs in each IM cluster; chemokine genes are distinctly emphasized. (c) UMAP plots illustrates IM chemokine expression. (d) UMAP plots illustrates ten IM subsets (IMck0 through IMck9) delineated by their respective chemokine expression profiles, within the original and re-clustered UMAP plot. (e) Feature plots further detail the expression of pan chemokine genes among IM subsets.
Extended Data Fig. 4 |. Identification of regulons governing differential chemokine expression among IM subsets.
(a) With the motif enriched 500 bp upstream to 100 bp downstream of the targeted gene TSS, left panel: heat map shows the specificity of top 10 regulons enriched in each IM subset, as identified by SCENIC analysis, with the ones that putatively regulate the indicated chemokine genes are accentuated; right panel Heat map shows the expression of the transcription factors from the top 10 enriched in each IM subset, with the ones that putatively regulate the indicated chemokine genes are accentuated. (b) With the motif enriched 10k bp around the targeted gene TSS, right panel: heat map shows the specificity of top 10 regulons enriched in each IM subset, as identified by SCENIC analysis, with the ones that putatively regulate the indicated chemokine genes are accentuated; right panel Heat map shows the expression of the transcription factors from the top 10 enriched in each IM subset, with the ones that putatively regulate the indicated chemokine genes are accentuated. (c) Workflow illustrates the verification of putative transcription factors through CRISPR-mediated knockout in the RAW 264.7 mouse macrophage cell line. Following nucleofection of ribonucleoprotein with various gRNAs, the cells were treated with either PBS or LPS for 24 hours. RT-qPCR assessed chemokine gene expression.
Extended Data Fig. 5 |. IMck subsets are conserved across mouse and human tissues.
a-g, Dot plots depict the expression of complete chemokine gene set (GO: 0008009) in IM datasets across diverse tissues and species: (a) Mouse lung (mLu); (b) Mouse tumor microenvironment (mTME); (c) Mouse peritoneal lavage (mPL); (d) Mouse skin (mSk); (e) Mouse bronchioalveolar lavage (mBAL); (f) Human skin (hSk); (g) Human bronchioalveolar lavage (hBAL). Highlighted regions accentuate the chemokine-expression patterns of IMs observed in mLu.
Extended Data Fig. 6 |. Chemokine-expressing IM subsets are conserved in mouse heart (GSE179276).
(a-d) mouse heart (mHr) IMs (a) Dot plot depicts the expression of complete chemokine gene set (GO: 0008009) across the identified IM subsets (IMck0 through IMck9). (b) UMAP plots illustrates ten IM subsets delineated by their respective chemokine expression profiles. (c) Feature plots further detail the expression of pan chemokine genes among IM subsets. (d) Feature plots further detail the expression of remaining individual chemokine genes among IM subsets. (e) Heat map shows the expression of the top 5 DEGs, excluding chemokine genes, originally identified in the mLu dataset across corresponding IM subsets in additional datasets from different tissues and species (mTME, mHr, mSk, hSk). Expression data are normalized within each dataset and merged for the combined visualization. IM subsets not represented in certain datasets are indicated in gray. (f) Bar graph illustrates the distribution of IMck DEGs across five distinct datasets (mLu, mTME, mHr, mSk, hSk). The y-axis categorizes the IM subsets, while the x-axis quantifies the number of DEGs. The DEGs are color-coded based on their occurrence across the datasets, with five shades of gray indicating the level of overlap. The darkest shade represents genes shared in all five datasets, indicating the highest conservation, while the lightest shade represents genes unique to a single dataset, indicating no overlap. (g) Donut charts illustrates the distribution of IMck DEGs five distinct datasets (mLu, mTME, mHr, mSk, hSk) in the format of percentage values, complementing the bar graph.
Extended Data Fig. 7 |. Tissue-specific macrophages also comprise chemokine-expressing subsets.
a-f, Dot plots depict the expression of complete chemokine gene set (GO: 0008009) in tissue-specific macrophage datasets across diverse tissues and species: (a) Large peritoneal macrophages (LPMs) in mPL; (b) Small peritoneal macrophages (SPMs) in mPL; (c) Langerhans cells (LCs) in mSk; (d) Alveolar macrophages (AMs) in mBAL; (e) Langerhans cells (LCs) in hSk; (f) Alveolar macrophages (AMs) in hBAL. Regions highlighted in black accentuate the chemokine-expression patterns observed in IMs and regions highlighted in red accentuate the unique chemokine-expression patterns observed in tissue-specific macrophages. (g) Schematic representation of the different tissue-specific macrophages investigated for chemokine expression in this figure.
Extended Data Fig. 8 |. IMs contribute to iBALT formation in Pf4creR26DTR mice.
(a) Flow plots illustrates the verification of Pf4 specificity through Cre recombinase-induced EYFP activation in Pf4crecreR26EYFP mice. Live cells were gated based on DAPI− cells, and it was observed that EYFP expression was exclusive to interstitial macrophages without non-specific targeting effects. (b) Flow plots illustrates the verification of the integrity of dendritic cells (DCs) and other myeloid cells in Pf4creR26EYFP+DTR mice following a single DT administration. DCs were further subdivided into DC1 and DC2 subsets based on the expression of CD11b and CD11c. Cells were gated on DAPI−CD88− myeloid cells. c-e, CD206hi IMs contribute to iBALT formation and B cells maturation in the type 2 inflammation model in Pf4creR26DTR mice. (c) Representative H&E-stained sections of lungs in R26DTR mice and Pf4creR26DTR mice treated with HDM (left, scale bars = 1000 μm). Lung histopathology scores in R26DTR mice and Pf4creR26DTR mice treated with HDM. Two independent experiments with n = 9–10 per group. (d) H&E-stained sections of lungs in R26DTR mice and Pf4creR26DTR mice treated with HDM (4X camera lens magnification, scale bars = 1000 μm or 20X camera lens magnification, scale bars = 200 μm). Two independent experiments with n = 4–5 per group. (e) Flow plots of lung GL7+CD95+ B cells, and the percentage of GL7+ B cells in lung extravascular CD45+ cell population, from R26DTR mice and Pf4creR26DTR mice treated with HDM. Two independent experiments with n = 10 per group. f-h, CD206hi IMs contribute to iBALT formation and B cells maturation in the bacterial infection model in Pf4creR26DTR mice. (f) Representative H&Estained sections of lungs in R26DTR mice and Pf4creR26DTR mice treated with M. pneu (left, scale bars = 1000 μm). Lung histopathology scores in R26DTR mice and Pf4creR26DTR mice treated with M. pneu. Two independent experiments with n = 9 per group. (g) H&E-stained sections of lungs in R26DTR mice and Pf4creR26DTR mice treated with M. pneu (4X camera lens magnification, scale bars = 1000 μm or 20X camera lens magnification, scale bars = 200 μm). Two independent experiments with n = 4 per group. (h) Flow plots of lung GL7+CD95+ B cells, and the percentage of GL7+ B cells in lung extravascular CD45+ cell population, from R26DTR mice and Pf4creR26DTR mice treated with M. pneu. Two independent experiments with n = 8 per group. Data are shown as median with interquartile range. P values were calculated using two-sided Student’s t-test. *P < 0.05, **P < 0.01, ***P < 0.001, and ****P < 0.0001. Exact P values are listed in Source Data.
Extended Data Fig. 9 |. Enhanced specificity in targeting CD206hi IMs using the Pf4cre mouse model in combination with Cx3cr1DTR mice.
(a) Breeding scheme to produce Pf4creR26EYFPCx3cr1DTR offspring. (b) A time course analysis presents the depletion kinetics of CD206hi IMs in Pf4creR26EYFPCx3cr1DTR mice following a single DT administration. Three independent experiments. (c) Bioinformatical verification of the specificity in Pf4creCx3cr1DTR mice by analyzing public datasets: GSE147668 (Domingo-Gonzalez - Lung), CRA004586 (Li - Lung), GSE149563 (Zapp - Lung), and E.MTAB.10026 (Stephenson - PBMC), highlighting the specific expression of both Pf4 and Cx3cr1 by IMs. Visualizations with complete cell types labels are available on different dataset repositories (listed in Data Availability section) and original publications.
Extended Data Fig. 10 |. Analogous to cytokine-producing helper T cells, macrophages’ specific chemokine expression may also be under tight regulation.
(a) The illustration summarizes the established T cell subsets, emphasizing the distinct differentiation trajectories, cytokines, and chemokine receptor expression profiles for each subset. (b) The illustration summarizes the proposed universal classification of macrophage subsets, emphasizing the distinct differentiation trajectories and associated chemokine expression profiles for each subset.
Supplementary Material
Acknowledgements
We are grateful to W. Wells, S. H. Boyle, N. R. Lemelin, J. N. Ray, S. N. Schutz, A. J. Wood and P. P. Seery at the Department of Pathology at Dartmouth Hitchcock Medical Center for kindly providing us with human breast reduction skin samples, W. T. King at the Department of Microbiology and Immunology at Dartmouth Hitchcock Medical Center for technical support, K. Rawat and A. Tewari at the Department of Microbiology and Immunology at Dartmouth Hitchcock Medical Center for the mTME dataset and A. Balasubramanian at the Department of Microbiology and Immunology at Dartmouth Hitchcock Medical Center for the assistance with the CRISPR-mediated knockout experiments. This work was funded by National Institutes of Health (NIH) grants R01 HL115334 (C.V.J.); NIH grants R01 HL135001 (C.V.J.); NIH grants R35 HL155458 (C.V.J.); NIH grants T32AI007363 (A.B.M.); RS-TS UGent grant BOF.MET.2021.0007.01 (contract no. 01M01521) (N.G.); National Cancer Institute Cancer Center Support Grant 5P30CA023108 (F.W.K.); NIH S10 1S10OD030242 (F.W.K.); NIH NIGMS P20GM130454 (F.W.K.); and NIH S10 S10OD025235 (F.W.K.). The funders had no role in the study design, data collection and analysis, decision to publish or preparation of the manuscript.
Footnotes
Code availability
Code is available at https://github.com/XinLi-0419/MacrophageChemokineHeterogeneity.
Competing interests
The authors declare no competing interests.
Additional information
Extended data is available for this paper at https://doi.org/10.1038/s41590-024-01826-9.
Supplementary information The online version contains supplementary material available at https://doi.org/10.1038/s41590-024-01826-9.
Data availability
The sequencing raw data and processed data used in this article are available in the Gene Expression Omnibus under accession code GSE193782 (hBAL)9 and Super Series GSE225668 (mLu and all others). The processed data are also available for online visualization at https://ams-supercluster.cells.ucsc.edu, https://cells.ucsc.edu/?ds=ln-mono-dc and https://cells.ucsc.edu/?ds=lung-interstitial-macrophage. In addition to our in-house datasets, we incorporated several publicly available datasets for auxiliary analyses. For confirmation of IM subsets, we consulted dataset GSE179276 (ref. 33), as illustrated in Extended Data Fig. 6. Furthermore, the specificity of Pf4 and Cx3cr1 expression in IMs was corroborated by referencing datasets GSE147668 (ref. 42), Inflammatory Memory Neutophils in Asthma (ref. 43), GSE149563 (ref. 44) and E.MTAB.10026 (ref. 45), as presented in Extended Data Fig. 9, whose visualizations with complete cell types labels are also available on a different dataset depository at https://app.lungmap.net/app/shinycell-mm-timecourse, https://cells.ucsc.edu/?ds=mouse-lung-immune, https://cells.ucsc.edu/?ds=mouse-asthma+all-cells and https://cells.ucsc.edu/?ds=covid19-pbmc. Source data are provided with this paper.
References
- 1.Guilliams M. et al. Spatial proteogenomics reveals distinct and evolutionarily conserved hepatic macrophage niches. Cell 185, 379–396 (2022). [DOI] [PMC free article] [PubMed] [Google Scholar]
- 2.Aegerter H, Lambrecht BN & Jakubzick CV Biology of lung macrophages in health and disease. Immunity 55, 1564–1580 (2022). [DOI] [PMC free article] [PubMed] [Google Scholar]
- 3.Bain CC & MacDonald AS The impact of the lung environment on macrophage development, activation and function: diversity in the face of adversity. Mucosal Immunol. 15, 223–234 (2022). [DOI] [PMC free article] [PubMed] [Google Scholar]
- 4.Li X, Rawat K. & Jakubzick CV Targeting resident macrophages in cancer. Nat. Immunol. 22, 1078–1079 (2021). [DOI] [PMC free article] [PubMed] [Google Scholar]
- 5.Janssen WJ et al. Fas determines differential fates of resident and recruited macrophages during resolution of acute lung injury. Am. J. Respir. Crit. Care Med. 10.1164/rccm.201011-1891oc (2011). [DOI] [PMC free article] [PubMed] [Google Scholar]
- 6.Gibbings SL et al. Transcriptome analysis highlights the conserved difference between embryonic and postnatal-derived alveolar macrophages. Blood 126, 1357–1366 (2015). [DOI] [PMC free article] [PubMed] [Google Scholar]
- 7.Misharin AV et al. Monocyte-derived alveolar macrophages drive lung fibrosis and persist in the lung over the life span. J. Exp. Med. 214, 2387–2404 (2017). [DOI] [PMC free article] [PubMed] [Google Scholar]
- 8.Guilliams M. et al. Alveolar macrophages develop from fetal monocytes that differentiate into long-lived cells in the first week of life via GM-CSF. J. Exp. Med. 210, 1977–1992 (2013). [DOI] [PMC free article] [PubMed] [Google Scholar]
- 9.Li X. et al. ScRNA-seq expression of IFI27 and APOC2 identifies four alveolar macrophage superclusters in healthy BALF. Life Sci. Alliance 5, e202201458 (2022). [DOI] [PMC free article] [PubMed] [Google Scholar]
- 10.Dick SA et al. Three tissue resident macrophage subsets coexist across organs with conserved origins and life cycles. Sci. Immunol. 7, eabf7777 (2022). [DOI] [PubMed] [Google Scholar]
- 11.Gibbings SL et al. Three unique interstitial macrophages in the murine lung at steady state. Am. J. Respir. Cell Mol. Biol. 57, 66–76 (2017). [DOI] [PMC free article] [PubMed] [Google Scholar]
- 12.Moore PK et al. Single-cell RNA sequencing reveals unique monocyte-derived interstitial macrophage subsets during lipopolysaccharide-induced acute lung inflammation. Am. J. Physiol. Lung Cell Mol. Physiol. 10.1152/ajplung.00223.2022 (2023). [DOI] [PMC free article] [PubMed] [Google Scholar]
- 13.Vanneste D. et al. MafB-restricted local monocyte proliferation precedes lung interstitial macrophage differentiation. Nat. Immunol. 24, 827–840 (2023). [DOI] [PMC free article] [PubMed] [Google Scholar]
- 14.Hume PS et al. Localization of macrophages in the human lung via design-based stereology. Am. J. Respir. Crit. Care Med. 201, 1209–1217 (2020). [DOI] [PMC free article] [PubMed] [Google Scholar]
- 15.Cho CH et al. Angiogenic role of LYVE-1-positive macrophages in adipose tissue. Circ. Res. 100, e47–e57 (2007). [DOI] [PubMed] [Google Scholar]
- 16.Han Y, Ma FY, Tesch GH, Manthey CL & Nikolic-Paterson DJ c-fms blockade reverses glomerular macrophage infiltration and halts development of crescentic anti-GBM glomerulonephritis in the rat. Lab. Invest. 91, 978–991 (2011). [DOI] [PubMed] [Google Scholar]
- 17.Pridans C. et al. Pleiotropic impacts of macrophage and microglial deficiency on development in rats with targeted mutation of the Csf1r locus. J. Immunol. 201, 2683–2699 (2018). [DOI] [PMC free article] [PubMed] [Google Scholar]
- 18.Ural BB et al. Identification of a nerve-associated, lung-resident interstitial macrophage subset with distinct localization and immunoregulatory properties. Sci. Immunol. 5, eaax8756 (2020). [DOI] [PMC free article] [PubMed] [Google Scholar]
- 19.Keerthivasan S. et al. Homeostatic functions of monocytes and interstitial lung macrophages are regulated via collagen domain-binding receptor LAIR1. Immunity 54, 1511–1526 (2021). [DOI] [PubMed] [Google Scholar]
- 20.Schyns J. et al. Non-classical tissue monocytes and two functionally distinct populations of interstitial macrophages populate the mouse lung. Nat. Commun. 10, 3964 (2019). [DOI] [PMC free article] [PubMed] [Google Scholar]
- 21.Chakarov S. et al. Two distinct interstitial macrophage populations coexist across tissues in specific subtissular niches. Science 363, eaau0964 (2019). [DOI] [PubMed] [Google Scholar]
- 22.Zhou X. & Moore BB Location or origin? What is critical for macrophage propagation of lung fibrosis? Eur. Respir. J. 51, 1800103 (2018). [DOI] [PMC free article] [PubMed] [Google Scholar]
- 23.Nakano H. et al. Complement receptor C5aR1/CD88 and dipeptidyl peptidase-4/CD26 define distinct hematopoietic lineages of dendritic cells. J. Immunol. 194, 3808–3819 (2015). [DOI] [PMC free article] [PubMed] [Google Scholar]
- 24.Rawat K. et al. CCL5-producing migratory dendritic cells guide CCR5+ monocytes into the draining lymph nodes. J. Exp. Med. 220, e20222129 (2023). [DOI] [PMC free article] [PubMed] [Google Scholar]
- 25.Bosteels C. et al. Inflammatory type 2 cDCs acquire features of cDC1s and macrophages to orchestrate immunity to respiratory virus infection. Immunity 52, 1039–1056 (2020). [DOI] [PMC free article] [PubMed] [Google Scholar]
- 26.Mills CD, Kincaid K, Alt JM, Heilman MJ & Hill AM M-1/M-2 macrophages and the Th1/Th2 paradigm. J. Immunol. 164, 6166–6173 (2000).10843666 [Google Scholar]
- 27.Tang XZ, Kreuk LSM, Cho C, Metzger RJ & Allen CDC Bronchus-associated macrophages efficiently capture and present soluble inhaled antigens and are capable of local Th2 cell activation. eLife 11, e63296 (2022). [DOI] [PMC free article] [PubMed] [Google Scholar]
- 28.Zheng SC, Stein-O’Brien G, Boukas L, Goff LA & Hansen KD Pumping the brakes on RNA velocity by understanding and interpreting RNA velocity estimates. Genome Biol. 24, 246 (2023). [DOI] [PMC free article] [PubMed] [Google Scholar]
- 29.Aibar S. et al. SCENIC: single-cell regulatory network inference and clustering. Nat. Methods 14, 1083–1086 (2017). [DOI] [PMC free article] [PubMed] [Google Scholar]
- 30.Forero A. et al. Differential activation of the transcription factor IRF1 underlies the distinct immune responses elicited by type I and type III interferons. Immunity 51, 451–464 (2019). [DOI] [PMC free article] [PubMed] [Google Scholar]
- 31.Jinek M. et al. A programmable dual-RNA-guided DNA endonuclease in adaptive bacterial immunity. Science 337, 816–821 (2012). [DOI] [PMC free article] [PubMed] [Google Scholar]
- 32.Pitarresi JR et al. Stromal ETS2 regulates chemokine production and immune cell recruitment during acinar-to-ductal metaplasia. Neoplasia 18, 541–552 (2016). [DOI] [PMC free article] [PubMed] [Google Scholar]
- 33.Revelo XS et al. Cardiac resident macrophages prevent fibrosis and stimulate angiogenesis. Circ. Res. 129, 1086–1101 (2021). [DOI] [PMC free article] [PubMed] [Google Scholar]
- 34.Heng TS & Painter MW The Immunological Genome Project: networks of gene expression in immune cells. Nat. Immunol. 9, 1091–1094 (2008). [DOI] [PubMed] [Google Scholar]
- 35.Neyt K, Perros F, GeurtsvanKessel CH, Hammad H. & Lambrecht BN Tertiary lymphoid organs in infection and autoimmunity. Trends Immunol. 33, 297–305 (2012). [DOI] [PMC free article] [PubMed] [Google Scholar]
- 36.Bracke KR et al. Role of CXCL13 in cigarette smoke-induced lymphoid follicle formation and chronic obstructive pulmonary disease. Am. J. Respir. Crit. Care Med 188, 343–355 (2013). [DOI] [PubMed] [Google Scholar]
- 37.Rangel-Moreno J, Moyron-Quiroz JE, Hartson L, Kusser K. & Randall TD Pulmonary expression of CXC chemokine ligand 13, CC chemokine ligand 19, and CC chemokine ligand 21 is essential for local immunity to influenza. Proc. Natl Acad. Sci. USA 104, 10577–10582 (2007). [DOI] [PMC free article] [PubMed] [Google Scholar]
- 38.Ansel KM, Harris RB & Cyster JG CXCL13 is required for B1 cell homing, natural antibody production, and body cavity immunity. Immunity 16, 67–76 (2002). [DOI] [PubMed] [Google Scholar]
- 39.Koscso B. et al. Gut-resident CX3CR1(hi) macrophages induce tertiary lymphoid structures and IgA response in situ. Sci. Immunol. 5, eaax0062. (2020). [DOI] [PMC free article] [PubMed] [Google Scholar]
- 40.Tiedt R, Schomber T, Hao-Shen H. & Skoda RC Pf4-Cre transgenic mice allow the generation of lineage-restricted gene knockouts for studying megakaryocyte and platelet function in vivo. Blood 109, 1503–1506 (2007). [DOI] [PubMed] [Google Scholar]
- 41.Han J. et al. Human serous cavity macrophages and dendritic cells possess counterparts in the mouse with a distinct distribution between species. Nat. Immunol. 25, 155–165 (2024). [DOI] [PMC free article] [PubMed] [Google Scholar]
- 42.Domingo-Gonzalez R. et al. Diverse homeostatic and immunomodulatory roles of immune cells in the developing mouse lung at single cell resolution. eLife 9, e56890 (2020). [DOI] [PMC free article] [PubMed] [Google Scholar]
- 43.Li Z. et al. Single-cell transcriptomics of mouse lung reveal inflammatory memory neutrophils in allergic asthma. Allergy 77, 1911–1915 (2022). [DOI] [PubMed] [Google Scholar]
- 44.Zepp JA et al. Genomic, epigenomic, and biophysical cues controlling the emergence of the lung alveolus. Science 371, eabc3172 (2021). [DOI] [PMC free article] [PubMed] [Google Scholar]
- 45.Stephenson E. et al. Single-cell multi-omics analysis of the immune response in COVID-19. Nat. Med. 27, 904–916 (2021). [DOI] [PMC free article] [PubMed] [Google Scholar]
- 46.Maier B. et al. A conserved dendritic-cell regulatory program limits antitumour immunity. Nature 580, 257–262 (2020). [DOI] [PMC free article] [PubMed] [Google Scholar]
- 47.Lee SH et al. Dermis resident macrophages orchestrate localized ILC2 eosinophil circuitries to promote non-healing cutaneous leishmaniasis. Nat. Commun. 14, 7852 (2023). [DOI] [PMC free article] [PubMed] [Google Scholar]
- 48.Kim JS et al. A binary Cre transgenic approach dissects microglia and CNS border-associated macrophages. Immunity 54, 176–190 (2021). [DOI] [PubMed] [Google Scholar]
- 49.Gibbings SL & Jakubzick CV Isolation and characterization of mononuclear phagocytes in the mouse lung and lymph nodes. Methods Mol. Biol 1809, 33–44 (2018). [DOI] [PMC free article] [PubMed] [Google Scholar]
- 50.Jakubzick C, Helft J, Kaplan TJ & Randolph GJ Optimization of methods to study pulmonary dendritic cell migration reveals distinct capacities of DC subsets to acquire soluble versus particulate antigen. J. Immunol. Methods 337, 121–131 (2008). [DOI] [PMC free article] [PubMed] [Google Scholar]
- 51.Bosnjak B. et al. MCK2-mediated MCMV infection of macrophages and virus dissemination to the salivary gland depends on MHC class I molecules. Cell Rep. 42, 112597 (2023). [DOI] [PubMed] [Google Scholar]
- 52.Brinkman EK, Chen T, Amendola M. & van Steensel B. Easy quantitative assessment of genome editing by sequence trace decomposition. Nucleic Acids Res. 42, e168 (2014). [DOI] [PMC free article] [PubMed] [Google Scholar]
- 53.R Development Core Team. R: a language and environment for statistical computing (R Foundation for Statistical Computing, 2014). [Google Scholar]
- 54.Hao Y. et al. Integrated analysis of multimodal single-cell data. Cell 184, 3573–3587 (2021). [DOI] [PMC free article] [PubMed] [Google Scholar]
- 55.Marini F. & Binder H. pcaExplorer: an R/Bioconductor package for interacting with RNA-seq principal components. BMC Bioinform. 20, 331 (2019). [DOI] [PMC free article] [PubMed] [Google Scholar]
- 56.Rantakari P. et al. Fetal liver endothelium regulates the seeding of tissue-resident macrophages. Nature 538, 392–396 (2016). [DOI] [PubMed] [Google Scholar]
- 57.Soetaert K. plot3D: plotting multi-dimensional data (2021). [Google Scholar]
- 58.Wickham H. ggplot2: Elegant Graphics For Data Analysis (Springer, 2016). [Google Scholar]
- 59.Crow M, Paul A, Ballouz S, Huang ZJ & Gillis J. Characterizing the replicability of cell types defined by single cell RNA-sequencing data using MetaNeighbor. Nat. Commun. 9, 884 (2018). [DOI] [PMC free article] [PubMed] [Google Scholar]
- 60.Gu Z, Eils R. & Schlesner M. Complex heatmaps reveal patterns and correlations in multidimensional genomic data. Bioinformatics 32, 2847–2849 (2016). [DOI] [PubMed] [Google Scholar]
- 61.La Manno G. et al. RNA velocity of single cells. Nature 560, 494–498 (2018). [DOI] [PMC free article] [PubMed] [Google Scholar]
- 62.Zhang H. SCP: Single Cell Pipeline (2023). [Google Scholar]
- 63.Trapnell C. et al. The dynamics and regulators of cell fate decisions are revealed by pseudotemporal ordering of single cells. Nat. Biotechnol. 32, 381–386 (2014). [DOI] [PMC free article] [PubMed] [Google Scholar]
- 64.Qiu X. et al. Single-cell mRNA quantification and differential analysis with Census. Nat. Methods 14, 309–315 (2017). [DOI] [PMC free article] [PubMed] [Google Scholar]
- 65.Qiu X. et al. Reversed graph embedding resolves complex single-cell trajectories. Nat. Methods 14, 979–982 (2017). [DOI] [PMC free article] [PubMed] [Google Scholar]
- 66.Cao J. et al. The single-cell transcriptional landscape of mammalian organogenesis. Nature 566, 496–502 (2019). [DOI] [PMC free article] [PubMed] [Google Scholar]
- 67.Huynh-Thu VA, Irrthum A, Wehenkel L. & Geurts P. Inferring regulatory networks from expression data using tree-based methods. PLoS ONE 5, e12776 (2010). [DOI] [PMC free article] [PubMed] [Google Scholar]
- 68.Van de Sande B. et al. A scalable SCENIC workflow for single-cell gene regulatory network analysis. Nat. Protoc. 15, 2247–2276 (2020). [DOI] [PubMed] [Google Scholar]
Associated Data
This section collects any data citations, data availability statements, or supplementary materials included in this article.
Supplementary Materials
Data Availability Statement
The sequencing raw data and processed data used in this article are available in the Gene Expression Omnibus under accession code GSE193782 (hBAL)9 and Super Series GSE225668 (mLu and all others). The processed data are also available for online visualization at https://ams-supercluster.cells.ucsc.edu, https://cells.ucsc.edu/?ds=ln-mono-dc and https://cells.ucsc.edu/?ds=lung-interstitial-macrophage. In addition to our in-house datasets, we incorporated several publicly available datasets for auxiliary analyses. For confirmation of IM subsets, we consulted dataset GSE179276 (ref. 33), as illustrated in Extended Data Fig. 6. Furthermore, the specificity of Pf4 and Cx3cr1 expression in IMs was corroborated by referencing datasets GSE147668 (ref. 42), Inflammatory Memory Neutophils in Asthma (ref. 43), GSE149563 (ref. 44) and E.MTAB.10026 (ref. 45), as presented in Extended Data Fig. 9, whose visualizations with complete cell types labels are also available on a different dataset depository at https://app.lungmap.net/app/shinycell-mm-timecourse, https://cells.ucsc.edu/?ds=mouse-lung-immune, https://cells.ucsc.edu/?ds=mouse-asthma+all-cells and https://cells.ucsc.edu/?ds=covid19-pbmc. Source data are provided with this paper.


