Abstract
BACKGROUND:
Atrial fibrillation (AF) is associated with an increased risk of stroke, yet the limitations of conventional monitoring have restricted our understanding of AF burden risk thresholds. Predictive algorithms incorporating continuous AF burden measures may be useful for predicting stroke. This study evaluated the performance of temporal AF burden trends as predictors of stroke from a large cohort with insertable cardiac monitors.
METHODS:
Using deidentified data from Optum Clinformatics Data Mart (2007–2019) linked with the Medtronic CareLink insertable cardiac monitor database, we identified patients with an insertable cardiac monitor for AF management (n=1197), suspected AF (n=1611), and cryptogenic stroke (n=2205). Daily AF burden was transformed into simple moving averages, and temporal AF burden trends were defined as the comparison of unique simple moving average pairs. Classification trees were used to predict ischemic stroke, and AF burden significance was quantified using bootstrapped mean variable importance.
RESULTS:
Of 5013 patients (age, 69.2±11.7 years; 50% male; CHA2DS2-VASc, 3.7±1.9) who met inclusion criteria, 869 had an ischemic stroke over 2 409 437 days total follow-up. Prior stroke or transient ischemic attack (variable importance, 13.13) was the number 1 predictor of future stroke followed by no prior diagnosis of AF (7.35) and AF burden trends in follow-up (2.59). Temporal proximity of AF and risk of stroke differed by device indication (simple moving averages: AF management, <8 days and suspected AF and cryptogenic stroke, 8–21 days). Together, baseline characteristics and AF burden trends performed optimally for the area under the receiver operating characteristic curve (0.73), specificity (0.70), and relative risk (5.00).
CONCLUSIONS:
AF burden trends may provide incremental prognostic value as leading indicators of stroke risk compared with conventional schemes.
Keywords: atrial fibrillation, stroke, thromboembolism, time factors
WHAT IS KNOWN?
There is a known association between subclinical atrial fibrillation (AF) and stroke, with the risk of stroke modified by the total amount or burden of AF.
WHAT THE STUDY ADDS
AF burden trends may be a better predictor of stroke than daily AF burden thresholds.
Efforts to evaluate and implement atrial arrhythmia and device data into stroke risk prediction should be so in conjunction with traditional risk factors.
The association of AF burden trends and stroke risk likely differs by device indication, with a shorter window occurring more frequently for AF management (<8 days) and a longer window for cryptogenic stroke (>13 days).
While the association between atrial fibrillation (AF) and stroke is well established, our understanding of the temporal associations of AF and stroke and the duration of AF and stroke is incomplete.1 Prior studies using cardiovascular implantable electronic devices have shown an association between subclinical AF and thromboembolic risk. These data have demonstrated an increased risk of stroke with the presence of subclinical AF,2,3 with the risk of stroke modified by the total burden or amount of subclinical AF.4–8 Moreover, the combination of AF duration and CHA2DS2-VASc score has been shown to risk-stratify patients and help guide stroke prevention therapy.9,10
Historically, studies investigating the relationship between AF duration and stroke all share a common methodology: they focus on AF duration within a given follow-up interval to the subsequent risk of stroke.11 While these prior studies have provided important observations that have improved our understanding of AF-related stroke, the categorization of nominal AF burden thresholds and extended time-to-event durations do not allow for the description of more complex temporal trends of AF that may predict stroke. Accordingly, the objective of the present study was to evaluate the importance of AF burden features using machine learning techniques (undersampling/oversampling, bootstrapping, and classification trees) to predict daily ischemic stroke risk in patients from a large, retrospective cohort with insertable cardiac monitors (ICMs).
Methods
Study Cohort
To examine the temporal association of AF trends and stroke, we linked ICM and administrative claims data including patient characteristics and clinical outcomes. Patients were included if they had a Medtronic Reveal XT or LINQ ICM with a corresponding device implant indication for (1) AF management, (2) clinical concern for suspected AF, or (3) the occurrence of cryptogenic stroke as determined by the implanting physician (Figure S1). To test for the impact of the device model on these analyses, statistical models were conducted both with and without the inclusion of Medtronic Reveal XT devices. No statistical differences were observed, and Medtronic Reveal XT devices were included in the analysis.
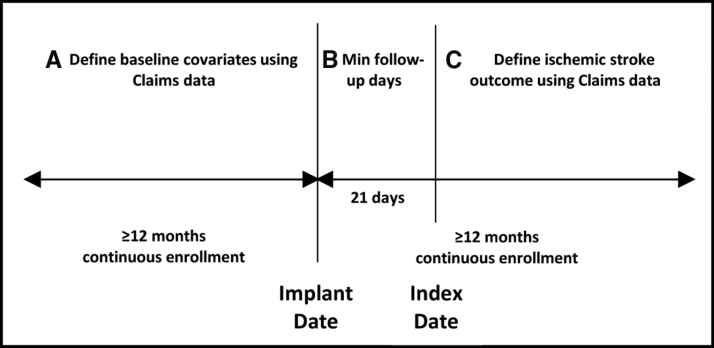
Deidentified data from Optum Clinformatics Data Mart (2007–2019), which contains deidentified claim data from multiple hospitals in the United States, were linked to the Medtronic CareLink database of ICMs. Patients aged ≥18 years, without dual Medicare and Medicaid eligibility, were included if they had at least 12 months of continuous claims enrollment before and after the device implant. The study design is shown in Figure 1. An index date was nominally assigned 21 days after ICM implantation to initialize a time series for each device parameter. Patients with an ischemic stroke post-implantation were included if the first event occurred after the initialization period and with continuous enrollment (Figure 1, period C). Due to the data use agreement with Optum, the data cannot be made available to other researchers for purposes of reproducing the results or replicating the procedure.
Figure 1.
Study design. An index date was nominally assigned at 21 days after insertable cardiac monitor implantation to initialize a time series for each diagnostic device parameter. Patients with an ischemic stroke post-implantation were included if the first event occurred after the initialization period and with continuous enrollment (period C).
Definitions of Comorbidities, Risk Factors, and Treatment
A patient was considered to have a claims history if there was an acute, inpatient, diagnosis code date, or 2 outpatient diagnosis code dates, separated at least 30 days apart, associated with the patient before the implant date. Table S1 presents diagnosis codes for each condition of interest. The CHA2DS2-VASc score was calculated before the implant date using the same list of diagnosis codes. Anticoagulation therapy was defined as a claim history of an oral anticoagulation (OAC) prescription for warfarin, apixaban, edoxaban, dabigatran, or rivaroxaban. OAC 90 days before device implantation and OAC post-device implantation were accounted for as separate binary (yes/no) indicators.
Outcomes
The occurrence of ischemic stroke was defined by an acute event with the occurrence of a diagnosis code10,12,13 (Table S1) or a diagnosis-related group code for ischemic stroke (061, 062, and 063) from an inpatient or outpatient hospital, emergency room, or ambulatory surgical center (place of service equal to 21, 22, 23, or 24, respectively) or by an inpatient hospitalization with a diagnosis-related group code for ischemic stroke (061, 062, and 063). In the event of multiple strokes in an individual, the first occurrence was recorded as the primary outcome. If the stroke date for a patient occurred within 28 days of a preceding hospitalization, the patient was excluded from the cohort to avoid confounding with zero levels of activity due to hospitalization. A 2-tailed Z test was used to test the difference for each baseline characteristic between patients without ischemic stroke and patients with ischemic stroke groups. The test assumed unequal variances for continuous variables and equality of proportions (binomial distribution) for discrete variables.
Derivation of Diagnostic AF Data
The primary ICM detection device parameters of interest included daily total atrial tachycardia (AT)/AF burden (hours/d), total patient activity (minutes/d), average ventricular rate (bpm) measured from midnight to 4:00 am (night) and from 8:00 am to 8:00 pm (day), and heart rate variability (measured as the SD of the 5-minute relative risk medians over a 24-hour period). The minimum detection duration required to register an AT/AF event was 2 minutes. To avoid bias from missed AT/AF events, patients with <21 days of daily follow-up after implant, or with a gap in follow-up ≥30 days, were excluded from the cohort. Missing data resulting from a gap in daily follow-up were interpolated by forward-filling the last known value for each device parameter. Follow-up was limited to 2 years.
To determine AF burden trends, each device parameter was evaluated as a cumulative moving average (CMA) from the day after implant and as a simple moving average (SMA) of different clinical windows (1, 2, 3, 5, 8, 13, and 21 days) starting 21 days after implant. For device parameter d at time t,
where t denotes days after implant and p denotes the SMA period. A prior study investigating the short-term effects of daily AF burden on heart failure showed that a short-term trend in AF burden, defined as taking the offset between the 7-period SMA and the CMA, was a reliable risk factor for heart failure.14 Extending this methodology to the present study, each moving average was compared with the other moving averages to create a unique combination of 28 offset variables for each device parameter.
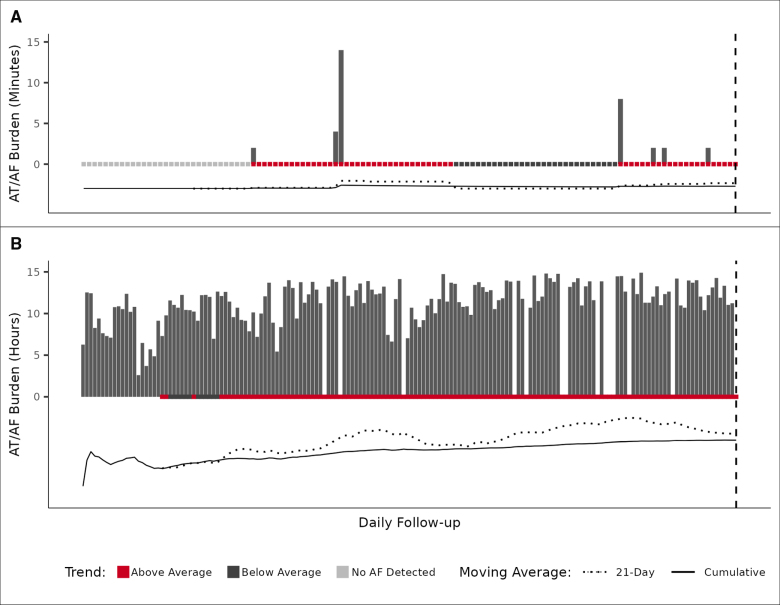
An AF burden trend, defined as the offset of 2 moving averages, has 3 novel features that aid in describing the association between AF and stroke risk. First, it can account for an acute change in AF (Figure 2A: when one moving average crosses another) and a sustained trend (Figure 2B: when one moving average remains greater than another). Second, the offsets selected by the model fitting exercise may provide insight into the temporal relationship between AF and stroke risk. Finally, a comparison of moving averages describes relative changes in daily AF burden that might not be accounted for by traditional AF burden risk thresholds.
Figure 2.
Atrial tachycardia (AT)/atrial fibrillation (AF) burden temporal trends. The comparison of a 21-day simple moving average (SMA) with its cumulative moving average (CMA) shows when the daily AT/AF burden amount is above or below average. The onset of relative risk occurs when the SMA crosses above the CMA, remains elevated when the SMA is greater than the CMA, and ends when the SMA crosses below the CMA. The trend is sensitive to a relative increase in daily AT/AF burden (A) and longer periods of increasing burden (B). The patients in both examples experienced an ischemic stroke on the last day of follow-up; follow-up dates were different for each example.
Predictive Modeling
Machine learning analysis was performed to identify the variable importance of AF burden trends. Patients were randomly divided into 2 groups: 70% for training and 30% for validation. A decision tree classifier (rpart) was used to predict which follow-up days had an occurrence of ischemic stroke using baseline characteristics, CHA2DS2-VASc score, device parameters, and moving average offsets (SMAa−SMAb) as predictors. Variable importance was calculated as the goodness-of-fit for each predictor across a decision tree. The trained model was applied to the validation data, and discrimination was calculated using the area under the receiver operating characteristic curve (AUC) of the receiver operating characteristic. To minimize bias and improve classifier accuracy, we repeated this process 1000 times using the bootstrap method (Supplemental Methods). For analysis, variable importance was calculated as the bootstrapped mean for each predictor. Bar plots of the bootstrapped mean were used to compare the difference in variable importance for each predictor. The bootstrapped mean was calculated for AUC, sensitivity, specificity, negative predictive value, and positive predictive value. These estimates were used as metrics to compare the predictive performance of different model structures. For AUC comparison, models were ranked by mean AUC and tested with a separate bootstrap (iterations, 10 000) to estimate the probability of equal means between successive models. All analyses were performed with R software, version 3.6.0. Data sets were deidentified before analysis as defined by Health Insurance Portability and Accountability Act in 45 Code of Federal Regulations Sec. 164.514(b), and institutional review board review exemption was obtained.
Results
Baseline Characteristics
Among 229 653 patients with ICM with linked claims and ICM data, 5013 patients met our inclusion criteria (Figure S1), including 4852 (97%) LINQ devices and 161 (3%) REVEAL XT devices. In this group, there were 2871 (57.3%) patients with device-detected AF, 869 (17.3%) patients who experienced an ischemic stroke, 276 (5.5%) patients with device-detected AF who experienced a stroke, and 593 (11.8%) patients without device-detected AF who experienced a stroke. The median AF burden was 56 minutes (25th, 75th; 8 minutes, 534 minutes).
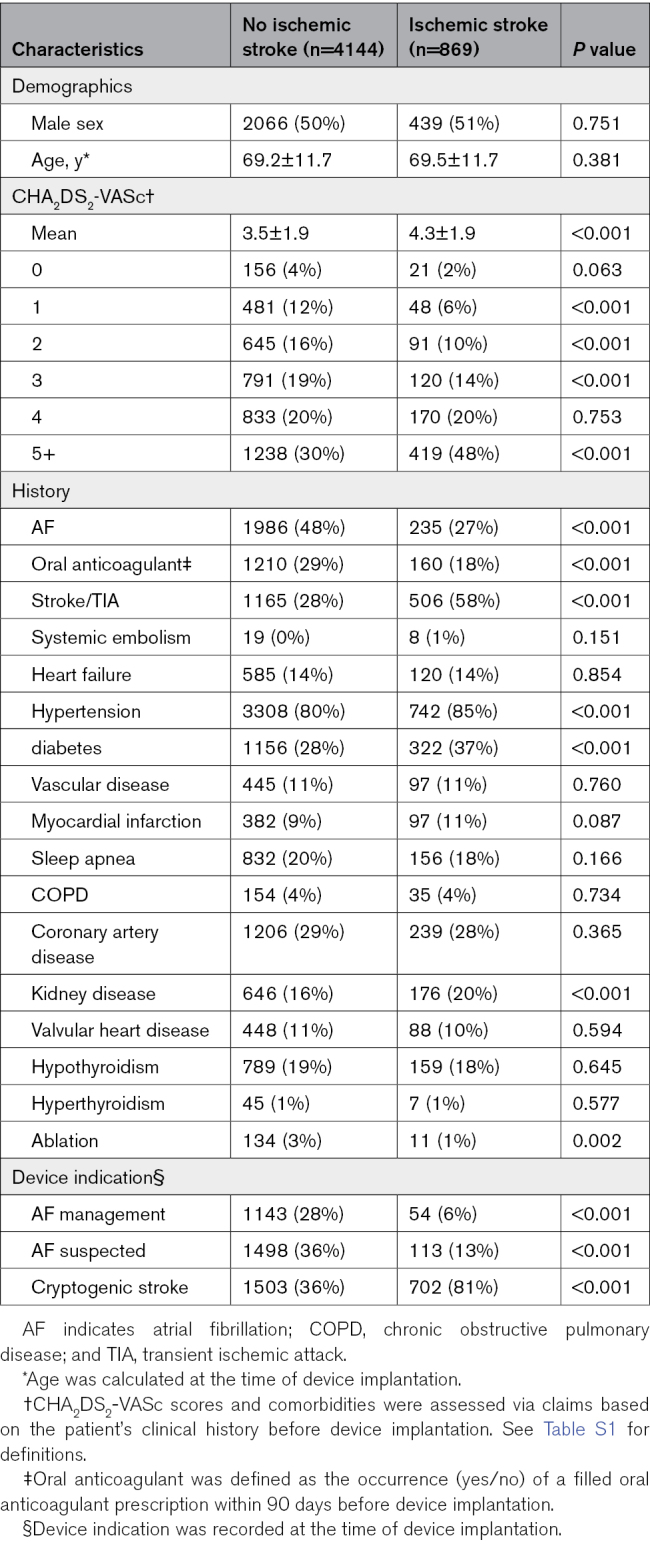
Table 1 presents the baseline characteristics of the patients according to the occurrence of ischemic stroke events. Overall, the mean age of the cohort was 69.2±11.7 years, and 50% of the cohort was female. Patients who experienced an ischemic stroke had higher mean CHA2DS2-VASc scores (4.3±1.9 versus 3.5±1.9; P<0.001) and more often had chronic kidney disease (20% versus 16%; P<0.001). Patients with an ischemic stroke more frequently had a higher rate of prior stroke/transient ischemic attack (TIA), hypertension, and diabetes. Patients with ischemic stroke were less likely to have a prior diagnosis of AF (27% versus 48%; P<0.001), less likely to be treated with OAC (18% versus 29%; P<0.001), and were much more likely to have had their device implanted for monitoring after cryptogenic stroke (81% versus 36%; P<0.001).
Table 1.
Baseline Demographics
Follow-Up
There were 2 409 437 total patient days of follow-up with an average of 150±166 days for patients with an ischemic stroke event and 550±199 days for patients without an ischemic stroke event. The number of patients with a gap in follow-up was 1016 (20%); the average gap size was 7.3±6.9 days. Patients with an ischemic stroke were less likely to have a gap in follow-up (6% versus 23%; P<0.001), and in patients with ischemic stroke with a gap, their average gap size was shorter compared with those without an ischemic stroke (5.6 days versus 7.3 days; P<0.001).
Factors Associated With Stroke
Figure S2 illustrates the mean importance of each variable in the analysis via a convergence plot. As shown in Figure S2, prior stroke/TIA, no history of AF, and device parameters were the most frequently selected as predictors, accounting for over 98% of all selections. All features except ablation, sleep apnea, and valvular heart disease reached convergence within 1000 iterations. Given the low variable importance and selection frequency of these 3 variables, 1000 bootstraps were considered sufficient for the remainder of the analysis.
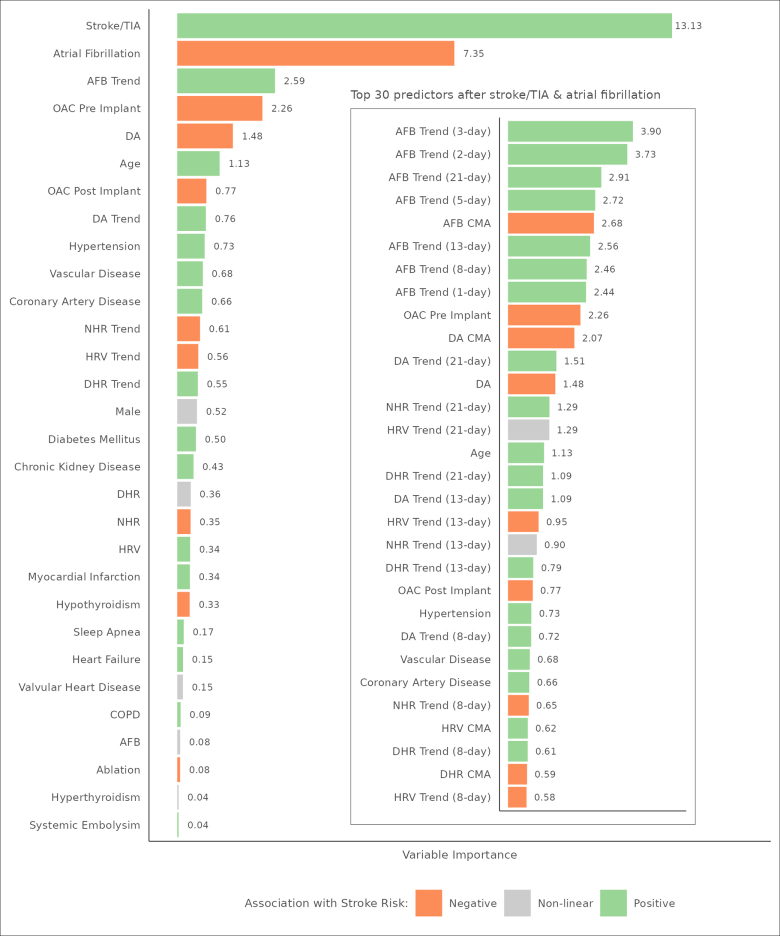
We also examined the importance of each variable as a function of their contribution to the overall prediction analysis relative to other variables. Figure 3 provides a bar plot of mean variable importance, scaled as a percent of total variable importance, for each feature in the analysis. Prior stroke/TIA (13.13) was the number 1 predictor of future stroke followed by no prior diagnosis of AF (7.35). The presence of AF at device implantation was partially correlated with prior stroke (Pearson ρ, −0.18; P<0.001) as a function of device indication; there was no significant correlation between no prior diagnosis of AF and prior stroke when controlling for cryptogenic stroke device indication (Pearson partial correlation ρ, −0.02; P<0.001). The next best predictor was AF burden trends (2.59).
Figure 3.
Mean variable importance by feature. This figure provides a bar plot of mean variable importance, scaled as a percent of total variable importance, and a color-coded association with stroke risk for each feature in the analysis. For ease of presentation, device parameters show aggregate variable importance across all their respective features. The inset presents the top 30 individual features after stroke/transient ischemic attack (TIA) and history of atrial fibrillation (AF) that were selected as predictors. All trends are defined as the p-day simple moving average offset by its cumulative moving average. AFB indicates atrial fibrillation burden; COPD, chronic obstructive pulmonary disease; DA, daily activity; DHR, daytime heart rate; HRV, heart rate variability; NHR, nighttime heart rate; and OAC, oral anticoagulation.
The inset in Figure 3 presents the top 30 individual features after stroke/TIA and AF that were selected as predictors. All temporal trends in this group were defined as a p-day SMA offset by its CMA. Seven of the top 10 features describe trends of increasing AF burden amount without any clear priority for the window of the trend. The next best set of features, heart rate, and daily activity parameters, on the other hand, showed patterns of an increasing trend with a priority for longer windows (≥13 days). The CMA of daily AF burden was also a top 10 predictor and was negatively associated with stroke risk. To test this association, the maximum AF burden amount during follow-up was included in a principal components analysis, along with demographic, baseline, and stroke event covariates. Prior diagnosis of AF (0.72), maximum AF burden amount (0.69), prior OAC use (0.63), prior stroke (−0.46), and future ischemic stroke (−0.45) were identified as the second of 4 components, having an explained variance of 28%. Patients with more AF were more likely to have undergone OAC therapy before device implantation and were less likely to experience a future stroke. As a result, patients with a maximum AF burden of <1 hour during follow-up had a much higher rate of stroke than their counterparts who had a maximum AF burden of ≥1 hour on follow-up (23.2% versus 7.3%; P<0.001).
To examine how well the model would perform for patients with known AF, a sensitivity analysis was performed on patients with an AF management device indication (Figure S3). Increasing AF burden trends (0.82) was the sixth most important aggregate predictor preceded by a history of stroke/TIA (6.12), sleep apnea (2.30), age (1.04), diabetes (0.88), and decreasing activity levels (0.84). AF burden trends comprised 5 of the top 10 individual predictors (without any clear priority for the window of the trend) followed by increasing short-term trends in daily activity level (trend window ≤8 days). Sensitivity results were similar to results from the overall analysis but with a shift in variable importance from AF burden trends to baseline characteristics and daily activity levels.
Temporal Relationship Between AF Burden and Stroke
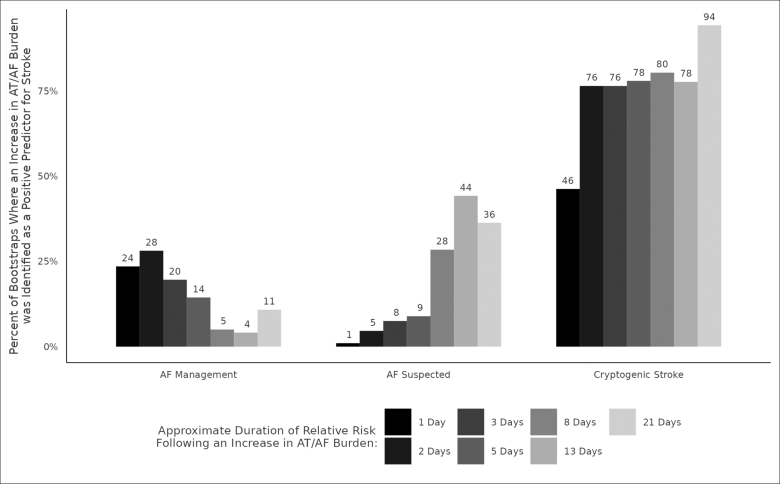
We also examined the temporal relationship between AF burden and ischemic stroke risk. Figure 4 shows the percentage of time that an increase in AF burden was a positive predictor for stroke, arranged by device indication and the period of AF burden temporal trend. AF management prioritized shorter periods (1–5 days) more frequently than longer periods and cryptogenic stroke prioritized a longer period (21 days) more frequently than shorter periods. While a 21-day SMA, offset with its CMA, was the most robust AF burden trend across device indications, its frequency of selection as a predictor differed by indication, occurring 94% of the time for cryptogenic stroke and 11% of the time for AF management.
Figure 4.
Temporal association of atrial tachycardia (AT)/atrial fibrillation (AF) burden trend and stroke risk. The temporal relationship between AT/AF burden and ischemic stroke risk differed by device indication with AF management prioritizing shorter durations of risk (1–5 days) more frequently than longer durations and cryptogenic stroke selecting a longer duration of risk (21 days) more frequently than shorter durations. While a 21-day simple moving average, offset with its cumulative moving average was the most robust temporal trend across device indications (Figure 3, inset), its frequency of selection as a predictor differed by indication, occurring 94% of the time for cryptogenic stroke and 11% of the time for AF management.
Factors Associated With Ischemic Stroke Relative to the CHA2DS2-VASc Score
We also analyzed predictors of stroke in the context of the current guideline-recommended risk stratification system: the CHA2DS2-VASc score. Figure S4 provides mean variable importance for the CHA2DS2-VASc score and all remaining features in the analysis. CHA2DS2-VASc score (7.23) was the number 1 predictor of future stroke followed by an absence of prior AF diagnosis (6.14) and trends of increasing AF burden (2.85). Prior stroke/TIA accounted for 64.0% of CHA2DS2-VASc variable importance followed by age (23.8%) and diabetes (4.3%).
The inset in Figure S4 presents the top 30 individual features after the CHA2DS2-VASc score and AF that were selected as predictors at least 5% of the time. AF burden trends, such as those in a previous analysis (Figure 3), represented seven of the top 10 predictors.
Model Performance for the Prediction of Ischemic Stroke
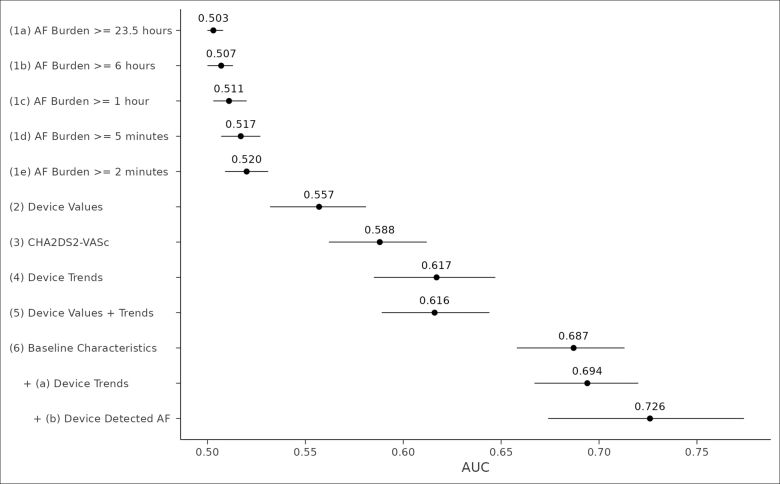
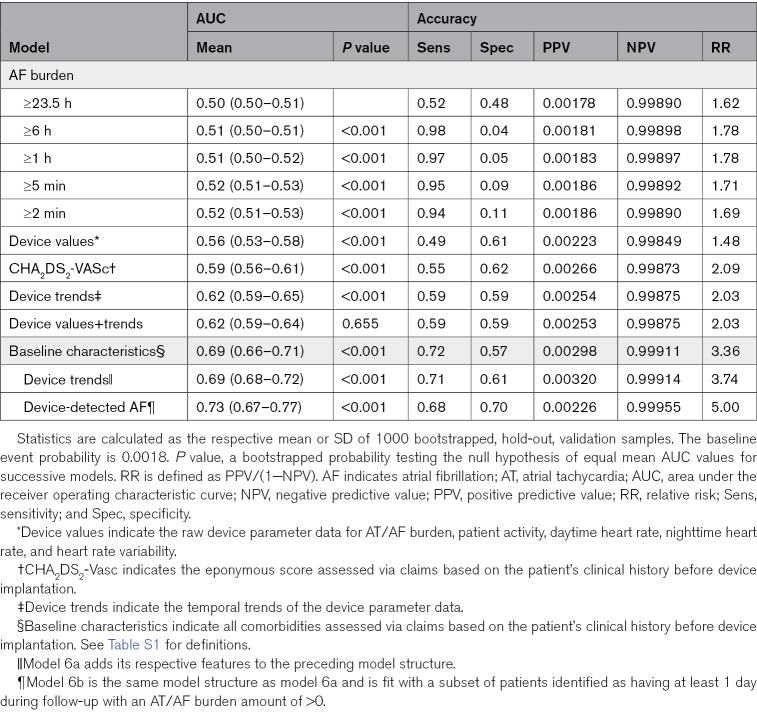
We used the AUC to assess how well different models could predict the risk of ischemic stroke within 5 days after follow-up for a given patient. Figure 5 presents an error bar plot of mean AUC performance for 12 different models. Ranked AUC values present 5 distinct groupings: models 1a to 1e: traditional AF burden thresholds; model 2: raw device parameter values for daily activity, time in AT/AF, daytime heart rate, nighttime heart rate, and heart rate variability; models 3 to 6: CHA2DS2-VASc score, device AF burden trends, as well as their corresponding raw parameter values, and baseline characteristics; model 6a: baseline characteristics and device temporal trends; and model 6b: baseline characteristics and AF burden trends for patients with at least 1 day of device-detected AF during follow-up. The change in validation statistics for each model and grouping is shown in Table 2.
Figure 5.
Mean area under the receiver operating characteristic curve (AUC) by model structure. This error bar plot shows the mean AUC and 95% credible interval from 1000 bootstrapped, hold-out validation samples for 12 different model structures. Device values indicate the raw device parameter data for atrial tachycardia (AT)/atrial fibrillation (AF) burden, patient activity, daytime heart rate, nighttime heart rate, and heart rate variability; device trends; the temporal trends of the device parameter data; CHA2DS2-Vasc, the eponymous score assessed via claims based on the patient’s clinical history before device implantation; and baseline characteristics, all comorbidities assessed via claims based on the patient’s clinical history before device implantation. Model 6a adds its respective features to the preceding model structure. Model 6b is the same model structure as model 6a and fits with a subset of patients identified as having at least 1 day during follow-up with an AT/AF burden amount of >0.
Table 2.
Discrimination and Accuracy of Prediction Models
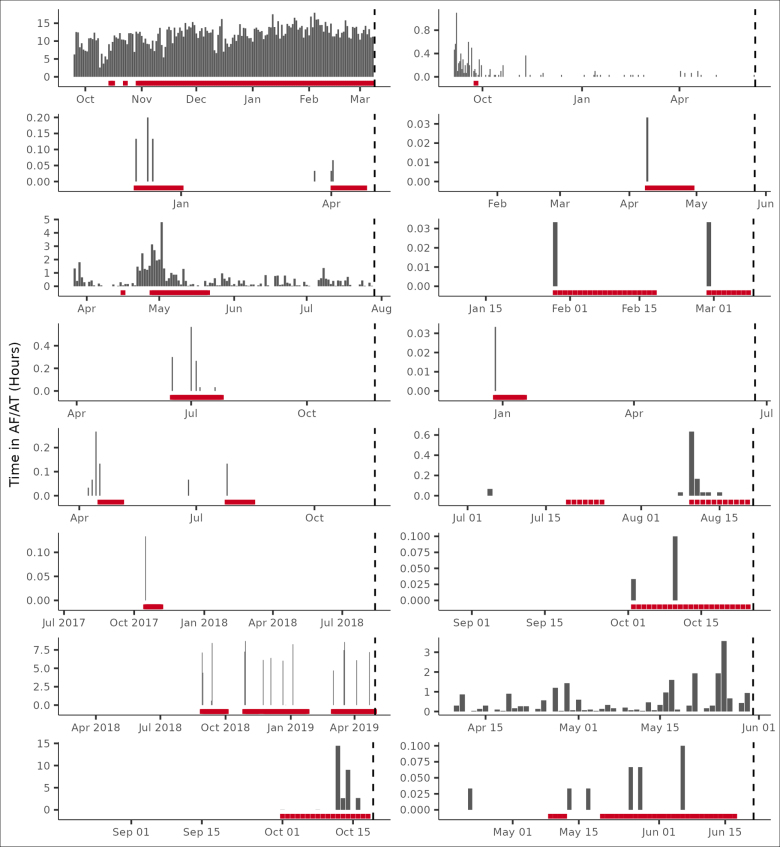
The comparison of AUC across models demonstrates 3 results. First, lower levels of AF burden had greater discriminatory power than higher levels. Second, while device parameter values had greater discriminatory power than traditional thresholds2,3,5,8,15,16 (0.557 versus 0.520; P<0.001), they did not provide additional discriminatory capacity to AF burden trends (0.616 versus 0.617; P=0.655). Third, baseline characteristics (AUC, 0.687) had greater discriminatory power than any of the device-based features, including traditional AF burden thresholds. However, when patient characteristics were combined with AF burden trends, specifically for patients with device-detected AT/AF, the AUC, specificity, and relative risk of the models improved (AUC, 0.694–0.726 depending on the combination; Table 2). This remained true for a sensitivity analysis performed on patients with an AF management device indication (AUC, 0.69; specificity, 0.84; and relative risk, 6.74). To illustrate specific examples, we considered a random sample of 16 patients having a CHA2DS2-VASc score >3 and the occurrence of ischemic stroke (Figure 6).
Figure 6.
Random sample of atrial fibrillation (AF) burden temporal trends and signaled ischemic stroke risk. Shown are data from a random sample of 16 patients having a CHA2DS2-VASc score >3 and the occurrence of ischemic stroke. The x axis represents follow-up days from the day after device implantation through the day before the stroke event. Risk, denoted in red, is signaled after a relative increase in atrial tachycardia (AT)/AF burden and turned off/on by the daily AT/AF burden 21-day simple moving average crossing below/above its cumulative moving average. A correct classification is shown when any of the last 5 follow-up days is signaled at risk.
Discussion
In this analysis, we demonstrated that the addition of AF burden trends to baseline patient characteristics improves discrimination and specificity for the prediction of ischemic stroke. In 5013 patients with linked clinical and ICM data, recursive partitioning and regression demonstrate that the addition of AF diagnostic trends to baseline patient characteristics improves the prediction of ischemic stroke. There are several important findings in this analysis. First, daily AT/AF burden thresholds defined in previous analyses, while sensitive to the occurrence of stroke, are not specific. Second, baseline patient characteristics outperformed the CHA2DS2-VASc score and its standard approach to weighting risk factors. Third, the combination of patient characteristics and device-detected AF resulted in the best discrimination (AUC, 0.726). Finally, the optimal window for AT/AF events predicting future stroke varies according to the treatment indication.
Patients with AF are at risk for increased cardiovascular events, including increased risks of hospitalization, new-onset heart failure, and ischemic events. Accurate prediction of these events is important to optimize prevention strategies and personalize care to achieve optimal outcomes. Prediction of cardiovascular events in patients with AF has been challenging. In particular, the prediction of stroke is complicated due to competing mechanisms in those with multiple vascular risk factors.17 Current guideline-recommended risk stratification schemes correctly identify those at risk for stroke 50% to 65% of the time and exhibit significant variation in predicted event rates across populations.18 The addition of information on the density and pattern of AF has been suggested as a potential way to improve risk stratification for stroke.19 Alternatively, the temporal association of significant amounts of AF has also been shown to be associated with increased risks of AF-related stroke.20,21
Continuous monitoring data from ICMs afford an optimal opportunity to evaluate the relation between trends of AF burden and the occurrence of stroke. In this analysis, we found that daily AT/AF burden thresholds lack specificity despite being sensitive to the occurrence of stroke. While different durations of AF may serve as useful markers or reference thresholds in screening efforts, they have significant shortcomings for the accurate prediction of the occurrence of stroke in individual patients. In this analysis, AF burden trends were more closely associated with stroke. Among AF burden trends, the trends with the highest mean variable importance after a prior history of stroke or TIA were the SMA of AF burden offset by the CMA over 2, 3, 5, 8, 13, or 21 days. These AF burden trends, as analyzed here, present a novel method of evaluating risk by accounting for both long-term disease progression in addition to more acute changes associated with near-term temporal risk of adverse clinical events. By assessing AF burden trends on an individualized basis, opportunities for more specific and timely clinical interventions are possible through a personalized approach to patient risk. Evaluation of OAC use in this analysis was noted to reduce the incidence of stroke among individuals who were characterized as high stroke risk, providing optimism that the targeted application of OAC using these moving averages could be utilized to guide personalized intervention strategies, such as a pill-in-the-pocket approach to intermittent OAC. However, this hypothesis will need to be tested in adequately powered and rigorous randomized trials.22,23
It is interesting, although not entirely surprising, that the performance of individual AF measurements exhibited distinctive risk prediction in different populations with implanted ICMs. The temporal relationship between AF burden and ischemic stroke risk also differed by device indication. In patients with known AF, shorter windows (1–5 days) of AF burden trends were prioritized more frequently than longer periods. In contrast, in patients with cryptogenic stroke, a longer period (21 days) was prioritized more frequently than shorter windows of AF burden trends. This difference may be due to a higher cumulative AF burden in those with known or established AF. Patients with less AF may require a wider lens for observation compared with patients with higher degrees of AF, where a more focused window is more informative. It is important to emphasize that a 21-day SMA, offset with its CMA, was the most robust AF burden trend across device indications.
Despite continuous rhythm monitoring data, clinical risk factors achieved the best discrimination for future stroke. The CHA2DS2-VASc score alone had an AUC of 0.588 compared with an AUC of 0.503 to 0.520 for AF burden and 0.557 for raw device parameter values. However, the combination of baseline characteristics and device-detected AF resulted in the best discrimination with an AUC of 0.726 (Table 2). These results suggest that future efforts to evaluate and implement atrial arrhythmia and device data into stroke risk prediction should be so in conjunction with traditional risk factors. The results from these analyses suggest that the use of CHA2DS2-VASc with a patient’s 21-day average of AF burden tracking above their CMA would represent a significant improvement over standard risk estimation. Again, this is a hypothesis that should be tested in a prospective trial. The prospective DEFINE AFib (DEFINE Atrial Fibrillation) study will enroll patients with AF or suspected AF who have an ICM and will evaluate whether summary and episodic measurements collected by ICMs are able to predict when patients are at increased risk for adverse clinical outcomes, including stroke (NCT04926857).
Limitations
There are several limitations that should be kept in mind when considering the results of this study. First, all patients in this analysis had an ICM that was implanted during clinical care for AF, suspected AF, or evaluation of cryptogenic stroke. Arrhythmia events were classified by device algorithm and not adjudicated by clinical experts. Therefore, the findings may or may not be generalizable to patients with other cardiac implanted electronic devices or other diagnostic devices such as wearables. Second, as this was a study of events in clinical practice, using administrative claims for the outcomes assessment, it is possible that some patients may have experienced nonischemic strokes or other misclassification; however, prior work suggests that diagnostic codes for ischemic stroke have good sensitivity (86%) and specificity (95%).12 Finally, our analysis included patients with treated and untreated stroke risk. We included OAC status in our candidate variables. While prior work has shown that predictors of stroke are similar in those with and without OAC,24 separate validations in treated and untreated patients would be optimal. Finally, due to the nature of this retrospective analysis, an exhaustive list of risk factors (ie, diet, smoking history, and body mass index) was not included as those data were not captured in the database.
Conclusions
In this analysis of >5000 patients with an ICM implanted for suspected AF, management of AF, or cryptogenic stroke, prior stroke was the most important predictor of future stroke in follow-up. After prior stroke, AF burden trends (not daily AF burden alone) were the most important predictors of stroke. The optimal moving average window differed by device indication and was shorter in patients with known AF and longer in patients with cryptogenic stroke. In this real-world data set of patients with an ICM, AF burden trends may provide incremental prognostic value to conventional risk stratification schemes.
ARTICLE INFORMATION
Sources of Funding
This analysis was funded by Medtronic.
Disclosures
Dr Piccini was supported by grant R01AG074185 from the National Institutes of Aging and grants for clinical research from Abbott, the American Heart Association, the Association for the Advancement of Medical Instrumentation, Bayer, Boston Scientific, iRhythm, and Philips and serves as a consultant to Abbott, Abbvie, Ablacon, Altathera, ARCA Biopharma, Biotronik, Boston Scientific, Bristol Myers Squibb, LivaNova, Medtronic, Milestone, ElectroPhysiology Frontiers, Pfizer, Sanofi, Philips, and Up-to-Date. Dr Hylek serves as a consultant to Bayer, Bristol Myers Squibb, Ionis, Janssen, and Pfizer and received research grants from Abbott, Anthos Therapeutics, and Medtronic and honoraria from Boehringer Ingelheim. Dr Lakkireddy serves as a consultant to Medtronic, Boston Scientific, Abbott, AtriCure, AltaThera, Acutus, and AliveCor. Dr Mittal serves as a consultant to Abbott, Boston Scientific, and Medtronic. Dr Peacock serves as a consultant to Medtronic and Biotronik. Dr Russo serves as a consultant to Abbot, AtriCure, Bayer, Biosense Webster, Boston Scientific, Medtronic, and PaceMate and received grants for clinical research from Boston Scientific, Kestra, Medilynx, and Medtronic and honoraria from Biotronik, Bristol Myers Squibb, Pfizer, Medtronic, and Sanofi. Dr Passman was supported by grant UG3HL165065 from the National Heart, Lung, and Blood Institute, grant 18SFRN34250013 from the American Heart Association, and a grant for clinical research from Abbott; serves as a consultant to Medtronic, Janssen Pharmaceuticals, and Abbott; and receives royalties from Up-To-Date. E.J. Stanelle, Dr Johnson, R. Kanwar, and D. Soderlund are employed by Medtronic. M.T. Hills reports no conflicts.
Supplemental Material
Supplemental Methods
Table S1
Figures S1–S4
Supplementary Material
Nonstandard Abbreviations and Acronyms
- AF
- atrial fibrillation
- AT
- atrial tachycardia
- AUC
- area under the receiver operating characteristic curve
- CMA
- cumulative moving average
- ICM
- insertable cardiac monitor
- OAC
- oral anticoagulation
- SMA
- simple moving average
- TIA
- transient ischemic attack
This manuscript was sent to Andrew E. Epstein, MD, Guest Editor, for review by expert referees, editorial decision, and final disposition.
For Sources of Funding and Disclosures, see page 784.
Supplemental Material is available at https://www.ahajournals.org/doi/suppl/10.1161/CIRCEP.123.012394.
Contributor Information
Evan J. Stanelle, Email: evan.j.stanelle@medtronic.com.
Elaine M. Hylek, Email: ehylek@bu.edu.
Rahul Kanwar, Email: rahul.kanwar@medtronic.com.
Suneet Mittal, Email: mittsu@valleyhealth.com.
James Peacock, Email: james.peacock@gmail.com.
Andrea M. Russo, Email: russo-andrea@cooperhealth.edu.
Dana Soderlund, Email: danasoderlund@gmail.com.
Mellanie True Hills, Email: mhills@stopafib.org.
References
- 1.January CT, Wann LS, Alpert JS, Calkins H, Cigarroa JE, Cleveland JC, Jr, Conti JB, Ellinor PT, Ezekowitz MD, Field ME, et al. 2014 AHA/ACC/HRS guideline for the management of patients with atrial fibrillation: executive summary: a report of the American College of Cardiology/American Heart Association Task Force on Practice Guidelines and the Heart Rhythm Society. Circulation. 2014;130:2071–2104. doi: 10.1161/cir.0000000000000040 [DOI] [PubMed] [Google Scholar]
- 2.Glotzer TV, Hellkamp AS, Zimmerman J, Sweeney MO, Yee R, Marinchak R, Cook J, Paraschos A, Love J, Radoslovich G, et al. ; MOST Investigators. Atrial high rate episodes detected by pacemaker diagnostics predict death and stroke: report of the Atrial Diagnostics Ancillary Study of the MOde Selection Trial (MOST). Circulation. 2003;107:1614–1619. doi: 10.1161/01.CIR.0000057981.70380.45 [DOI] [PubMed] [Google Scholar]
- 3.Healey JS, Connolly SJ, Gold MR, Israel CW, Van Gelder IC, Capucci A, Lau CP, Fain E, Yang S, Bailleul C, et al. Subclinical atrial fibrillation and the risk of stroke. N Engl J Med. 2012;366:120–129. doi: 10.1056/NEJMoa1105575 [DOI] [PubMed] [Google Scholar]
- 4.Capucci A, Santini M, Padeletti L, Gulizia M, Botto G, Boriani G, Ricci R, Favale S, Zolezzi F, Di Belardino N, et al. ; Italian AT500 Registry Investigators. Monitored atrial fibrillation duration predicts arterial embolic events in patients suffering from bradycardia and atrial fibrillation implanted with antitachycardia pacemakers. J Am Coll Cardiol. 2005;46:1913–1920. doi: 10.1016/j.jacc.2005.07.044 [DOI] [PubMed] [Google Scholar]
- 5.Glotzer TV, Daoud EG, Wyse DG, Singer DE, Ezekowitz MD, Hilker C, Miller C, Qi D, Ziegler PD. The relationship between daily atrial tachyarrhythmia burden from implantable device diagnostics and stroke risk: the TRENDS study. Circ Arrhythm Electrophysiol. 2009;2:474–480. doi: 10.1161/CIRCEP.109.849638 [DOI] [PubMed] [Google Scholar]
- 6.Shanmugam N, Boerdlein A, Proff J, Ong P, Valencia O, Maier SK, Bauer WR, Paul V, Sack S. Detection of atrial high-rate events by continuous home monitoring: clinical significance in the heart failure-cardiac resynchronization therapy population. Europace. 2012;14:230–237. doi: 10.1093/europace/eur293 [DOI] [PMC free article] [PubMed] [Google Scholar]
- 7.Vanassche T, Lauw MN, Eikelboom JW, Healey JS, Hart RG, Alings M, Avezum A, Diaz R, Hohnloser SH, Lewis BS, et al. Risk of ischaemic stroke according to pattern of atrial fibrillation: analysis of 6563 aspirin-treated patients in ACTIVE-A and AVERROES. Eur Heart J. 2015;36:281–288. doi: 10.1093/eurheartj/ehu307 [DOI] [PubMed] [Google Scholar]
- 8.Van Gelder IC, Healey JS, Crijns H, Wang J, Hohnloser SH, Gold MR, Capucci A, Lau CP, Morillo CA, Hobbelt AH, et al. Duration of device-detected subclinical atrial fibrillation and occurrence of stroke in ASSERT. Eur Heart J. 2017;38:1339–1344. doi: 10.1093/eurheartj/ehx042 [DOI] [PubMed] [Google Scholar]
- 9.Botto GL, Padeletti L, Santini M, Capucci A, Gulizia M, Zolezzi F, Favale S, Molon G, Ricci R, Biffi M, et al. Presence and duration of atrial fibrillation detected by continuous monitoring: crucial implications for the risk of thromboembolic events. J Cardiovasc Electrophysiol. 2009;20:241–248. doi: 10.1111/j.1540-8167.2008.01320.x [DOI] [PubMed] [Google Scholar]
- 10.Kaplan RM, Koehler J, Ziegler PD, Sarkar S, Zweibel S, Passman RS. Stroke risk as a function of atrial fibrillation duration and CHA2DS2-VASc score. Circulation. 2019;140:1639–1646. doi: 10.1161/CIRCULATIONAHA.119.041303 [DOI] [PubMed] [Google Scholar]
- 11.Han L, Askari M, Altman RB, Schmitt SK, Fan J, Bentley JP, Narayan SM, Turakhia MP. Atrial fibrillation burden signature and near-term prediction of stroke: a machine learning analysis. Circ Cardiovasc Qual Outcomes. 2019;12:e005595. doi: 10.1161/CIRCOUTCOMES.118.005595 [DOI] [PMC free article] [PubMed] [Google Scholar]
- 12.Tirschwell DL, Longstreth WT, Jr. Validating administrative data in stroke research. Stroke. 2002;33:2465–2470. doi: 10.1161/01.str.0000032240.28636.bd [DOI] [PubMed] [Google Scholar]
- 13.Gialdini G, Nearing K, Bhave PD, Bonuccelli U, Iadecola C, Healey JS, Kamel H. Perioperative atrial fibrillation and the long-term risk of ischemic stroke. JAMA. 2014;312:616–622. doi: 10.1001/jama.2014.9143 [DOI] [PMC free article] [PubMed] [Google Scholar]
- 14.Tanawuttiwat T, Lande J, Smeets P, Gerritse B, Nazarian S, Guallar E, Cheng A. Atrial fibrillation burden and subsequent heart failure events in patients with cardiac resynchronization therapy devices. J Cardiovasc Electrophysiol. 2020;31:1519–1526. doi: 10.1111/jce.14444 [DOI] [PubMed] [Google Scholar]
- 15.Boriani G, Glotzer TV, Santini M, West TM, De Melis M, Sepsi M, Gasparini M, Lewalter T, Camm JA, Singer DE. Device-detected atrial fibrillation and risk for stroke: an analysis of >10,000 patients from the SOS AF project (Stroke preventiOn Strategies based on Atrial Fibrillation information from implanted devices). Eur Heart J. 2014;35:508–516. doi: 10.1093/eurheartj/eht491 [DOI] [PMC free article] [PubMed] [Google Scholar]
- 16.Gladstone DJ, Spring M, Dorian P, Panzov V, Thorpe KE, Hall J, Vaid H, O’Donnell M, Laupacis A, Cote R, et al. ; EMBRACE Investigators and Coordinators. Atrial fibrillation in patients with cryptogenic stroke. N Engl J Med. 2014;370:2467–2477. doi: 10.1056/NEJMoa1311376 [DOI] [PubMed] [Google Scholar]
- 17.Stroke Risk in Atrial Fibrillation Working G. Comparison of 12 risk stratification schemes to predict stroke in patients with nonvalvular atrial fibrillation. Stroke. 2008;39:1901–1910. doi: 10.1161/STROKEAHA.107.501825 [DOI] [PubMed] [Google Scholar]
- 18.Shah SJ, Eckman MH, Aspberg S, Go AS, Singer DE. Effect of variation in published stroke rates on the net clinical benefit of anticoagulation for atrial fibrillation. Ann Intern Med. 2018;169:517–527. doi: 10.7326/m17-2762 [DOI] [PubMed] [Google Scholar]
- 19.Go AS, Reynolds K, Yang J, Gupta N, Lenane J, Sung SH, Harrison TN, Liu TI, Solomon MD. Association of burden of atrial fibrillation with risk of ischemic stroke in adults with paroxysmal atrial fibrillation: the KP-RHYTHM study. JAMA Cardiol. 2018;3:601–608. doi: 10.1001/jamacardio.2018.1176 [DOI] [PMC free article] [PubMed] [Google Scholar]
- 20.Turakhia MP, Ziegler PD, Schmitt SK, Chang Y, Fan J, Than CT, Keung EK, Singer DE. Atrial fibrillation burden and short-term risk of stroke: case-crossover analysis of continuously recorded heart rhythm from cardiac electronic implanted devices. Circ Arrhythm Electrophysiol. 2015;8:1040–1047. doi: 10.1161/CIRCEP.114.003057 [DOI] [PubMed] [Google Scholar]
- 21.Singer DE, Ziegler PD, Koehler JL, Sarkar S, Passman RS. Temporal Association between episodes of atrial fibrillation and risk of ischemic stroke. JAMA Cardiol. 2021;6:1364–1369. doi: 10.1001/jamacardio.2021.3702 [DOI] [PMC free article] [PubMed] [Google Scholar]
- 22.Waks JW, Passman RS, Matos J, Reynolds M, Thosani A, Mela T, Pederson D, Glotzer TV, Zimetbaum P. Intermittent anticoagulation guided by continuous atrial fibrillation burden monitoring using dual-chamber pacemakers and implantable cardioverter-defibrillators: Results from the Tailored Anticoagulation for Non-Continuous Atrial Fibrillation (TACTIC-AF) pilot study. Heart Rhythm. 2018;15:1601–1607. doi: 10.1016/j.hrthm.2018.06.027 [DOI] [PubMed] [Google Scholar]
- 23.Passman R, Leong-Sit P, Andrei AC, Huskin A, Tomson TT, Bernstein R, Ellis E, Waks JW, Zimetbaum P. Targeted anticoagulation for atrial fibrillation guided by continuous rhythm assessment with an insertable cardiac monitor: the rhythm evaluation for anticoagulation with continuous monitoring (REACT.COM) pilot study. J Cardiovasc Electrophysiol. 2016;27:264–270. doi: 10.1111/jce.12864 [DOI] [PMC free article] [PubMed] [Google Scholar]
- 24.Piccini JP, Stevens SR, Chang Y, Singer DE, Lokhnygina Y, Go AS, Patel MR, Mahaffey KW, Halperin JL, Breithardt G, et al. ; ROCKET AF Steering Committee and Investigators. Renal dysfunction as a predictor of stroke and systemic embolism in patients with nonvalvular atrial fibrillation: validation of the R(2)CHADS(2) index in the ROCKET AF (Rivaroxaban Once-daily, oral, direct factor Xa inhibition Compared with vitamin K antagonism for prevention of stroke and Embolism Trial in Atrial Fibrillation) and ATRIA (AnTicoagulation and Risk factors In Atrial fibrillation) study cohorts. Circulation. 2013;127:224–232. doi: 10.1161/CIRCULATIONAHA.112.107128 [DOI] [PubMed] [Google Scholar]
- 25.Therneau TM, Atkinson EJ, Ripley B. Package “recursive partitioning and regression trees.” 2019.
- 26.Therneau TM, Atkinson EJ. An Introduction to recursive partitioning using the recursive partitioning and regression trees routines. 2019.
- 27.He HB, Garcia EA. Learning from imbalanced data. Ieee T Knowl Data En. 2009;21:1263–1284. [Google Scholar]
- 28.Estabrooks A, Jo TH, Japkowicz N. A multiple resampling method for learning from imbalanced data sets. Comput Intell-Us. 2004;20:18–36. [Google Scholar]
- 29.Tiwari P, Colborn KL, Smith DE, Xing F, Ghosh D, Rosenberg MA. Assessment of a machine learning model applied to harmonized electronic health record data for the prediction of incident atrial fibrillation. JAMA Netw Open. 2020;3:e1919396. doi: 10.1001/jamanetworkopen.2019.19396 [DOI] [PMC free article] [PubMed] [Google Scholar]
Associated Data
This section collects any data citations, data availability statements, or supplementary materials included in this article.


