Abstract
Under asymmetric three-dimensional high in-situ stress and high pore water pressure, tunnels are subjected to complex stress conditions, making them susceptible to failure and posing a threat to water conveyance safety. This study focuses on a large-scale cross-basin water diversion tunnel from Datong river into Huangshui river, which characterized by ultra-deep and complex geological conditions. Based on the field measurement data, a parameter inversion method considering the deformation of tunnel surrounding rock at multiple characteristic points is proposed. Additionally, considering the fluid-structure interaction effects under the influence of asymmetrical three-dimensional high in-situ stress and high pore water pressure, the stress-deformation characteristics of the soft rock tunnel are studied, and the damage evolution characteristics of the surrounding rock under different in-situ stresses and pore water pressures are analyzed. The results manifest that intense mutual extrusion of the surrounding rock, leading to volumetric compression, is the primary cause of the formation of stress concentration and excess pore water pressure. Additionally, the maximum deformation and the most likely location for gushing water both occur at the tunnel’s waist. After the implementation of segment support measures, the deformation control effect on the surrounding rock is remarkable. Notably, the reduction in damage depth across various characteristic locations due to segment support shows minimal variation. However, in terms of the reduction in disturbance depth, the tunnel waist significantly outperforms the top and bottom positions. The damage depth of the tunnel surrounding rock is positively correlated with both in-situ stress and pore water pressure, but it is more significantly influenced by in-situ stress than by pore water pressure. These findings can offer some valuable insights and guidance for future similar tunnel construction project.
Keywords: Ultra-deep soft rock tunnels, Parameter inversion, Fluid-structure interaction, Stress and deformation characteristics, Disturbance and damage
Subject terms: Engineering, Civil engineering
Introduction
To address the demands of rapid economic growth and rectify the uneven distribution of water resources across various regions, numerous tunnels1–6 with large burial depths, long tunnel lines, large diameters, and complex geological conditions have been constructed worldwide. This proliferation of tunnels has significantly mitigated the challenges associated with transregional energy and resource transportation, playing a crucial role in the economic development of numerous regions. They have become an integral component of contemporary society’s rapid advancement7–10. However, as tunnel construction projects venture deeper and into the realm of ultra-deep areas11, they unavoidably confront complex geological and stress conditions12,13. For example, in extremely deep-buried areas, the in-situ stress may reach tens to hundreds of MPa14, accompanied by high pore water pressures (> 3 MPa). In some soft or extremely soft rock tunnels, the saturated compressive strength of the rock mass is also at a relatively low level (soft rock: 30 to 5 MPa, extremely soft rock: <5 MPa). These factors lead to increasingly prominent geotechnical hazards such as large deformations of the surrounding rock, gushing water, and gushing mud during tunnels construction15–22. These challenges undoubtedly increase the complexity and operational risks of engineering construction and pose more complex scientific and technological problems23. Consequently, it is imperative to conduct an investigation into the stress and deformation characteristics of the surrounding rock in ultra-deep tunnels subjected to complex stress and high pore-water pressure.
Many experts and scholars have examined the stability of surrounding rock under intricate conditions. For instance, Agan24 through studied the geological conditions and large deformation characteristics of soft rock in the Suruc water conveyance tunnel in Turkey, found that rock mass strength, tectonic stress, and groundwater are important factors affecting large deformations in surrounding rocks. Liu et al.25 explored the features of surrounding rock pressure and the mechanisms behind deformation pressure formation in the deeply buried tunnels. They relied on field test data concerning the development of tunnel geological structures, surrounding rock pressure, and rock deformation in sections with burial depths exceeding 500 m. Guo26 used a combination of theoretical analysis and on-site monitoring feedback results to analyze the excavation deformation mechanisms and deformation patterns of tunnel surrounding rocks under extremely high in-situ stress. Li et al.27 focused on investigating the significant deformation mechanisms of underground rock tunnels under the influence of complex strata and weak interlayers, and explored the opportunities for constructing secondary primary linings. Liu et al.28 concluded that deep burial and high in-situ stress put the rock mass in a complex stress state. For hard and brittle rock masses like diorite and marble, the influence of structural planes is significantly reduced during excavation, with the rock mass primarily responding by transitioning from deformation to failure.
Although these research findings have significantly advanced the analysis of tunnel structure deformation characteristics and stability control, there is still a lack of studies focusing on the deformation and damage characteristics of ultra-deep buried soft rock tunnels under the coupling effects of asymmetric three-dimensional high in-situ stress and high pore water pressure. Additionally, in current numerical simulation analyses of deep-buried soft rock tunnel excavation, the physical and mechanical calculation parameters of the surrounding rock are mostly obtained through laboratory tests or empirical methods. This often results in a considerable discrepancy between the obtained parameters and the actual properties of the surrounding rock, making it difficult to ensure the reliability of the calculation results29.
Therefore, this paper draws upon field monitoring data and employs a parameter inversion method, considering the deformation of various characteristic points within the tunnel, to analyze the physical and mechanical parameters of the surrounding rock. This approach ensures the reliability of subsequent calculation results. Furthermore, by considering the fluid-solid coupling effects under asymmetric three-dimensional high in-situ stress and high pore water pressure, a three-dimensional numerical model is established under different simulation conditions at an 800-meter depth. The study investigates the stress deformation, disturbance, and damage characteristics of the tunnel surrounding rock in both the presence and absence of segment support. Additionally, the formation mechanism of excess pore water pressure, the distribution of seepage velocity vectors, and the effectiveness of segments as support structures are discussed in detail. The study also analyzes the damage evolution characteristics of the surrounding rock under different in-situ stress and pore water pressure conditions. The results reveal the stress deformation and damage characteristics of ultra-deep soft rock tunnels under the coupling effects of asymmetric three-dimensional high in-situ stress and high pore water pressure.
Numerical simulation specification
Project introduction and deformation monitoring arrangement
Project introduction
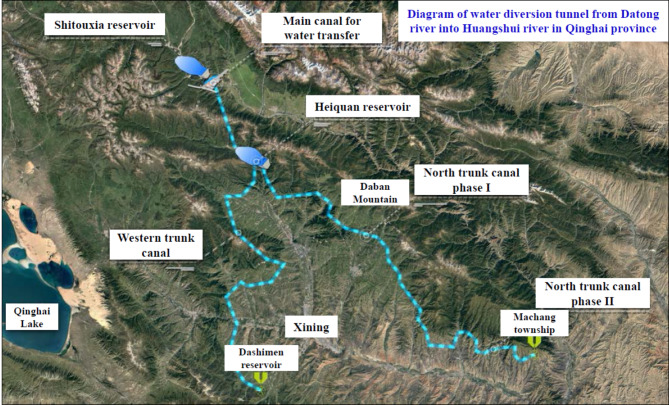
The water diversion tunnel from Datong river into Huangshui river is a large Type-II inter-basin water diversion project located in Qinghai Province, China. It comprises the main canal for water diversion, Shitouxia Reservoir, Heiquan Reservoir, and the first phase of the North Canal, etc. (Fig. 1). This project diverts water from the Datong River across the Daban Mountain into the Huangshui River Basin, providing residential and industrial water supply to Xining City and the Beichuan Industrial Area.
Fig. 1.
Diagram of water diversion tunnel from Datongriver into Huangshui river in Qinghai province.
The diversion tunnel is a key control project of the main canal for water diversion, with a total length of 21.71 km and a maximum burial depth of 1100 m. The tunnel passes through Daban Mountain, where the geological conditions are extremely complex. TBM (Tunnel Boring Machine) is primary method employed for construction. The excavation shape of the tunnel is circular, boasting a diameter of 5.93 m, with a supporting segment (C50) thickness of 0.30 m. During the construction process, a 0.10 m expansion clearance is maintained between the segment and tunnel wall (Fig. 2b).
Fig. 2.
Diagram of engineering geological and tunnel excavation section.
The proposed research area is significantly influenced by the F5 Southern Margin Fault Zone of Daban Mountain (Fig. 2a), with an average burial depth of 830 m. The F5 fault zone is a deep and extensive fault, trending in a NWW direction and extending up to 500 km. It is characterized as a thrust fault with a strike direction of 290° to 305°. South of the fault lies the Lower Proterozoic metamorphic rock series, while to the north are Silurian schists, slates, and Caledonian intrusive rocks. The fault zone consists of cataclastic rocks, mylonites, and fault gouge, with well-developed joints, and is classified as soft rock. Under high in-situ stress, the surrounding rock exhibits significant plastic deformation. The primary geotechnical issues in this project include asymmetric three-dimensional high in-situ stress, fault fracture zones, and high pore water pressure.
Deformation monitoring arrangement
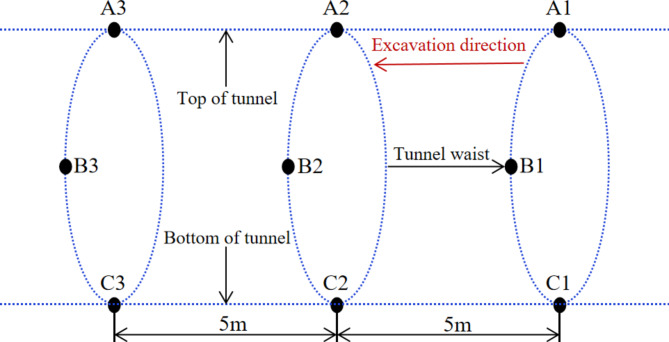
The main deformation section of the tunnel segments is concentrated around the stake numbers K17 + 151 to K17 + 192, with a deformation zone spanning approximately 41 m. To comprehensively assess the deformation of the surrounding rock after excavation and the installation of support structures in this section, deformation measurement points are strategically positioned at intervals within the research section. These measurement points are organized into three groups, with an interval of 5 m between each group. Each group comprising measurements at three locations: the top, waist, and bottom of the tunnel (Fig. 3). The deformation monitoring section is set to correspond to the area with the maximum segment deformation in this tunnel section.
Fig. 3.
Arrangement of measuring points for section deformation monitoring.
Numerical model and calculation method
Numerical model
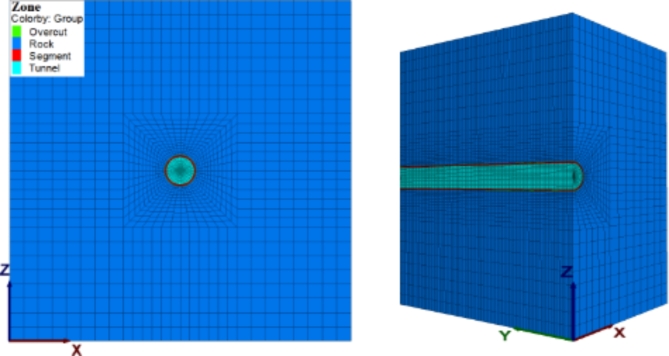
Considering the specific engineering conditions of the research section, a three-dimensional finite difference numerical model is constructed (Fig. 4). The X-axis denotes the vertical hole axis, the Y-axis corresponds to the parallel hole axis, and the Z-axis signifies the vertical direction from top to bottom due to gravity. In this software, to ensure that boundary effects do not compromise the reliability of calculation results, the model’s calculation range is set to 3 to 5 tunnel diameters30,31. Starting from the tunnel excavation boundary, the model spans 30 m upward, downward, left, and right, resulting in a final model size of 40 m × 65.93 m × 65.93 m. The model comprises hexahedral mesh elements totaling 139,520 computational units.
Fig. 4.
Three-dimensional finite-difference computational model.
The model’s overall length is 40 m, with a simulated excavation length of 20 m. Within the model, the rock mass, supporting segments, and reserved expansion clearance are represented by solid units. To accurately simulate the mechanical conduct of the reserved expansion clearance, the deformation modulus and strength parameters were adjusted to closely resemble foam within the computational framework.
Calculation method
In the fluid-structure interaction calculation process, the rock mass is treated as an equivalent continuous medium, where fluid flow within the medium satisfies the Biot equations and follows Darcy’s Law. Additionally, when utilizing the finite difference method to calculate fluid-structure interaction, encompassing several key Eqs32–36: the equilibrium equation, motion equation, constitutive equation, compatibility equation, and boundary conditions。The specific steps for the fluid-structure interaction numerical analysis in this paper are as follows:
Establish a three-dimensional model of the initial stratum and apply boundary constraints for displacement, stress, and seepage.
Write and execute a program to apply the initial three-dimensional asymmetric in-situ stress and pore water pressure. Perform iterative calculations until equilibrium is achieved to simulate the initial stress state of the surrounding rock in the tunnel.
Define parameters such as permeability coefficient and fluid modulus for seepage analysis. Convert the resulting seepage body force into nodal loads, which are then applied to the stress analysis.
Perform the tunnel excavation, simultaneously setting up the segment structure elements. Conduct iterative calculations until the system reaches equilibrium.
Initial in-situ stress field and computational boundary conditions
Extensive long-term in-situ stress measurements have revealed distinct asymmetric three-dimensional stress conditions within deep rock engineering37–40. Compared with shallow rock engineering, stress redistribution caused by excavation has a more pronounced impact on the stability of deep rock masses, further complicating the stress dynamics surrounding the tunnel41,42. Examination of in-situ stress field test results for this tunnel section reveals that the horizontal principal stress dominates, with relationship among them as follows:  , and
, and  ,
,  , and
, and  represent the directions of the parallel, vertical–vertical, and horizontal–vertical tunnel axes, respectively. Clearly, the in-situ stress field exhibits pronounced asymmetric three-dimensional stress characteristics. The three-dimensional asymmetric principal stresses were applied to the model’s boundaries and element nodes using a calculation program written in the software’s built-in language during the computation.
To accurately reflect real-world engineering conditions, the model is subjected to appropriate boundary conditions. Specifically, the model’s bottom is fixed, while its front, back, right, and left sides are restricted in the normal direction and the top remains free. In the context of fluid-structure coupling analysis, the model features impervious boundaries at the back and front, while the right and left sides, along with the open excavation face, are equipped with permeable boundaries.
Simulated condition settings
Two calculation conditions for the water pipe segment are established for comparative analysis to investigate the tunnel’s stability within the context of ultra-deep weak strata and assess the effectiveness of segment support measures under these geological conditions. The simulation conditions are delineated in Table 2. Furthermore, as the collection of monitoring data on surrounding rock deformation occurred after the completion of segment support construction, subsequent numerical inversion analysis of the physical and mechanical parameters of the tunnel rock mass is performed under the simulated conditions of working Condition 2.
Table 2.
Initial calculation parameters of rock mass and segment.
| Types | Density ρ (kg/m3) |
Elastic modulus E (GPa) |
Bulk modulus K (GPa) |
Shear modulus G (GPa) |
Cohesion C (MPa) |
Friction angle φ (°) |
Poisson’s ratio μ |
Permeability coefficient k (cm/s) |
|---|---|---|---|---|---|---|---|---|
| Surrounding rock | 2680 | 2.58 | 1.95 | 1.01 | 1.34 | 22.80 | 0.28 | 1.2 × 10⁻⁴ |
| Segment (C50) | 2450 | 34.50 | 17.27 | 14.78 | – | – | 0.167 | – |
In Table 1,  represents the distance between the original static water level of groundwater in specific tunnel sections within the study area and the tunnel floor, which amounts to approximately 700 m.
  represents the reduction coefficient for external water pressure. The studied section of the tunnel is located within a large fault zone and is generally fractured due to structural influences, the groundwater connectivity is relatively high. Taking into account the gushing water observed during its construction process and following the determination table for the external water pressure reduction coefficient in the Specification for Design of Hydraulic Tunnel (SL 279–2016)43, the value range is from 0.65 to 1.0. This study takes 0.8 for analysis. Therefore, the external water pressure value in the calculation condition considering the effect of groundwater is 5.60 MPa.
Table 1.
Calculation of working condition setting scheme.
| Condition | Whether to consider segment support | Asymmetric three-dimensional stress | External water pressure | Calculation mode |
|---|---|---|---|---|
| 1 | No |

|

|
Fluid-structure interaction |
| 2 | Yes |
Inversion of the computational parameters
Given the influence of surrounding rock characteristics, multi-field coupling, size effects, and other factors, conventional rock mass testing techniques often fail to accurately represent the physical and mechanical parameters of the tunnel rock mass under actual conditions. Therefore, this paper employs parameter inversion theory and numerical calculation methods, combined with field fragment deformation monitoring data from the tunnel, to conduct an inverse analysis of the computational parameters required for the surrounding rock.
Parameter inversion method
According to the calculation parameters required for simulation analysis, the inversion parameters in this paper are determined as follows:
 |
1 |
where E represents the elastic modulus, φ denotes the internal friction angle, c stands for the cohesive force, µ represents the Poisson’s ratio, and k signifies the permeability coefficient.
Given the arrangement of in-situ deformation monitoring positions at the segment’s bottom, waist, and top, the convergence of the three characteristic measuring points is expressed as follows:
 |
2 |
where  ,
, ,
, ,
,  ,
,  ,
,  (i = 1, 2, 3), represent the convergence values of in-situ deformation monitoring at tunnel section measurement points.
During numerical computational analysis, the convergence of the three characteristic measuring points (M) depends on the computational parameters (S) of the tunnel rock mass, denoted as:
 |
3 |
By considering a set of parameters (S) to be solved, the calculated deformation convergence values of the three characteristic measuring points can be obtained through numerical simulation:
 |
4 |
Based on the permissible range of parameters to be inverted, the deformation convergence values of the three characteristic measuring points for the tunnel under different parameter combinations are calculated. This is achieved by minimizing the absolute sum of the differences between these calculated values and the field monitoring values as follows:
 |
5 |
Through numerical simulation, when a set of computational parameters for the rock mass yields the minimum value of  , it is considered that these parameters closely approximate the true physical and mechanical parameters of the tunnel rock mass.
Laboratory test results
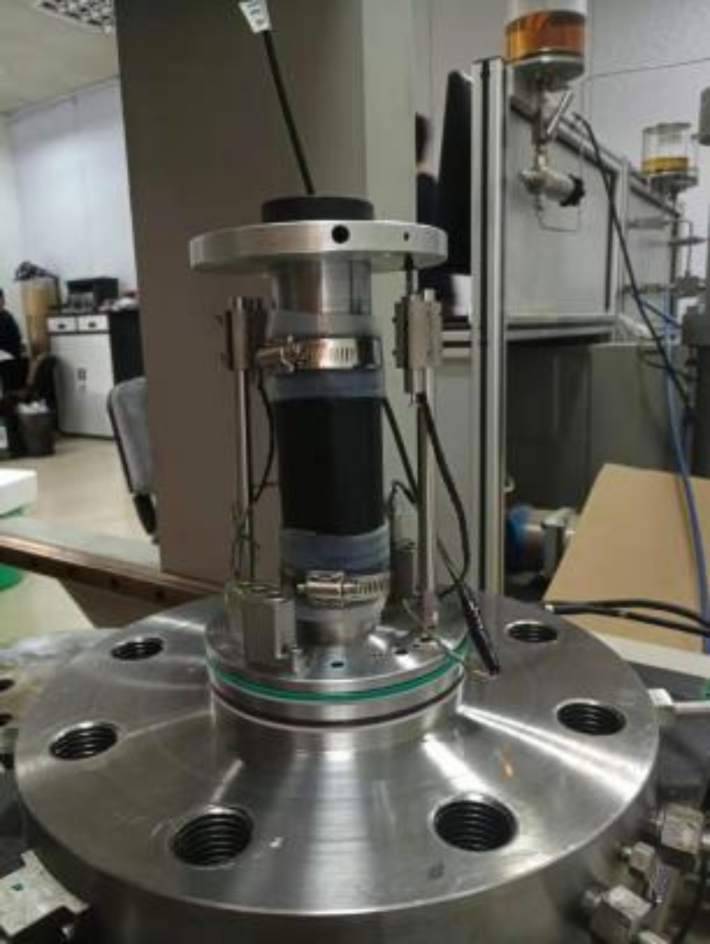
For establishing the initial parameters of the numerical model, standard triaxial compression tests are conducted on rock mass samples from the tunnel section. These rock mass samples are transformed into cylinders measuring 100 mm in height and 50 mm in diameter, with an error margin not exceeding 0.05 mm. The TIMC multi-field coupling testing machine is employed for these tests (Fig. 5), and radial confining pressure is applied hydraulically.
Fig. 5.
TIMC rock mass testing machine.
Through conducting compression tests under various confining pressures (0 MPa, 5 MPa, 10 MPa, 15 MPa, and 20 MPa), the stress responses of surrounding rock elements at different depths are simulated. Data on deviational stress, axial strain, and radial strain during these tests are recorded. Upon analyzing the laboratory test results and referring to handbook of hydraulic structure design44, the initial computational parameters of the tunnel rock mass are determined (Table 2). In accordance with the design specifications for hydraulic concrete structures45, the parameters of the reinforced segments are established as well.
Parameter inversion analysis
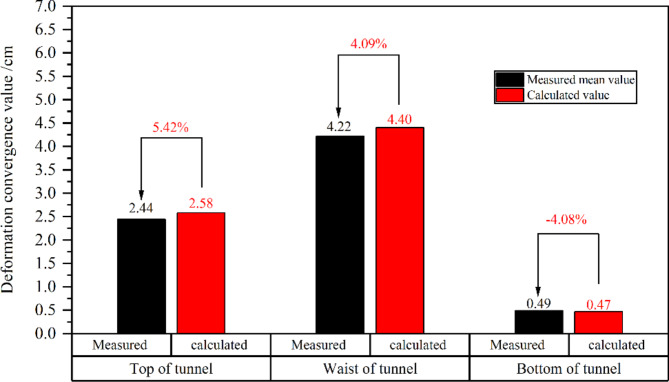
Because the deformation at the tunnel study section tends to stabilize when measured deformation in the segment, the direct measurement data from the field is utilized as the objective function for the inversion parameters. According to field measurement data, the measured convergence values of the three characteristic deformation monitoring points on each tunnel section are presented in Table 3. This table includes the measured mean values of deformation convergence on the tunnel top, waist, and bottom, which are 2.44 cm, 4.22 cm, and 0.49 cm, respectively. The diagram in Fig. 6 illustrates the deformation of the segment at the construction site.
Table 3.
Deformation convergence measured and calculated values of the monitoring points.
| Monitoring locations of the tunnel | Monitoring point | Measured value of deformation convergence/cm | Measured mean value/cm |
|---|---|---|---|
| Top | A1 | 2.49 | 2.44 |
| A2 | 2.06 | ||
| A3 | 2.77 | ||
| Waist | B1 | 4.15 | 4.22 |
| B2 | 3.53 | ||
| B3 | 4.98 | ||
| Bottom | C1 | 0.58 | 0.49 |
| C2 | 0.51 | ||
| C3 | 0.38 |
Fig. 6.
Deformation of segment on site.
Following the proposed parameter inversion method, numerical inversion calculations of the tunnel rock mass mechanical parameters are conducted using the simulation conditions of Condition 2 and the measured mean value of deformation convergence at three characteristic points. As depicted in Table 4, the result yields a set of inversion values for the computational parameters of the tunnel rock mass corresponding to the  minimum value.
Table 4.
Rock mass mechanical parameter obtained through numerical inversion.
| Types | Density ρ (kg/m3) |
Elastic modulus E (GPa) |
Bulk modulus K (GPa) |
Shear modulus G (GPa) |
Cohesion C (GPa) |
Friction angle φ (°) |
Poisson’s ratio μ |
Permeability coefficient k (cm/s) |
|---|---|---|---|---|---|---|---|---|
| Surrounding rock | 2680 | 2.73 | 2.28 | 1.05 | 1.43 | 23.50 | 0.30 | 1.0 × 10⁻⁴ |
The calculated deformation convergence values for the top, waist, and bottom of the tunnel are 2.58 cm, 4.40 cm, and 0.49 cm, respectively (Fig. 7). The relative errors in comparison with the measured values and the calculated values are as follow: 5.42%, 4.09%, and − 4.08%, respectively. These errors in the numerical deformation values of each characteristic point and the field monitoring values fall within a reasonable range. This suggests that the surrounding rock calculation parameters derived from the inversion analysis closely approximate the actual parameters on-site, validating the dependability of the numerical simulation results.
Fig. 7.
Relative errors analysis between the measured values and the calculated values.
Results and discussion
Given the symmetrical nature of the tunnel under investigation, we present the distribution of various calculation results within the tunnel and rock mass more directly through semi-models. This includes the simulation results of the distribution of principal stress, seepage velocity vectors, pore-water pressure, deformation, damage, and disturbance in the tunnel surrounding rock.
Distribution of principal stress and pore-water pressure
Principal stress distribution
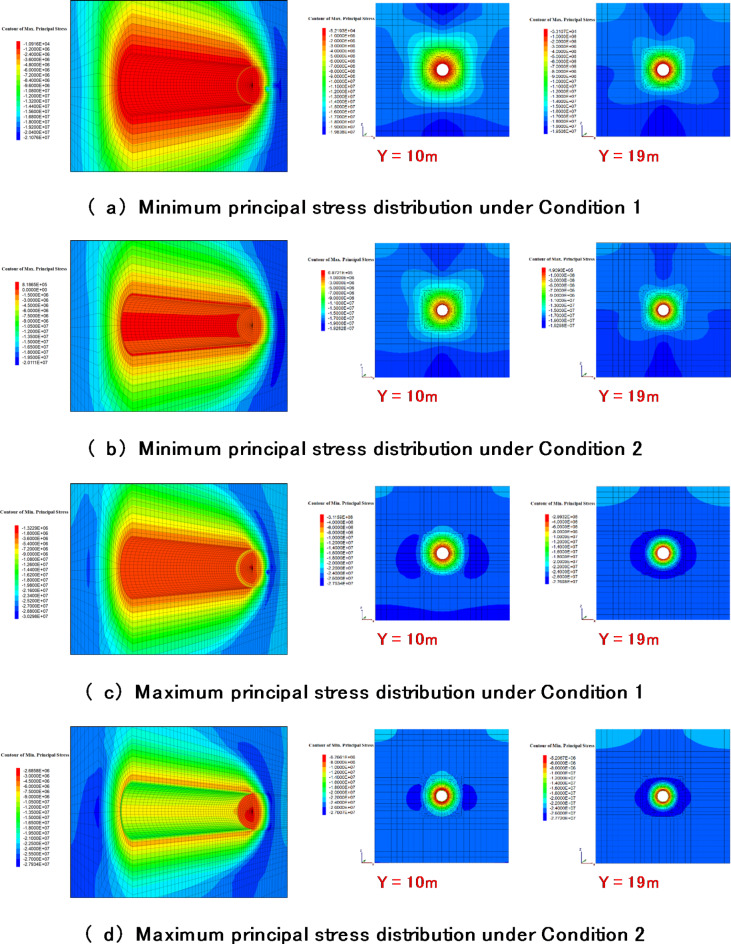
The tunnel rock mass computational parameters acquired from the parameter inversion analysis, were used to simulate the calculation and analysis of working conditions 1 and 2. The principal stress distribution results under different simulated working conditions are illustrated in Fig. 8.
Fig. 8.
Numerical results of principal stresses distribution of tunnel rock mass under different simulated conditions.
Through Comparing and analyzing the nephogram results for the maximum and minimum principal stresses distributions(Y = 0 is the starting section of excavation) in the two conditions revealed that, with or without segment support, both the tunnel excavation face and palm face are under compression by reason of the surrounding rock undergoes extrusion deformation into the tunnel interior. Tensile stress occurs in a specific range on the segment’s inner surface layer of the waist, the outer shoulder to the top, and the outer lower part to the bottom when segment support is present, with a maximum tensile stress of 0.82 MPa. This tensile stress observed in the segment is primarily attributed to its stress state. Due to the surrounding rock’s larger squeezing deformation around the segment’s waist by contrast with other areas enhances the surrounding rock’s supporting effect at the waist of the segment. Besides, under the surrounding rock’s joint restraint at the segment’s top and bottom, tensile stress occurs in certain regions of the segment.
The results of research also demonstrate a reduction in both the minimum and maximum principal stresses of the surrounding rock following the application of segment support. Specifically, the maximum principal stress drops from 30.30 MPa to 27.94 MPa, while the minimum principal stress is decreased from 21.07 MPa to 20.11 MPa. This phenomenon primarily stems from the absence of segment support, allowing the surrounding rock’s deformation to intensify gradually as its internal extrusion increases unchecked. By contrast, segment support significantly constrains the tunnel’s deformation, thereby weakening the internal extrusion of the surrounding rock. Furthermore, stress concentration within a specific depth range along the tunnel wall and tunnel face is also caused by the surrounding rock’s deformation.
Vector distribution of pore-water pressure and seepage velocity
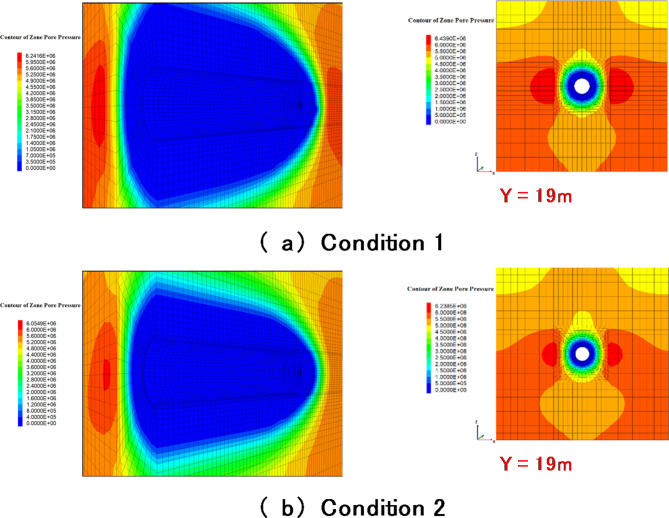
Figure 9 presents the simulation results of vector distribution for pore-water pressure and seepage velocity under various simulated working conditions. From the changes in pore-water pressure within the tunnel, after tunnel excavation, far-field pore water flows toward the free surface under the influence of pressure, eventually reaching a steady state. Furthermore, it adopts the form of a funnel, due to drainage effects from the tunnel’s exposed face. The maximum pore-water pressure under condition 1 and 2 is 6.24 MPa and 6.05 MPa, respectively, both exceeding the pore-water pressure value of 5.60 MPa resulting from hydrostatic pressure. The excess pore-water pressure is formed, and its occurrence areas coincides with the stress concentration regions. The main reason for its formation is the volume compression caused by the intense mutual extrusion in the surrounding rock.
Fig. 9.
Numerical results of pore-water pressure distribution under different simulated conditions.
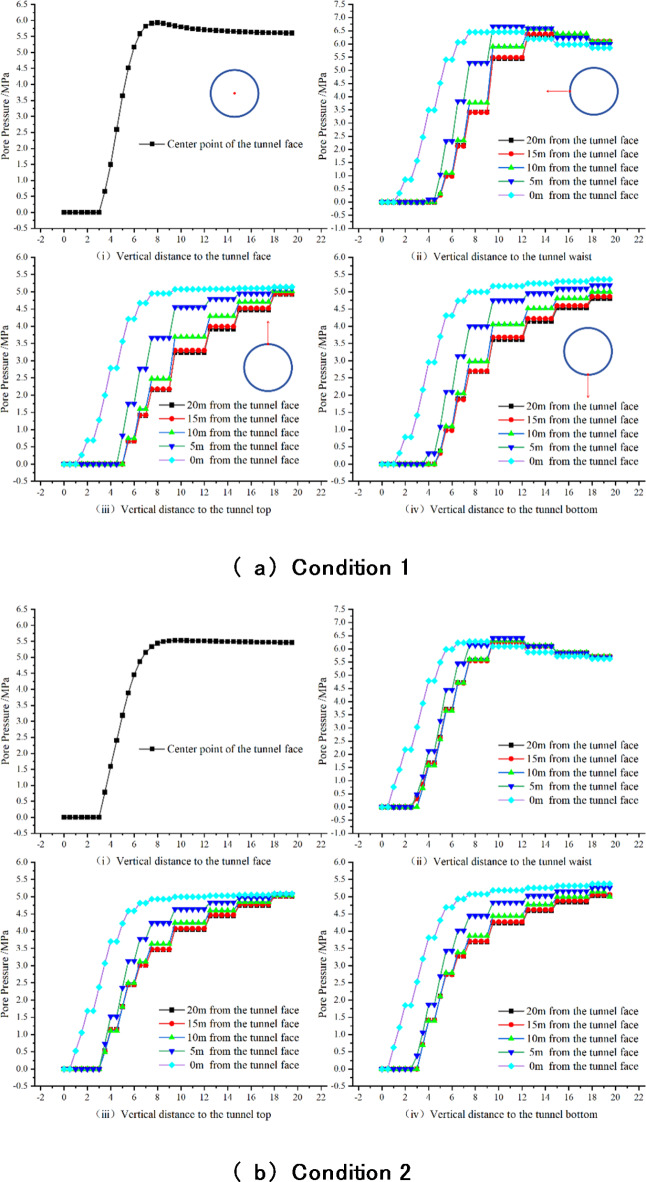
Analysis results in Fig. 10 indicate a consistent distribution pattern of pore-water pressure in the surrounding rock under the two different simulation conditions. Additionally, the pore-water pressure gradually increases from zero at the tunnel face to the interior. However, the gradient of pore-water pressure at the tunnel face and waist changes more rapidly than at the top and bottom. This suggests a higher likelihood of water inflow on either sides of the tunnel, which aligns with water inrush scenarios appeared during actual excavation.
Fig. 10.
Numerical results of pore water pressure at multiple characteristic locations under different simulated conditions.
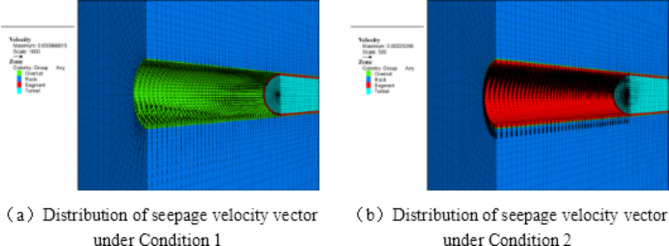
In addition, a comparative analysis of Fig. 11 revealed that the presence of segment support leads to different distribution patterns of seepage velocity vectors on the free face of the tunnel under the two conditions. Under Condition 1, the vectors point inward along the tunnel diameter, while under Condition 2, they point downward along the tunnel wall. The seepage conditions at the tunnel face are consistent under both working conditions, with the seepage velocity vector distribution showing diffusion towards the tunnel interior along the face. However, with segment support, the rate of water inflow per unit time at the tunnel face significantly increases compared to the case without segment support. The occurrence of this phenomenon is primarily due to the hindered drainage of the tunnel wall caused by the support of the segments, resulting in the tunnel face not only bearing the drainage in the tunnel excavation direction but also the drainage from the tunnel surrounding water bodies. Therefore, for ultra-deep tunnels in water-rich environments, drainage measures must be implemented on the tunnel face and both waist sides following excavation and support.
Fig. 11.
Numerical results of seepage velocity vectors under different simulated working conditions.
Deformation characteristics of tunnel and the effectiveness of segment support
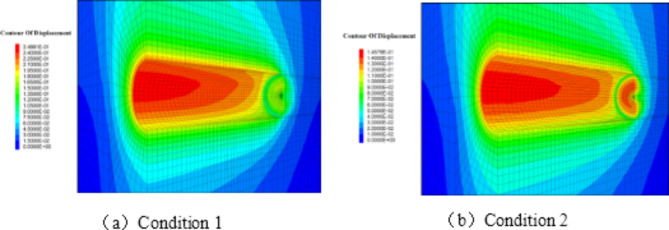
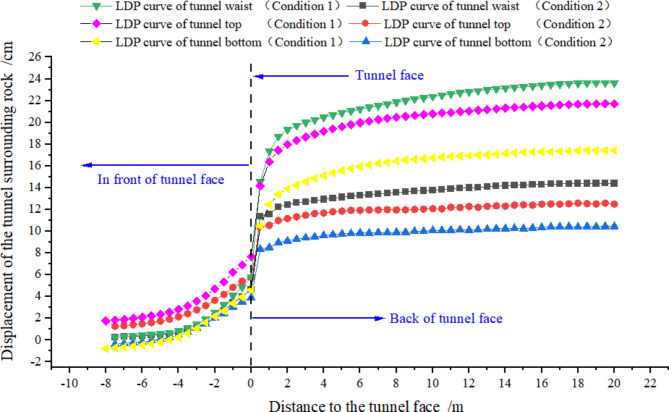
The radial deformation distribution under the two Conditions (Fig. 12) and the comparison of surrounding rock longitudinal displacement profiles (LDP) deformation at various characteristic positions of the tunnel (Fig. 13) reveal that as the excavation progresses, the surrounding rock deformation tends to stabilize gradually. Without segment support, the tunnel’s maximum radial deformation is 24.88 cm, whereas with segment support, it is reduced to 14.58 cm (accounting for the reserved 10 cm deformation expansion gap during tunnel excavation, resulting in a maximum radial deformation of the segment at 4.58 cm). Both occurrences are observed at the upper part of the tunnel waist. In Condition 1, the maximum deformation at the bottom, waist, and top of the tunnel is 17.44 cm, 23.63 cm, and 21.71 cm, respectively. In Condition 2, the corresponding deformations are 12.58 cm, 14.40 cm, and 10.47 cm, reflecting a decrease of 42.05%, 39.06%, and 39.97%. The effectiveness of segment support is evident.
Fig. 12.
Numerical results of radial deformation of the tunnel under different simulated conditions.
Fig. 13.
Comparison of LDP of the surrounding rock deformation at various characteristic locations in Condition 1 and Condition 2.
Under the two working conditions, the tunnel’s waist deformation at the characteristic position is the most prominent, after which comes the top and the bottom. Additionally, following the implementation of the segment support, the maximum deformation at the palm face decreased from 18.53 cm to 14.18 cm, a reduction of 23.48%. This reduction is significantly smaller compared to other positions in the tunnel. On one hand, this is because no direct support measures were applied to the tunnel face; on the other hand, the increased gushing water further exacerbated its deformation, partially offsetting the additional reinforcement effect provided by the segment support.
Disturbance and damage analysis
Reinforced and unreinforced states under actual conditions
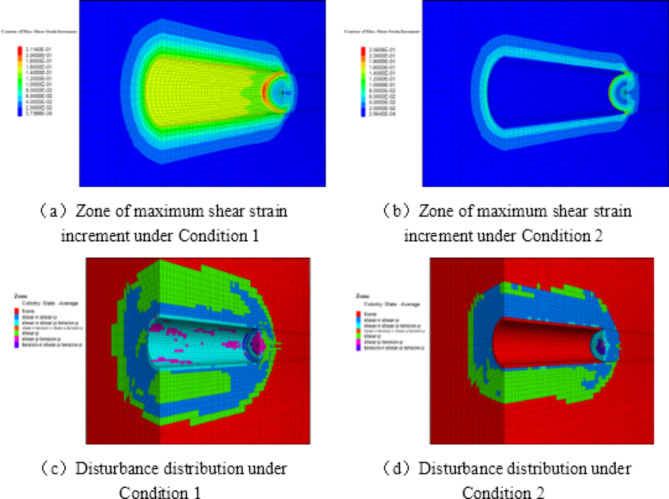
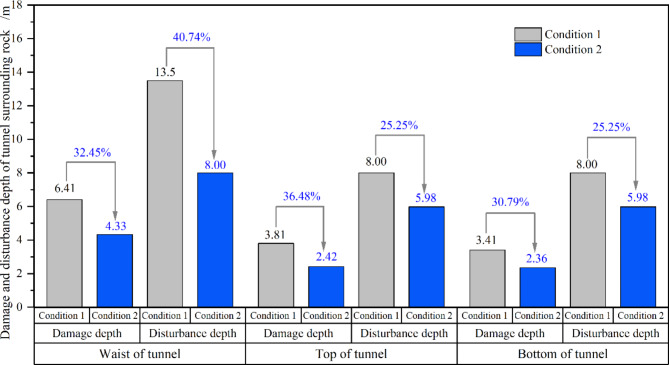
Analyzing the depth of damage and disturbance distribution under the two simulated conditions (Figs. 14 and 15), we observe that the maximum damage and disturbance depths under Condition 1 are 6.41 m and 13.5 m, respectively, while under Condition 2, they are 4.33 m and 8.00 m, respectively, both occurring at the waist of the tunnel. Without segment support, the damage depths at the tunnel’s top and bottom are 3.81 m and 3.41 m, respectively, and the disturbance depths are both 8.00 m. With segment support, the damage depths of the top and bottom are reduced to 2.42 m and 2.36 m, respectively, and the disturbance depths are both reduced to 5.98 m. For both calculation conditions, the disturbance depth at the same characteristic position is 1.9 to 2.5 times the damage depth, and under the same working condition, the damage depth of the tunnel’s top is marginally larger than at the bottom, whereas the disturbance depth remains roughly the same. Furthermore, the damage depth at the bottom, waist, and top of the surrounding rock is reduced by 30.79%, 32.45%, and 36.48%, respectively, when comparing support with segments to no segment support. In the same case, the disturbance depth is reduced by 25.25%, 40.74%, and 25.25%, respectively. Notably, the reduction in damage depth across various characteristic locations due to segment support shows minimal variation. However, in terms of the reduction in disturbance depth, the tunnel waist significantly outperforms the top and bottom positions.
Fig. 14.
Numerical results of damage and disturbance distribution under different simulated working conditions.
Fig. 15.
The comparison analysis results of damage and disturbance depth under the two simulated conditions.
After applying reinforcement measures (Condition 2), the damage depth of the surrounding rock at the top, waist, and bottom of the tunnel showed a substantial decrease. However, this depth remains significant relative to the tunnel diameter (5.93 m), which inevitably weakens the overall load-bearing capacity of the surrounding rock, exacerbating the creep effect. As deformation of the surrounding rock continues to accumulate, the support structure may fail to withstand the increasing pressure, leading to deformation or damage. This analysis aligns with the phenomenon observed in subsequent tunnel operation, where the support segments experienced misalignment due to compressive deformation of the surrounding rock.
Importantly, during the calculated cycles, each zone undergoes various states according to the failure criterion. In Fig. 14(c) and (d), “None” indicates no failure in the zone, “Tension” and “Shear” represent the surrounding rock plastic state on account of tension and shear. “Previous” and “Now” (-p, -n) signify the plastic state in the previous and current cycles, respectively.
Damage evolution characteristics
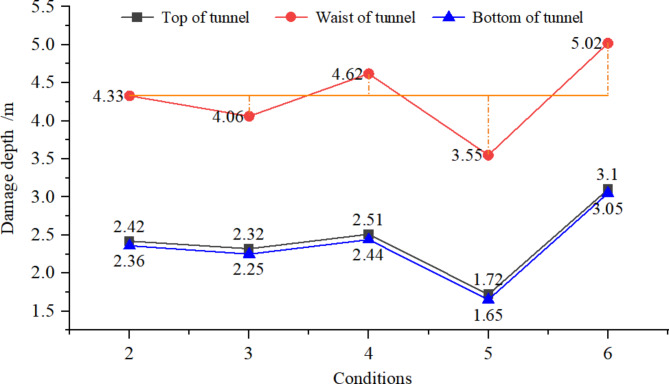
In order to investigate the damage evolution characteristics of the surrounding rock under different in-situ stress and pore water pressure conditions, this study complements the actual operating condition (Condition 2) with the following numerical simulation schemes (Table 5): Condition 3 and Condition 4: The three-dimensional asymmetric in-situ stress remains unchanged, while the pore water pressure is reduced by 0.8 times (4.48 MPa) and increased by 1.2 times (6.72 MPa), respectively.
Table 5.
Working condition setting schemes.
| Condition | Whether to consider segment support | Asymmetric three-dimensional stress | External water pressure | Calculation mode |
|---|---|---|---|---|
| 3 | Yes |

|

|
Fluid-structure interaction |
| 4 | Yes |

|

|
Fluid-structure interaction |
| 5 | Yes |

|

|
Fluid-structure interaction |
| 6 | Yes |

|

|
Fluid-structure interaction |
Condition 5 and Condition 6: The pore water pressure remains constant, while the three-dimensional asymmetric in-situ stress is reduced by 0.8 times and increased by 1.2 times, respectively (Fig. 16).
Fig. 16.
Calculation results of damage depth of surrounding rock under different in-situ stress and different pore water pressures.
Comparative analysis of the results shows that when one of the two variables—in-situ stress and pore water pressure—remains constant while the other varies, the damage depth of the surrounding rock is positively correlated with both variables. For instance, taking the waist of the tunnel as an example, when the in-situ stress or pore water pressure are reduced by 0.8 times, the damage depth of the surrounding rock decreases by 5.24% and 18.01%, respectively, compared to the normal operating condition. Conversely, when they are increased by 1.2 times, the damage depth increases by 6.70% and 15.94%, respectively. Therefore, the analysis indicates that the damage depth of the surrounding rock is more significantly influenced by in-situ stress than by pore water pressure, with the top and bottom of the tunnel exhibiting similar trends.
Conclusions
This study takes a large cross-basin water transfer project tunnel as an example, based on the fluid-structure interaction analysis theory and a proposed inversion method of surrounding rock parameters, the stress and deformation characteristics of the soft rock tunnel under the influence of asymmetrical three-dimensional high in-situ stress and high pore water pressure are studied, and the damage evolution characteristics of the surrounding rock under different in-situ stresses and pore water pressures are analyzed. The primary findings are summarized as follows:
(1) The relative errors between the calculated deformation values, based on inversion parameters, and the measured values at characteristic points are approximately 5%. These errors fall within a reasonable range, ensuring the reliability of the subsequent simulation results.
(2) The primary cause of the formation of excess pore-water pressure and stress concentration is the volumetric compression resulting from the intense mutual extrusion of the surrounding rock. Furthermore, water effusion is more likely to appear on both sides of the tunnel. With segment support, the rate of water effusion on the palm face significantly increases compared to condition without support. Therefore, for ultra-deep water-rich tunnels, after excavation and support, attention should be focused on implementing drainage measures at the tunnel waist area and the palm face.
(3) Deformation of the tunnel rock mass is most prominent at the waist, followed by the top and the bottom under both conditions. After the implementation of segment support, the deformation control effect on the surrounding rock is remarkable.
(4) Under both conditions, the maximum damage and disturbance depth of the surrounding rock in the tunnel are concentrated at the waist. Notably, the disturbance depth at each characteristic position is 1.9 to 2.5 times greater than damage depth. The reduction in damage depth across various characteristic locations due to segment support shows minimal variation. However, in terms of the reduction in disturbance depth, the tunnel waist significantly outperforms the top and bottom positions.
(5) The analysis of the damage evolution characteristics of the surrounding rock under different in-situ stress and pore water pressure conditions shows that the damage depth of the tunnel’s surrounding rock is positively correlated with both in-situ stress and pore water pressure. Nevertheless, the influence of in-situ stress is more significant than that of pore water pressure.
Acknowledgements
The authors present their appreciation for the funding of the National Key Research and Development Program of China (2021YFC3090103) and the Fundamental Research Funds for Central Public Welfare Research Institutes of China (Y421006; Y421008; Y422001). The authors also would like to express appreciation to the reviewers for their valuable comments and suggestions that helped improve the quality of our paper.
Author contributions
Z.QB. and T.L. overall research goals, original draft writing; Z.QB. investigation; T.L. project administration; W. YK. data acquisition/analysis; Z.SH. and W.JQ. numerical models building; W.YL. literature research; All authors reviewed the manuscript.
Funding
This research was financially supported by the National Key Research and Development Program of China (2021YFC3090103) and the Fundamental Research Funds for Central Public Welfare Research Institutes of China (Y421006; Y421008; Y422001).
Data availability
The datasets used or analysed during the current study are available from the corresponding author on reasonable request.
Declarations
Competing interests
The authors declare no competing interests.
Footnotes
Publisher’s note
Springer Nature remains neutral with regard to jurisdictional claims in published maps and institutional affiliations.
References
- 1.Boniface, A. Some technical lessons learnt from construction of the Lesotho Highlands Water Project transfer tunnel. Tunn. Undergr. Sp Tech.14, 29–35 (1999). [Google Scholar]
- 2.Cosimo, I., Juan, C. G. T. & César, T. F. Large deformations in deep tunnels excavated in weak rocks: study on Y-Basque high-speed railway tunnels in northern Spain. Undergr. Space. 6(6), 636–649 (2021). [Google Scholar]
- 3.Liu, F., Tang, C. A., Zhang, Y. J. & Ma, T. H. Rockburst and microseismicity characteristics in the Qinling water conveyance tunnel of the Hanjiang-to-Weihe River Diversion Project. Int. J. Rock. Mech. Min. Sci.148, 104973 (2021). [Google Scholar]
- 4.Sun, X. M. et al. Research on the large deformation mechanism and control measures of a layered soft rock tunnel. Bull. Eng. Geol. Environ.82(12), 444 (2023). [Google Scholar]
- 5.Feng, X. T. et al. Dynamic design method for deep hard rock tunnels and its application. J. Rock. Mech. Geotech. Eng.8(4), 443–461 (2016). [Google Scholar]
- 6.Delisio, A., Zhao, J. & Einstein, H. H. Analysis and prediction of TBM performance in blocky rock conditions at the Lötschberg Base tunnel. Tunn. Undergr. Sp Tech.33, 131–114 (2013). [Google Scholar]
- 7.Bai, C. H. et al. Real-time updated risk assessment model for the large deformation of the soft rock tunnel. Int. J. Geomech.21(1), 04020234 (2021). [Google Scholar]
- 8.Zhang, H., Chen, L., Zhu, Y. M., Zhou, Z. L. & Chen, S. G. Stress field distribution and deformation law of large deformation tunnel excavation in soft rock mass. Appl. Sci.9, 865 (2019). [Google Scholar]
- 9.Tao, Z. G. et al. Study on deformation mechanism and support measures of soft surrounding rock in muzhailing deep tunnel. Adv. Civ. Eng.2020, 1–14 (2020). [Google Scholar]
- 10.Zhu, Y. M., Chen, L., Zhang, H., Zhou, Z. L. & Chen, S. G. Physical and mechanical characteristics of soft rock tunnel and the effect of excavation on supporting structure. Appl. Sci.9, 1517 (2019). [Google Scholar]
- 11.Xu, Z. M., Huang, R. Q. & Wang, S. T. Tunnel classifying in light of depth (i.e thickness of overburden). Chin. J. Geol. Hazard. Control. 11(4), 5–10 (2000). [Google Scholar]
- 12.Cai, W. Q., Zhu, H. H., Liang, W. H., Vu, B. T. & Wu, W. Physical and numerical investigation on nonlinear mechanical properties of deep-buried rock tunnel excavation unloading under complicated ground stresses. Tunn. Undergr. Sp Tech.138, 105197 (2023). [Google Scholar]
- 13.Li, S. C. et al. Classification, geological identification, hazard mode and typical case studies of hazard-causing structures for water and mud inrush in tunnels. Chin. J. Rock. Mech. Eng.37(05), 1041–1069 (2018). [Google Scholar]
- 14.Yang, Q. G., Zhang, C. J., Yan, T. Y., Liu, Q. & Li, J. H. Integrated research and application of construction and safe operation of long-distance water transfer projects. Chin. J. Geotech. Eng.44, 1188–1210 (2022). [Google Scholar]
- 15.Wagner, H. Deep mining: a rock engineering challenge. Rock. Mech. Rock. Eng.52(5), 1417–1446 (2019). [Google Scholar]
- 16.Li, H. B., Yang, X. G., Zhang, X. B. & Zhou, J. W. Deformation and failure analyses of large underground caverns during construction of the Houziyan Hydropower Station, Southwest China. Eng. Fail. Anal.80, 164–185 (2017). [Google Scholar]
- 17.Feng, X. T., Guo, H. S., Yang, C. X. & Li, S. J. In situ observation and evaluation of zonal disintegration affected by existing fractures in deep hard rock tunneling. Eng. Geol.242, 1–11 (2018). [Google Scholar]
- 18.Qian, Q. H. & Zhou, X. P. Failure behaviors and rock deformation during excavation of underground cavern group for Jinping I hydropower station. Rock. Mech. Rock. Eng.51(8), 2639–2651 (2018). [Google Scholar]
- 19.Zhou, X. P., Qian, Q. H. & Yang, H. Q. Strength criteria of deep rock mass. Chin. J. Rock. Mech. Eng.27(1), 117–123 (2008). [Google Scholar]
- 20.Cui, Q. L., Shen, S. L., Xu, Y. S., Wu, H. N. & Yin, Z. Y. Mitigation of geohazards during deep excavations in karst regions with caverns: a case study. Eng. Geol.195, 16–27 (2015). [Google Scholar]
- 21.Liu, X. Z., Liu, F. & Song, K. Z. Mechanism analysis of tunnel collapse in a soft-hard interbedded surrounding rock mass: a case study of the Yangshan Tunnel in China. Eng. Fail. Anal.138, 106304 (2022). [Google Scholar]
- 22.Ma, K. M., Zhang, J. R., Zhang, J. C., Dai, Y. & Zhou, P. Floor heave failure mechanism of large-section tunnels in sandstone with shale stratum after construction: a case study. Eng. Fail. Anal.140, 106497 (2022). [Google Scholar]
- 23.Zhu, H. H., Yan, J. X. & Liang, W. H. Challenges and Development prospects of Ultra-long and Ultra-deep Mountain tunnels. Engineering5(3), 384–392 (2019). [Google Scholar]
- 24.Agan, C. Prediction of squeezing potential of rock masses around the Suruc water tunnel. B Eng. Geol. Environ.75(2), 451–461 (2016). [Google Scholar]
- 25.Liu, C. Y. & He, M. C. Characteristics of surrounding rock pressure of deep tunnel in segment of geological structure development. Rock. Soil. Mech.35(4), 1101–1109 (2014). [Google Scholar]
- 26.Guo, B. Q. Geological characteristics of tunnels with extremely high geostress and study of surrounding Rock deformation mechanism. Tunn. Constr.37(5), 586–592 (2017). [Google Scholar]
- 27.Li, J. Q., Wang, Z. F., Wang, Y. Q. & Chang, H. T. Analysis and countermeasures of large deformation of deep-buried tunnel excavated in layered rock strata: a case study. Eng. Fail. Anal.146, 107057 (2023). [Google Scholar]
- 28.Liu, N., Zhang, C. S., Shan, Z. G. & Chu, W. J. Reasonable interpretation and monitoring optimization on excavation response of deep buried tunnel in hard rock. Chin. J. Rock. Mech. Eng.39(S1), 2818–2827 (2020). [Google Scholar]
- 29.Zhang, M. C., Yan, T. Y., Zhang, G. Q., Li, J. H. & Wu, S. Research on mechanical properties and reasonable parameter values of soft rock in deep buried tunnel. Chin. J. Rock. Mech. Eng.43(S1), 3217–3228 (2024). [Google Scholar]
- 30.Xu, G. C., Zheng, Y. R., Qiao, C. S. & Liu, B. G. Underground Engineering Support Structure and Design (China Water & Power, 2013). [Google Scholar]
- 31.Pan, C. S. Numerical Methods for Tunnel Mechanics, 95–136 (China Railway Publishing House, 1995). [Google Scholar]
- 32.Itasca Consulting Group Inc. FLAC3D, Fast Lagrangian Analysis of Continua in 3 Dimension (Version3.1) User’s Manual (Itasca Consulting Group, Inc, 2003). [Google Scholar]
- 33.Wang, H. L. et al. Investigation on time-dependent behaviour and long-term stability of underground water-sealed cavern. Eur. J. Environ. Civ. Eng.19(sup1), s119–s139 (2015). [Google Scholar]
- 34.Wang, D. K., Luo, J. J., Li, F. L., Wang, L. & Su, J. Research on dynamic response and fatigue life of tunnel bottom structure under coupled action of train load and groundwater. Soil. Dyn. Earthq. Eng.161, 107405 (2022). [Google Scholar]
- 35.Zhang, D. L. Chapter 5 Elaborate Process Control Technology for Unfavorable Geological Sections of Subsea Tunnels (Springer, 2023). [Google Scholar]
- 36.Zhan, T., Guo, X. P., Jiang, T. F. & Jiang, A. Intelligent Feedback analysis of fluid–solid coupling of surrounding rock of tunnel in Water-Rich Areas. Appl. Sci.13(3), 1479 (2023). [Google Scholar]
- 37.Haimson, B. C. The hydrofracturing stress measuring method and recent field results. Int. J. Rock. Mech. Min. Sci.15(4), 167–178 (1978). [Google Scholar]
- 38.Qi, S. W., Wu, F. Q., Yan, F. Z. & Lan, H. X. Mechanism of deep cracks in the left bank slope of Jinping first stage hydropower station. Eng. Geol.73(1–2), 129–144 (2004). [Google Scholar]
- 39.Chen, S. D. et al. In-situ stress measurements and stress distribution characteristics of coal reservoirs in major coalfields in China: implication for coalbed methane (CBM) development. Int. J. Coal Geol.182, 66–84 (2017). [Google Scholar]
- 40.Wang, S. S. et al. Experimental investigation and failure mechanism analysis for dacite under true triaxial unloading conditions. Eng. Geol.264, 105407 (2020). [Google Scholar]
- 41.Hudson, J. A. Rock Engineering Systems: Theory and Practice (Ellis Horwood, 1992). [Google Scholar]
- 42.Kang, H. P., Zhang, X. F., Si, L., Wu, Y. & Gao, F. In-situ stress measurements and stress distribution characteristics in underground coal mines in China. Eng. Geol.116(3–4), 333–345 (2010). [Google Scholar]
- 43.Ministry of Water Resources of People’s Republic of China. Specification for design of hydraulic tunnel, SL 279–2016 (China Water & Power Press, Beijing, 2017).
- 44.Suo, L. S., Liu, N. & Gao, A. Z. Handbook of Hydraulic Structure Design, 2nd edn. (China Water & Power Press, 2011). [Google Scholar]
- 45.Ministry of Water Resources of People’s Republic of China. Design code for hydraulic concrete structures, SL 191–2008 (China Water & Power Press, Beijing, 2009).
Associated Data
This section collects any data citations, data availability statements, or supplementary materials included in this article.
Data Availability Statement
The datasets used or analysed during the current study are available from the corresponding author on reasonable request.


