

ABSTRACT
Deficiency of cofactors for various enzymes can lead to inborn errors of metabolism. These conditions frequently occur as seizures, which lead to permanent brain damage. Newborn screening for biomarkers associated with these disorders can help in early detection and treatment. Our objective was to establish a liquid chromatography mass spectrometry technique for quantifying biomarkers in dried urine spots to detect specific vitamin‐responsive inborn errors metabolism. Biomarkers were extracted from dried urine spots using a methanol:0.1% v/v formic acid solution (75:25) containing an internal standard mixture. Separation was achieved using a Luna PFP column (150 mm × 4.6 mm, 3 µm) under gradient elution conditions. The LC–MS technique was validated as per ICH M10 guidelines. Urine samples from healthy newborns in Udupi district, South India, were analyzed to establish reference values for these biomarkers. The method demonstrated excellent linearity (R 2 > 0.99) with low limits of quantification: 0.1 µg/mL for leucine, isoleucine, valine, proline, hydroxyproline, methylmalonic acid, and 3‐hydroxyisovaleric acid; 0.01 µg/mL for pipecolic acid and α‐aminoadipic semialdehyde; and 0.03 µg/mL for piperideine‐6‐carboxylate. Interconvertibility between urine and dried urine spot assays was observed from the results of the regression and Bland–Altman analyses. Reference intervals for these biomarkers in the Udupi neonatal population were established using the validated dried urine spot method.
Keywords: amino acids, cofactor‐dependent metabolic disorder, dried urine spot, LC–MS, newborn screening
1. Introduction
Inborn errors of metabolism (IEM) are genetic disorders caused by defects in enzyme function. These defects can interfere with metabolic pathways, resulting in the accumulation of harmful metabolites or a shortage of crucial ones [1]. Cofactor‐dependent IEMs are a subset of IEMs that arise from deficiencies in cofactors, which are non‐protein molecules required for enzyme activity [2]. It includes pyridoxine‐dependent epilepsy (PDE), hyperprolinemia Type II (HP II), thiamine‐responsive maple syrup urine disease (MSUD), adenosylcobalamin, and methylcobalamin deficiencies. These disorders are often characterized by seizures observed within hours of birth, in late infancy, or in early childhood [3]. While treatment with the deficient cofactor, typically vitamins such as pyridoxine, folic acid, thiamine, and biotin can effectively manage these disorders, detection and treatment often occur after the onset of seizures [4]. Early detection and treatment through newborn screening (NBS) for biomarkers associated with these disorders can significantly improve patient outcomes including survival and quality of life.
PDE and HP II both result from disruptions in pathways that depend on vitamin B6 (pyridoxine) as a cofactor. In PDE, a deficiency in the enzyme α‐aminoadipic semialdehyde (AASA) dehydrogenase leads to the accumulation of metabolites such as AASA, piperideine‐6‐carboxylate (P6C), and pipecolic acid (PA), which contribute to pyridoxine depletion and seizure onset (Figure 1A) [5, 6, 7]. Similarly, in HP II, a deficiency in Δ‐1‐pyrroline 5‐carboxylate dehydrogenase results in the accumulation of proline (Pro) and other metabolites, inactivating pyridoxal phosphate, which also leads to seizures (Figure 1B) [8, 9, 10, 11, 12, 13, 14]. While the clinical presentation may vary, both conditions can benefit from early intervention with pyridoxine supplementation [15, 16, 17]. Disorders such as adenosylcobalamin and methylcobalamin deficiencies, which affect vitamin B12 metabolism, are present with a range of symptoms including megaloblastic anaemia, neurological impairments, fatigue, and developmental delays in infants [4, 18, 19]. Increased concentrations of methylmalonic acid (MMA) in blood and urine serve as key biomarkers for these deficiencies, indicating impaired conversion of methylmalonyl‐CoA to succinyl‐CoA (Figure 1C) [20, 21]. Timely diagnosis and treatment with vitamin B12 are essential for reducing health complications. Thiamine‐responsive MSUD, a variant of the classic MSUD, results from defects in the branched‐chain ketoacid dehydrogenase complex, causing a build‐up of branched‐chain amino acids (BCAAs) (Figure 1D). Symptoms include delayed development, ketoacidosis, and ataxia [22, 23, 24]. Early detection via BCAA levels is crucial for timely intervention [25, 26]. Biotin‐responsive multiple carboxylase deficiency is caused from deficiencies in either holocarboxylase synthetase (HCS) or biotinidase [27, 28]. HCS deficiency impairs biotin binding to apocarboxylases, whereas biotinidase deficiency impairs biotin recycling [29, 30]. Both deficiencies decrease the activity of biotin‐dependent carboxylases, essential for metabolizing amino acids, fatty acids, and carbohydrates. Symptoms include metabolic acidosis, ketosis, developmental challenges, muscle weakness, seizures, skin inflammation, and alopecia [31].
FIGURE 1.
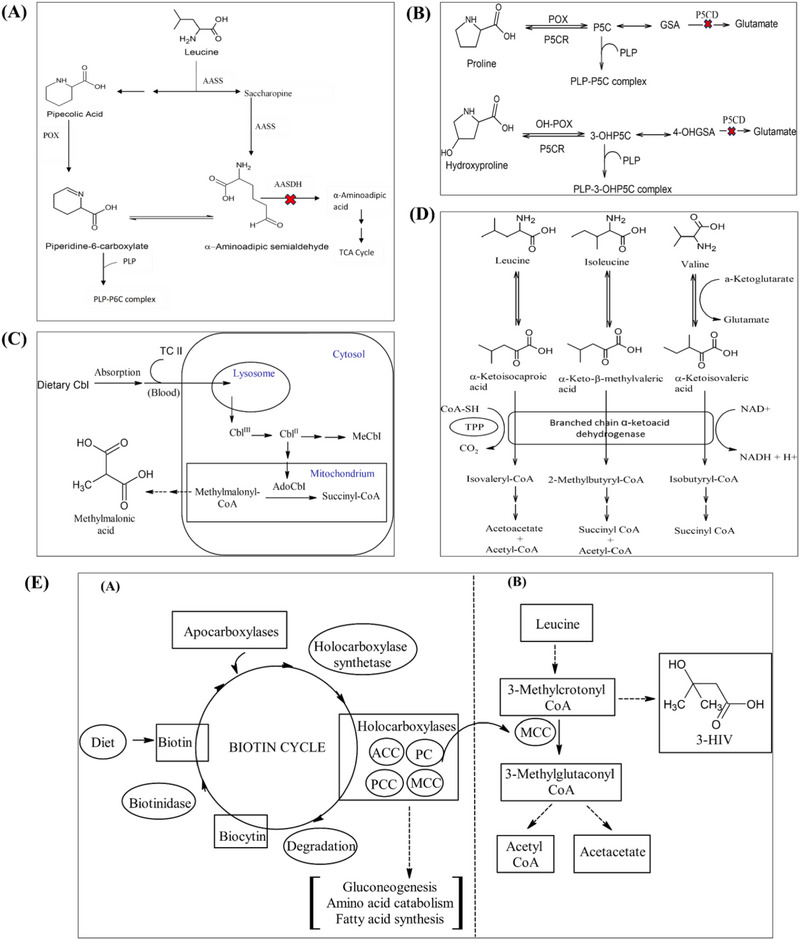
Biochemical pathways of the cofactor‐dependent metabolic disorders (A) Leucine metabolism in brain and pathophysiology of pyridoxine‐dependent epilepsy (PDE). (B) Proline and hydroxyproline metabolism to glutamate. (C) Cobalamin metabolism pathway. (D) Branched‐chain amino acid (BCAA) metabolism and maple syrup urine disease (MSUD). (E) The biotin cycle and the interrelationship between biotin deficiency and the production of marker 3‐HIV. 3‐HIV, 3‐hydroxy isovaleric acid; 3‐OHP5C, 3‐hydroxy pyrroline‐5‐carboxylate; 4‐OHGSA, 4‐hydroxyglutamate‐γ‐semialdehyde; ACC, acetyl‐CoA carboxylase; AdoCbl, adenosylcobalamin; Cbl, cobalamin; GSA, glutamate‐γ‐semialdehyde; MCC, β‐methylcrotonyl‐CoA carboxylase; MeCbl, methylcobalamin; OH‐POX, hydroxyproline oxidase; P5C, pyrroline‐5‐carboxylate; P5CR, pyrroline‐5‐carboxylate reductase; PC, pyruvate carboxylase; PCC, propionyl‐CoA carboxylase; PLP, pyridoxal‐5‐phosphate; POX, proline oxidase; TC II, transcobalamin II; TPP, thiamine pyrophosphate.
Early diagnosis, through NBS and measuring 3‐hydroxyisovaleric acid (3‐HIV) levels, is crucial for preventing irreversible neurological damage. The production of biomarker 3‐HIV is showed in Figure 1E. The useful biomarkers for the above discussed disorders are presented in Table 1. Estimation of these biomarkers from the blood or urine of neonates is an effective way for an early diagnosis of these disorders. Currently, there are no reported analytical methods to quantify biomarkers responsible for the above‐mentioned cofactor‐dependent inborn metabolic disorders (IMDs) simultaneously from urine or dried urine spots (DUS). Currently available individual techniques are mainly based on GC–MS technique and needs derivatization [32, 33].
TABLE 1.
The biomarkers and the treatment strategy for the cofactor‐dependent inborn metabolic disorders.
| Metabolic disorder | Deficient vitamin | Biomarkers | Treatment |
|---|---|---|---|
| Pyridoxine‐dependent epilepsy | Pyridoxine (vitamin B6) | Piperidine‐6‐carboxylic acid, α‐aminoadipic semialdehyde, pipecolic acid | Pyridoxine supplementation with dietary restriction of lysine and arginine |
| Hyperprolinemia 2 | Pyridoxine (vitamin B6) | Proline, hydroxyproline | Pyridoxine supplementation with dietary restriction of proline |
| Adenosylcobalamin and methylcobalamin deficiency | Cobalamine (vitamin B12) | Methylmalonic acid | Cobalamine supplementation with protein restricted diet |
| Thiamine‐responsive MSUD | Thiamine (vitamin B1) | Leucine, isoleucine, valine | Thiamine supplementation with dietary restriction of branched chain amino acids |
| Biotin‐responsive multiple carboxylase deficiency | Biotin (vitamin B7) | 3‐Hydroxyisovaleric acid | Biotin supplementation |
Abbreviation: MSUD, maple syrup urine disease.
While dried blood spots (DBS) are the most commonly used sampling technique in NBS [34], DUS offer practical advantages, especially for paediatric populations. Unlike DBS, DUS is noninvasive, painless, and easier to collect, especially in home settings. However, contamination risks and lower analyte concentrations in urine compared to DBS are challenges that must be addressed. DUS also offers advantages over liquid urine collection, requiring smaller sample volumes and being more practical for remote or at‐home settings. Liquid chromatography–mass spectrometry (LC–MS) has become the most preferred analytical method for analyzing biomarkers because of its unmatched sensitivity and selectivity [35, 36, 37]. This study aimed to develop and validate a comprehensive LC–MS method to quantify simultaneously biomarkers associated with cofactor‐dependent IMDs from urine and DUS samples. In addition, the study sought to establish reference ranges for these biomarkers in neonates from the Udupi district population in South India.
2. Materials and Methods
2.1. Chemicals, Reagents, and Reference Standards
Leucine (Leu; purity > 95%), isoleucine (Ileu; purity > 95%), valine (Val; purity > 95%), Pro (purity > 95%), hydroxyproline (OH‐Pro; purity > 95%), MMA (purity > 99%), 3‐HIV (purity > 95%), l‐allysine ethylene acetal (purity > 98%), Amberlyst 15 bead and PA (purity > 99%), and formic acid 85% (AR grade) were obtained from Sigma‐Aldrich (St. Louis, MO, USA). dl‐Pipecolic acid‐d9 (internal standard [IS]) was procured from Toronto research chemicals (Toronto, ON, Canada). Methylmalonic acid (methyl‐D3) (MMA‐D3, purity 98%, IS) and l‐leucine(5,5,5‐D3) (Leu‐d3, purity 99%, IS) were purchased from Cambridge isotopes laboratories (Tewksbury, MA, US). LC–MS grade methanol was obtained from Biosolve BV (Valkenswaard, Netherlands). Milli‐Q water was produced in‐house using a Siemens Ultra Clear system. Luna PFP (150 mm × 4.6 mm, 3 µm) column was bought from Phenomenex (Torrance, CA, USA).
2.2. Instrumentation
A Thermo Scientific (Waltham, MA, USA) Dionex Ultimate 3000 liquid chromatograph coupled to an LTQ XL mass spectrometer was employed for analysis. An electrospray ionization (ESI) source in heated mode was utilized for analyte ionization. Data acquisition and processing were performed using Thermo Scientific Chromeleon and Xcalibur software.
2.3. Synthesis of α‐aminoadipic Semialdehyde and P6C
Due to the unavailability of commercially available AASA standards, we opted for its laboratory synthesis, adapting to established methods. We combined 5 mg of AEA with 15 mg of Amberlyst beads in 1 mL of water and agitated the mixture vigorously at 1500 RPM for 10 min. After filtering the solution, the beads were rinsed with 0.5 mL of water and returned to the filter. This rinsing and filtering were repeated twice with 1 mL of water each time. The final solution was then diluted with 3.1 mL of water. This resulted in a stock solution containing 1 mmol/L of AASA and 3 mmol/L of P6C, serving as the foundation for calibrator and control preparation.
2.4. Preparation of Standard Solutions
Initial stock solutions containing Leu, Ileu, Val, Pro, OH‐Pro, MMA, 3‐HIV, and PA were prepared in methanol at a concentration of 5 mg/mL. These were further diluted to create working stock solutions containing 1000 µg/mL of each analyte in a 50:50 methanol–water mixture, stored at −20°C. Calibration standards were prepared across different concentration ranges for three analyte groups: Group 1 (Leu, Ileu, Val, Pro, OH‐Pro, MMA, and 3‐HIV) at 0.1–500 µg/mL, Group 2 (AASA and PA) at 0.01–150 µg/mL, and Group 3 (P6C) at 0.03–450 µg/mL. Quality control (QC) samples representing low, medium, and high concentrations were prepared at 0.75, 150, and 460 µg/mL for Group 1; 0.05, 5, and 100 µg/mL for Group 2; and 0.15, 15 and 300 µg/mL for Group 3 (Table S3). To mimic real‐world samples, calibration and QC solutions were mixed with surplus urine from healthy individuals at a 1:40 volume‐to‐volume ratio. The mixtures were then applied to Whatman 903 filter paper and air‐dried for 2 h, resulting in DUS. IS solutions were formulated at a concentration of 10 µg/mL.
2.5. Sample Collection and Processing
The study received approval from the institutional ethics committee of Kasturba Medical College, Manipal, India (IEC 303/2019 dated May 15, 2019). Urine samples were collected from neonates by certified medical professionals at Kasturba Hospital, Manipal, 48 h after birth, with informed parental consent. The samples were initially collected in a minicom bag and then transferred to urine containers. They were temporarily stored at −20°C in the hospital and transported to the laboratory within 2 h. In the lab, creatinine levels were measured using modified Jaffe's method. Samples were aliquoted into Eppendorf tubes, coded, and stored at −80°C until further analysis. For urine analysis, a 10‐µL aliquot was diluted 100‐fold with methanol and water in 50:50 ratio and centrifuged at 9000 × g for 10 min. A total of 180 µL of the resulting supernatant was transferred to a vial, and 20 µL of IS solution was added. The mixture was sonicated for 2 min at 25°C, and 2 µL of the supernatant was then injected into the LC–MS system.
To prepare DUS, Whatman 903 filter paper was saturated with the urine sample. The DUS samples were dried and stored at −80°C for further analysis. For processing DUS samples, two 3.2 mm discs were punched out and placed into a 1.2‐mL capacity 96‐well plate. Analytes were extracted by adding 200 µL of working IS solution, prepared in methanol: 0.1% v/v formic acid solution (75:25). The plate was shaken for 30 min at 1000 RPM and then centrifuged at 4°C for 5 min. A 20‐µL aliquot of the supernatant was then injected into the LC–MS system.
In this study, analyte concentrations were standardized to creatinine level in the urine samples. This approach is commonly used in urine analysis to account for variability in sample concentration, which can arise due to differences in hydration or urine output. By normalizing to creatinine, we ensure that the analyte concentrations are comparable across different samples, providing a more accurate assessment of the biomarker levels. While creatinine normalization was essential during the sample analysis to address these physiological variations, it was not applied during the method validation phase. During validation, our primary focus was to evaluate the assay's analytical performance, and standard conditions were maintained without the need for normalization.
2.6. Chromatographic and Mass Spectrometric Conditions
Separation of analytes was achieved using a Luna PFP column (150 mm × 4.6 mm, 3 µm) procured from Phenomenex (Torrance, CA, USA). A gradient elution method was employed with mobile phases A (methanol), B (0.1% formic acid in water, adjusted to pH 2.76), and C (water) as outlined in Table S1. The column and the autosampler temperatures were set to 35°C and 4°C, respectively. The entire run lasted 10 min.
Selected reaction monitoring (SRM) was employed in both positive and negative ion modes. ESI was performed using a spray voltage of 4 V and a capillary voltage of −27 V. The ion source temperatures were set at 300°C and 350°C for the vaporizer and ion transfer capillary, respectively. Nitrogen gas flow rates for the sheath, auxiliary, and sweep gases were precisely controlled at 60, 20, and 1 arbitrary units. Additional parameters included a tube lens voltage of −33.39 V and a multipole offset voltage of 5 V. SRM transitions for both biomarkers and ISs, including ionization mode and collision energy, are detailed as follows: Leu (m/z 131.68 → 85.76, MOI: (+), CE: 20), Ileu (m/z 131.68 → 85.76, MOI: (+), CE: (20), Val (m/z 117.89 → 71.83, MOI: (+), CE: 20), Pro (m/z 116.13 → 69.88, MOI: (+), CE: 30), OH‐Pro (m/z 131.68 → 85.76, MOI: (+), CE: 20), MMA (m/z 116.92 → 73.09, MOI: (−), CE: 25), PA (m/z 129.95 → 84.12, MOI: (+), CE: 30), 3‐HIV (m/z 119.21 → 59.10, MOI: (−), CE: 32), AASA (m/z 146.12 → 127.72, MOI: (+), CE: 35), P6C (m/z 128.03 → 82.23, MOI: (+), CE: 35), Leu‐d3 (m/z 136 → 90, MOI: (+), CE: 20), and MMA‐d9 (m/z 120 → 76, MOI: (−), CE: 35).
2.7. Method Validation
The developed LC–MS analytical method underwent a rigorous validation process to ascertain accuracy, precision, linearity, and recovery, adhering to ICH M10 guidelines. Validation was performed using a set of 10 different urine samples obtained from healthy neonates. These samples varied in their content of salts, metabolites, and other matrix components, ensuring that the method was evaluated across a representative range of real‐world conditions. A blank subtraction technique was employed to evaluate linearity, accuracy, and recovery, accounting for endogenous analyte levels in control urine samples using the standard addition method. Regression analysis of the corrected analyte‐to‐IS ratios determined linearity, with Leu‐d3 used as the IS for amino acids (Leu, Ileu, Val, Pro, and OH‐Pro) and MMA‐d9 for organic acids (MMA, 3‐HIV, PA, AASA, and P6C). Accuracy was assessed by comparing calculated and nominal concentrations at multiple QC levels. Extraction recovery and matrix effects were evaluated by comparing analyte recovery from spiked samples to that from neat standards. These comprehensive assessments established the method's reliability and robustness [38, 39, 40, 41].
2.7.1. Evaluation of Dilution Integrity
The evaluation of dilution integrity was conducted to verify the method's accuracy in back‐calculating analyte concentrations that exceed the upper limit of quantification (LOQ) in real samples. To achieve this, dilution integrity QCs were prepared in both urine and DUS (n = 5) with concentrations of 1000 µg/mL for Group 1, 300 µg/mL for Group 2, and 900 µg/mL for Group 3 analytes. Following the extraction of analytes, the final extracts underwent serial dilution at a 1:5 ratio using the appropriate volume of water. These diluted samples were then processed and analyzed as per the established protocol. The concentrations of the dilution QCs were subsequently back‐calculated. In line with the ICH M10 guidelines, the precision and accuracy of these back‐calculated dilution QCs were required to stay within ±15% of the nominal value.
2.7.2. Assessment of Relative Matrix Effect
The impact of urine and DUS matrix components on analyte ionization in mass spectrometry was assessed. Calibration ranges of analytes were spiked into urine samples from five healthy neonates (Group 1: 0.1–500 µg/mL, Group 2: 0.01–150 µg/mL, Group 3: 0.03–450 µg/mL). Each concentration level was analyzed using LC–MS (with a total of n = 5 per level). Linear regression analysis with 1/x 2 weighting was used to generate standard curves for each urine sample. An acceptable assay, free from significant matrix effects, would exhibit standard curve slopes with a relative standard deviation below 3%–4%. In addition, individual data points were expected to deviate by no more than 15%, except at the lower limit of quantitation (LLOQ), where a deviation of up to 20% was permissible [42].
2.7.3. Stability Studies
The stability of the analytes within both urine and DUS matrices was evaluated through a series of experiments designed to simulate real‐world storage and handling conditions. Benchtop stability was assessed for low‐ and high‐QC samples at ambient temperature for up to 8 h. Refrigerator stability of mid‐QC samples was assessed at 2–8°C for up to 8 h. Autosampler stability of low and high QC samples was evaluated at 4°C for up to 48 h. Freeze–thaw stability was determined for low and high QC samples subjected to three freeze–thaw cycles at −80°C. Long‐term stability of analytes in DUS and urine was assessed at −80°C for up to 360 days. Stability was determined by calculating mean, standard deviation, and percent change for each condition.
2.8. Evaluation of Interconvertibility Between the Urine and Dried Urine Spot Assay
To assess the concordance between DUS and urine measurements, a comprehensive evaluation of interconvertibility was undertaken. Analyte concentrations quantified within DUS specimens from 50 neonates were compared to their corresponding urine concentrations. For both matrices, the concentration of each analyte was calculated. Subsequently, a Pearson correlation coefficient analysis was employed to quantify the linear association between DUS and urine analyte concentrations. In addition, a linear regression equation was established to predict the corresponding urine concentration based on the measured DUS concentration. Furthermore, a Bland–Altman analysis was performed to assess the distribution of differences in measurements between the two matrices, using a 95% confidence interval to evaluate the agreement.
2.9. Determination of Reference Range of Analytes in Dried Urine Spot
Leveraging the validated analytical method, a comprehensive reference range for the analytes of interest in DUS was established for the healthy neonates from Udupi, a coastal district in South India. The study recruited exclusively breastfed, 350 full‐term neonates (37–42 weeks gestation) with birth weights exceeding 2500 g. Both caesarean and vaginal deliveries were included, with the sole exclusion criteria being asphyxia, intravenous fluid requirement, or congenital malformations. The reference intervals for DUS metabolites were established using a nonparametric percentile approach, with results reported as the 2.5th to 97.5th percentiles, within a 95% confidence interval.
2.10. Determination of Greenness of Analytical Procedure
An assessment of the environmental impact of the analytical method was conducted using Analytical GREEnness Metric Approach Software (AGREE) [43]. This software uses a comprehensive framework encompassing 12 distinct criteria. Each criterion is scored on a scale of 0–1, with higher scores reflecting greater adherence to environmentally conscious principles. The assessment carefully considered factors such as the use of hazardous chemicals, waste production, and resource efficiency, all benchmarked against established environmental standards. Penalty points were assigned based on the method's compliance with each criterion. The overall score, calculated and displayed prominently in the center of a circular diagram, offers a visual representation of the method's greenness. Green segments indicate strong alignment with green chemistry principles, whereas red segments highlight areas of concern, with varying shades representing intermediate scores. This diagram provides a comprehensive and nuanced view of the method's environmental sustainability.
3. Results and Discussion
3.1. LC–MS/MS Method
A reversed‐phase Luna PFP column was utilized to effectively separate a diverse range of biomarkers, including structurally similar amino acids. The PFP column, with its pentafluorophenyl group bonded to the trimethylsilane skeleton, provided enhanced selectivity for the analytes, leveraging their polar and slight lipophilic properties (refer to Table 2 for details on these properties). The method employs a linear mobile phase gradient to separate these analytes effectively (Table S1). The observed retention times for the analytes were 2.62, 2.88, 3.62, 3.83, 4.15, 4.15, 4.38, 4.48, 6.83, 7.59, 2.61, and 7.53 min for MMA, 3‐HIV, OH‐Pro, Pro, AASA, P6C, PA, Val, Ileu, Leu, MMA‐d9, and Leu‐d3, respectively. Figure 2 presents the chromatograms for all 10 analytes, along with their corresponding ISs. This method demonstrates efficient separation and distinct retention times for each analyte, confirming its suitability for analyzing compounds with similar structures and slight differences in lipophilicity.
TABLE 2.
Physicochemical properties of the analytes relevant to LC–MS method development.
| Analyte | Molecular weight (g/mol) | Hydrogen bond Acceptors | Hydrogen bond donors | Log p | pKa |
|---|---|---|---|---|---|
| Leucine | 131.17 | 3 | 2 | −1.52 | 2.79 |
| Isoleucine | 131.17 | 3 | 2 | −1.70 | 2.79 |
| Valine | 117.14 | 3 | 2 | −2.26 | 2.72 |
| Proline | 115.13 | 3 | 2 | −2.54 | 1.99 |
| 4‐Hydroxy proline | 131.12 | 4 | 3 | −3.17 | 1.82 |
| Pipecolic acid | 129.16 | 3 | 2 | −2.31 | 2.06 |
| Methylmalonic acid | 118.09 | 4 | 2 | 0.21 | 2.48 |
| 3‐Hydroxyisovaleric acid | 118.13 | 3 | 2 | −0.11 | 4.55 |
| α‐Aminoadipic semialdehyde | 145.16 | 4 | 2 | −2.9 | 2.25 |
| Piperideine‐6‐carboxylate | 127.14 | 3 | 1 | −1.8 | 2.00 |
FIGURE 2.
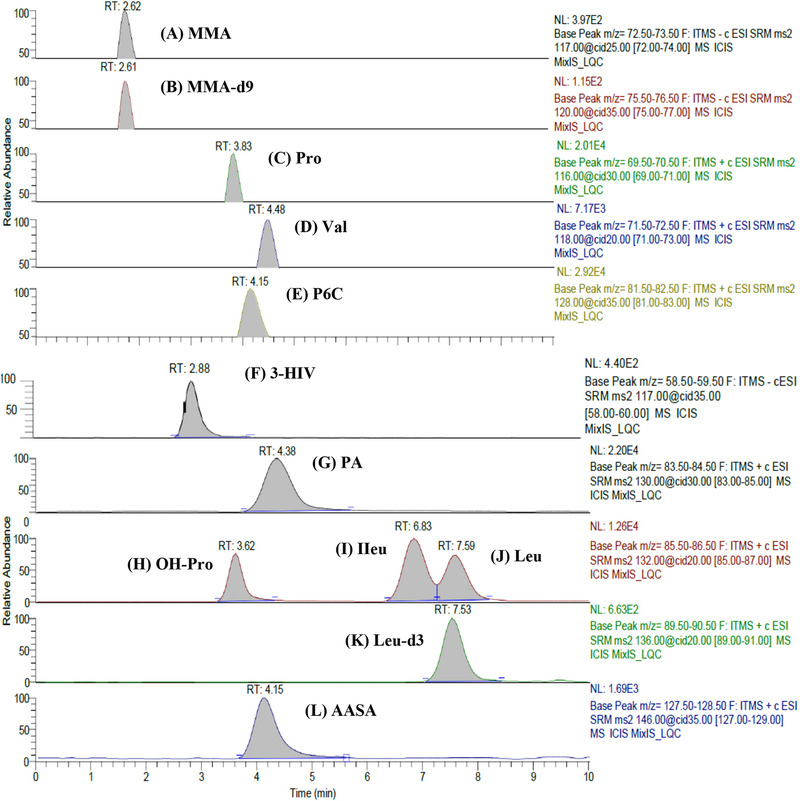
Chromatograms of analytes in spiked dried urine spot at LQC (A) Methylmalonic acid (RT 2.62 min). (B) Methylmalonic acid‐d9 (RT 2.61 min). (C) Proline (RT 3.83 min). (D) Valine (RT 4.48 min). (E) Piperideine‐6‐carboxylate (RT 4.15 min). (F) 3‐Hydroxyisovaleric acid (RT 2.88 min). (G) Pipecolic acid (RT 4.38 min). (H) Hydroxyproline (RT 3.62 min). (I) Isoleucine (RT 6.83 min). (J) Leucine (RT 7.59 min). (K) Leucine‐d3 (RT 7.53 min). (L) α‐Aminoadipic semialdehyde (RT 4.15 min).
3.2. Method Validation
3.2.1. Linearity and LLOQ
A series of calibration standards were prepared for the analytes, spanning concentration ranges of 0.1–500 µg/mL for Group 1, 0.01–150 µg/mL for Group 2, and 0.03–450 µg/mL for P6C. On three distinct days, three independent calibration curves (CCs) were constructed. Utilizing XCalibur software and applying a 1/x 2 weighting factor, the linearity of these curves was assessed. Detailed information on the calibration range, corresponding linearity equations, and correlation coefficients (R‐values) for all 10 analytes in both DUS and urine matrices can be found in Table S2. Notably, the correlation coefficients exceeded the predetermined threshold of R > 0.99, signifying excellent linearity across the chosen concentration ranges. Furthermore, back‐calculated concentrations of the calibration standards demonstrated high accuracy. Deviations for the LLOQ standards remained within 20% of the target concentration, whereas all other CC standards exhibited deviations within a tighter limit of 15%. These findings collectively validate the suitability and reliability of this technique within the investigated concentration range.
3.2.2. Accuracy and Precision
Intraday and interday accuracy and precision were assessed using QC samples at multiple concentration levels. To ensure consistency in the number of parallels for intraday and interday testing, we maintained a constant number of replicates across both assessments. Specifically, we analyzed six replicates of QC samples on a single day for the intraday precision evaluation. For interday precision, we conducted three separate runs on consecutive days, each utilizing six replicates of QC samples at multiple concentration levels. This approach ensures that assessment of accuracy and precision are reliable and comparable across both intraday and interday analyses. Acceptable accuracy and precision were defined as a bias of ±15% (or ±20% for the LLOQ) and a coefficient of variation (CV) of ≤ 15%, respectively. Linearity was confirmed before each accuracy and precision run. In urine, the intraday precision (%CV) was observed to be under 6.8%, with accuracy ranging 90.1%–104.9%. The interday precision (%CV) similarly was below 7%, and accuracy ranged 90.6%–104.9% for all 10 analytes. In DUS, the intraday precision (%CV) was under 6.9%, with accuracy ranging 91.5%–105%, whereas the interday precision (%CV) was less than 7%, with accuracy ranging 90.4%–104.9% for all 10 analytes. The results, detailed in Table S4, demonstrate that the method exhibits excellent repeatability and reproducibility for quantifying the metabolites in both urine and DUS.
3.2.3. Recovery
A comprehensive recovery assessment was performed to gauge the efficiency and reproducibility of analyte and IS extraction from the matrix. This involved analyzing five replicates of urine and DUS samples across three concentration levels (low, medium, and high QC). Extraction efficiency was evaluated by comparing the responses of analytes (adjusted for endogenous background) in samples spiked before extraction with those spiked after extraction [44]. For urine samples, average recovery percentages ranged 87.2%–96.9%, whereas in DUS samples, recoveries ranged 88.4%–103%. These findings suggest that the chosen extraction method is highly efficient, with mean recovery values consistently exceeding 87% in both urine and DUS samples. In addition, the %CV values were within acceptable limits (< 8%), indicating consistent and reproducible recovery across different concentration levels. This consistency is crucial for ensuring the reliability and accuracy of the analytical method across multiple samples and concentrations. The high recovery percentages and low %CV values corroborate its suitability for routine analytical applications. Furthermore, the detailed breakdown of urine and DUS recovery percentages across various QC levels is provided in Table S4, offering a comprehensive view of the extraction efficiency at different concentration levels. Overall, these results demonstrate the method's reliability and robustness in quantifying the analytes of interest in both urine and DUS samples, confirming its applicability for diverse analytical needs.
3.2.4. Dilution Integrity
To ensure the validity of analysis on diluted samples, a thorough evaluation was conducted to assess the effects of the dilution process on both accuracy and precision. The results showed that the dilution technique did not significantly impact the accuracy or precision of the analysis, regardless of the sample matrix (urine or DUS). The average calculated concentrations of the analytes were closely aligned with the expected values, indicating that the dilution process effectively adjusted spiked samples to fall within measurable limits without compromising result fidelity. Furthermore, the consistency and correctness of the measurements were maintained within the expected limits, underscoring the reliability of the dilution procedure. Table 3 presents a detailed overview of the average concentrations, accuracy, and precision for the samples subjected to dilution.
TABLE 3.
Mean calculated concentration, accuracy, and precision for the dilution integrity samples of analytes.
| Analyte | Spiked conc. (µg/mL) | Urine | Dried urine spot | ||||
|---|---|---|---|---|---|---|---|
| Mean calculated conc. (µg/mL) | Accuracy (%) | Precision (%CV) | Mean calculated conc. (µg/mL) | Accuracy (%) | Precision (%CV) | ||
| Leu | 1000 | 1008.5171 | 100.85 | 3.69 | 1029.7339 | 102.97 | 6.91 |
| Ileu | 1000 | 985.8966 | 98.59 | 5.63 | 900.7611 | 90.08 | 0.56 |
| Valine | 1000 | 985.9719 | 98.60 | 3.95 | 1017.3725 | 101.74 | 0.39 |
| Proline | 1000 | 969.9135 | 96.99 | 1.96 | 907.8548 | 90.79 | 2.60 |
| OH‐Pro | 1000 | 938.0582 | 93.81 | 0.76 | 981.5652 | 98.16 | 0.86 |
| MMA | 1000 | 1032.7434 | 103.27 | 6.88 | 958.4548 | 95.85 | 5.30 |
| 3‐HIV | 1000 | 924.9514 | 92.50 | 2.41 | 921.2613 | 92.13 | 0.50 |
| PA | 300 | 300.0167 | 100.01 | 2.07 | 297.4662 | 99.16 | 5.32 |
| AASA | 300 | 307.4438 | 102.48 | 4.26 | 305.2522 | 101.75 | 4.67 |
| P6C | 900 | 935.3397 | 103.93 | 1.32 | 816.4166 | 90.71 | 0.75 |
Abbreviations: 3‐HIV, 3‐hydroxyisovaleric acid; AASA, α‐aminoadipic semialdehyde; CV, coefficient of variation; Ileu, isoleucine; Leu, leucine; MMA, methylmalonic acid; OH‐Pro, 4‐hydroxy proline; P6C, piperideine‐6‐carboxylate; PA, pipecolic acid.
3.2.5. Relative Matrix Effect
Matrix effects were assessed by analyzing standard curves in five different urine samples. Minimal variation in slopes (> 3.9%; Table S5) indicated consistent analyte responses across different biological matrices, suggesting negligible relative matrix effects. Precision of individual measurements remained within the acceptable 15% limit, further supporting method reliability. These findings align with established guidelines [45], confirming the absence of significant relative matrix effects. Observed ionization response differences were primarily attributed to analyte properties rather than matrix variations. Consequently, the method accurately quantifies analyte concentrations in both urine and DUS, demonstrating its suitability for clinical and research applications.
3.2.6. Stability Studies
A robust evaluation of biomarker stability is paramount, encompassing both analytical conditions and storage parameters. To this end, we conducted comprehensive stability studies adhering to recommended FDA stress conditions. A cornerstone of reliable biomarker analysis lies in their demonstrated stability throughout the analytical workflow and during storage. To ensure the integrity of our findings, we embarked on comprehensive stability studies, adhering to the stringent stress conditions outlined by the FDA. The results of stability evaluations are provided in Figures 3 and 4. Benchtop stability studies at room temperature revealed excellent stability for all biomarkers over 8 h, with DUS maintaining percent changes of < 3% for both control levels, whereas urine showed slightly higher variability at < 5%. The impact of autosampler residence time at 4°C was also evaluated. Gratifyingly, all biomarkers remained stable within 5% for up to 48 h at both low and high QC levels. This reinforces their compatibility with automated analytical systems, streamlining the analytical process. Long‐term stability studies at −80°C revealed excellent stability for most biomarkers over 360 days, with the exception of AASA and P6C. Both DUS and urine exhibited stability within acceptable ranges, with DUS maintaining percent changes of within 8% for both control levels, whereas urine showed slightly higher variability of within 11%. While we did not perform a statistical evaluation, DUS displayed marginally better stability in this context, suggesting it may offer advantages in long‐term storage, particularly relevant for large‐scale studies or biobanking initiatives. The freeze–thaw stability studies further solidified the robustness of the analytes. All biomarkers exhibited percent changes within a modest range of 9%. This translates to minimal analyte degradation upon repeated freezing and thawing cycles, facilitating sample handling and analysis without compromising data integrity. All biomarkers exhibited stability in methanol‐based stock solutions, with percent changes remaining within ±5% over 8 h. Overall, the observed stability profiles were within the accepted threshold of ±15%, demonstrating exceptional stability of the biomarkers in both DUS and urine. However, DUS stands out for its superior long‐term stability, logistical advantages, and resilience to freeze–thaw cycles. These combined strengths render DUS a compelling choice for biomarker analysis, particularly in settings facing logistical constraints or requiring long‐term sample storage. Furthermore, whereas long‐term stability of DUS samples was validated in our study under freezer conditions, existing literature suggests that DUS can exhibit reasonable short‐term stability at room temperature [46, 47]. This enhances transportation efficiency and reduces the risk of contamination during sample handling. One limitation of our stability evaluation is that we did not evaluate the long‐term stability at room temperature. Future studies are warranted to comprehensively evaluate the DUS stability at room temperature.
FIGURE 3.
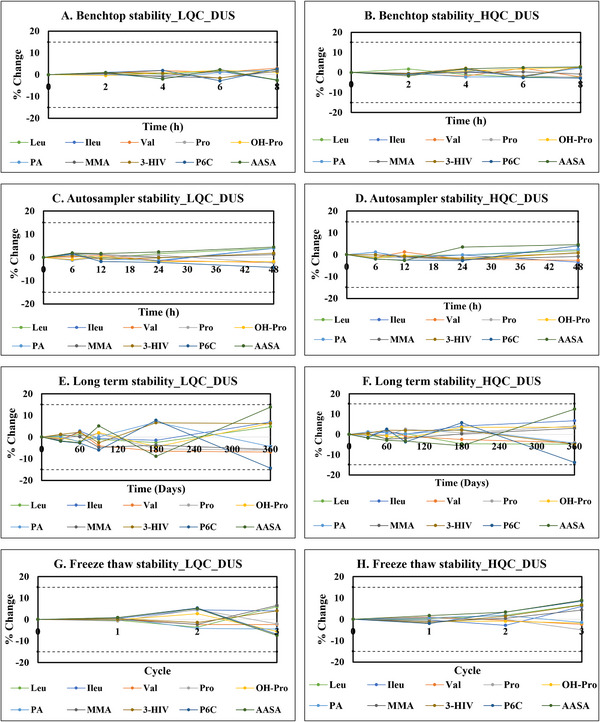
Stability studies for analytes indicative of cofactor‐dependent inborn metabolic disorders in dried urine samples (A) Benchtop stability of analytes at LQC. (B) Benchtop stability of analytes at HQC. (C) Autosampler stability of analytes at LQC. (D) Autosampler stability of analytes at HQC. (E) Long‐term stability of analytes at LQC. (F) Long‐term stability of analytes at HQC. (G) Freeze–thaw stability of analytes at LQC. (H) Freeze–thaw stability of analytes at HQC.
FIGURE 4.
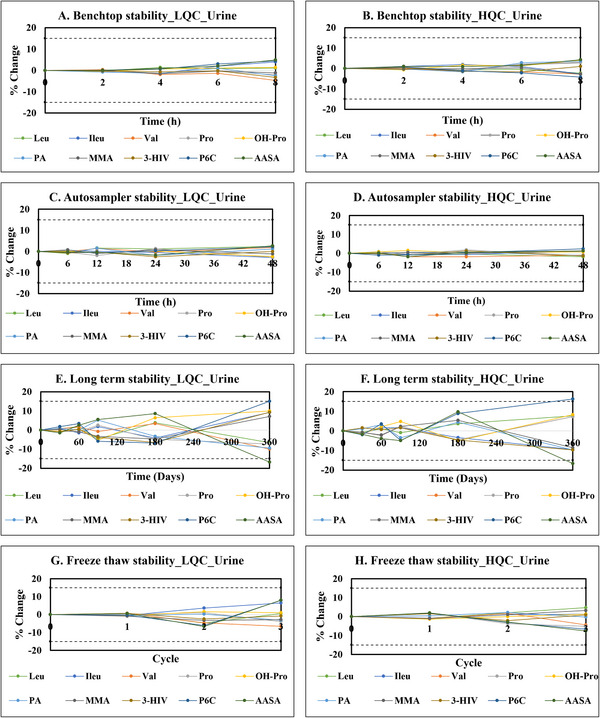
Stability studies for analytes indicative of cofactor‐dependent inborn metabolic disorders in urine. (A) Benchtop stability of analytes at LQC. (B) Benchtop stability of analytes at HQC. (C) Autosampler stability of analytes at LQC. (D) Autosampler stability of analytes at HQC. (E) Long‐term stability of analytes at LQC. (F) Long‐term stability of analytes at HQC. (G) Freeze–thaw stability of analytes at LQC. (H) Freeze–thaw stability of analytes at HQC.
3.3. Evaluation of Interconvertibility Between the Urine and Dried Urine Spot Assay
Our investigation employed the Pearson correlation coefficient to assess the relationship between DUS and urine concentrations of the analytes. Linear regression equations were developed for each analyte (see Figure 5). These equations, along with their associated R 2 values, provide valuable information on the reliability and accuracy of converting DUS concentrations to equivalent urine levels. The strong correlations (R 2 values ranging from 0.8432 to 0.9977) observed between the analyte levels in the DUS and urine matrices signify a high degree of comparability between the two. This strong correlation likely arises from the fact that both DUS and liquid urine reflect the same physiological excretion profile of metabolites. Although DUS involves drying, which can slightly alter certain chemical properties (e.g., concentration through water evaporation or stability of labile compounds), the analytes remain stable and quantitatively comparable. This ensures that DUS serves as a reliable alternative to liquid urine for estimating metabolite levels, especially when sample handling, storage, and transport need to be optimized. This comparability ensures the use of DUS as a reliable method for estimating urine concentrations of these analytes.
FIGURE 5.
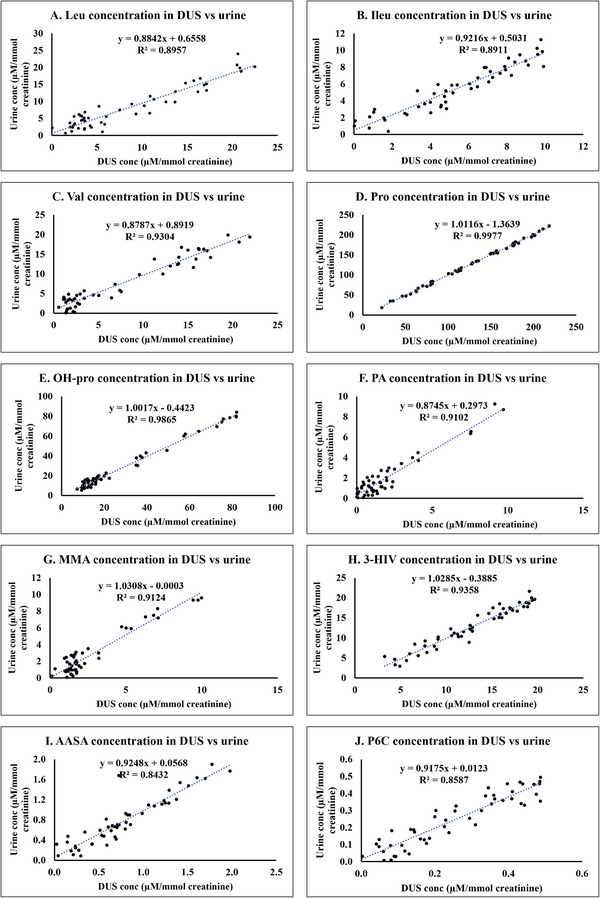
Linear regression plots of concentration of biomarkers indicative of cofactor‐dependent inborn metabolic disorders in dried urine spot versus urine. (A) Leucine. (B) Isoleucine. (C) Valine. (D) Proline. (E) Hydroxyproline. (F) Pipecolic acid. (G) Methylmalonic acid. (H) 3‐Hydroxyisovaleric acid. (I) α‐Aminoadipic semialdehyde. (J) Piperideine‐6‐carboxylate.
To further substantiate the concordance between DUS and urine methodologies, we conducted a Bland–Altman analysis to understand the bias. This analysis yielded mean ± SD and mean bias values for analytes in DUS compared to their corresponding values in urine, as detailed in Table 4. These findings from the Bland–Altman analysis demonstrate a good level of agreement between DUS and urine for measuring all 10 analytes. The minimal mean bias observed for each analyte signifies an absence of any systematic discrepancy between the two methods. Furthermore, the limits of agreement, calculated as the mean bias ±1.96 SD, were found to be relatively narrow. This implies a good degree of agreement between the two methodologies. Visual representations of the Bland–Altman analysis for each analyte are provided in Figure 6.
TABLE 4.
Mean ± SD and mean bias values obtained for analytes in dried urine spot compared to their corresponding values in urine using Bland–Altman analysis.
| Analyte | Mean ± SD (µM/mmol creatinine) | Mean bias | |
|---|---|---|---|
| Dried urine spot | Urine | ||
| Leu | 8.4861 ± 6.5429 | 8.1595 ± 6.1130 | 0.3267 |
| Ileu | 5.3867 ± 2.8751 | 5.4676 ± 2.8069 | −0.0808 |
| Valine | 7.6163 ± 6.6855 | 7.5841 ± 6.0901 | 0.0323 |
| Proline | 128.4935 ± 54.7066 | 128.6158 ± 55.4029 | −0.1223 |
| OH‐Pro | 29.0776 ± 24.2274 | 28.6838 ± 24.4330 | 0.3938 |
| MMA | 2.6583 ± 2.4838 | 2.7399 ± 2.6804 | −0.0816 |
| 3‐HIV | 12.7495 ± 4.7940 | 12.7237 ± 5.0966 | 0.0257 |
| PA | 1.8601 ± 2.2249 | 1.9240 ± 2.0394 | −0.0639 |
| AASA | 0.0257 ± 0.4761 | 0.7795 ± 0.4795 | 0.0019 |
| P6C | 0.2541 ± 0.1515 | 0.2454 ± 0.1500 | 0.0087 |
Abbreviations: 3‐HIV, 3‐hydroxyisovaleric acid; AASA, α‐aminoadipic semialdehyde; CV, coefficient of variation; Ileu, isoleucine; Leu, leucine; MMA, methylmalonic acid; OH‐Pro, 4‐hydroxy proline; P6C, piperideine‐6‐carboxylate; PA, pipecolic acid.
FIGURE 6.
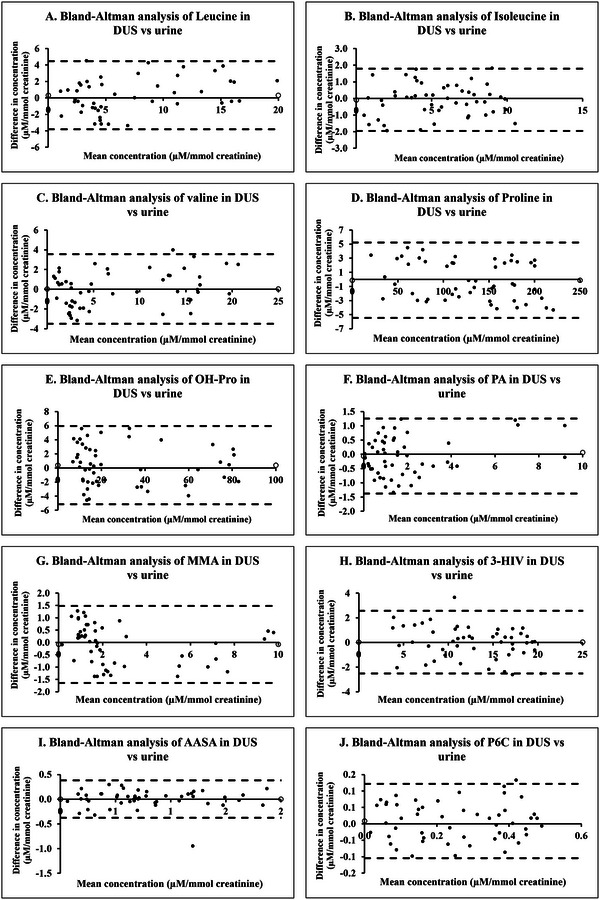
Bland–Altman plots of concentration of biomarkers indicative of cofactor‐dependent inborn metabolic disorders in dried urine spot versus urine. (A) Leucine. (B) Isoleucine. (C) Valine. (D) Proline. (E) Hydroxyproline. (F) Pipecolic acid. (G) Methylmalonic acid. (H) 3‐Hydroxyisovaleric acid. (I) α‐Aminoadipic semialdehyde. (J) Piperideine‐6‐carboxylate.
3.4. Determination of Reference Range of Analytes in Dried Urine Spot
Reference ranges for biomarkers can exhibit considerable variation across different geographical regions [48, 49]. This research aimed to define reference intervals for biomarkers associated with cofactor‐dependent metabolic disorders in newborns from Udupi, a coastal district in South India. The study cohort consisted of 350 full‐term neonates of which 55.71% were males and 44.29% females. The reference ranges for Leu, Ileu, Val, Pro, OH‐Pro, MMA, 3‐HIV, PA, AASA, and P6C were found to be 0.32–32.38, 0.28–9.59, 0.50–19.69. 14.79–212.44, 7.63–205.45, 0.02–9.59, 0.46–13.24, 3.62–19.29, 0.04–1.92, and 0.01–0.48 µM/mmol creatinine, respectively. Comprehensive data can be found in Table S6. Intriguingly, the reference ranges identified in this study diverge considerably from those reported in other geographical regions. For instance, a study (n = 470) conducted in Basque county [50] documented reference ranges for Leu, Val, MMA, and 3‐HIV in neonatal urine as 13–40 µM/mmol creatinine, 5–24 µM/mmol creatinine, 10–20 µM/mmol creatinine, and 6–8 µM/mmol creatinine, respectively. Another study, which calculated the normal ranges based on their own analysis of 48 subjects as well as previously published literature, reported the normal ranges of Leu, Ileu, Val, Pro, OH‐Pro, and MMA in neonatal urine as 0.33–13.41 µM/mmol creatinine, 0.29–7.3 µM/mmol creatinine, 0.99–18.44 µM/mmol creatinine, 9.5–78.2 µM/mmol creatinine, 8.12–92.19 µM/mmol creatinine, and 0.42–19.74 µM/mmol creatinine, respectively [51]. In addition, a French study (n = 40) reported reference ranges of 3–25 µM/mmol creatinine for Leu, 0–6 µM/mmol creatinine for Ileu, and 3–26 µM/mmol creatinine for Val in neonatal urine [52]. A Spanish study (n = 60) reported the normal range of Val, Pro, and OH‐Pro as 4–28 µM/mmol creatinine, 8–260 µM/mmol creatinine, and 4–230 µM/mmol creatinine, respectively [53]. Control values for PA and AASA in urine (< 6 months of age) are reported to be 0.55–24 µM/mmol creatinine and 0–1 µM/mmol creatinine, respectively [54]. Control values for P6C and AASA in urine (< 6 months of age) are reported to be 0–0.37 µM/mmol creatinine and 0–2 µM/mmol creatinine, respectively [55].
These variations emphasize the importance of establishing localized reference ranges for biomarkers, as they can be influenced by genetic, environmental, dietary, and socioeconomic factors unique to each population. The data from Udupi are particularly valuable for improving the accuracy of diagnostic criteria and treatment protocols for the cofactor‐dependent metabolic disorders in this specific region. Such region‐specific reference ranges enhance the precision of clinical assessments, ensuring that healthcare interventions are appropriately tailored to the population being served. This is especially critical in neonatal care, where prompt diagnosis and treatment can greatly influence long‐term health and development.
3.5. Greenness of Analytical Method
The method's environmental impact was assessed using the AGREE analytical greenness metrics approach. A commendable score of 0.65 reflects the environmental friendliness of the method, which notably does not involve derivatization or the use of acidic reagents. The green characteristics of the method are visually depicted in a pictogram, as shown in Figure S1. Our method stands out for its environmentally advantageous features, which reduces hazardous waste. The comprehensive analytical greenness analysis provides an in‐depth overview of its environmental performance. The analysis report is provided as Table S7. In summary, the findings indicate that the new method aligns well with green chemistry principles and has the potential to minimize the ecological impact of analytical chemistry practices.
4. Conclusion
The creation and validation of a highly precise LC–MS‐based bioanalytical method enabled the simultaneous quantification of biomarkers indicative of cofactor‐dependent metabolic disorders from a single DUS sample. This method demonstrated excellent linearity and sensitivity, achieving LLOQ of 0.1 µg/mL (Leu, Ileu, Val, Pro, OH‐Pro, MMA, and 3‐HIV), 0.01 µg/mL (PA and AASA) and 0.03 µg/mL (P6C). In addition, all 10 biomarkers have shown stability in DUS matrix. In conclusion, the collective weight of our evidence strongly suggests that DUS serves as a reliable and accurate alternative for measuring concentrations of the selected biomarkers present in urine. This finding holds immense significance, particularly for scenarios where traditional venous blood collection presents challenges or is entirely impractical. Neonatal populations, for instance, would benefit tremendously from this non‐invasive approach. The simplified sample preparation, ease of transport of DUS samples, and better long‐term stability on storage at −80°C make DUS ideal for large‐scale studies and in resource‐limited clinical settings where sample logistics are a concern. In addition, the method's environmentally sustainable design avoids the use of derivatization agents and acidic reagents—minimizes hazardous waste, making it an ecofriendly alternative to conventional techniques such as GC–MS and HPLC. The high sensitivity and accuracy, coupled with its green chemistry principles, ensure that this method is both scientifically rigorous and environmentally responsible. By avoiding multiple analytical techniques used to quantify the 10 biomarkers responsible for the cofactor‐dependent IMDs individually, this comprehensive approach of simultaneous analysis for all biomarkers can save the cost and time for analysis. The method was effectively utilized to establish and document the reference ranges for these biomarkers within a coastal district population in South India. The data on reference range for the biomarkers of cofactor‐dependent metabolic disorders in dried urine samples generated through our study will help in providing accurate diagnosis of the disorder in the specific population. Since there is no traditional method available to quantify the biomarkers for the cofactor‐dependent IMDs simultaneously, a cross‐validation was not performed. There is a future scope to cross‐validate the results obtained from this method with individual methods used traditionally before the method could be transferred to any laboratory for routine use.
5. Limitations of the Method
In our study, urine samples were collected conventionally and then prepared as DUS, though direct DUS collection can be less invasive in routine settings—such as by absorbing urine from diapers with minimal intervention. However, DUS collection from newborns, especially in the first few days of life, can present challenges due to the risk of faecal contamination, which may complicate sample integrity. This is particularly an issue for infants aged 3–5 days, where bowel movements are frequent. To mitigate this, non‐invasive strategies such as use of urine collection bags, or timed diaper monitoring could be adopted. Cotton diapers allow better urine absorption compared to plastic‐lined diapers, making them a practical, eco‐friendly solution.
Conflicts of Interest
The authors declare no conflicts of interest.
Supporting information
SUPPORTING INFORMATION
Acknowledgments
The authors express their gratitude to the Department of Biochemistry for granting access to the DBS punch. Arya Raveendran extends her appreciation to Manipal Academy of Higher Education for the support provided through the Dr. TMA Pai Fellowship.
Funding: This work is a part of Grand Challenges Canada‐funded project titled “Need and Viability of Newborn Screening Program in India” with the funding ID: R‐ST‐POC‐1707‐07275, supported by the Government of Canada.
Data Availability Statement
The data that supports the findings of this study are available in the Supporting Information Material of this article.
References
- 1. Martins A. M., “Inborn Errors of Metabolism: A Clinical Overview,” Sao Paulo Medical Journal 117 (1999): 251–265, 10.1590/S1516-31801999000600006. [DOI] [PubMed] [Google Scholar]
- 2. Douglas T. D. and Singh R. H., “Impact of Sapropterin (Tetrahydrobiopterin, BH4) Treatment, With and Without Diet Liberalization, on Monoamine Status and Quality of Life in a Phenylketonuria (PKU) Cohort” (Doctoral diss., Emory University, 2012), https://www.proquest.com/openview/b41c140e92a9ccc02e372652c29f0293/1?pq‐origsite=gscholar&cbl=18750. [Google Scholar]
- 3. Agana M., Frueh J., Kamboj M., Patel D. R., and Kanungo S., “Common Metabolic Disorder (Inborn Errors of Metabolism) Concerns in Primary Care Practice,” Annals of Translational Medicine 6 (2018): 469. [DOI] [PMC free article] [PubMed] [Google Scholar]
- 4. Baumgartner M. R., “Vitamin‐Responsive Disorders: Cobalamin, Folate, Biotin, Vitamins B1 and E,” in Handbook of Clinical Neurology, eds. Dulac O., Lassonde M., and Sarnat H. B. (Amsterdam: Elsevier, 2013): 1799–1810. [DOI] [PubMed] [Google Scholar]
- 5. Stockler S., Plecko B., Gospe S. M., et al., “Pyridoxine Dependent Epilepsy and Antiquitin Deficiency: Clinical and Molecular Characteristics and Recommendations for Diagnosis, Treatment and Follow‐Up,” Molecular Genetics and Metabolism 104 (2011): 48–60. [DOI] [PubMed] [Google Scholar]
- 6. Wilson M. P., Plecko B., Mills P. B., and Clayton P. T., “Disorders Affecting Vitamin B6 Metabolism,” Journal of Inherited Metabolic Disease 42 (2019): 629–646. [DOI] [PubMed] [Google Scholar]
- 7. Kuhara T., Akiyama T., Ohse M., et al., “Identification of New Biomarkers of Pyridoxine‐Dependent Epilepsy by GC/MS‐Based Urine Metabolomics,” Analytical Biochemistry 604 (2020): 113739. [DOI] [PubMed] [Google Scholar]
- 8. Wang H.‐S. and Kuo M.‐F., “Vitamin B6 Related Epilepsy During Childhood,” Chang Gung Medical Journal 30 (2007): 396–401. [PubMed] [Google Scholar]
- 9. Mitsubuchi H., Nakamura K., Matsumoto S., and Endo F., “Inborn Errors of Proline Metabolism,” Journal of Nutrition 138 (2008): 2016S–2020S. [DOI] [PubMed] [Google Scholar]
- 10. Farrant R. D., Walker V., Mills G. A., Mellor J. M., and Langley G. J., “Pyridoxal Phosphate De‐Activation by Pyrroline‐5‐Carboxylic Acid: Increased Risk of Vitamin B6 Deficiency and Seizures in Hyperprolinemia Type II,” Journal of Biological Chemistry 276 (2001): 15107–15116. [DOI] [PubMed] [Google Scholar]
- 11. Mitsubuchi H., Nakamura K., Matsumoto S., and Endo F., “Biochemical and Clinical Features of Hereditary Hyperprolinemia,” Pediatrics International 56 (2014): 492–496. [DOI] [PMC free article] [PubMed] [Google Scholar]
- 12. Goodman S. I., Mace J. W., Miles B. S., Teng C. C., and Brown S. B., “Defective Hydroxyproline Metabolism in Type II Hyperprolinemia,” Biochemical Medicine 10 (1974): 329–336. [DOI] [PubMed] [Google Scholar]
- 13. Onenli‐Mungan N., Yüksel B., Elkay M., Topaloğlu A. K., Baykal T., and Ozer G., “Type II Hyperprolinemia: A Case Report,” Turkish Journal of Pediatrics 46 (2004): 167–169. [PubMed] [Google Scholar]
- 14. Srivastava D., Singh R. K., Moxley M. A., Henzl M. T., Becker D. F., and Tanner J. J., “The Three‐Dimensional Structural Basis of Type II Hyperprolinemia,” Journal of Molecular Biology 420 (2012): 176–189. [DOI] [PMC free article] [PubMed] [Google Scholar]
- 15. Plecko B., “Pyridoxine and Pyridoxalphosphate Dependent Epilepsies,” in Handbook of Clinical Neurology, eds. Dulac O., Lassonde M., and Sarnat H. B. (Amsterdam: Elsevier, 2013): 1811–1817. [DOI] [PubMed] [Google Scholar]
- 16. Plecko B. and Struys E. A., “Vitamin B6‐Dependent and Vitamin B6‐Responsive Disorders” in Physician's Guide to the Diagnosis, Treatment, and Follow‐Up of Inherited Metabolic Diseases, eds. Blau N., Dionisi Vici C., Ferreira C. R., Vianey‐Saban C., and van Karnebeek C. D. M. (Cham: Springer International Publishing, 2022): 577–591. [Google Scholar]
- 17. van Karnebeek C. D. M., Tiebout S. A., Niermeijer J., et al., “Pyridoxine‐Dependent Epilepsy: An Expanding Clinical Spectrum,” Pediatric Neurology 59 (2016): 6–12. [DOI] [PubMed] [Google Scholar]
- 18. Michael Whitehead V., “Acquired and Inherited Disorders of Cobalamin and Folate in Children,” British Journal of Haematology 134 (2006): 125–136. [DOI] [PubMed] [Google Scholar]
- 19. Herrmann W. and Obeid R., “Cobalamin Deficiency” in Water Soluble Vitamins: Clinical Research and Future Application, ed. Stanger O. (Netherlands, Dordrecht: Springer, 2012): 301–322. [Google Scholar]
- 20. Hörster F. and Hoffmann G. F., “Pathophysiology, Diagnosis, and Treatment of Methylmalonic Aciduria—Recent Advances and New Challenges,” Pediatric Nephrology 19 (2004): 1071–1074. [DOI] [PubMed] [Google Scholar]
- 21. Suormala T., Baumgartner M. R., Coelho D., et al., “The cblD Defect Causes either Isolated or Combined Deficiency of Methylcobalamin and Adenosylcobalamin Synthesis,” Journal of Biological Chemistry 279 (2004): 42742–42749. [DOI] [PubMed] [Google Scholar]
- 22. Duran M. and Wadman S. K., “Thiamine‐Responsive Inborn Errors of Metabolism,” Journal of Inherited Metabolic Disease 8 (1985): 70–75. [DOI] [PubMed] [Google Scholar]
- 23. Thejeal R. F., Yahya F. S., and Abdulwahab S. B., “Maple Syrup Urine Disease: Clinical Presentation and Diagnosis at Children Welfare Teaching Hospital, Iraq,” Sri Lanka Journal of Child Health 51, no. 4 (2022): 553. [Google Scholar]
- 24. Kiuchi S., Ihara H., and Nishiguchi Y., “Thiamine Dependency and Related Gene Mutations: Recent Aspects,” International Journal of Analytical Bio‐Science 3 (2015): 73–83. [Google Scholar]
- 25. Yoshino M., Aoki K., Akeda H., et al., “Management of Acute Metabolic Decompensation in Maple Syrup Urine Disease: A Multi‐Center Study,” Pediatrics International 41 (1999): 132–137. [DOI] [PubMed] [Google Scholar]
- 26. Acosta P., Nutrition Management of Patients with Inherited Metabolic Disorders. Burlington, MA: Jones & Bartlett Publishers; 2010. [Google Scholar]
- 27. Baumgartner M. R. and Suormala T., “ Biotin‐Responsive Disorders ,” in Inborn Metabolic Diseases: Diagnosis and Treatment, eds. Saudubray J.‐M., van den Berghe G., and Walter J. H. (New York, NY: Springer, 2012): 375–384. [Google Scholar]
- 28. Majid H., Ahmed S., Muneer S., Hamid R., Jafri L., and Khan A. H., “Biotin‐Responsive Multiple Carboxylase Deficiency (MCD),” Journal of the College of Physicians and Surgeons–Pakistan 32 (2022): 823–825. [DOI] [PubMed] [Google Scholar]
- 29. Dupuis L., Campeau E., Leclerc D., and Gravel R. A., “Mechanism of Biotin Responsiveness in Biotin‐Responsive Multiple Carboxylase Deficiency,” Molecular Genetics and Metabolism 66 (1999): 80–90. [DOI] [PubMed] [Google Scholar]
- 30. Froese D. S. and Baumgartner M. R., “ Biotin‐Responsive Disorders ,” in Inborn Metabolic Diseases: Diagnosis and Treatment, eds. Saudubray J.‐M., Baumgartner M. R., García‐Cazorla Á., and Walter J. (New York, NY: Springer, 2022): 501–510. [Google Scholar]
- 31. Seymons K., De Moor A., De Raeve H., and Lambert J., “Dermatologic Signs of Biotin Deficiency Leading to the Diagnosis of Multiple Carboxylase Deficiency,” Pediatric Dermatology 21 (2004): 231–235. [DOI] [PubMed] [Google Scholar]
- 32. Li N., Deng C., and Zhang X., “Determination of Methylmalonic Acid and Glutaric Acid in Urine by Aqueous‐Phase Derivatization Followed by Headspace Solid‐Phase Microextraction and Gas Chromatography–Mass Spectrometry,” Journal of Separation Science 30 (2007): 266–271. [DOI] [PubMed] [Google Scholar]
- 33. Christou C., Gika H. G., Raikos N., and Theodoridis G., “GC–MS Analysis of Organic Acids in Human Urine in Clinical Settings: A Study of Derivatization and Other Analytical Parameters,” Journal of Chromatography B 964 (2014): 195–201. [DOI] [PubMed] [Google Scholar]
- 34. Skogvold H. B., Rootwelt H., Reubsaet L., Elgstøen K. B. P., and Wilson S. R., “Dried Blood Spot Analysis With Liquid Chromatography and Mass Spectrometry: Trends in Clinical Chemistry,” Journal of Separation Science 46 (2023): 2300210. [DOI] [PubMed] [Google Scholar]
- 35. Thomas S. N., French D., Jannetto P. J., Rappold B. A., and Clarke W. A., “Liquid Chromatography—Tandem Mass Spectrometry for Clinical Diagnostics,” Nature Reviews Methods Primers (2022): 96. [DOI] [PMC free article] [PubMed] [Google Scholar]
- 36. Chen C.‐J., Lee D.‐Y., Yu J., Lin Y.‐N., and Lin T.‐M., “Recent Advances in LC–MS‐Based Metabolomics for Clinical Biomarker Discovery,” Mass Spectrometry Reviews 42 (2023): 2349–2378. [DOI] [PubMed] [Google Scholar]
- 37. Reubsaet L. and Halvorsen T. G., “Advancements in Clinical Approaches, Analytical Methods, and Smart Sampling for LC–MS‐Based Protein Determination From Dried Matrix Spots,” Journal of Separation Science 47 (2024): 2400061. [DOI] [PubMed] [Google Scholar]
- 38. EMA , ICH M10 on bioanalytical method validation—Scientific guideline, accessed July 22, 2023, https://www.ema.europa.eu/en/ich‐m10‐bioanalytical‐method‐validation‐scientific‐guideline.
- 39. Raveendran A., Gupta A., Lewis L. E., Prabhu K., and Moorkoth S., “Liquid Chromatography‐Mass Spectrometric Method for the Simultaneous Analysis of Branched‐Chain Amino Acids and Their Ketoacids From Dried Blood Spot as Secondary Analytes for the Detection of Maple Syrup Urine Disease,” Journal of Mass Spectrometry and Advances in the Clinical Lab 34 (2024): 8–20. [DOI] [PMC free article] [PubMed] [Google Scholar]
- 40. FDA , Bioanalytical Method Validation Guidance for Industry |, accessed March 26, 2024, https://www.fda.gov/regulatory‐information/search‐fda‐guidance‐documents/bioanalytical‐method‐validation‐guidance‐industry.
- 41. Raveendran A., Gupta A., Lewis L. E., Prabhu K., and Moorkoth S., “A Comprehensive Approach for Detection of Biotin Deficiency From Dried Blood Spot Samples Using Liquid Chromatography–Mass Spectrometry,” Future Science OA 10 (2024): 2355038. [DOI] [PMC free article] [PubMed] [Google Scholar]
- 42. Matuszewski B. K., “Standard Line Slopes as a Measure of a Relative Matrix Effect in Quantitative HPLC–MS Bioanalysis,” Journal of Chromatography B 830 (2006): 293–300. [DOI] [PubMed] [Google Scholar]
- 43. Pena‐Pereira F., Wojnowski W., and Tobiszewski M., “AGREE—Analytical GREEnness Metric Approach and Software,” Analytical Chemistry 92 (2020): 10076–10082. [DOI] [PMC free article] [PubMed] [Google Scholar]
- 44. Roelofsen‐de Beer R. J. A. C., van Zelst B. D., Wardle R., Kooij P. G., and de Rijke Y. B., “Simultaneous Measurement of Whole Blood Vitamin B1 and Vitamin B6 Using LC‐ESI–MS/MS,” Journal of Chromatography B 1063 (2017): 67–73. [DOI] [PubMed] [Google Scholar]
- 45. Ghosh C., “Relative Matrix Effects: A Step Forward Using Standard Line Slopes and ANOVA Analysis,” Arabian Journal of Chemistry 12 (2019): 1378–1386. [Google Scholar]
- 46. Palmer E. A., Cooper H. J., and Dunn W. B., “Investigation of the 12‐Month Stability of Dried Blood and Urine Spots Applying Untargeted UHPLC–MS Metabolomic Assays,” Analytical Chemistry 91 (2019): 14306–14313. [DOI] [PubMed] [Google Scholar]
- 47. Antunes M. V., Niederauer C. G., and Linden R., “Development, Validation and Clinical Evaluation of a Dried Urine Spot Method for Determination of Hippuric Acid and Creatinine,” Clinical Biochemistry 46 (2013): 1276–1280. [DOI] [PubMed] [Google Scholar]
- 48. Ichihara K., Itoh Y., Min W.‐K., et al., “Diagnostic and Epidemiological Implications of Regional Differences in Serum Concentrations of Proteins Observed in Six Asian Cities,” Clinical Chemistry and Laboratory Medicine 42 (2004): 800–809. [DOI] [PubMed] [Google Scholar]
- 49. Ichihara K., Itoh Y., Lam C. W. K., et al., “Science Committee for the Asian‐Pacific Federation of Clinical Biochemistry, Sources of Variation of Commonly Measured Serum Analytes in 6 Asian Cities and Consideration of Common Reference Intervals,” Clinical Chemistry 54 (2008): 356–365. [DOI] [PubMed] [Google Scholar]
- 50. Embade N., Cannet C., Diercks T., et al., “NMR‐Based Newborn Urine Screening for Optimized Detection of Inherited Errors of Metabolism,” Scientific Reports 9 (2019): 13067. [DOI] [PMC free article] [PubMed] [Google Scholar]
- 51. López‐Hernández Y., Oropeza‐Valdez J. J., Blanco‐Sandate J. O., et al., “The Urinary Metabolome of Healthy Newborns,” Metabolites 10 (2020): 165. [DOI] [PMC free article] [PubMed] [Google Scholar]
- 52. Parvy P. R., Bardet J. I., Rabier D. M., and Kamoun P. P., “Age‐Related Reference Values for Free Amino Acids in First Morning Urine Specimens,” Clinical Chemistry 34 (1988): 2092–2095. [PubMed] [Google Scholar]
- 53. Casado M., Sierra C., Batllori M., Artuch R., and Ormazabal A., “A Targeted Metabolomic Procedure for Amino Acid Analysis in Different Biological Specimens by Ultra‐High‐Performance Liquid Chromatography‐Tandem Mass Spectrometry,” Metabolomics 14 (2018): 76. [DOI] [PubMed] [Google Scholar]
- 54. Bok L. A., Struys E., Willemsen M. A. A. P., Been J. V., and Jakobs C., “Pyridoxine‐Dependent Seizures in Dutch Patients: Diagnosis by Elevated Urinary Alpha‐Aminoadipic Semialdehyde Levels,” Archives of Disease in Childhood 92 (2007): 687–689. [DOI] [PMC free article] [PubMed] [Google Scholar]
- 55. Struys E. A., Bok L. A., Emal D., Houterman S., Willemsen M. A., and Jakobs C., “The Measurement of Urinary Δ1‐piperideine‐6‐carboxylate, the Alter Ego of α‐Aminoadipic Semialdehyde, in Antiquitin Deficiency,” Journal of Inherited Metabolic Disease 35 (2012): 909–916. [DOI] [PMC free article] [PubMed] [Google Scholar]
Associated Data
This section collects any data citations, data availability statements, or supplementary materials included in this article.
Supplementary Materials
SUPPORTING INFORMATION
Data Availability Statement
The data that supports the findings of this study are available in the Supporting Information Material of this article.