



Abstract
Background
Ulcerative colitis (UC) causes extensive ulceration attributable to intestinal inflammation. This study investigated the effect of past extensive ulcers (PEUs) on fecal calprotectin (FC).
Methods
This retrospective, single-center, observational study included patients with UC with a Mayo endoscopic subscore of 0. UC with scarring or pseudopolyposis was defined as PEU and FC and fecal immunochemical occult blood test (FIT) values were compared. The marker levels of patients in the PEU and non-PEU groups were examined to assess clinical relapse within 12 months.
Results
Of the 61 included patients, 27 had UC with PEUs and 34 had UC without PEUs. Albumin, hemoglobin, and FIT values between groups were not significantly different; however, the C-reactive protein and FC values of the PEU group were significantly higher than those of the non-PEU group. The FC values of the clinical relapse and remission groups within 12 months differed significantly. The cutoff values for the prediction of relapse within 12 months for all patients (area under the curve [AUC], 0.709; 95% confidence interval [CI], 0.512–0.907) and the non-PEU group (AUC, 0.893; 95% CI, 0.724–1.000) were both 118 mg/kg.
Conclusions
UC patients with PEUs have higher FC values than those without PEUs, even in remission. Additionally, FC values do not predict relapse in PEU patients. Therefore, FC may not be a sufficiently accurate biomarker for patients with PEUs.
Keywords: Ulcerative colitis, Fecal calprotectin, Fecal immunochemical occult blood test, Pseudopolyposis
Background
Ulcerative colitis (UC) is a chronic inflammatory disease of the intestinal tract that repeatedly relapses and remits [1]. Severe inflammation attributable to UC causes ulcers; during their healing, subsequent changes in the intestinal mucosa occur. As a result, the intestinal mucosa often becomes scarred; however, if extensive inflammation occurs, then polyps may form, leaving only the normal mucosa [2]. Both pseudopolyposis and scars form as a result of alternating cycles of inflammation and regeneration of ulcerative epithelium and both arise via similar mechanisms. Although, this state has no clear definition, it is referred to as pseudopolyposis. Pseudopolyposis includes a variety of morphologies, including hemispherical, club-shaped, and mucosal bridges. These forms vary depending on the degree and range of inflammation. Despite the considerable variation in UC, the incidence of pseudopolyposis is between 4% and 74% [3]. These postinflammatory changes lead to endoscopic findings, such as past extensive ulcers (PEUs), scarring, and pseudopolyposis. A PEU is considered a result of microfibrosis, which is caused by chronic tissue damage, impaired wound healing, and the fundamental expansion of mesenchymal cells that eventually become part of the extracellular matrix. UC affects the colonic mucosa and submucosa [4, 5]. After clinically severe inflammation and improvement, PEUs often remain in endoscopic remission.
According to STRIDE-II, the current treatment goal for UC is mucosal healing; therefore, biomarkers are used as monitoring tools to determine the achievement of mucosal healing [6]. In particular, fecal calprotectin (FC) and fecal immunochemical occult blood test (FIT) values are useful as fecal biomarkers of UC and can reflect the endoscopic score used to determine the state of the intestinal mucosa [7–10]. Furthermore, these fecal biomarkers not only reflect the state of the mucosa during measurement but also are useful for predicting subsequent relapse in patients with UC that is in clinical remission [9, 11, 12].
However, the effects of PEUs on these UC biomarkers have not been investigated. In this study, we investigated the effects of fibrosis in UC on fecal biomarkers. To evaluate the effects of PEUs, only inactive cases with a Mayo endoscopic subscore (MES) of 0 were targeted.
Methods
Patients
We collected data from 127 patients with UC treated at the Hamamatsu University School of Medicine between February 2019 and March 2023. To evaluate the effect of PEUs on biomarkers, we enrolled only cases with an MES of 0 that were endoscopically inactive. Based on these findings, 61 patients with UC and an MES of 0 in endoscopic remission were enrolled in this study (Fig. 1). UC was diagnosed according to the established criteria based on clinical symptoms and endoscopic and histological findings [1]. Patients with non-UC inflammatory bowel diseases, such as Crohn’s disease and inflammatory bowel diseases-unclassified, were excluded.
Fig. 1.
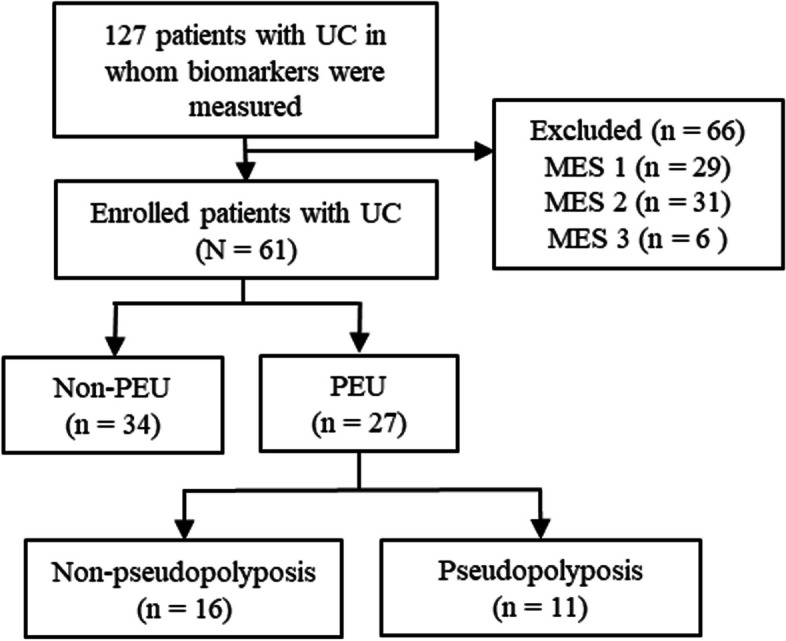
Study flow chart PEU, past extensive ulcer
The Rachmilewitz clinical activity index and MES were used to evaluate the clinical activity and endoscopic activity of UC, respectively [13, 14]. The MES was assessed as follows: 0, normal or inactive disease; 1, mild disease with erythema, decreased vascular patterns, and mild friability; 2, moderate disease with marked erythema, absence of vascular patterns, friability, and erosions; and 3, severe disease with spontaneous bleeding and ulceration [14].
Biomarker measurements
Colonoscopy preparation can influence the FC and FIT values; therefore, samples were collected from the same patient within a few days before colonoscopy preparation. Fecal samples used to perform FC measurements were collected in plastic tubes and stored at − 20 °C until shipment to the laboratory (SRL Inc., Tokyo, Japan). The measurement equipment and reagents for FC were a Phadia 250 immunoanalyzer (Thermo Fisher Scientific, Waltham, MA, USA) and Elia A Calprotectin 2 reagent (Phadia GmbH, Freiburg, Germany) using fluorescence enzyme immunoassay principles, respectively. Fecal samples for the FIT were collected using a stool collection kit (Eiken Chemical, Tokyo, Japan). Samples were immediately processed and examined at our facility using an OC Sensor io (Eiken Chemical).
Study design
The primary outcome measure of this retrospective, single-center, observational study was the difference in biomarkers between the PEU and non-PEU groups. The secondary outcome was the effect of PEU on biomarkers used to predict relapse. The PEU assessment was based on the endoscopist’s report and endoscopic imaging findings, and the imaging findings were determined by a consensus among expert gastrointestinal endoscopists. A PEU was defined as endoscopic evidence of scarring and/or pseudopolyposis. Pseudopolyposis included hemispherical, pedunculated, club-shaped, and mucosal bridge morphologies (Fig. 2). Patients were classified as having PEUs if they exhibited any of these characteristics. Some inflammatory polyps such as those covered in mucous were excluded.
Fig. 2.

Endoscopic findings of colonic past extensive ulcers (PEUs). Scarring (a) and hemispherical (b), pedunculated (mucosal tag) (c), and mucosal bridge (d) morphologies are observed
Patients enrolled in this study presented to the hospital once every 3 months. Patients who did not experience relapse were followed-up for up to 12 months, and those who experienced relapse within 12 months continued to present to the outpatient clinic. Clinical relapse was defined as an increase in the clinical activity index compared to that at baseline caused by worsening diarrhea and abdominal pain or frequent or bloody stools that required treatment modification or additional treatment. Treatment was changed at the discretion of the attending physician. Recurrence within 12 months was evaluated based on these findings. Only one of the 61 patients was lost to follow-up; therefore, the relapse cohort included 60 patients.
Statistical analysis
Differences between groups were evaluated using the Mann–Whitney U test or Student’s t test. For comparisons of three or more groups, the Kruskal–Wallis test was performed to determine significant differences. A receiver-operating characteristic (ROC) curve analysis was performed to predict relapse. The cumulative non-failure rate was evaluated using a Kaplan–Meier analysis with the log-rank test. Statistical analyses were performed using IBM SPSS Statistics for Windows version 24 (IBM Corp., Armonk, N.Y., USA) and EZR (Saitama Medical Center, Jichi Medical University, Saitama, Japan) software [15]. Statistical significance was set at P < 0.05.
Results
Patient characteristics
Among the 127 patients with UC, 66 patients with an MES of 1 to 3 were excluded and 61 patients with an MES of 0 were enrolled (Fig. 1). Baseline patient characteristics are presented in Table 1. The median patient age and disease duration were 51 years and 9 years, respectively. The median C-reactive protein (CRP), FIT, and FC values were 0.04 mg/dL, 30 ng/mL, and 174 mg/kg, respectively.
Table 1.
Baseline patient characteristics
| Characteristics | All | |
|---|---|---|
| N = 61 | ||
| Age (year), median [IQR] | 51 [39–63] | |
| Male / Female, n (%) | 40 (65.6) / 21 (34.4) | |
| Disease duration (year), median [IQR] | 9 [5–15] | |
| Disease extent, n (%) | Extensive colitis | 42 (68.9) |
| Left-sided colitis | 12 (19.7) | |
| Proctitis | 7 (11.5) | |
| CAI (Rachmilewitz index), median [IQR] | 0 [0–0] | |
| Alb (g/dL), median [IQR] | 4.6 [4.4–4.9] | |
| CRP (mg/dL), median [IQR] | 0.04 [0.02–0.07] | |
| Hb (g/dL), median [IQR] | 14.5 [13.8–15.4] | |
| FC (mg/kg), median [IQR] | 71 [36–235] | |
| FIT (ng/mL), median [IQR] | 30 [30–30] | |
| Medication at study, n (%) | Oral 5-ASA | 42 (68.9) |
| Suppository Steroids | 2 (3.3) | |
| Systemic steroids | 7 (11.5) | |
| Immunomodulators | 16 (26.2) | |
| Biologics | 28 (45.9) | |
IQR interquartile range, CAI clinical activity index, Alb albumin, CRP C-reactive protein, Hb hemoglobin, FC fecal calprotectin, FIT fecal immunochemical occult blood test, 5-ASA 5-aminosalicylic acid
Comparison of the non-PEU and PEU groups
During this study, 34 and 27 patients were included in the non-PEU and PEU groups, respectively (Table 2). Among the baseline patient characteristics, only disease extent was significantly different. A particularly large proportion of patients in the PEU group had extensive colitis. A comparison of the test data and biomarkers showed no significant differences in albumin, hemoglobin, and FIT values between the non-PEU and PEU groups (Fig. 3a, b, d). Conversely, CRP and FC values were significantly different between the PEU and non-PEU groups (P = 0.004 and P < 0.001, respectively) (Fig. 3c, e). We performed significance tests for each disease type to evaluate the effect of the disease extent on each numerical value; however, no significant differences were found for each disease type (Table 3).
Table 2.
Comparison of characteristics between the non-PEU and PEU groups
| Characteristics | Non-PEU | PEU | P-value | |
|---|---|---|---|---|
| (n = 34) | (n = 27) | |||
| Age (year), median [IQR] | 47 [36–59] | 58 [41.50–67.50] | 0.155 | |
| Male / Female, n (%) | 20 (58.8) / 14 (41.2) | 20 (74.1) / 7 (25.9) | 0.281 | |
| Disease duration (year), median [IQR] | 9 [5–13] | 8 [5–15] | 0.925 | |
| Disease extent, n (%) | Extensive colitis | 17 (50.0) | 25 (92.6) | 0.001 |
| Left-sided colitis | 10 (29.4) | 2 (7.4) | ||
| Proctitis | 7 (20.6) | 0 (0.0) | ||
| CAI (Rachmilewitz index), median [IQR] | 0 [0–0] | 0 [0–0] | 0.660 | |
| Medication at study, n (%) | Oral 5-ASA | 23 (67.6) | 19 (70.4) | 1 |
| Suppository Steroids | 0 (0.0) | 2 (7.4) | 0.192 | |
| Systemic steroids | 3 (8.8) | 4 (14.8) | 0.689 | |
| Immunomodulators | 8 (23.5) | 8 (29.6) | 0.770 | |
| Biologics | 13 (38.2) | 15 (55.6) | 0.205 | |
PEU Past extensive ulcer, IQR interquartile range, CAI clinical activity index, 5-ASA 5-aminosalicylic acid
Fig. 3.

Differences in each marker of the non-past extensive ulcer (PEU) and PEU groups. Comparisons of albumin (Alb) (a), hemoglobin (Hb) (b), C-reactive protein (CRP) (c), fecal immunochemical test (FIT) (d), and fecal calprotectin (FC) (e) values
Table 3.
Comparison of each marker by disease extent
| Variables | Extensive colitis | Left-sided colitis | Proctitis | P-value |
|---|---|---|---|---|
| (n = 42) | (n = 12) | (n = 7) | ||
| Alb (g/dL), median [IQR] | 4.6 [4.4–4.9] | 4.7 [4.3–4.7] | 4.5 [4.3–4.7] | 0.619 |
| Hb (g/dL), median [IQR] | 14.6 [13.9–15.5] | 14.4 [12.8–15.0] | 14.2 [13.5–14.7] | 0.455 |
| CRP (mg/dL), median [IQR] | 0.04 [0.03–0.10] | 0.03 [0.02–0.06] | 0.02 [0.02–0.06] | 0.205 |
| FIT (ng/mL), median [IQR] | 30 [30–30] | 30 [30–30] | 30 [30–30] | 0.506 |
| FC (mg/kg), median [IQR] | 77 [37–240] | 105 [38–256] | 55 [29–60] | 0.464 |
Alb albumin, IQR interquartile range, CRP C-reactive protein, Hb hemoglobin, FIT fecal immunochemical occult blood test, FC fecal calprotectin
Relationship between FC, endoscopic score, and clinical relapse
The PEU group was further categorized based on the presence of pseudopolyposis (Table 4). Eleven patients had both scarring and pseudopolyposis, and 16 patients had scars without pseudopolyposis. No significant differences in albumin, hemoglobin, and FIT values were observed among the PEU with pseudopolyposis, PEU without pseudopolyposis, and non-PEU groups. However, CRP levels of the non-PEU group were significantly higher than those of the PEU without pseudopolyposis group (P = 0.017). The FC values of the PEU with pseudopolyposis group were significantly higher than those of the non-PEU group (P = 0.022).
Table 4.
Comparison of each marker between the groups of non-PEU, PEU without pseudopolyposis, and PEU with pseudopolyposis
| Variable | Non-PEU | PEU without pseudopolyposis | PEU with pseudopolyposis | Kruskal–Wallis test | Post-hoc test | ||
|---|---|---|---|---|---|---|---|
| (n = 34) | (n = 16) | (n = 11) | P-value | P1 | P2 | P3 | |
| Alb (g/dL), median [IQR] | 4.7 [4.1–5.2] | 4.6 [3.8–5.5] | 4.5 [3.8–4.9] | 0.624 | 0.998 | 0.638 | 0.660 |
| Hb (g/dL), median [IQR] | 14.4 [11.2–16.7] | 14.8 [12.4–17.9] | 14.0 [11.6–18.7] | 0.634 | 0.564 | 0.962 | 0.967 |
| CRP (mg/dL), median [IQR] | 0.03 [0.02–0.18] | 0.06 [0.02–1.46] | 0.06 [0.02–0.35] | 0.014 | 0.017 | 0.159 | 0.96 |
| FIT (ng/mL), median [IQR] | 30 [30–1670] | 30 [30–178] | 30 [30–1830] | 0.712 | 0.945 | 0.673 | 0.916 |
| FC (mg/kg), median [IQR] | 54.4 [3.8–721] | 122 [8.9–1780] | 316 [11.9–2499] | 0.014 | 0.232 | 0.022 | 0.255 |
PEU past extensive ulcer, P1 non-PEU vs. PEU without pseudopolyposis, P2 non-PEU vs. PEU with pseudopolyposis, P3 PEU without pseudopolyposis vs. PEU with pseudopolyposis, Alb albumin, IQR interquartile range, CRP C-reactive protein, Hb hemoglobin, FIT fecal immunochemical occult blood test, FC fecal calprotectin
Association between clinical relapse predictions using biomarkers and PEUs
Among the 60 patients, nine experienced relapse during the 12-month observation period (Table 5). Among all patients, only FC was significantly different between the relapse and remission groups (P = 0.047). Five of 33 patients in the non-PEU group experienced relapse. The relapse group exhibited significantly higher FC values than those of the remission group (P = 0.006). Among the 27 patients with PEUs, no significant differences in any of the biomarkers of the relapse and remission groups were observed. Furthermore, a ROC analysis was performed to predict recurrence using FC (Fig. 4). The cutoff value of FC for predicting relapse within 12 months for all cases was 118 mg/kg (area under the curve [AUC], 0.709; 95% confidence interval [CI], 0.512–0.907. During the ROC analysis performed to predict relapse in patients in the non-PEU group, the cutoff value was 118 mg/kg (AUC, 0.893; 95% CI, 0.724–1.000). The Kaplan–Meier analysis divided patients into one group with an FC value ≥ 118 mg/kg and another group with an FC value < 118 mg/kg, and the log-rank test indicated that the relapse-free rates of all cases and non-PEU cases were significantly different. Although a direct comparison of the ROC analysis results of all cases and non-PEU cases was difficult, the accuracy of the values of the non-PEU cases was higher.
Table 5.
Comparison of biomarkers between relapse and remission groups
| All | Non-PEU | PEU | |||||||
|---|---|---|---|---|---|---|---|---|---|
| Relapse | Remission | P-value | Relapse | Remission | P-value | Relapse | Remission | P-value | |
| (n = 9) | (n = 51) | (n = 5) | (n = 28) | (n = 4) | (n = 23) | ||||
| CRP (mg/dL), median [IQR] | 0.06 [0.03–0.08] | 0.04 [0.02–0.07] | 0.291 | 0.05 [0.02–0.07] | 0.03 [0.02–0.04] | 0.412 | 0.10 [0.05–0.18] | 0.05 [0.03–0.18] | 0.514 |
| FIT (ng/mL), median [IQR] | 30 [30–30] | 30 [30–30] | 0.926 | 30 [30–30] | 30 [30–30] | 0.421 | 30 [30–30] | 30 [30–30] | 0.377 |
| FC (mg/kg), median [IQR] | 167 [118–525] | 65.4 [30–172] | 0.047 | 167 [118–525] | 50.6 [23–78.6] | 0.006 | 231 [107–867] | 178 [43–379] | 0.785 |
CRP C-reactive protein, IQR interquartile range, FIT fecal immunochemical occult blood test, FC fecal calprotectin
Fig. 4.

Receiver-operating characteristic (ROC) curve analysis of fecal calprotectin (FC) for predicting relapse within 12 months and Kaplan–Meier analysis of the relapse-free rate. ROC analysis of all enrolled patients (a). Kaplan–Meier analysis of the relapse-free rates of all enrolled patients separated into one group with FC < 118 mg/kg and another group with FC ≥ 118 mg/kg (b). ROC analysis of the non-PEU group (c). Kaplan–Meier analysis of the relapse-free rates of patients in the non-PEU group with FC < 118 mg/kg and those in the non-PEU group with FC ≥ 118 mg/kg (d)
Discussion
During this study, we evaluated the effects of PEUs on FC. Our initial evaluation showed that FC and CRP values of patients in the UC with PEU group were significantly higher than those of patients in the UC without PEU group. We also evaluated relapse prediction using biomarkers. Numerous studies have reported the prediction of clinical relapse of UC based on MES of 0 and 1 [9, 11, 12]. However, this study only targeted cases with an MES of 0. Although the FIT values could not predict clinical relapse, the FC showed the potential to predict relapse. For registered UC cases without PEU, FC effectively predicted relapse. However, for UC cases with PEUs, no significant differences in FC values between the relapse and remission groups were observed. Therefore, the intestinal FC values observed with PEUs in UC may be high, thus decreasing its usefulness as a biomarker. For this reason, we believe that in clinical practice, when FC values are high in patients with PEU but no endoscopic activity, the values should be interpreted with caution. Conversely, FC may be a more useful biomarker of the absence of PEUs in the intestinal tract.
UC is a chronic inflammatory bowel disease with repeated remission and exacerbation; during its course, PEUs occur in the intestinal tract. Under microscopic observation, PEUs can be considered intestinal fibrosis, which is associated with a long-term intestinal healing process after increased and altered extracellular matrix deposition and decreased degradation of extracellular matrix components [16, 17]. Pathological fibrotic deposits and transmural collagen enhancement with UC have been reported [18]. A clinical symptom of UC is anorectal motor dysfunction, even in the absence of inflammation, that is possibly caused by intestinal fibrosis [19]. Furthermore, in cases of severe inflammation accompanied by deep ulcers, transmural inflammation may occur, resulting in intestinal tract narrowing caused by fibrosis that can lead to severe intestinal obstruction.
However, recently, with the advent of various UC treatments, cases of severe inflammation that have remitted have been reported. Some of these cases were in endoscopic remission, but intestinal PEUs, such as scarring and pseudopolyposis, were present. The effects of PEUs that appear to be in remission on test values, including biomarkers, have not been investigated.
During this study, we evaluated the relationship between PEUs and various other biomarkers. We evaluated only cases of endoscopic remission with an MES of 0 to exclude the influence of inflammation. FC values in the intestinal tract with PEUs were significantly increased. Although the mechanism by which PEUs increase FC values is not clear, we posited that the barrier function of the intestinal mucosa decreases as a result of fibrosis, thus making it more susceptible to exposure to pro-inflammatory substances. Matrix metalloproteinases, which are associated with the progression of inflammatory bowel disease symptoms, are also associated with intestinal fibrosis and the intestinal epithelial barrier function [20]. FC is a complex of two proteins, S100A8 and S100A9, released from neutrophils, monocytes, and macrophages. When PEUs are present, neutrophils are attracted by exposure to pro-inflammatory substances caused by the breakdown of the intestinal barrier function, which often results in increased FC levels [21].
Biomarkers reflect endoscopic scores and are also useful for predicting relapse [9, 11, 12]. Since histological evaluation was not performed in this study, assessing whether patients were in true remission based on tissue scoring was not possible. Therefore, the analysis focused on the predictive utility of biomarkers for relapse. During this study, only FC was useful for predicting relapse, whereas FIT values were not significantly different between the relapse and remission groups. This study targeted cases in remission with an MES of 0. Although FC had a certain range of values, the FIT value was 30 ng/mL in the first and third quantiles because the lowest detection limit was 30 ng/mL. During this study, the FIT targeted cases with an MES of 0 and did not contribute to relapse prediction. The subgroup analysis showed that FC was useful for predicting relapse in the non-PEU group, thus indicating that intestinal PEUs may affect the FC value and reduce its accuracy as a biomarker. Conversely, excluding PEU cases would improve the usefulness of FC as a biomarker. Factors that can affect FC include infectious enteritis, malignant tumors, colon polyps, colon diverticular disease, irritable bowel syndrome, radiation, and drugs such as non-steroidal anti-inflammatory drugs. The effects of PEUs, including pseudopolyposis, have not been previously investigated [22]. Given that pseudopolyposis and scarring in UC, which share similar underlying mechanisms, have rarely been studied, we separated these two conditions and conducted subgroup analyses on biomarker values in this study. As a result, the FC levels in the PEU group with pseudopolyposis were significantly higher than in the non-PEU group. Although the precise mechanism remains unclear due to the absence of histological evaluation, it is paradoxical that pseudopolyposis might contribute to intrinsic inflammation of the mucosa. Further research, including histological evaluations, is warranted to further explore these findings.
This study had some limitations. This was a single-center, retrospective study with a small sample size. A multicenter multifaceted evaluation was desirable for assessing the results fairly. Secondly, other biomarkers, such as leucine-rich alpha 2 glycoprotein and prostaglandin E-major urinary metabolite, were not evaluated. Fibrosis was not endoscopically defined. During this study, a PEU was defined as scarring and pseudopolyposis; however, a clear definition of an endoscopic PEU has not yet been established. Although intestinal fibrosis can be pathologically evaluated [23], PEUs were not pathologically evaluated during this study. However, a PEU is considered a clear endoscopic finding. Additionally, histological evaluation regarding mucosal healing was not performed. A more comprehensive evaluation of mucosal healing should include both endoscopic and histological scores.
Conclusion
UC patients with PEU show higher FC values compared to those without PEU, even when in remission. PEU may influence FC levels in UC, and given the potential for subtle inflammation in the intestinal mucosa, FC may not be a reliable biomarker for predicting relapse in UC patients with endoscopic PEUs. Incorporating histological evaluation to detect microscopic inflammation would further support this observation. Additionally, the potential bias related to the sample size and the extent of the disease may not have been fully addressed. A study design with a larger sample size and matched controls could help distinguish between the effects of disease extent and the impact of PEUs on FC levels, underscoring the need for further case accumulation.
Tables.
Acknowledgements
Not applicable.
Abbreviations
- UC
Ulcerative colitis
- PEU
Past extensive ulcer
- FC
Fecal calprotectin
- FIT
Fecal immunochemical occult’ blood test
- MES
Mayo endoscopic subscore
- ROC
Receiver-operating characteristic
- CRP
C-reactive protein
- AUC
Area under the curve
Authors’ contributions
NI contributed to this study. NI and KS designed the study. NT, TE, KT, YA, and ST collected the data. NI analyzed the data. NI and KS prepared the manuscript. TT, TM, MY, MI, YH, TY, and SO provided critical insights into paper preparation.
Funding
Not applicable.
Data availability
All data required to evaluate the conclusions of this study are presented herein. Additional data related to this study can be requested from the authors. The datasets used and/or analyzed during the current study are available from the corresponding author on reasonable request.
Declarations
Ethics approval and consent to participate
The study protocol was reviewed and approved by the Ethics Committee of Hamamatsu University School of Medicine (number 23–327). This study was conducted in accordance with the principles of Good Clinical Practice outlined in the Declaration of Helsinki. Informed consent was obtained in the form of an opt-out on the hospital website.
Consent for publication
Not applicable.
Competing interests
The authors declare no competing interests.
Footnotes
Publisher’s Note
Springer Nature remains neutral with regard to jurisdictional claims in published maps and institutional affiliations.
References
- 1.Magro F, Gionchetti P, Eliakim R, Ardizzone S, Armuzzi A, Acosta MB, et al. Third European evidence-based consensus on diagnosis and management of ulcerative colitis. Part 1: definitions, diagnosis, extra-intestinal manifestations, pregnancy, cancer surveillance, surgery, and ileo-anal pouch disorders. J Crohns Colitis. 2017;11:649–70. 10.1093/ecco-jcc/jjx008. [DOI] [PubMed] [Google Scholar]
- 2.Kelly JK, Gabos S. The pathogenesis of inflammatory polyps. Dis Colon Rectum. 1987;30:251–4. 10.1007/BF02556166. [DOI] [PubMed] [Google Scholar]
- 3.Politis DS, Katsanos KH, Tsianos EV, Christodoulou DK. Pseudopolyps in inflammatory bowel diseases: have we learned enough? World J Gastroenterol. 2017;23:1541–51. 10.3748/wjg.v23.i9.1541. [DOI] [PMC free article] [PubMed] [Google Scholar]
- 4.Friedman SL, Sheppard D, Duffield JS, Violette S. Therapy for fibrotic diseases: nearing the starting line. Sci Transl Med. 2013;5:167sr1. 10.1126/scitranslmed.3004700. [DOI] [PubMed] [Google Scholar]
- 5.Rieder F, Fiocchi C. Intestinal fibrosis in IBD—a dynamic, multifactorial process. Nat Rev Gastroenterol Hepatol. 2009;6:228–35. 10.1038/nrgastro.2009.31. [DOI] [PubMed] [Google Scholar]
- 6.Turner D, Ricciuto A, Lewis A, D’Amico F, Kotze PG, Yoshida EM, et al. STRIDE-II: an update on the selecting therapeutic targets in inflammatory bowel disease (STRIDE) initiative of the International Organization for the study of IBD (IOIBD): determining therapeutic goals for treat-to-target strategies in IBD. Gastroenterology. 2021;160:1570–83. 10.1053/j.gastro.2020.12.031. [DOI] [PubMed] [Google Scholar]
- 7.Schoepfer AM, Beglinger C, Straumann A, Safroneeva E, Romero Y, Armstrong D, et al. Ulcerative colitis: correlation of the Rachmilewitz endoscopic activity index with fecal calprotectin, clinical activity, C-reactive protein, and blood leukocytes. Inflamm Bowel Dis. 2009;15:1851–8. 10.1002/ibd.20986. [DOI] [PubMed] [Google Scholar]
- 8.Nakarai A, Kato J, Hiraoka S, Kuriyama M, Akita M, Hirakawa T, et al. Evaluation of mucosal healing of ulcerative colitis by a quantitative fecal immunochemical test. Am J Gastroenterol. 2013;108:83–9. 10.1038/ajg.2012.315. [DOI] [PubMed] [Google Scholar]
- 9.Nakarai A, Kato J, Hiraoka S, Kuriyama M, Akita M, Hirakawa T, et al. Ulcerative colitis patients in clinical remission demonstrate correlations between fecal immunochemical test results, mucosal healing, and risk of relapse. World J Gastroenterol. 2016;22:5079–87. 10.3748/wjg.v22.i21.5079. [DOI] [PMC free article] [PubMed] [Google Scholar]
- 10.Takashima S, Kato J, Hiraoka S, Nakarai A, Takei D, Inokuchi T, et al. Evaluation of mucosal healing in ulcerative colitis by fecal calprotectin vs. fecal immunochemical test. Am J Gastroenterol. 2015;110:873–80. 10.1038/ajg.2015.66. [DOI] [PubMed] [Google Scholar]
- 11.Theede K, Holck S, Ibsen P, Kallemose T, Nordgaard-Lassen I, Nielsen AM. Fecal calprotectin predicts relapse and histological mucosal healing in ulcerative colitis. Inflamm Bowel Dis. 2016;22:1042–8. 10.1097/MIB.0000000000000736. [DOI] [PubMed] [Google Scholar]
- 12.Hiraoka S, Kato J, Nakarai A, Kuriyama M, Akita M, Hirakawa T, et al. Consecutive measurements by faecal immunochemical test in quiescent ulcerative colitis patients can detect clinical relapse. J Crohns Colitis. 2016;10:687–94. 10.1093/ecco-jcc/jjw025. [DOI] [PubMed] [Google Scholar]
- 13.Rachmilewitz D. Coated mesalazine (5-aminosalicylic acid) versus sulphasalazine in the treatment of active ulcerative colitis: a randomised trial. Br Med J. 1989;298:82–6. 10.1136/bmj.298.6666.82. [DOI] [PMC free article] [PubMed] [Google Scholar]
- 14.Schroeder KW, Tremaine WJ, Ilstrup DM. Coated oral 5-aminosalicylic acid therapy for mildly to moderately active ulcerative colitis. A randomized study. N Engl J Med. 1987;317:1625–9. 10.1056/NEJM198712243172603. [DOI] [PubMed] [Google Scholar]
- 15.Kanda Y. Investigation of the freely available easy-to-use software ‘EZR’ for medical statistics. Bone Marrow Transpl. 2013;48:452–8. 10.1038/bmt.2012.244. [DOI] [PMC free article] [PubMed] [Google Scholar]
- 16.Rieder F, de Bruyn JR, Pham BT, Remzi FH, Ferrante M, Oresland T, et al. Results of the 4th scientific workshop of the ECCO (Group II): markers of intestinal fibrosis in inflammatory bowel disease. J Crohns Colitis. 2014;8:1166–78. 10.1016/j.crohns.2014.03.009. [DOI] [PubMed] [Google Scholar]
- 17.Gordon IO, Agrawal N, Goldblum JR, Rieder F, Fiocchi C. Fibrosis in ulcerative colitis: mechanisms, features, and consequences of a neglected problem. Inflamm Bowel Dis. 2014;20:2198–206. 10.1097/MIB.0000000000000080. [DOI] [PubMed] [Google Scholar]
- 18.de Bruyn JR, Meijer SL, Wildenberg ME, Peppelenbosch MP, van den Brink GR, D’Haens GR, et al. Development of fibrosis in acute and longstanding ulcerative colitis. J Crohns Colitis. 2015;9:966–72. 10.1093/ecco-jcc/jjv133. [DOI] [PubMed] [Google Scholar]
- 19.Loening-Baucke V, Metcalf AM, Shirazi S. Anorectal manometry in active and quiescent ulcerative colitis. Am J Gastroenterol. 1989;84:892–7. [PubMed] [Google Scholar]
- 20.Derkacz A, Olczyk P, Olczyk K, Komosinska-Vassev K. The role of extracellular matrix components in inflammatory bowel diseases. J Clin Med. 2021;10: 1122. 10.3390/jcm10051122. [DOI] [PMC free article] [PubMed] [Google Scholar]
- 21.Nakashige TG, Zhang B, Krebs C, Nolan EM. Human calprotectin is an iron-sequestering host-defense protein. Nat Chem Biol. 2015;11:765–71. 10.1038/nchembio.1891. [DOI] [PMC free article] [PubMed] [Google Scholar]
- 22.D’Amico F, Nancey S, Danese S, Peyrin-Biroulet L. A practical guide for faecal calprotectin measurement: myths and realities. J Crohns Colitis. 2021;15:152–61. 10.1093/ecco-jcc/jjaa093. [DOI] [PubMed] [Google Scholar]
- 23.Geboes KP, Cabooter L, Geboes K. Contribution of morphology for the comprehension of mechanisms of fibrosis in inflammatory enterocolitis. Acta Gastroenterol Belg. 2000;63:371–6. [PubMed] [Google Scholar]
Associated Data
This section collects any data citations, data availability statements, or supplementary materials included in this article.
Data Availability Statement
All data required to evaluate the conclusions of this study are presented herein. Additional data related to this study can be requested from the authors. The datasets used and/or analyzed during the current study are available from the corresponding author on reasonable request.