Abstract
MIDAW (microarray data analysis web tool) is a web interface integrating a series of statistical algorithms that can be used for processing and interpretation of microarray data. MIDAW consists of two main sections: data normalization and data analysis. In the normalization phase the simultaneous processing of several experiments with background correction, global and local mean and variance normalization are carried out. The data analysis section allows graphical display of expression data for descriptive purposes, estimation of missing values, reduction of data dimension, discriminant analysis and identification of marker genes. The statistical results are organized in dynamic web pages and tables, where the transcript/gene probes contained in a specific microarray platform can be linked (according to user choice) to external databases (GenBank, Entrez Gene, UniGene). Tutorial files help the user throughout the statistical analysis to ensure that the forms are filled out correctly. MIDAW has been developed using Perl and PHP and it uses R/Bioconductor languages and routines. MIDAW is GPL licensed and freely accessible at http://muscle.cribi.unipd.it/midaw/. Perl and PHP source codes are available from the authors upon request.
INTRODUCTION
Microarray technology allows the monitoring of the expression levels of large numbers of genes simultaneously, with a relatively low experimental effort. The exponential increase of data on gene expression and the application of expression profiling to sensitive fields (such as classification and prognosis of human pathologies) require very advanced and integrated statistical tools for the analysis and mining of data. Several tools have already been developed for normalization (1,2) and analysis (3–5) of microarray data. Most of these [apart from GEPAS (4)], however, (i) deal with just one specific aspect of data analysis (either cluster analysis, or discriminant analysis, gene scoring, normalization); (ii) require software download and employ different file formats; (iii) use complicated statistical packages that are not easy to use by individuals not familiar with multivariate statistics (e.g. R/Bioconductor). Here we present a web-based tool for the analysis of gene expression data, called MIDAW. This tool can be used for the analysis of microarray platforms developed with the two fluorescence colours approach. With the uploading of one single file, MIDAW can immediately process expression data from normalization to discriminant analysis. Our aim was the implementation of a web interface for some R/Bioconductor packages [http://www.r-project.org and http://www.bioconductor.org/ (5)]. The structure of this interface is flexible in the selection of algorithms and effortless in the construction of the input data file.
RESULTS AND DISCUSSION
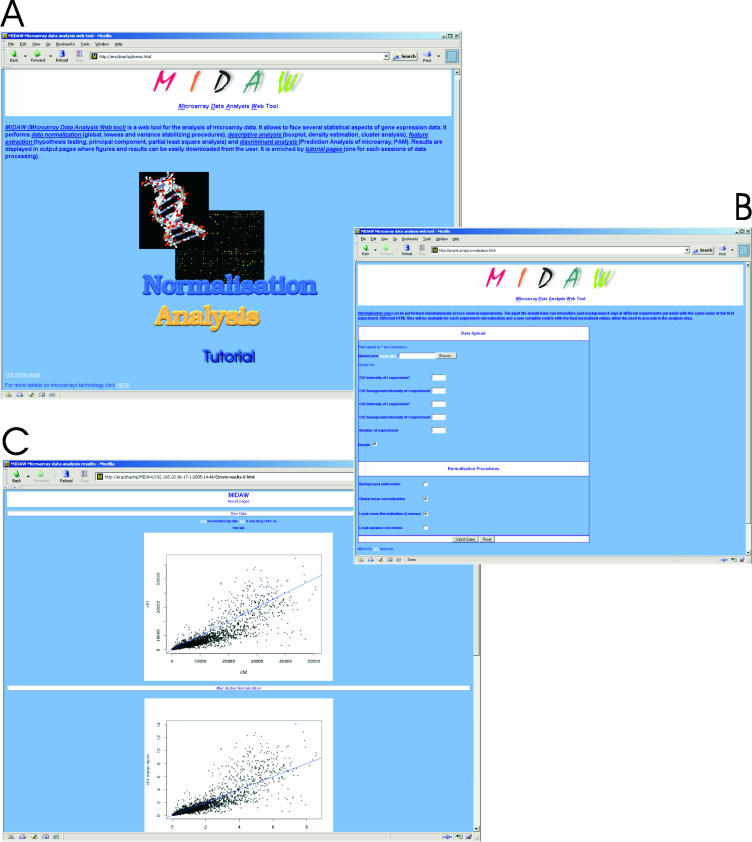
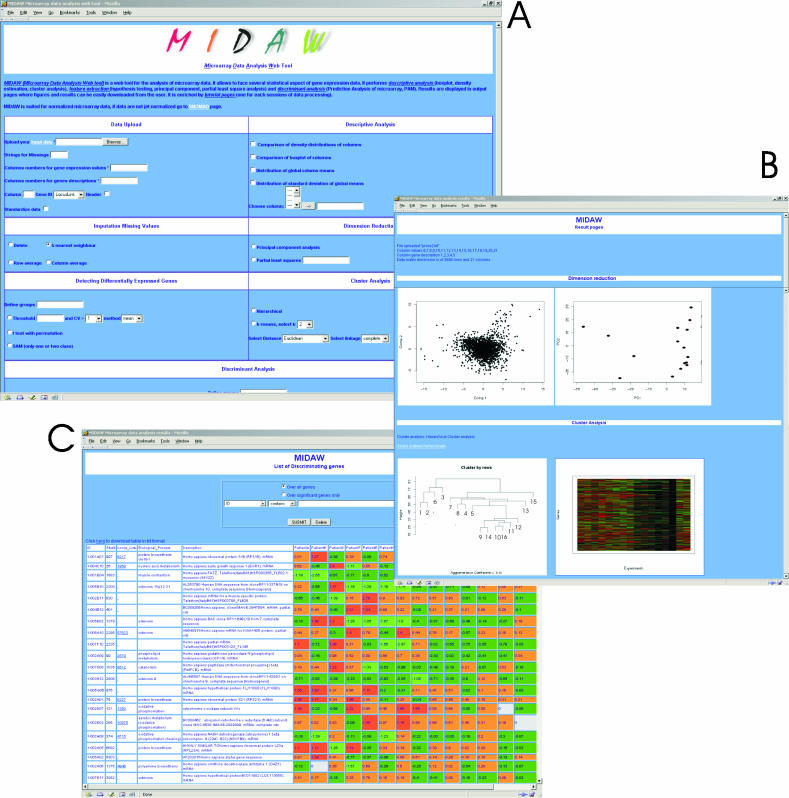
Figure 1A shows the main page of MIDAW. Here the user can start with data normalization (Figure 1B) or skip directly to data analysis (Figure 2A). Once the data have been normalized, the user can decide to download the results or to continue with the data analysis. Input files should always be tab-delimited. Tutorial pages are provided for each section to help the user through the diverse web forms.
Figure 1.
(A) MIDAW main web page. Two sections are available: normalization and data analysis. A tutorial is available for filling the MIDAW input forms. (B) The MIDAW normalization form needs channel 1 and channel 2 column numbers, background columns if applicable and the number of experiments to be normalized. This section allows the simultaneously normalization of several microarray experiments (included in one single file), provided that the order of the columns (ch1/ch2 intensity and ch1/ch2 background levels) is the same for all experiments. Finally, global normalization, local mean and variance normalization are provided. (C) An example of the output web page for the normalized data.
Figure 2.
(A) MIDAW form for data analysis. The form is divided into seven sections: data upload and input file description, descriptive analysis, imputation of missing values, data reduction, detection of differentially expressed genes and discriminant analysis. (B) An example of a dynamic HTML page generated by MIDAW with the results of microarray data analysis. Results are referred to each of the sections listed above and specific links allow the user to download the results as text files. (C) Lists of selected genes are shown in HTML tables linked to external databases, and search tools allow the browsing of the tables using keywords.
Normalization
In this section MIDAW allows the normalization of several two-channel (ch) microarray experiments simultaneously. The data should be organized in one single file, and the order of columns should be the same for all experiments. For example, if columns 2, 3, 4 and 5 contain, respectively, ch1, ch2, ch1 background and ch2 background fluorescence values of the first experiment, then columns 6, 7, 8 and 9 (of the same file) will contain the fluorescence values of ch1, ch2, ch1 background and ch2 background of the second experiment and the number of experiments should be set as 2. Table 1 shows the required structure of a MIDAW input file. The normalization form is divided into the following parts: (i) data upload and input file description, (ii) normalization procedures. Normalization techniques (6) that have been implemented in MIDAW include (i) global mean normalization: the mean intensities of ch1 and ch2 are calculated on the whole set of microarray probes, then the final intensity of each spot is divided by the global mean; (ii) local mean normalization (LOWESS): systematic mean biases of the ch1/ch2 intensity are corrected according to the local mean, calculated across the range of gene expression levels; (iii) local variance normalization: systematic variance biases (heteroscedastic data) of the ch1/ch2 intensity (corrected in the previous steps) are normalized according to the local variance calculated across the range of gene expression levels. As a result, different HTML pages are provided for each normalized experiment, with diagnostic plots and normalized text files (Figure 1C). The user can then choose to proceed with the analysis or download the data and terminate the MIDAW session. The data analysis section does not require any further uploads, since the normalized dataset is automatically uploaded and processed through the next steps of analysis.
Table 1.
Structure and syntax to be used for the MIDAW microarray data input file
| ID | cy1 | cy1-back | cy2 | cy2-back | cy1 | cy1-back | cy2 | cy2-back |
|---|---|---|---|---|---|---|---|---|
| 1 | 607 | 206 | 488 | 80 | 1469 | 225 | 2707 | 871 |
| 2 | 561 | 171 | 540 | 50 | 696 | 112 | 1025 | 217 |
| 3 | 33303 | 399 | 16378 | 290 | 9819 | 570 | 13823 | 557 |
| 4 | 29990 | 466 | 14206 | 275 | 9341 | 675 | 13178 | 566 |
| … | … | … | … | … | … | … | … | … |
Multivariate analysis
The form (Figure 1A) is divided into the following parts: (i) data upload and input file description, (ii) descriptive analysis, (iii) assignment of missing values, (iv) dimension reduction, (v) identification of differentially expressed genes, (vi) cluster analysis and (vii) discriminant analysis. Results are issued as dynamic HTML pages divided into sections (Figure 2B), and selected genes are listed on web tables with hyperlinks to external databases (Figure 2C). A search tool is provided to browse gene lists by keywords.
Data upload
Here the user should define (i) the number of columns containing gene descriptions and gene expression values; (ii) the string used to identify missing values; (iii) the presence of the header in the file (only one); (iv) the number of columns containing gene accession numbers that have to be linked to external databases; (v) possible log transformation (base 2); (vi) the presence of a unique gene identification. Furthermore, it is possible to standardize the data before statistical analysis. With this option the mean and the variance for each experiment will be rescaled to zero and one, respectively. Table 2 shows an example of an input file with the following settings: columns 1–3 contain gene description data; columns 4–7 gene expression values; the header is present and column 2 could be linked to the Entrez Gene database; each gene is uniquely identified and expression values are log transformed.
Table 2.
Structure and syntax used in the MIDAW input file for the multivariate analysis step
| ID | Entrez Gene | Description | A | B | D | F |
|---|---|---|---|---|---|---|
| 1 | 6217 | Hs ribosomal protein S16 | 0.012 | 1.273 | −0.364 | 0.335 |
| 2 | 1158 | Hs creatine kinase, muscle | −0.749 | −2.419 | −1.293 | −2.966 |
| 3 | 2597 | Hs glyceraldehyde-3-phosphate dehydrogenase | −1.295 | −4.303 | −0.880 | −2.557 |
| 4 | 4633 | Hs myosin, light polypeptide 2, regulatory, cardiac, slow | 0.970 | 0.003 | 2.270 | −1.959 |
Descriptive analysis
With MIDAW it is possible to compare density distributions of selected gene expression experiments using different graphical tools. For each selected microarray experiment the following plots are provided: (i) a kernel density estimation (‘density’ function in R), (ii) box plot (‘boxplot’ function in R), (iii) an estimation of the mean kernel density of the selected column (the average of each gene through the selected experiments is calculated and then the density of this mean is estimated), (iv) a kernel density estimation of the standard deviation of the selected column (the standard deviation of each gene through the selected experiments is calculated and then the density of this standard deviation is estimated).
Estimation of missing values
Four different types of missing value imputation (7) are allowed. The first is the ‘deletion’ option: genes with at least one missing expression value are removed from the analysis. Alternatively, each single missing value is replaced with the average of the corresponding column or row. The last option is the k-nearest neighbour technique, which replaces missing values with a weighted average of values in the genes k-nearest to the missing one. A distribution plot of the missing values on the data matrix is also shown and a text file with all the new imputed expression values is provided. The R libraries used are ‘impute’ and ‘e1071’.
Cluster analysis
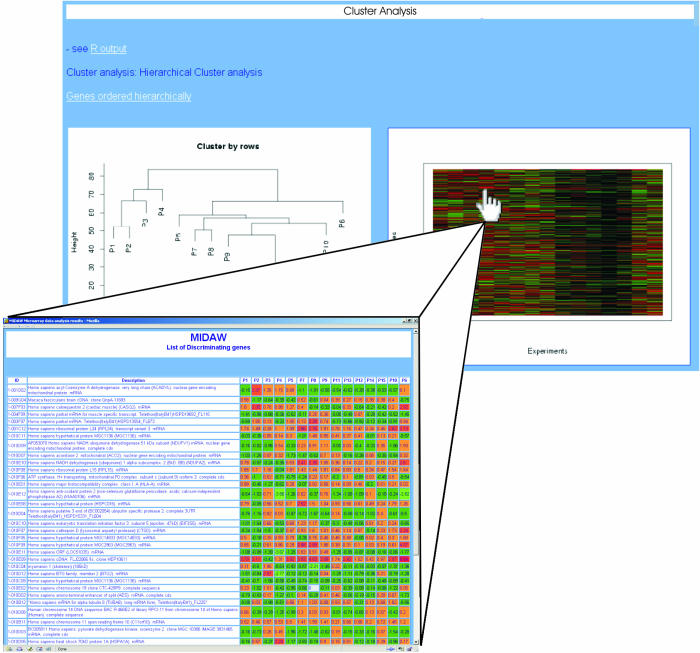
The user can choose between hierarchical and non-hierarchical (k-means) cluster analysis. Further options are available in the selection of distance measures (Euclidean distance or Pearson correlation coefficient) and link functions (complete, single and average link) and also for the number of clusters. MIDAW creates a graphical display of similarity structure that is coherent in terms of the user settings of the different options (dendrogram or profile similarity plot). Each resulting plot is actually an HTML map, and the user can click on different map positions to obtain an HTML table with the description and expression values of the genes lying in a selected area (see Figure 3). Text files of the experiments and genes are also provided, ordered according to the selected cluster analysis. The R libraries used are ‘sma’ and ‘cluster’ with functions ‘agnes’ and ‘pam’.
Figure 3.
Zoom section of the cluster analysis step. The image of expression profiles is an HTML map that shows a table with descriptions and expression values of the genes that lie in a specific area selected by the user.
Dimension reduction
MIDAW can apply principal component analysis (PCA) or partial least square (PLS) analysis to genes (rows) and to experiments (columns). These are two different techniques that can be applied for the simplification of dataset structure without losing the characteristics that contribute most to data variance/covariance. For the PLS technique, the user should provide a class identification for each experiment (column of the expression matrix) and then enter in the dedicated field a string with as many integers (separated by commas) as the expression experiments. Experiments with the same integer belong to the same class. Plots of genes/experiments in the new two-dimensional space are provided (the first principal component versus the second component or the first PLS factor versus the second one). Scores and loadings of the entire set of components of both analyses can be downloaded as text files. The R libraries used are ‘mva’ and ‘pls.pcr’.
Identification of differentially expressed genes
The user can choose among three alternative statistical tests for the identification of differentially expressed genes: t-test with false discovery rate (FDR) control (8), the Significance Analysis of Microarray [SAM (9)] test and the threshold method with standard deviation control. The threshold method selects all genes whose expression values within the same class are higher or lower than a defined cut-off value, and whose standard deviation within the class is less than a selected value. For each of the above technique the user should provide a class identification for the experiment (column of the expression matrix). MIDAW creates lists of differentially expressed genes as HTML tables where cells appear with different intensities of red and green colours according to the level of expression of the corresponding genes. The R libraries used are ‘multtest’ (for t-test calculation) and ‘siggenes’ (for SAM).
Discriminant analysis
Tibshirani and colleagues proposed the Prediction Analysis of Microarray [PAM (10)] algorithm for the identification of the set of the best marker genes. The selection of genes is determined by a procedure of error rate minimization obtained by cross-validation. Differently from other discriminant algorithms, PAM can provide not only a measure of the algorithm performance (misclassification rate through cross-validation), but also a list of the best discriminating genes. PAM analysis has been integrated into MIDAW. As for the identification of differentially expressed genes and for PLS procedures, PAM needs the class identification for each experiment. The R library used is ‘pamr’.
CONCLUSION
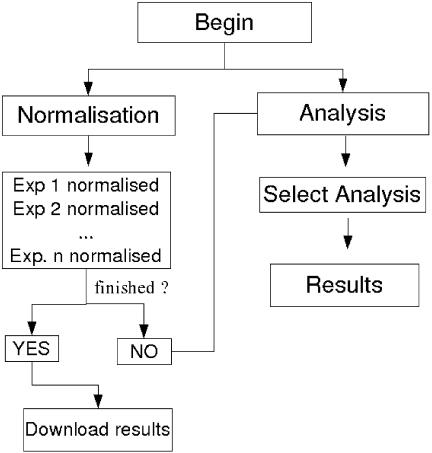
MIDAW is a system-independent, freely accessible and easy-to-use web tool for complete analysis of microarray data. It is divided into two main sections: data normalization and data analysis. The workflow started by the interface is illustrated in Figure 4. The tool requires the initial input of a single text file with expression data. The construction of the input file is relatively simple and user-friendly. MIDAW then processes data, under user control, through different steps of analysis up to the discovery of differentially expressed genes. Results are organized in dynamic HTML pages that make data interpretation more comprehensive.
Figure 4.
Flow chart of the workflow behind the web interface. Initially, the user can choose to begin either with normalization or with analysis steps. After the normalization step, the user can choose to download results and finish the MIDAW session or to proceed with the analysis. In this second case, the novel input file is automatically prepared by MIDAW.
MIDAW runs on a server equipped with a Dual-Opteron (64 bit CPU) processor with 8 GB RAM. It performs all the statistical analysis in <2 min. To avoid web server timeout, result pages are generated dynamically, one section at a time, following the user choice defined in the main web page. MIDAW will be regularly updated and improved to follow the constant development of R/Bioconductor routines for microarray data analysis.
Acknowledgments
This work was supported by the Fondazione Telethon ONLUS Italy, by the Ministero dell'Università e della Ricerca Scientifica, Italy (grants FIRB and COFIN) and by the Fondazione della Cassa di Risparmio di Verona–Vicenza–Belluno–Ancona, Italy. Funding to pay the Open Access publication charges for this article was provided by Telethon, Italy.
Conflict of interest statement. None declared.
REFERENCES
- 1.Colantuoni C., Henry G., Zeger S., Pevsner J. SNOMAD (Standardization and Normalization of MicroArray Data): web-accessible gene expression data analysis. Bioinformatics. 2002;18:1540–1541. doi: 10.1093/bioinformatics/18.11.1540. [DOI] [PubMed] [Google Scholar]
- 2.Vaquerizas J.M., Dopazo J., Díaz-Uriarte R. DNMAD: a web-based diagnosis and normalization for microarray data. Bioinformatics. 2004;20:3656–3658. doi: 10.1093/bioinformatics/bth401. [DOI] [PubMed] [Google Scholar]
- 3.Dudoit S., Gentleman R.C., Quackenbush J. Open source software for the analysis of microarray data. Biotechniques. 2003;(Suppl.):45–51. [PubMed] [Google Scholar]
- 4.Herrero J., Al-Shahrour F., Díaz-Uriarte R., Mateos A., Vaquerizas J.M., Santoyo J., Dopazo J. GEPAS: a web-based resource for microarray gene expression data analysis. Nucleic Acids Res. 2003;31:3461–3467. doi: 10.1093/nar/gkg591. [DOI] [PMC free article] [PubMed] [Google Scholar]
- 5.Gentleman R.C., Carey V.J., Bates D.M., Bolstad B., Dettling M., Dudoit S., Ellis B., Gautier L., Ge Y., Gentry J., et al. Bioconductor: a software development project. Genome Biol. 2004;5:R80. doi: 10.1186/gb-2004-5-10-r80. [DOI] [PMC free article] [PubMed] [Google Scholar]
- 6.Yang Y.H., Dudoit S., Luu P., Lin D.M., Peng V., Ngai J., Speed T.P. Normalization for cDNA microarray data: a robust composite method addressing single and multiple slide systematic variation. Nucleic Acids Res. 2002;30:e15. doi: 10.1093/nar/30.4.e15. [DOI] [PMC free article] [PubMed] [Google Scholar]
- 7.Troyanskaya O., Cantor M., Sherlock G., Brown P., Hastie T., Tibshirani R., Botstein D., Altman R.B. Missing value estimation methods for DNA microarrays. Bioinformatics. 2001;17:520–525. doi: 10.1093/bioinformatics/17.6.520. [DOI] [PubMed] [Google Scholar]
- 8.Reiner A., Yekutieli D., Benjamini Y. Identifying differentially expressed genes using false discovery rate controlling procedures. Bioinformatics. 2003;19:368–375. doi: 10.1093/bioinformatics/btf877. [DOI] [PubMed] [Google Scholar]
- 9.Tusher V.G., Tibshirani R., Chu G. Significance analysis of microarrays applied to the ionizing radiation response. Proc. Natl Acad. Sci. USA. 2001;98:5116–5121. doi: 10.1073/pnas.091062498. [DOI] [PMC free article] [PubMed] [Google Scholar]
- 10.Tibshirani R., Hastie T., Narasimhan B., Chu G. Diagnosis of multiple cancer types by shrunken centroids of gene expression. Proc. Natl Acad. Sci. USA. 2002;99:6567–6572. doi: 10.1073/pnas.082099299. [DOI] [PMC free article] [PubMed] [Google Scholar]


