Abstract
Background
Clinical trial success hinges on efficient participant recruitment and retention. However, slow accrual and attrition frequently hinder progress. To address these challenges, a novel dashboard tool with control charts has been developed to provide investigators on the multi-site study of Delirium and Neuropsychological Recovery among Emergency General Surgery Survivors (DANE study) with timely information to improve trial recruitment.
Methods
A quality monitoring Excel dashboard with control chart functionality developed by the principal investigator’s (PI) group and implemented in a department of a large hospital was re-engineered for research study recruitment purposes. The dashboard provides the PIs and other stakeholders with timely, actionable, and unbiased information on the count of participants who have completed each stage or action within the process, the rates of completion and trends, both for the current week and cumulatively.
Results
The DANE dashboard was prototyped using Microsoft Excel for accessibility and rapid development. The tool integrates with a REDCap database, simplifying data import and analysis. By facilitating informed decision-making throughout the recruitment process, the DANE dashboard has significantly enhanced clinical trial efficiency and led to changes in the eligibility criteria and improvements in the approach and consent processes.
Conclusions
The DANE dashboard for monitoring participant recruitment and attrition in research studies represents a significant step towards enhancing study management and decision-making processes. It can be adapted to other clinical studies and other staged processes with attrition. The generic version, currently under development, holds promise for evolving into a valuable simulator by incorporating a spreadsheet for generating random data and accounting for resource constraints. This enhancement could further be augmented by integrating forecasting capabilities into the control charts.
Trial registration
The Delirium and Neuropsychological Recovery among Emergency General Surgery Survivors (DANE) study (NCT05373017, 1R01AG076489-01) is a multi-site, two-arm, single-blinded randomized controlled clinical trial to evaluate the efficacy of the Emergency General Surgery (EGS) Delirium Recovery Model to improve the cognitive, physical, and psychological recovery of EGS delirium survivors over 65. The DANE study received approval from the University of Wisconsin-Madison/University of Wisconsin Hospitals and Clinics Institutional Review Board (IRB, no. 2022–0545, approval date September 14, 2022), and Indiana University agreed to cede IRB review to University of Wisconsin-Madison/University of Wisconsin Hospital and Clinics (September 29, 2022).
Supplementary Information
The online version contains supplementary material available at 10.1186/s13063-024-08646-0.
Keywords: Clinical trial recruitment, Accrual, Dashboard, Control chart
Background
Monitoring participant enrollment and progress is vital for clinical research study validity [1]. Most trials are delayed by startup problems and slow recruitment which can result in failing to meet recruitment goals [2]. The failure rate is estimated at 80% of trials and holds for both in-person and online recruitment modalities, according to a 2020 systematic review and meta-analysis [3]. A review of 388 publicly funded RCTs, published in 2021, showed that over 1 in 3 (37%) did not achieve target sample size goals and 1 in 5 reduced its recruitment target during the trial [4]. Studies of trials that were terminated early identify slow accrual as the top reason. Insufficient enrollment can introduce bias, reduce statistical power, jeopardize validity, and diminish the reliability of findings, potentially leading to trial failure or delay in new treatment development [5–8].
Evaluations of studies that met their recruitment and retention goals demonstrate that goal achievement is supported by strong project management practices, adaptive problem solving as recruitment challenges develop, and attention to participant needs [4]. An agile mindset, characterized by rapid problem comprehension, comprehensive assessment of outcomes, collaboration, continual learning, and flexibility, alongside nonjudgmental attitudes, is instrumental in fostering agile decision-making process and yielding high-performance outcomes [9]. Agile decision-making is critical for managing clinical research studies, where rapid access to actionable information and quick implementation of solutions is the key to successful recruitment [10]. This underscores the need for agile decision support tools created to monitor participant encounters and enrollment rates across multiple study sites.
The Rockefeller University Center for Clinical Translation Research (CCTS) supports an electronic platform in which participant screening and enrollment outcomes for multiple clinical research studies are tracked in real time [11]. They use an accrual index to evaluate whether a recruitment is likely to reach the goal. The accrual index is incorporated into a dashboard that enables researchers and administrators to monitor studies for the expected progress toward completion. When studies deviate from the expected timeline, the investigators and recruiting staff analyze the reasons and make appropriate modifications in the protocol or recruitment strategy, including, where appropriate, identifying additional academic and community partners [12].
Toddenroth, Sivagnanasundaram, Prokosch, and Ganslandt [6] document a proposed study dashboard with electronic data capture for monitoring multiple clinical trials and estimate its utility based on interviews of study coordinators rather than implementation in actual clinical trials.
The Biostatistics & Data Science Department at the University of Kansas Medical Center developed a clinical trial management system to increase procedural uniformity across multiple stages of participant engagement in a multi-site clinical trial. It generated automated reports for trial accrual, study protocol adherence, and data validation which improved accrual equality and reduced protocol deviation and loss to follow-up [13].
Dashboards are in wide use in hospitals and clinical settings with most dashboards focused on quality and safety [14]. Dashboards have been used during the COVID-19 pandemic to monitor missed visits in clinical trials and manage risk to patients [15].
Commercially available software systems with dashboards to support large scale clinical trials include Medidata Rave [16], Veeva Vault CDMS [17], Ennov Clinical [18], Viedoc [19], RealTime eClinical [20], and Clinevo [21]. These systems have a variety of features including Electronic Data Capture (EDC) allowing trial oversight from patient recruitment to data monitoring, including patient portals communication to streamline patient interaction, consent capture, financial tracking, regulatory compliance, adverse event tracking, and study closeout. Castor EDC [22] and Ripple Science [23] offer affordable packages for academic institutions and smaller companies. These packages have dashboards that help researchers track study progress, tasks, and participant data across different trials and help automate email or in-app notifications and reminders to both staff and participants.
OpenClinica [24] and REDCap (Research Electronic Data Capture) [25] are examples of open-source platforms for managing clinical trial data. OpenClinica Insight is an add-on module for OpenClinica 3 Enterprise and OpenClinica 4 that allows the user to create reports and dashboards. REDCap has limited dashboarding capabilities and requires the user to export data to a spreadsheet, such as Excel, or statistical package, such as R and R Shiny, for detailed analysis and dashboard development.
Timely decision-making is crucial in the management of clinical trials, yet equally vital is the evaluation of decision outcomes. Examining time-series data is imperative in assessing the efficacy of an intervention. McDonald et al. [26] utilize time series analysis to evaluate the effects of relocating to a new hospital on healthcare-associated infections. Control charts, widely used in manufacturing to ensure quality in processes and products, provide a time series analysis framework that is increasingly being applied in healthcare contexts [27, 28].
We describe prototype development and proof-of-concept testing of an open-source dashboard with integrated control charts and seamless updates of data from the REDCap database. The dashboard enables PIs and the study management team to monitor both counts and rates of recruitment in a multi-site clinical study in near real time and make prompt adjustments if necessary. It differs from other dashboards because the linked control charts empower researchers to delve into time-series data to evaluate changes to the screening and recruitment strategies. The Delirium and Neuropsychological Recovery among Emergency General Surgery Survivors (DANE) study was chosen for proof-of-concept testing. The DANE study received approval from the University of Wisconsin-Madison/University of Wisconsin Hospitals and Clinics Institutional Review Board (IRB, no. 2022–0545, approval date September 14, 2022), and Indiana University agreed to cede IRB review to University of Wisconsin-Madison/University of Wisconsin Hospital and Clinics (September 29, 2022).
Methods
Concept
The concept of using an open-source dashboard integrated with control charts for managing recruitment and interventions originated from a PI with extensive experience in clinical research studies. The earlier recruitment challenges are identified, the more likely they can be addressed without falling too far behind to recover. This requires monitoring counts, rates, and trends. Counts must be monitored to ensure accrual is meeting targets. Rates can indicate that an assumption is wrong and that action must be taken. For example, a design of a study may assume that the eligibility rate in a population of patients is higher than it is. In this case, it may be necessary to compensate by adding more sites to increase the size of the population or changing the eligibility criteria to increase the rate. Trends can warn a research team if they are likely to fall behind or catch up on goals.
The primary purpose of the dashboard with control charts is to provide the PIs and other stakeholders with weekly updates on the count of participants who have completed each stage or action within the process, the rates of completion, and trends, both for the current week and cumulatively. This enables immediate action if the counts, rates, or trends indicate that accrual goals may not be reached. Finding for clinical trials may be terminated for failure to reach accrual targets [3].
Design
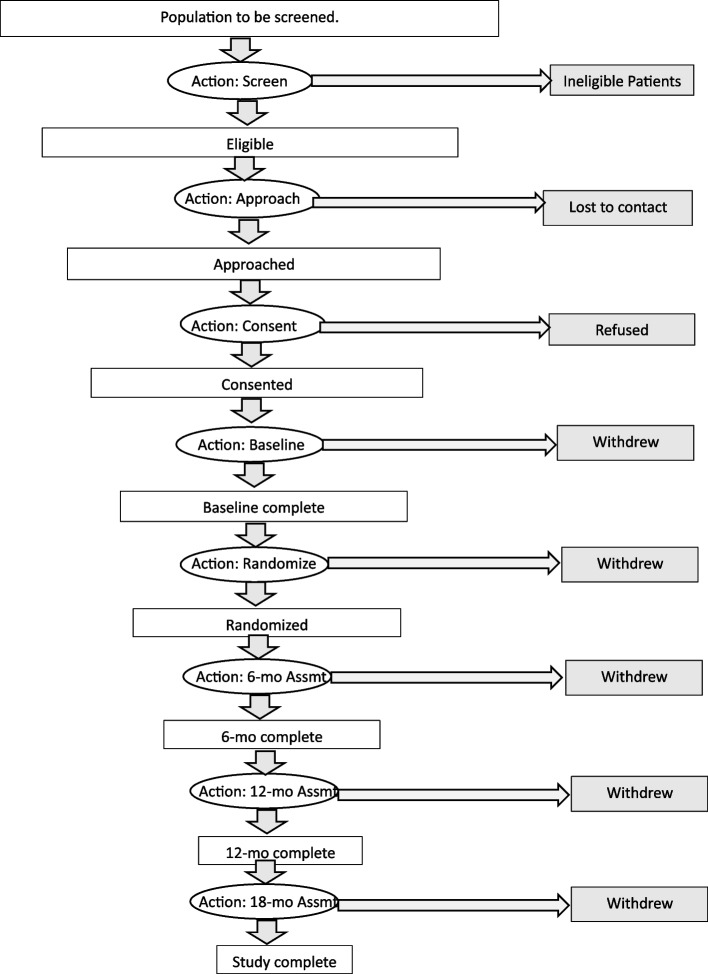
The PI chose the multi-site study of Delirium and Neuropsychological Recovery among Emergency General Surgery Survivors (DANE study) for prototype development and proof-of-concept testing. In the DANE study, participants progress through stages delineated by various actions, as illustrated in Fig. 1. These actions may be initiated by study staff, such as screening or approaching participants, or by the participants themselves, such as consenting or refusing participation. Attrition may occur in relation to an action, for instance, when it is determined that a participant is ineligible. Attrition may also be discovered during an action, such as when a participant withdraws or cannot be contacted when attempting to schedule an assessment. Additionally, attrition may occur between actions, such as when a participant decides to withdraw from the study.
Fig. 1.
Stages and actions of the DANE study
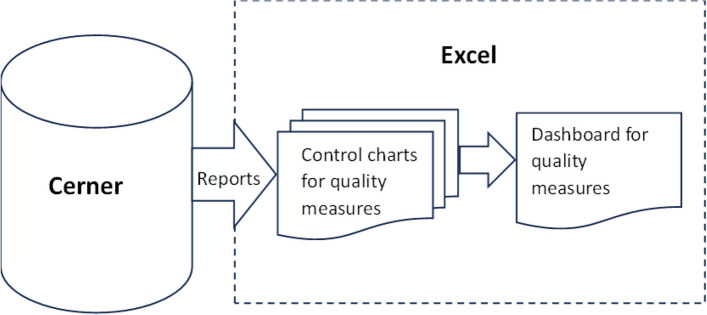
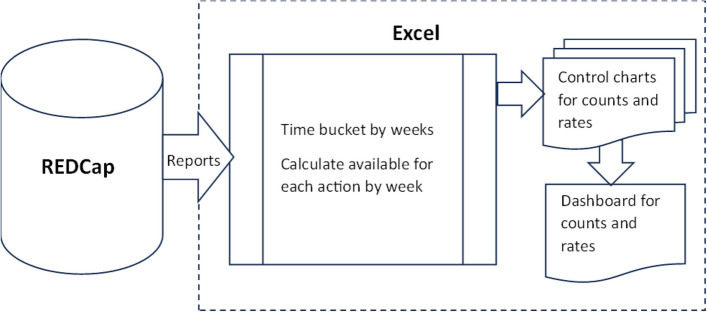
The development of DANE dashboard involved re-engineering a successful quality monitoring Excel dashboard with control chart functionality originally created by the PI team for a department within a large hospital, as illustrated in Fig. 2. Dashboard data for the hospital system was segmented by time in the Cerner medical records system and then extracted and imported into Excel for use in the control charts and dashboard. The format of the dashboard and control charts from the quality monitoring software required minimal modification for reuse in DANE dashboard. However, the DANE data came from a REDCap database rather than the Cerner medical records system. The REDCap data required segmentation by time and other processing external to REDCap for use in DANE dashboard. Most of the design and development efforts focused on creating specialized REDCap reports necessary for extracting the required data from REDCap, putting it into a format usable by the control charts and dashboard, and adding logic for time segmentation and calculating the number available for an action by week from the start of recruitment, as depicted in Fig. 3. An update macro was designed and developed to empower the research coordinator to export data from REDCap, import it into Excel, and update the dashboard and control charts with a single click, without requiring assistance from an analyst.
Fig. 2.
Data flow for large hospital quality monitoring Excel dashboard
Fig. 3.
Data flow DANE dashboard Excel dashboard
This re-engineering process was facilitated through collaborative development, where minimally viable prototypes of the dashboard user interface were evaluated by stakeholders of the DANE study and other clinical investigators. The DANE study involved a diverse team including the two PIs, project coordinators stationed at each site along with their investigative teams, research coordinators, a data team, nurse care coordinators, surgical faculty serving as site investigators, and graduate student assistants assigned to support the DANE study. Prototypes were refined and modified based on this feedback and re-evaluated.
Development
The software underwent a development phase spanning approximately 4 months, followed by an additional 1-month alpha testing period and 3-month beta testing period. Throughout the development phase, the in-house developer held weekly one-on-one meetings with the PI, whose concept inspired the software. Moreover, the developer actively participated in weekly project team meetings to understand the team’s information requirements and challenges. Occasional meetings were also conducted with the research coordinator and the analyst, who generated reports, to clarify data definitions and with the data team regarding database structure for sourcing the software’s data.
The first month of the project was spent clarifying data definitions, evaluating various software platforms, and dealing with access restrictions. Excel was chosen because of its advantages in development speed, and accessibility. The actual software development began in the second month. At that time, REDCap reports were developed and formatted to load into the dashboard software. In the third month of development, the developer, research coordinator, and PI presented the software’s user interfaces to a group of seasoned researchers, including two PIs on other studies, on a weekly basis to gather formative feedback. Additionally, the PI solicited feedback on the user interfaces from colleagues within the medical school and hospital system where they practiced. As the project progressed into its third month, the PI and developer presented the software’s user interfaces to the entire DANE study group at their weekly meetings. Subsequently, they collaborated on implementing the feedback received, ensuring the software’s refinement in response to user input. During the third and fourth months, the developer focused on writing and testing a Visual Basic macro to seamlessly update the dashboard and control charts from the REDCap database.
The developer conducted alpha testing to assess accuracy in the fifth month of the project. This involved comparing the dashboard and control charts against existing weekly reports extracted from the database using the REDCap API by the data management team. During this phase, the developer identified and rectified several update issues as well as detected various data entry errors and inconsistencies within the database.
Beta testing began at the start of the sixth month when the developer trained the research coordinator on using update macro to update the software for weekly reports. Subsequently, the research coordinator assumed responsibility for generating the weekly reports using the dashboard, comparing them to the report generated by the data management team, and using the dashboard in the weekly report to the research team. The research team, consisting of the two PIs, a third investigator who had been the PI on other studies, the research coordinator, site coordinators, and other experienced staff, evaluated the dashboard and control charts on a weekly basis for 3 months. Only the research coordinator had access to the complete DANE REDCap database and Dashboard package to preserve blinding of the study because the DANE dashboard package contains participant data including how the participants are randomized into groups. The development process is summarized in Fig. 4.
Fig. 4.
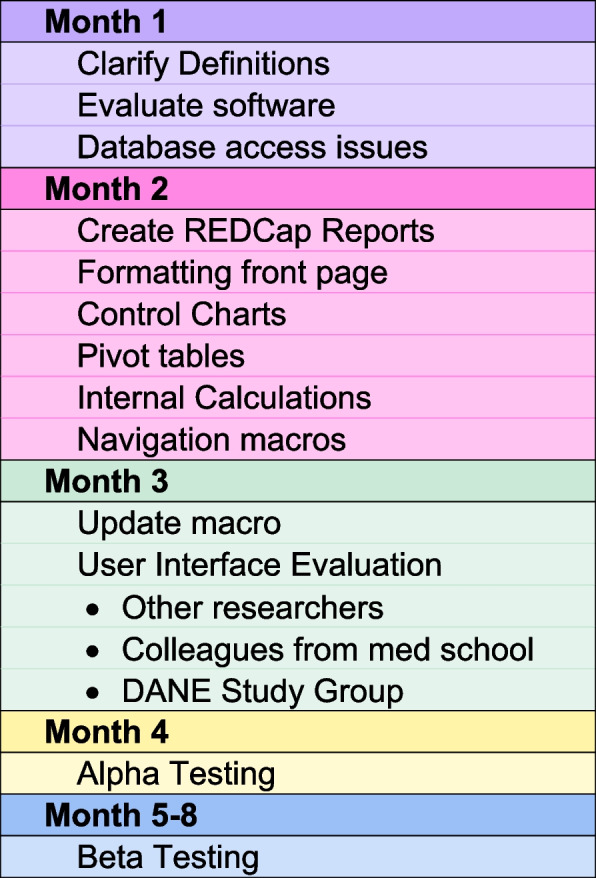
The development process
The DANE study
The Delirium and Neuropsychological Recovery among Emergency General Surgery Survivors (DANE) study (NCT05373017, 1R01AG076489-01) is a multi-site, two-arm, single-blinded randomized controlled clinical trial to evaluate the efficacy of the Emergency General Surgery (EGS) Delirium Recovery Model to improve the cognitive, physical, and psychological recovery of EGS delirium survivors over 65. At or near the time of discharge, enrolled patients are be randomized to receive the EGS Delirium Recovery Model or usual care. The hypothesis is that, over 18 months, EGS delirium survivors over 65 who are randomized to the EGS Delirium Recovery Model experience more favorable cognitive, physical, and psychological recovery in comparison to those randomized to usual care.
The EGS Delirium Recovery Model involves development of a recovery care plan and a 12-month interaction period with a care coordinator. The recovery care plan is based on a physical, cognitive, and psychological assessment, a social and community needs assessment for the patient and the informal caregiver if they have one, and a reconciliation of all prescribed and over the counter medications. During the 12-month interaction period, the patients and/or their informal caregivers have a 20-min virtual visit, phone contact, email, fax, or mail with the care coordinator at a minimum of every 2 weeks. During these interactions, the care coordinator will answer any questions generated from previous visits, collect patient and informal caregiver’s feedback, review and reconcile medications and discuss adherence, review specialist and therapist appointment and adherence to recovery care plans, monitor sleep by asking questions about the length and nature of sleep to trigger sleep associated interventions, and facilitate the informal caregiver’s access to appropriate community resources.
The DANE study requires 185 study completers per group to yield a power of 80.6% to detect differences in the Repeatable Battery for the Assessment of Neuropsychological Status (RBANS) between the intervention and usual care groups with type I error rate at α = 0.05. Assuming a 30% attrition rate, 264 patients per group must be enrolled into the study with the total randomization target size of 528. The DANE study was about halfway through recruitment at the time of submission of this article.
Data management
Data collection for the DANE study is the responsibility of the clinical trial staff at the site under the supervision of the site investigator. The investigator is responsible for ensuring the accuracy, completeness, legibility, and timeliness of the data reported. Clinical data is entered into the University of Wisconsin School of Medicine and Public Health (SMPH) Research Electronic Data Capture (REDCap). SMPH REDCap data are backed up nightly to a secure environment maintained by the SMPH Research Informatics team. The data system includes password protection and internal quality checks to identify data that appear inconsistent, incomplete, or inaccurate.
The DANE dashboard improves security by limiting access to the full REDCap database. Now, only the research coordinator has access to the entire database, reducing the number of people involved. The research coordinator can update the DANE dashboard to generate weekly reports for the team. Previously, a programmer or analyst was required to access the database for these weekly updates.
Results
Implementation
Excel was chosen as the platform for DANE dashboard due to its advantages in development speed, and accessibility. Commercial clinical trial management software was not considered because REDCap is the only database supported for clinical trial data by Indiana University and the University of Wisconsin. Although alternative options such as leveraging REDCap’s API and existing dashboarding tools were initially explored, their limitations—such as REDCap’s inability to generate the necessary x, y scatterplots for control charts and its API’s access restrictions—made them unsuitable for our project requirements. Additionally, developing the software in languages like R, Python, or C + + would have exceeded the available 4-month development timeframe and required access to the restricted API. Microsoft Power BI and Power Query were also considered but could not automate the required data manipulation. Excel emerged as the optimal choice due to its widespread accessibility, transparency, data manipulation capabilities, and charting functionalities, making it easier for both users and developers to adapt the prototype for various applications.
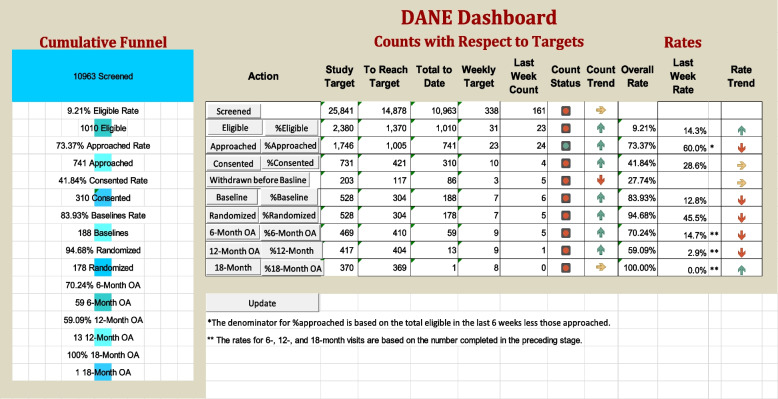
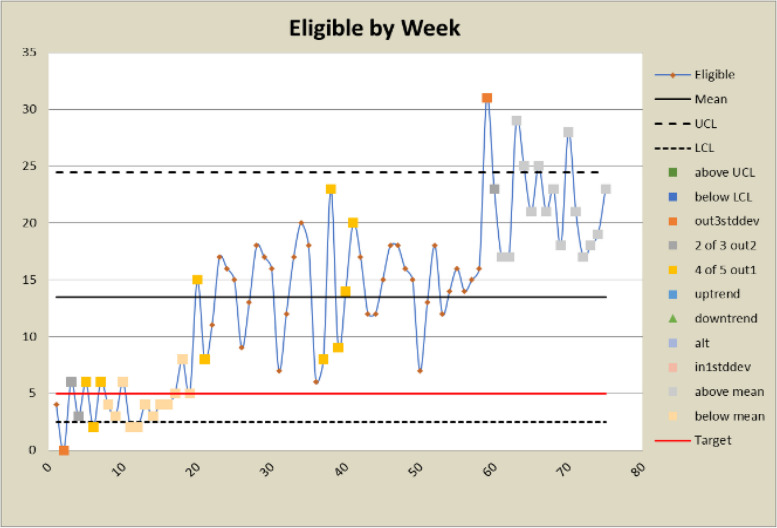
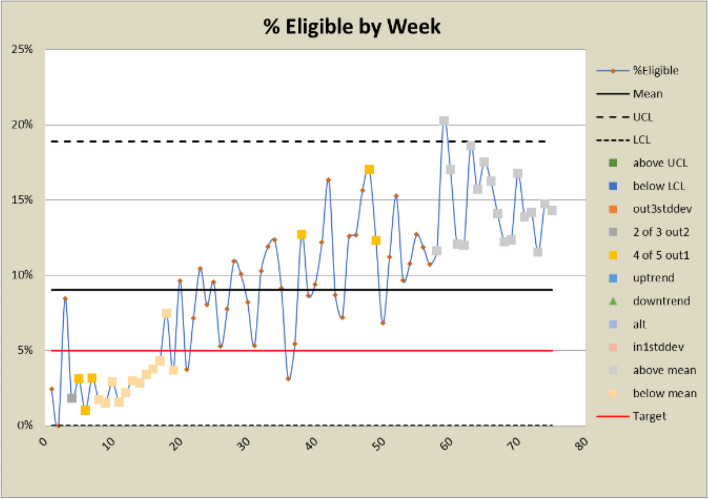
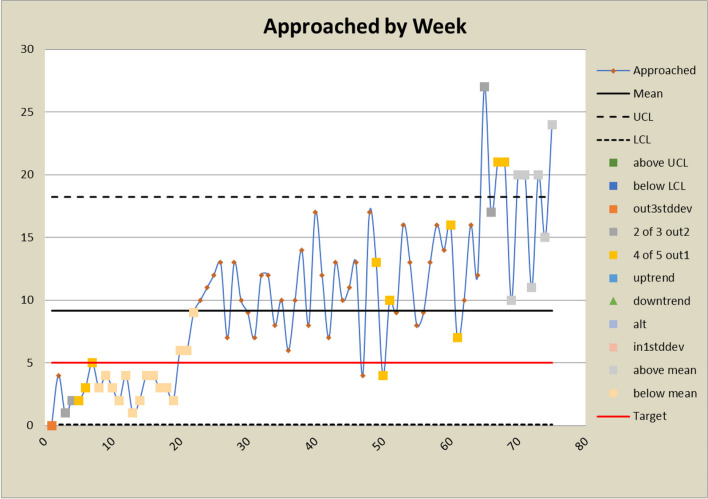
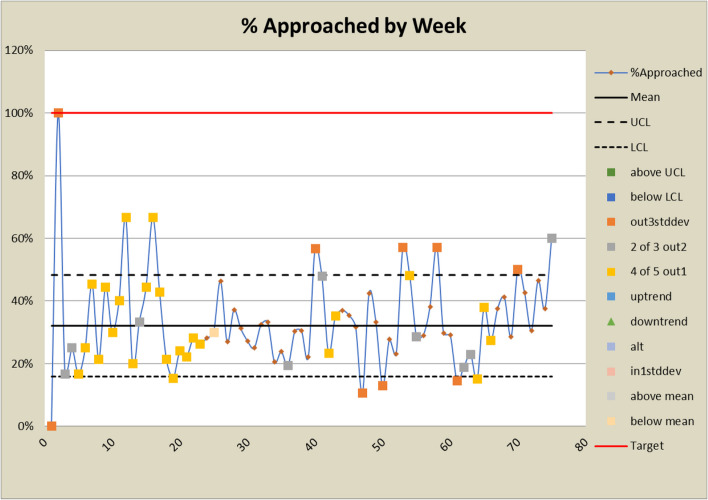
The DANE dashboard is housed within an Excel workbook. As input, it takes REDCap reports that it filters to extract the dates of each action shown in Fig. 1, including withdrawals and refusals, for each participant up to the current date. Once the data are loaded into Excel input worksheets, the data are time bucketed into weeks for each action using pivot tables, and the number of participants available for each action by week are calculated on worksheets containing matrices with embedded logic to count the number of participants available for that action on a weekly basis. Results for the entire multi-site study are summarized on a main dashboard (Fig. 5) and worksheets containing control charts for counts and rates (Figs. 6, 7, 8, 9, 10, and 11).
Fig. 5.
The main dashboard showing targets, counts, and rates
Fig. 6.
Control charts for eligibility counts
Fig. 7.
Control charts for eligibility rates
Fig. 8.
Control charts for approached counts
Fig. 9.
Control charts for approached rates
Fig. 10.
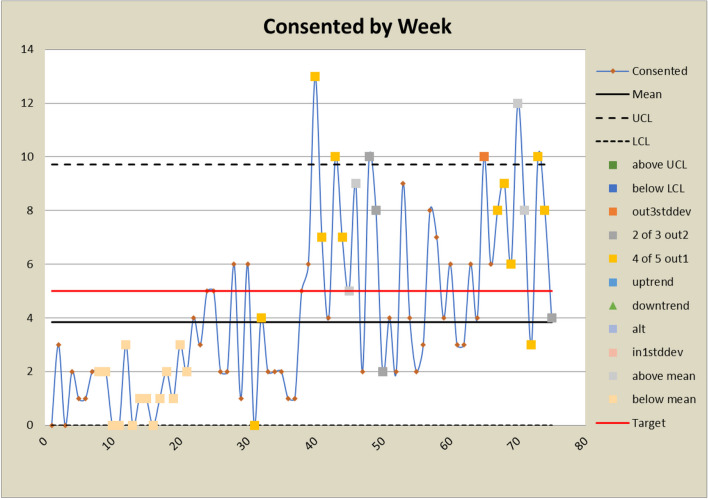
Control charts for consented counts
Fig. 11.
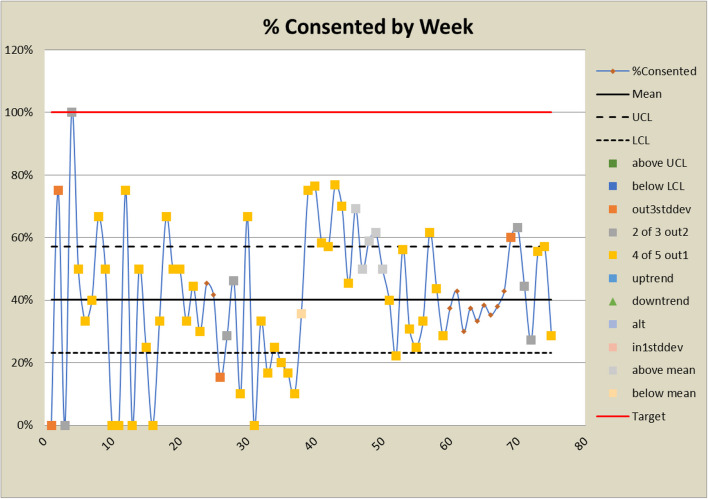
Control charts for consented rates
The dashboard (Fig. 5) displays targets, current counts, and rates, along with cumulative counts and rates. It includes graphical representations of stoplights that alert study stakeholders to deviations from target participant numbers at distinct stages of the study, signaling a need for intervention. It has arrows with the color scheme as the stoplights indicating trends with their direction. A green arrow pointing up indicates that the average of the last 4 weeks has been two standard deviations or more above the overall average. A red arrow pointing down indicates that the average of the last 4 weeks has been two standard deviations or more below the overall average. A yellow arrow pointing to the right indicates that the average of the last 4 weeks is within two standard deviations of the mean. Two standard deviation limits were selected by the PIs based on their experience with other studies to exclude random effects. Additionally, the dashboard incorporates a cumulative funnel graphic to visually depict attrition levels across different stages.
Buttons within the dashboard (see Fig. 5) serve as links connecting the dashboard to control charts for both counts and rates, as illustrated in Figs. 6 and 7. This functionality enables users to observe trends and assess the effects of interventions over time. The control charts are equipped with color coding based on the Nelson rules for detecting non-randomness [29], enhancing the user’s ability to identify patterns and anomalies in the data.
A Visual Basic macro has been implemented to facilitate effortless updates to the system, which are triggered by pasting new data from REDCap into the designated input worksheets and clicking a button on the main dashboard. This integrated approach not only streamlines data management processes but also enhances the study’s monitoring capabilities by providing timely and reliable insights.
Reporting
An image of the current main dashboard is included in the weekly power point report to the research staff and presented for discussion at the weekly zoom staff meeting. The workbook itself is not included because it contains data not available to some of the staff because of study blinding requirements. The research coordinator can show control charts on request from the PIs and research staff if they need to delve deeper into the data as part of the weekly discussion.
Benefits
The DANE dashboard offers researchers timely, actionable, and unbiased information to enhance recruitment and retention performance. The dashboard’s front page (Fig. 5) gives a high-level overview on one page. The research staff liked the visual cues provided by the trend arrows and stoplights which enabled them to focus on issues quickly. Staff are able to objectively distinguish meaningful trends from random fluctuations. The dashboard allows researchers to analyze data from three distinct perspectives simultaneously:
Overall counts and rates (over the entire study to the current date)
Recent week counts and rates
Trends comparing the most recent 4 weeks to overall performance
Arrivals to emergency departments and subsequent hospital admissions for surgical interventions are largely random [30]. Given that study participants are emergency surgery survivors, the number of patients available to be screened is highly variable. This variability persists through subsequent stages, compounded by additional random variability. Consequently, researchers often struggle to discern whether weekly changes represent meaningful signals or mere noise. By leveraging the three perspectives of the dashboard, researchers can enhance their understanding of the data, thereby mitigating confirmation bias in interpreting results [31].
The implementation of the DANE dashboard has empowered the study staff to identify and address bottlenecks in the recruitment process effectively. Humans typically find it challenging to estimate cumulative rates and proportions [32], a task automated by the dashboard. By automating calculations of cumulative rates and forecasting participant needs at each stage, the dashboard enables research staff to readily recognize benchmarks and take timely corrective actions based on real rates instead of estimates.
The DANE dashboard has prompted several changes to the study. In response to a low eligibility rate displayed on the dashboard, staff expanded eligibility criteria and added new sites to bolster recruitment efforts. Figures 6 and 7 show a significant increase in both the number and percent eligible about week 20 when the eligibility criteria were expanded to include emergency orthopedic surgeries. At week 60, an additional site was added, which increased the number screened and subsequently increased the eligibility rate. The approach rate had been a cause for concern prior to expanding eligibility requirements, but it became worse after eligibility was expanded and more patients could be approached. In response, staff drilled down by site and discovered that at some sites, eligible patients were being discharged before a research assistant could approach them because scheduled surgery reports were not downloaded frequently enough. Increasing the frequency at which the scheduled surgery reports were downloaded improved the approach rate at those sites. This is reflected in the control charts shown in Figs. 8 and 9 at about week 65. In response to observed differences in consent rates among research assistants, specialization of staff was initiated. Tasks were assigned so that their skills and strengths were best utilized, thereby enhancing overall process efficiency. This change is displayed about week 40 in the control charts in Figs. 10 and 11. The proactive utilization of the DANE dashboard not only streamlined recruitment efforts but also empowered the staff to dynamically address evolving challenges, ultimately improving participant enrollment outcomes.
Discussion
The DANE dashboard has significantly enhanced recruitment in the DANE study by providing research staff with timely, actionable, and unbiased information. This format exposes system problems and enables staff to effectively prioritize issues. They can initiate problem-solving immediately and observe the impact of their changes on control charts within a few weeks, often as early as the next week. The dashboard enabled staff to recognize issues within processes, which resulted in problem solving that led to improvements in the eligibility rate, the approach rate, and consent rates.
The DANE dashboard prevents researchers from being distracted by confirmation bias and temporary fluctuations by presenting information from three perspectives: counts, rates, and trends. Control charts reinforce these perspectives, offering researchers deeper insights into the process.
The research staff participated in the collaborative design of the dashboard, ensuring their support throughout the process. The user interfaces were custom-tailored to meet the specifications of the PIs and the research coordinators. The research coordinators personally conducted the beta testing and continue to collaborate with the developer in an ongoing improvement process.
Limitations
The DANE dashboard is a custom software package developed specifically for the DANE study. To facilitate its adaptation for other projects, a generic version with a modular design is currently in development. This version will be accompanied by comprehensive documentation, an implementation guide, and training materials.
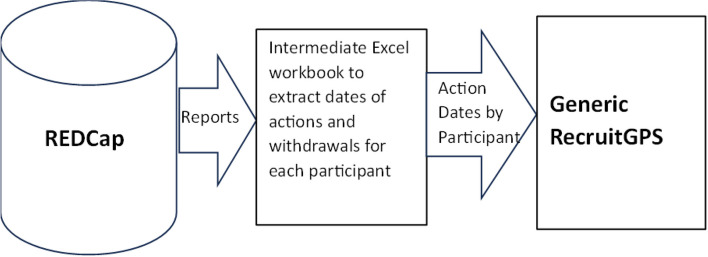
Adapting the generic DANE dashboard for a different project would require an analyst proficient in Excel, especially if the process involves a different number of steps than the DANE study. Additionally, it would be necessary to extract data from the new database in a format compatible with the generic version. For example, with the generic dashboard, reports are generated in REDCap to capture data might have to be transferred into an intermediate Excel workbook to manipulate the data into the required format for the generic dashboard (Fig. 12).
Fig. 12.
Data flow for other research studies using DANE dashboard
The process of adapting the generic version for another project would be significantly faster than the original development, taking much less time than the initial 4 months. The alpha and beta testing phases would also be considerably shorter.
Although the generic dashboard is scalable, the size of the excel file could become a problem for large clinical trials with low attrition rates. The DANE dashboard currently has a size of 3.6 MB for about 10,000 patients at the screening level because of the high attrition rate for screening that limits the amount of data it contains. Experiments with the generic version demonstrate that with 1000 patients at the first stage and low attrition rates at each stage, the size of the excel file grows to 9.1 MB, and the update macros slow considerably. Saving the generic dashboard as a binary file only reduces the size to 8.2 MB. This software may lose efficiency in studies with large numbers of patients at the screening stage if the attrition is low.
Conclusions
In conclusion, the development of the dashboard for monitoring participant recruitment and attrition in research studies represents a significant step towards enhancing study management and decision-making processes. The dashboard, built using Microsoft Excel with custom Visual Basic Macros, offers a practical solution for visualizing key metrics, identifying recruitment shortfalls, and predicting potential challenges in study participation. Linking the main dashboard to control charts gives researchers deeper insight into each stage of the process and enables visualization of the results of improvements to the recruitment process.
The generic version, currently under development, holds promise for evolving into a valuable simulator by incorporating a spreadsheet for generating random data according to trial designs and accounting for resource constraints. Rates and trends at any stage in the process can be adjusted in the data generator to allow the user to create a variety of “what-if” scenarios. This enhancement could further be augmented by integrating forecasting capabilities into the control charts. By doing so, the DANE dashboard would not only facilitate scenario planning but also provide insights into potential future trends and outcomes, thereby enhancing its utility and effectiveness in guiding decision-making processes within research projects.
The modular design of the generic dashboard, inspired by the DANE dashboard, provides flexibility to adapt to evolving research needs and changing requirements over time, ensuring sustained effectiveness across various research settings and operational environments. Its current components rely on widely adopted, stable, and well-supported free or inexpensive and open-source tools.
A comparative analysis of the similar commercially available tools referenced in the background section herein reveals three unique features in the generic version. First, it emphasizes software-agnostic compatibility, allowing the dashboard to be customized to accept data in Excel format and easily handle exports from any database. Second, it offers a user-friendly “cut and paste” functionality that requires no API calls or programming expertise. Finally, there is an intention to release the software as open-source with a no-cost licensing model.
Supplementary Information
Abbreviations
- PI
Principal investigator
- RCT
Randomized controlled trials
- DANE
Delirium and neuropsychological recovery among emergency general surgery survivors
Authors’ contributions
All authors contributed to the software design. LG developed the software and conducted alpha testing. PB and SR conducted beta testing. LG, PB, SR, EH, RH, and MB contributed to the writing of this manuscript. PB, SR, BZ, and MB used the dashboard to identify and implement the improvements to the recruitment processes. All authors contributed to the refinement of this manuscript and approved the final version.
Funding
The study, including dashboard development, was supported by the grants (R25AG078136, and R01AG076489) from the National Institute on Aging.
Data availability
Not applicable.
Declarations
Ethics approval and consent to participate
The DANE study (NCT05373017, R01AG076489) received approval from the University of Wisconsin-Madison/University of Wisconsin Hospitals and Clinics Institutional Review Board (IRB, no. 2022–0545, approval date September 14, 2022), and Indiana University agreed to cede IRB review to University of Wisconsin-Madison/University of Wisconsin Hospital and Clinics (September 29, 2022). The approval included generating reports to the research team and the funding agency of which this dashboard was part.
Consent for publication
Not applicable.
Competing interests
Dr. Boustani serves as a chief Scientific Officer and co-Founder of BlueAgilis; the Chief Health Officer of DigiCare Realized, Inc.; and the Chief Health Officer of Mozyne Health, Inc. He has equity interest in Blue Agilis, Inc; DigiCare Realized, Inc; and Mozyne Health Inc.; he sold his equity in Preferred Population Health Management LLC and MyShift, Inc. (previously known as RestUp, LLC). He serves as an advisory board member for Eli Lilly and Co, Eisai, Inc; Merck & Co Inc; Biogen Inc; and Genentech Inc. These conflicts have been reviewed by Indiana University and have been appropriately managed to maintain objectivity.
Footnotes
Publisher’s Note
Springer Nature remains neutral with regard to jurisdictional claims in published maps and institutional affiliations.
References
- 1.Campbell MK, Snowdon C, Francis D, Elbourne D, MacDonald AM, Knight R, Entwistle V, Garcia J, Roberts I, Grant A. Recruitment to randomised trials : Strategies for Trial Enrolment and Participation Study. The STEPS study. Health Technol Assess [Online]. 2007;11(48). Available from: http://www.ncchta.org/fullmono/mon1148.pdf. Accessed 27 Nov 2024. [DOI] [PubMed]
- 2.Fogel DB. Factors associated with clinical trials that fail and opportunities for improving the likelihood of success: a review. Contemporary clinical trials communications. 2018Sep;1(11):156–64. [DOI] [PMC free article] [PubMed] [Google Scholar]
- 3.Brøgger-Mikkelsen M, Ali Z, Zibert JR, Andersen AD, Thomsen SF. Online patient recruitment in clinical trials: systematic review and meta-analysis. J Med Internet Res. 2020Nov 4;22(11): e22179. [DOI] [PMC free article] [PubMed] [Google Scholar]
- 4.Jacques RM, Ahmed R, Harper J, Ranjan A, Saeed I, Simpson RM, Walters SJ. Recruitment, consent and retention of participants in randomized controlled trials: a review of trials published in the National Institute for Health Research (NIHR) Journals Library (1997–2020). BMJ Open. 2022Feb 1;12(2): e059230. [DOI] [PMC free article] [PubMed] [Google Scholar]
- 5.Lai YS, Afseth JD. A review of the impact of utilizing electronic medical records for clinical research recruitment. Clin Trials. 2019Apr;16(2):194–203. [DOI] [PubMed] [Google Scholar]
- 6.Toddenroth D, Sivagnanasundaram J, Prokosch HU, Ganslandt T. Concept and implementation of a study dashboard module for a continuous monitoring of trial recruitment and documentation. J Biomed Inform. 2016Dec;1(64):222–31. [DOI] [PubMed] [Google Scholar]
- 7.Vadeboncoeur C, Foster C, Townsend N. Challenges of research recruitment in a university setting in England. Health Promot Int. 2018Oct 1;33(5):878–86. [DOI] [PMC free article] [PubMed] [Google Scholar]
- 8.Visanji EC, Oldham JA. Patient recruitment in clinical trials: a review of literature. Physical therapy reviews. 2001Jun 1;6(2):141–50. [Google Scholar]
- 9.Holden RJ, Boustani M. The value of an ‘Agile’mindset in times of crisis. Modern Healthcare. 2020.
- 10.Holden RJ, Boustani MA, Azar J. Agile Innovation to transform healthcare: innovating in complex adaptive systems is an everyday process, not a light bulb event. BMJ Innovations. 2021;7(2):499–505. [Google Scholar]
- 11.Corregano L, Bastert K, Correa da Rosa J, Kost RG. Accrual Index: a real-time measure of the timeliness of clinical study enrollment. Clin Transl Sci. 2015;8(6):655–61. [DOI] [PMC free article] [PubMed] [Google Scholar]
- 12.Kost RG, Devine RK, Fernands M, Gottesman R, Kandpal M, MacArthur RB, O’Sullivan B, Romanick M, Ronning A, Schlesinger S, Tobin JN. Building an infrastructure to support the development, conduct, and reporting of informative clinical studies: The Rockefeller University experience. Journal of Clinical and Translational Science. 2023Jan;7(1): e104. [DOI] [PMC free article] [PubMed] [Google Scholar]
- 13.Mudaranthakam DP, Brown A, Kerling E, Carlson SE, Valentine CJ, Gajewski B. The successful synchronized orchestration of an investigator-initiated multicenter trial using a clinical trial management system and team approach: design and utility study. JMIR Formative Research. 2021Dec 22;5(12): e30368. [DOI] [PMC free article] [PubMed] [Google Scholar]
- 14.Rabiei R, Almasi S. Requirements and challenges of hospital dashboards: a systematic literature review. BMC Med Inform Decis Mak. 2022Nov 8;22(1):287. [DOI] [PMC free article] [PubMed] [Google Scholar]
- 15.Afroz MA, Schwarber G, Bhuiyan MA. Risk-based centralized data monitoring of clinical trials at the time of COVID-19 pandemic. Contemp Clin Trials. 2021May;1(104): 106368. [DOI] [PMC free article] [PubMed] [Google Scholar]
- 16.Dassault Systemes: Rave EDC. https://www.medidata.com/en/clinical-trial-products/clinical-data-management/edc-systems/ (2024). Accessed 25 Sept 2024.
- 17.Veeva: Clinical Data for Modern Trials. https://www.veeva.com/products/clinical-data-management/ (2024). Accessed 25 Sept 2024.
- 18.Ennov: Ennov Clinical Suite. https://en.ennov.com/solutions/clinical/ (2024). Accessed 25 Sept 2024.
- 19.Viedoc: The essential eClinical software. https://www.viedoc.com/campaign/eclinical-software/ (2024). Accessed 25 Sept 2024.
- 20.RealTime eClinical: manage the research and business of clinical trials, together. https://realtime-eclinical.com/ (2024). Accessed 25 Sept 2024.
- 21.Clinevo Technologies: Clinevo Technologies. https://www.clinevotech.com/ (2024). Accessed 25 Sept 2024.
- 22.Castor: Castor. https://www.castoredc.com/ (2024). Accessed 25 Sept 2024.
- 23.Ripple Science: Clinical Trial Software. https://www.ripplescience.com/ (2024). Accessed 25 Sept 2024.
- 24.OpenClinica: OpenClinica. https://www.openclinica.com/ (2024). Accessed 25 Sept 2024.
- 25.REDCap: REDCap. https://www.project-redcap.org/ (2024). Accessed 25 Sept 2024.
- 26.McDonald EG, Dendukuri N, Frenette C, Lee TC. Time-series analysis of health care–associated infections in a new hospital with all private rooms. JAMA Intern Med. 2019Nov 1;179(11):1501–6. [DOI] [PMC free article] [PubMed] [Google Scholar]
- 27.Slyngstad L. The contribution of variable control charts to quality improvement in healthcare: a literature review. Journal of Healthcare Leadership. 2021Sep;10:221–30. [DOI] [PMC free article] [PubMed] [Google Scholar]
- 28.Suman G, Prajapati D. Control chart applications in healthcare: a literature review. International Journal of Metrology and Quality Engineering. 2018;9:5. [Google Scholar]
- 29.Nelson LS. The Shewhart control chart—tests for special causes. J Qual Technol. 1984Oct 1;16(4):237–9. [Google Scholar]
- 30.Abraham G, Byrnes GB, Bain CA. Short-term forecasting of emergency inpatient flow. IEEE Trans Inf Technol Biomed. 2009Feb 24;13(3):380–8. [DOI] [PubMed] [Google Scholar]
- 31.Nelson JD, McKenzie CR. Confirmation bias. Encyclopedia of medical decision making, vol. 1. Los Angeles: Sage; 2009. p. 167–71.
- 32.McCloy R, Byrne RM, Johnson-Laird PN. Understanding cumulative risk. Quarterly Journal of Experimental Psychology. 2010Mar;63(3):499–515. [DOI] [PubMed] [Google Scholar]
Associated Data
This section collects any data citations, data availability statements, or supplementary materials included in this article.
Supplementary Materials
Data Availability Statement
Not applicable.


