Abstract
The glucagon-like peptide 1 receptor (GLP1R) is a major drug target with several agonists being prescribed in patients with type 2 diabetes (T2D) and obesity 1, 2. The impact of genetic variability of GLP1R on receptor function and its association with metabolic traits are unclear with conflicting reports. Here, we performed a functional profiling of 60 GLP1R variants across four signaling pathways and revealed an unexpected diversity of phenotypes ranging from defective cell surface expression to complete or pathway-specific gain- (GoF) and loss-of-functions (LoF). The defective insulin secretion of GLP1R LoF variants was rescued by allosteric GLP1R ligands or high concentrations of exendin-4/semaglutide in INS-1 823/3 cells. Genetic association studies in 200K participants from the UK Biobank show that impaired GLP1R cell surface expression contributes to poor glucose control and increased adiposity with increased HbA1c, BMI and diastolic blood pressure. This study defines impaired GLP1R cell surface expression as a risk factor for T2D- and obesity-associated traits and provides potential treatment options for GLP1R LoF variant carriers.
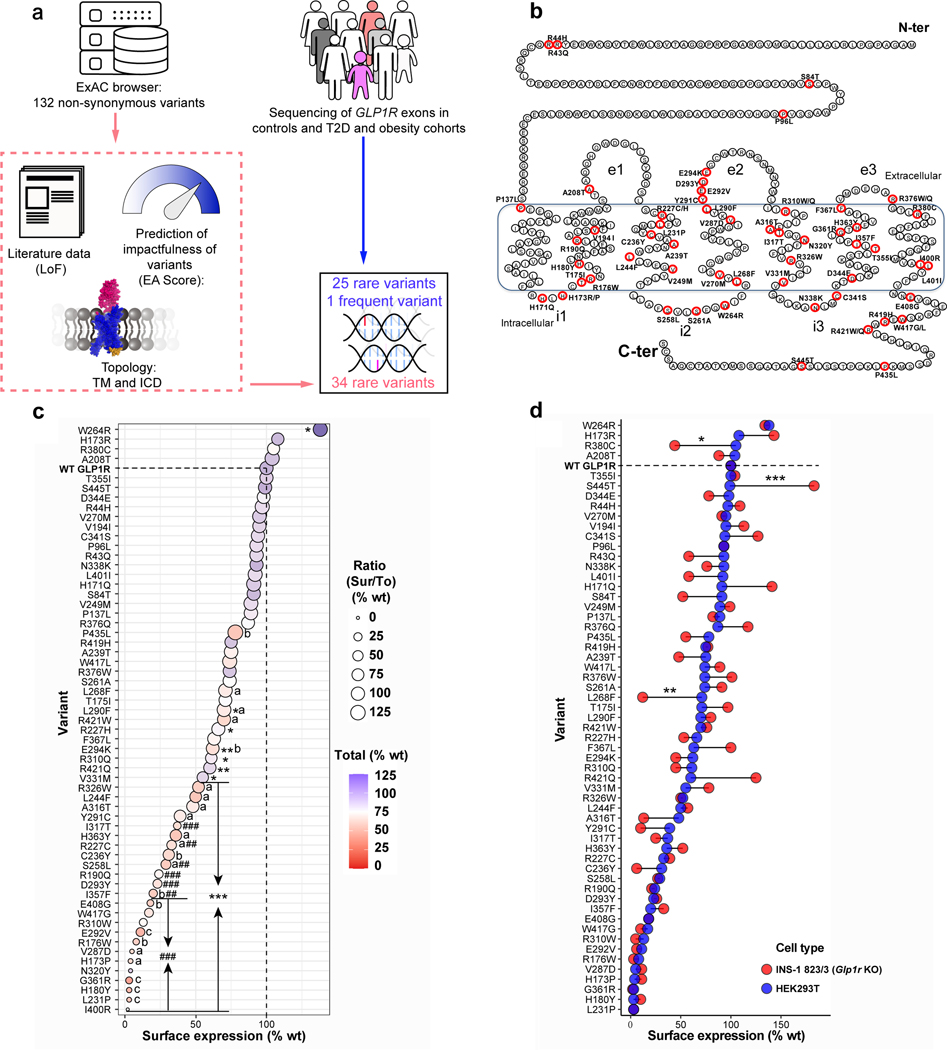
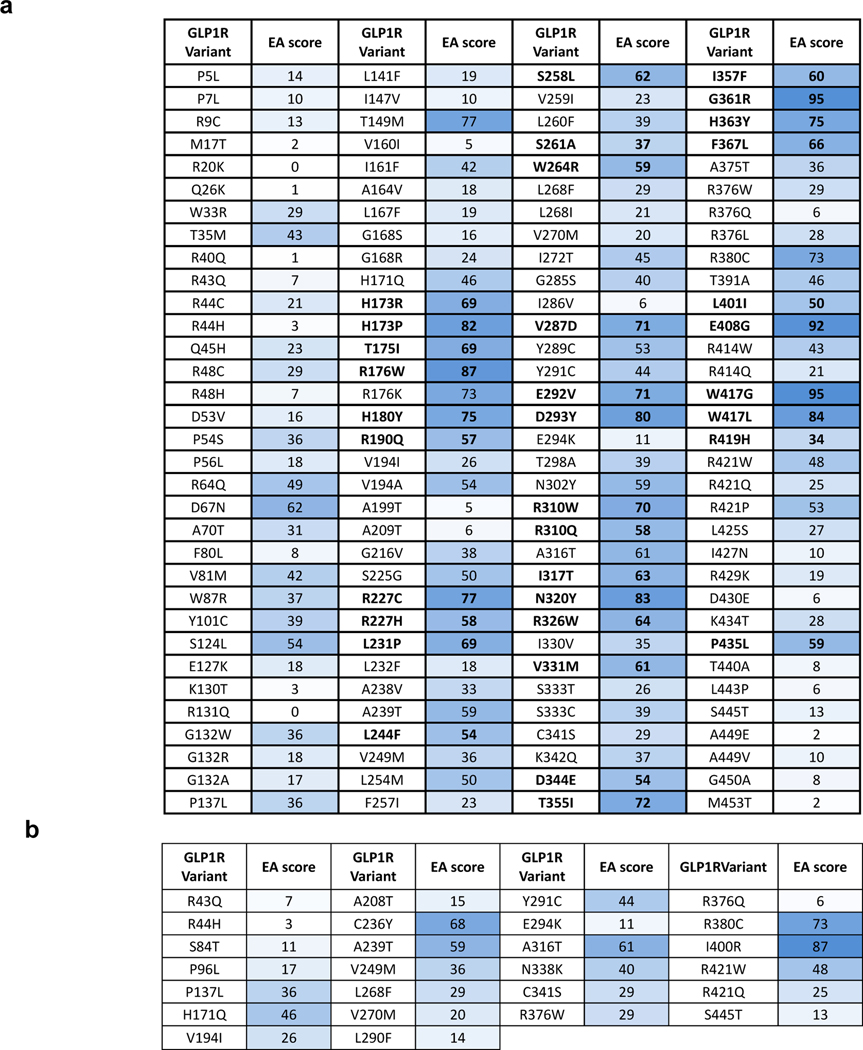
While GLP1R3 is a major T2D and obesity drug target, the consequences of GLP1R variants on receptor function and metabolic traits have remained poorly defined1. Conflicting results have been reported for frequent variants, including GLP1R LOF variants that are not associated with metabolic diseases4, 5, 6 and causality with disease risk was difficult to establish as these variants were in linkage disequilibrium with other genes. Here, we performed large-scale functional genetics of rare GLP1R variants enabling putative causality. Among the 132 GLP1R variants available in the ExAC browser in 2016, we selected 34 rare missense GLP1R variants i. which are predicted to be of moderate to high impact based on their evolutionary action (EA) scores7,8, ii. for which literature data was available on the functional consequences of alanine mutations9, iii. which were located in transmembrane and intracellular domains, known to be important for receptor activation and signal transduction (Fig. 1a, Extended Data Fig. 1a and Supplementary Table 1). In parallel, we sequenced GLP1R in 8,672 participants from the RaDiO study10. Among 46 detected missense variants, we selected 25 rare variants and a common one encoding p.A316T because of their high predicted functional impact (Fig. 1a, Extended Data Fig. 1b and Supplementary Table 1). In total, 60 GLP1R variants were selected for functional analyses (Fig. 1b).
Figure 1. Selection Process of GLP1R Variants and Expression of WT and Mutant GLP1R in Cell Models.
a, Selection of 34 rare non-synonymous variants in GLP1R (NM_002062.5) from ExAC browser and 25 rare and one frequent GLP1R variants from the RaDiO study10. EA, evolutionary action algorithm; TM, transmembrane domain; ICD, intracellular domain. b, Location of the 60 GLP1R variants. Mutant positions are labeled in red. The borders of the membrane domain are delineated by the blue box. C-ter, carboxyl-terminal domain; e1 to e3, extracellular loops 1 to 3; i1 to i3, intracellular loops 1 to 3; N-ter, amino-terminal domain. LoF, loss-of-function; T2D, type 2 diabetes. c,d, Surface (Sur) and total (To) expression in HEK293T and INS-1 823/3 (Glp1r KO) cells was determined by ELISA. (c) Expression of WT and mutant GLP1R in HEK293T cells. Cell surface expression is shown at X-axis, total receptor expression as color gradient and the Sur/To ratio as size of the bubble. Statistical significance of differences (compared with WT GLP1R) was determined by one-way analysis of variance and Dunnett’s post-test. Sur: *P < 0.05, **P < 0.001, ***P < 0.0001; Ratio: #P < 0.05, ##P < 0.001, ###P < 0.0001; Tot: (a) P < 0.05, (b) P < 0.001, (c) P < 0.0001. (d) Comparison of cell surface expression of mutants in HEK293T and INS-1 823/3 (Glp1r KO) cells. Statistical significance of differences between two cell types was determined by two-way analysis of variance and Sidak’s multiple comparisons test *P < 0.05, **P < 0.01, ***P < 0.0001. 3–5 technical replicates of 3–13 independent biological replicates for each mutant; each mutant expressed as % WT. See also Extended Data Fig. 2 and table S2 for complete data sets.
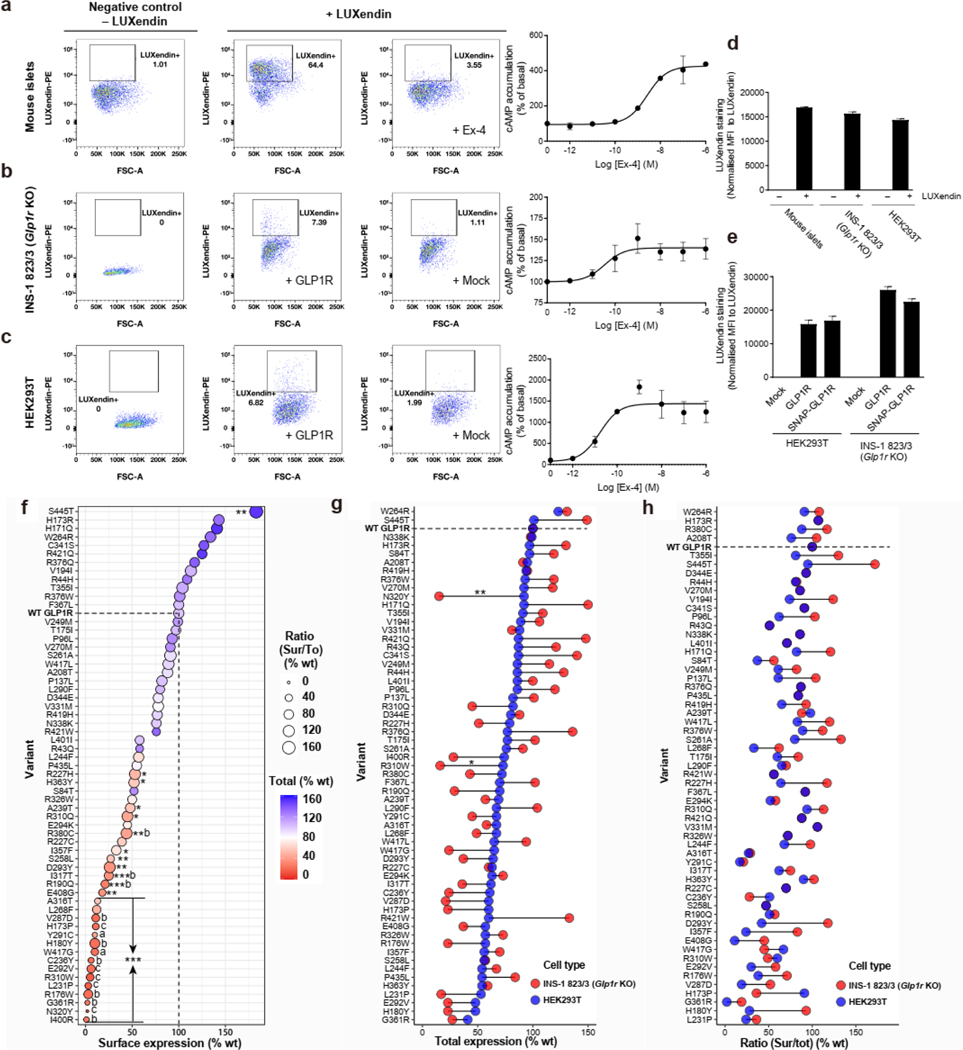
We first determined the abundance of wild-type (WT) and each mutant GLP1R at the cell surface in HEK293T cells which do not endogenously express GLP1R, and in rat insulinoma INS-1 823/3 (Glp1r KO) cells deleted of its endogenous Glp1r gene11. Transfection of WT GLP1R with a N-terminal SNAP-flag-tag resulted in expression levels similar to endogenous GLP1R levels found in mouse pancreatic islets12 (Extended Data Fig. 2a–d). Similar results were obtained with non-tagged WT GLP1R (Extended Data Fig. 2e). In HEK293T cells, total expression of 22 mutants was significantly lower than WT GLP1R (Fig. 1c (color code)). For a subset of mutants, trafficking to the cell surface was in addition significantly affected resulting in 31 variants with significantly reduced surface expression (Fig. 1c (size of bubbles) and Supplementary Table 2a). In INS-1 823/3 (Glp1r KO) cells total and surface expression was detectable for all mutants except for p.N320Y and p.I400R (Extended Data Fig. 2f and Supplementary Table 2b). Surface levels matched well in both cell types with occasional deviations for some variants but without any systematic trend towards higher or lower expression in either cell system (Fig. 1d). Defects in receptor trafficking and total expression contributed both to impaired surface expression (Extended Data Fig. 2g,h). Collectively, 22 out of 60 mutants showed significantly reduced cell surface expression in both INS-1 823/3 (Glp1r KO) and HEK293T cells.
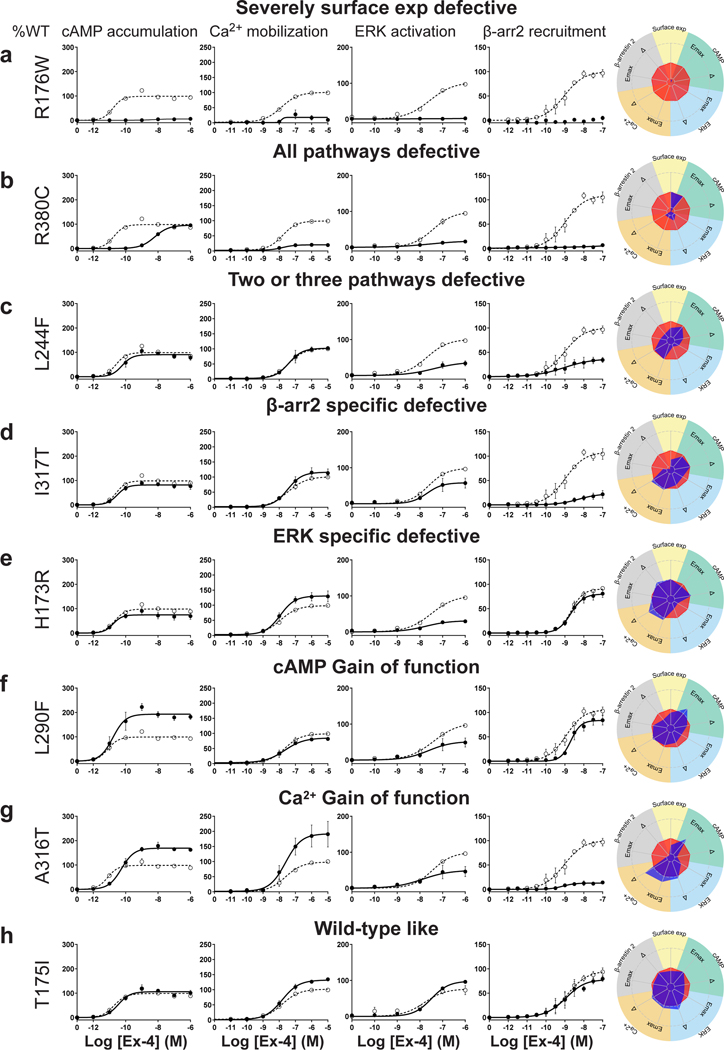
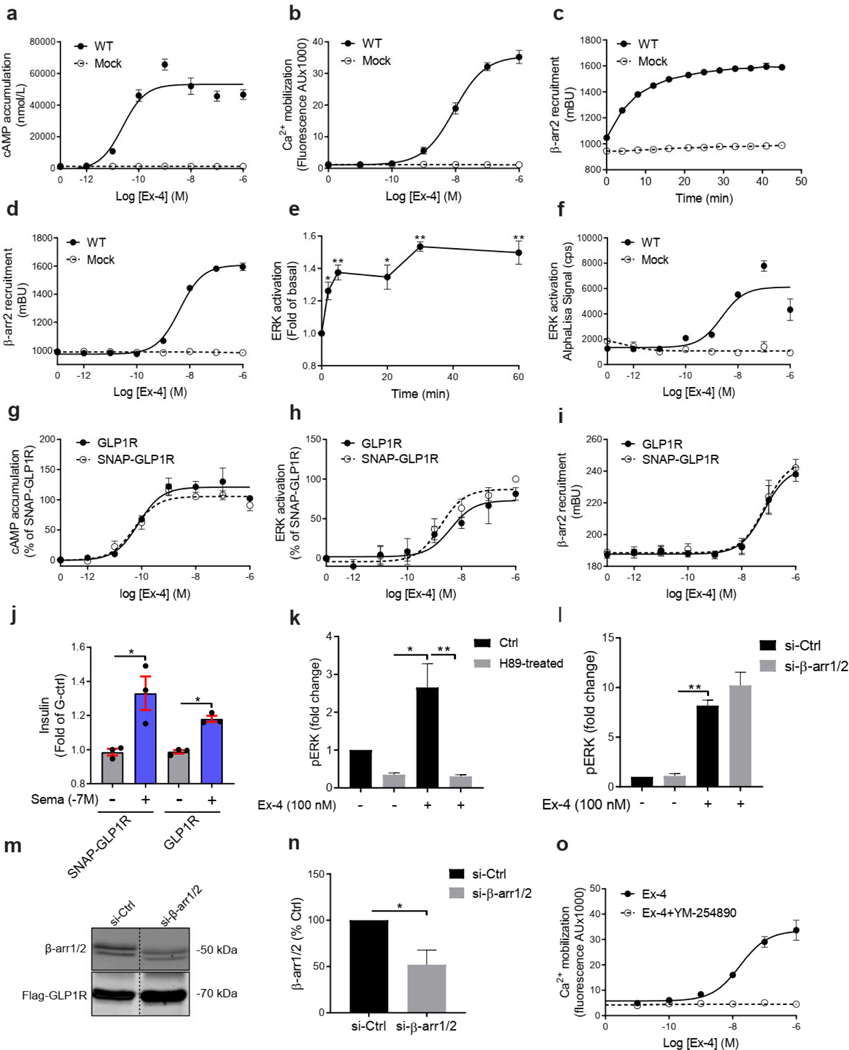
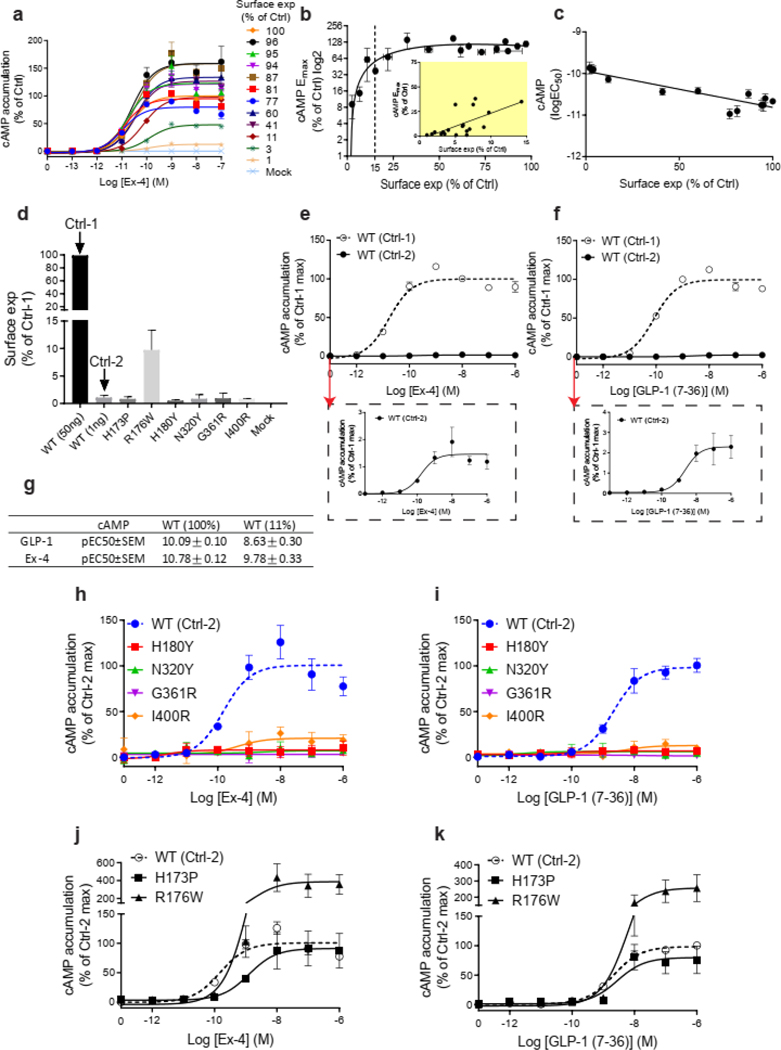
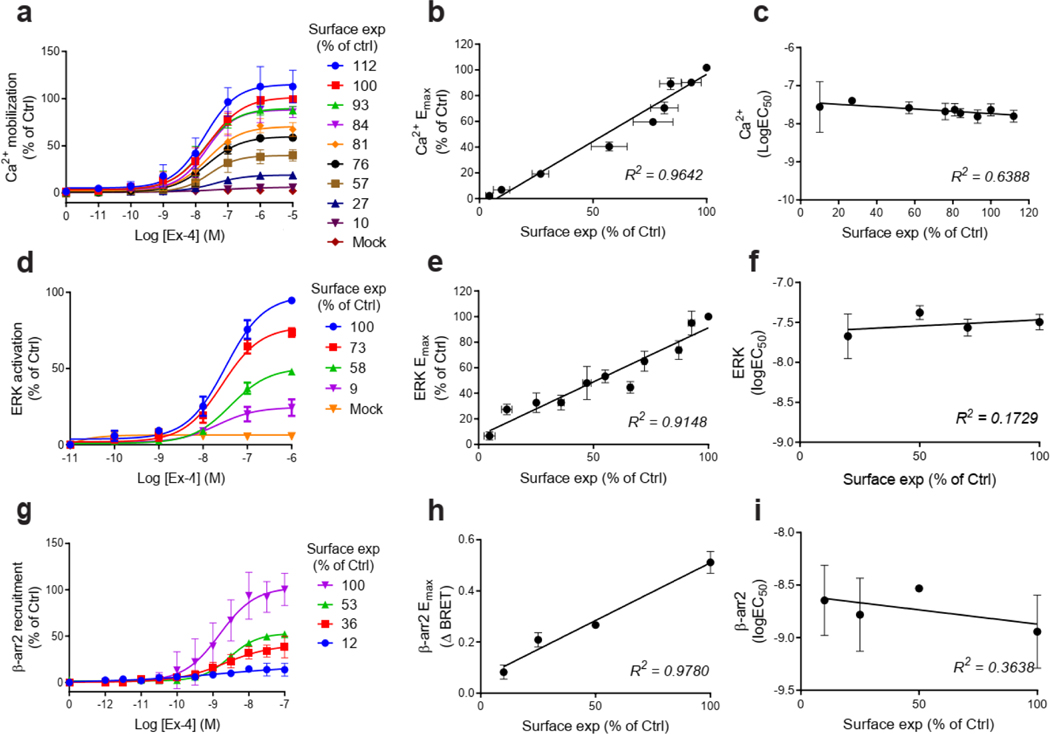
We next established the signaling profile of WT GLP1R and 60 mutants on four signaling pathways (cAMP accumulation, Ca2+ mobilization, ERK activation, and recruitment) in HEK293T cells. No spontaneous receptor activity was observed in the absence of ligand for any pathway for WT GLP1R (Extended Data Fig. 3a–d, f) and the mutants (data not shown). Ex-4 concentration-response curves were generated for the different signaling pathways (Extended Data Fig. 3a–f). To account for differences in cell surface expression levels of GLP1R mutants, we determined the correlation between GLP1R cell surface expression and and values for Ex-4 at different WT GLP1R expression levels (Extended Data Figs. 4a–c and 5) and we performed experiments with expression-matched WT GLP1R (Extended Data Fig. 4d–g). values were unaffected by the surface expression (Extended Data Figs. 4c and 5c,f,i) and values correlated positively with surface expression with a saturation observed for the cAMP pathway at 10 ± 3 % cell surface expression (Extended Data Figs. 4b and 5b,e,h).
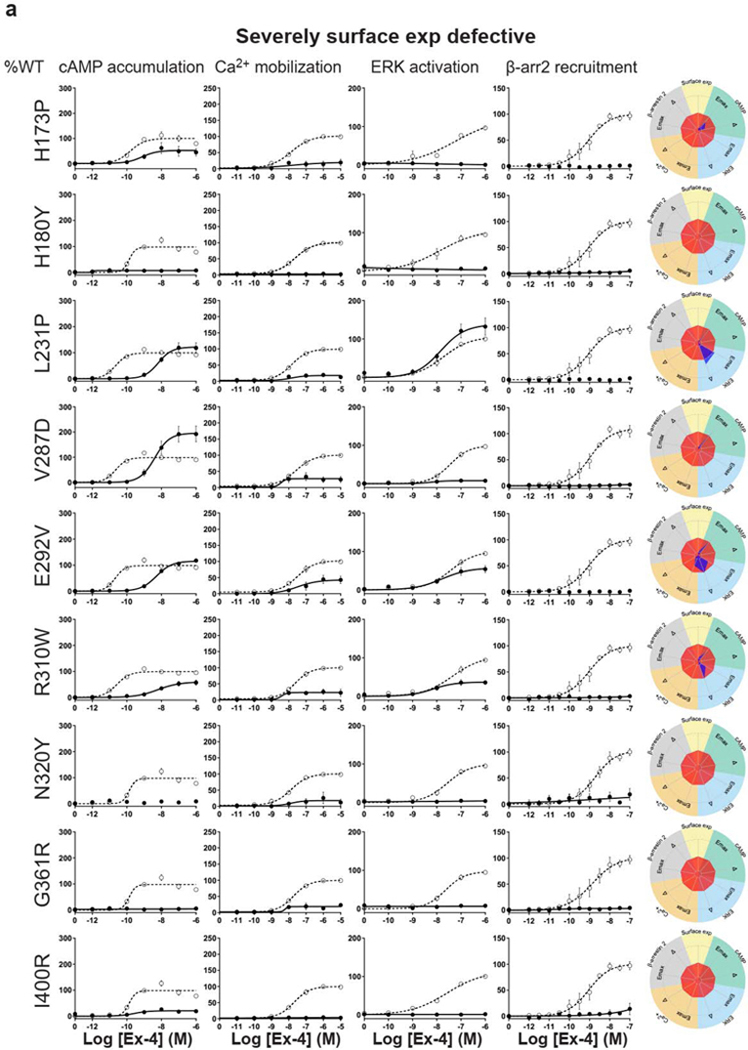
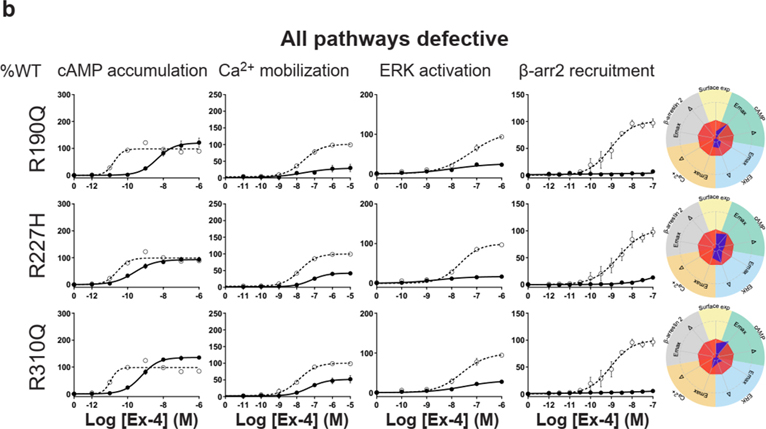
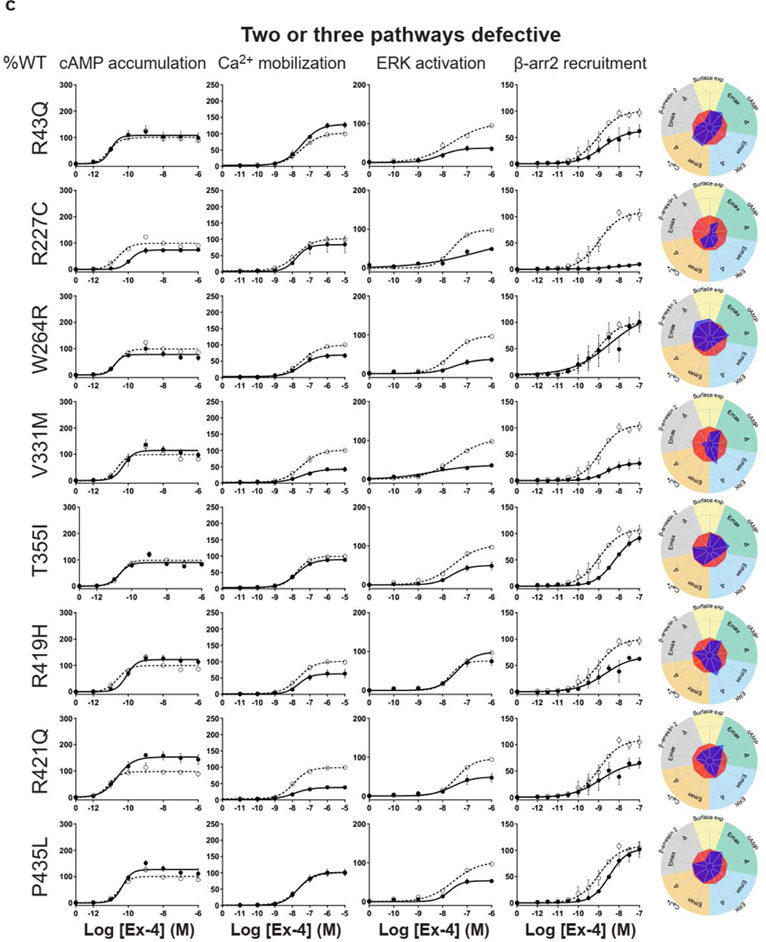
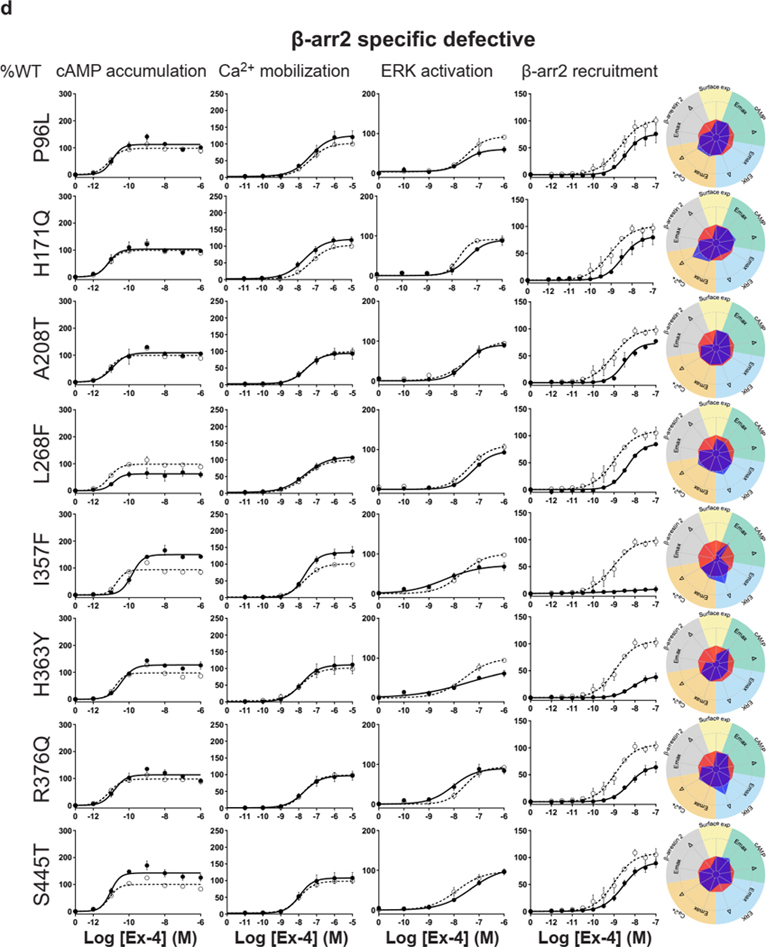
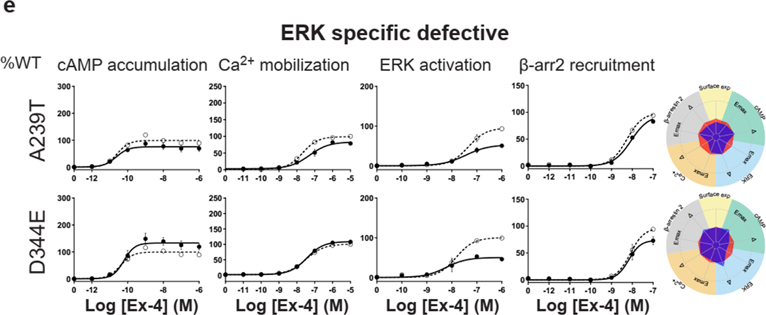
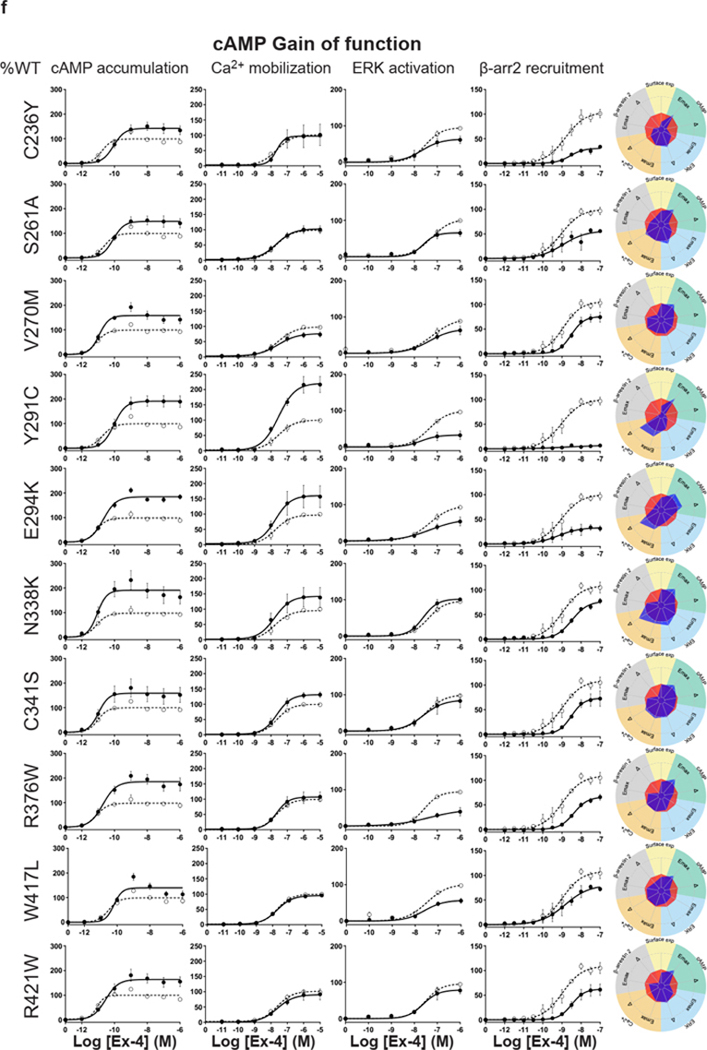
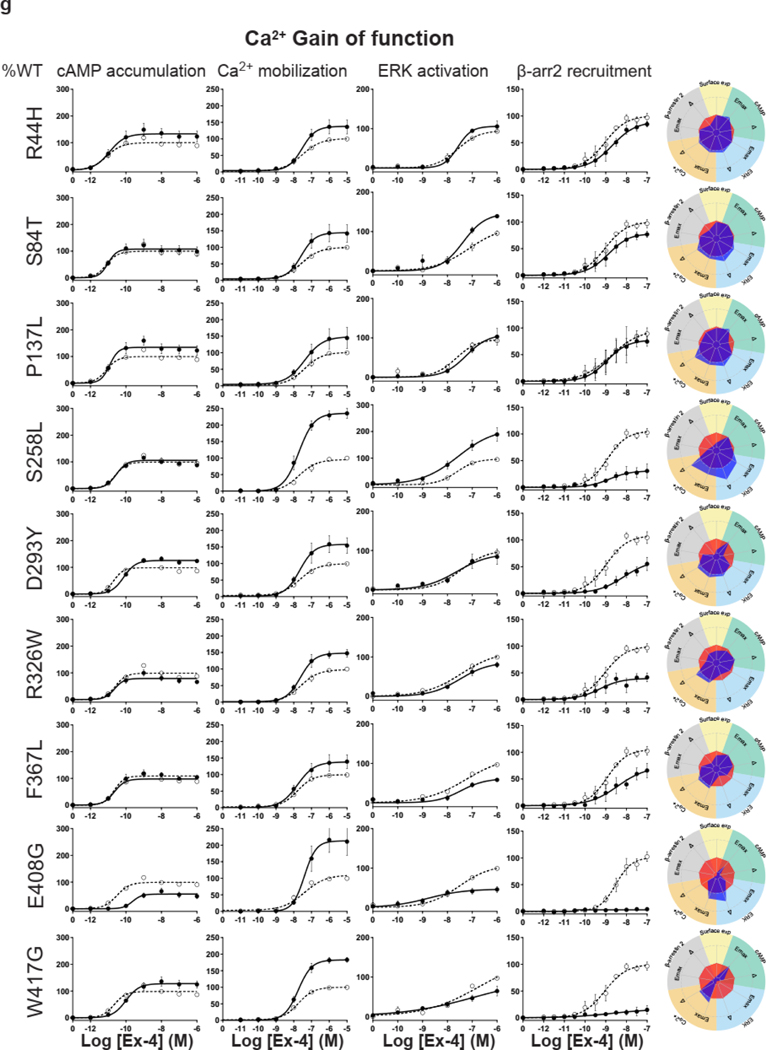
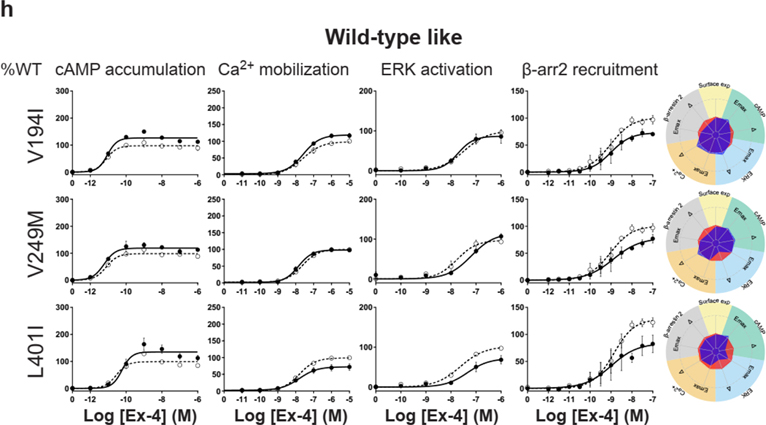
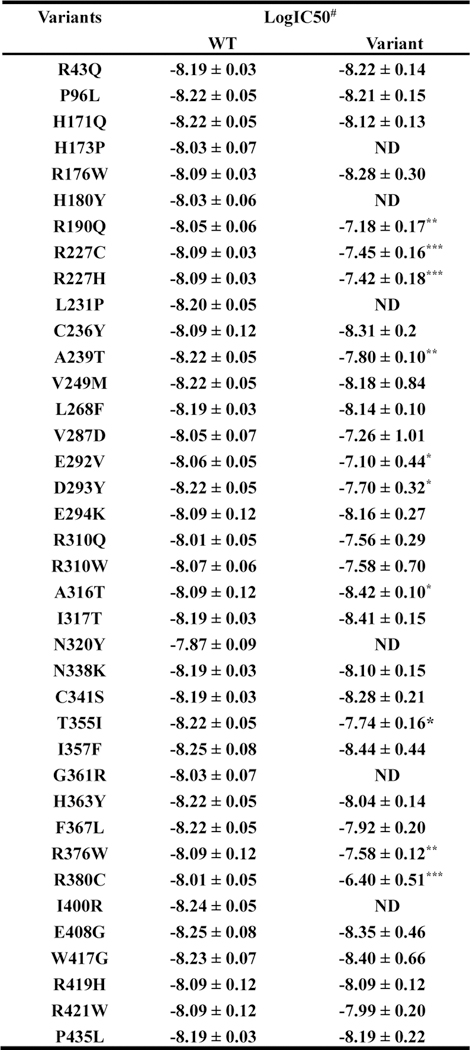
For the cAMP pathway LoF and GoF variants were observed (Fig. 2 and Extended Data Fig. 6 and Supplementary Table 3a). Most LoF mutants can be explained by impaired cell surface expression impacting either or (Extended Data Fig. 4h–k). Interestingly, p.R380C shows normal surface expression but the most severe loss in Ex-4 affinity of all variants (1.5 logs; ) (Fig. 2b and Extended Data Fig. 7). GoF mutants show increased values despite normal surface expression. Ca2+ mobilization is affected in 2/3 of the studied GLP1R mutants with both LoF and GoF in (Fig. 2 and Extended Data Fig. 6 and Supplementary Table 3b). Twenty-seven mutants showed significantly impaired ERK1/2 activation and one mutant (p.S258L) increased ERK1/2 activation (Fig. 2 and Extended Data Fig. 6 and Supplementary Table 3c). The pathway represents the pathway for which most of the mutants are affected with diminished and/or (Fig. 2 and Extended Data Fig. 6 and Supplementary Table 3d). GoF was not observed for this pathway. Based on all these functional analyses we grouped the mutants into eight categories: those with severely impaired cell surface expression (less than 10 ± 3 %), those with all four or two or three pathways impaired, those with specific defects only in recruitment or ERK1/2 signaling, those exhibiting a gain-of-function (GoF) in cAMP or Ca2+ signaling, and those similar to WT GLP1R (Fig. 2a–h and Extended Data Fig. 6a–h).
Figure 2. Functional Profiling of GLP1R Mutants Define Eight Categories.
a-g, Ex-4 concentration-response curves of cAMP production, Ca2+ mobilization, ERK activation, and recruitment and radial graphs of one representative GLP1R mutant of each category. Mutant GLP1R (solid lines with filled circles) and WT GLP1R (dotted lines with open circles) were monitored in parallel in each experiment. For radial graphs, data were normalized to WT GLP1R (set as zero), values of mutants ranged from −1 to +1, where 0 to +1 represent enhanced properties, and 0 to −1 represents impaired properties. All values are means ± SEM of 2–3 technical replicates of 3–8 independent biological replicates for each mutant. Exp, expression; ; Ex-4, Exendin-4. See also Extended Data Fig. 4 to Extended Data Fig. 7 and tables S2 and S3 for complete data sets for the agonist-mediated signaling activity of GLP1R mutants.
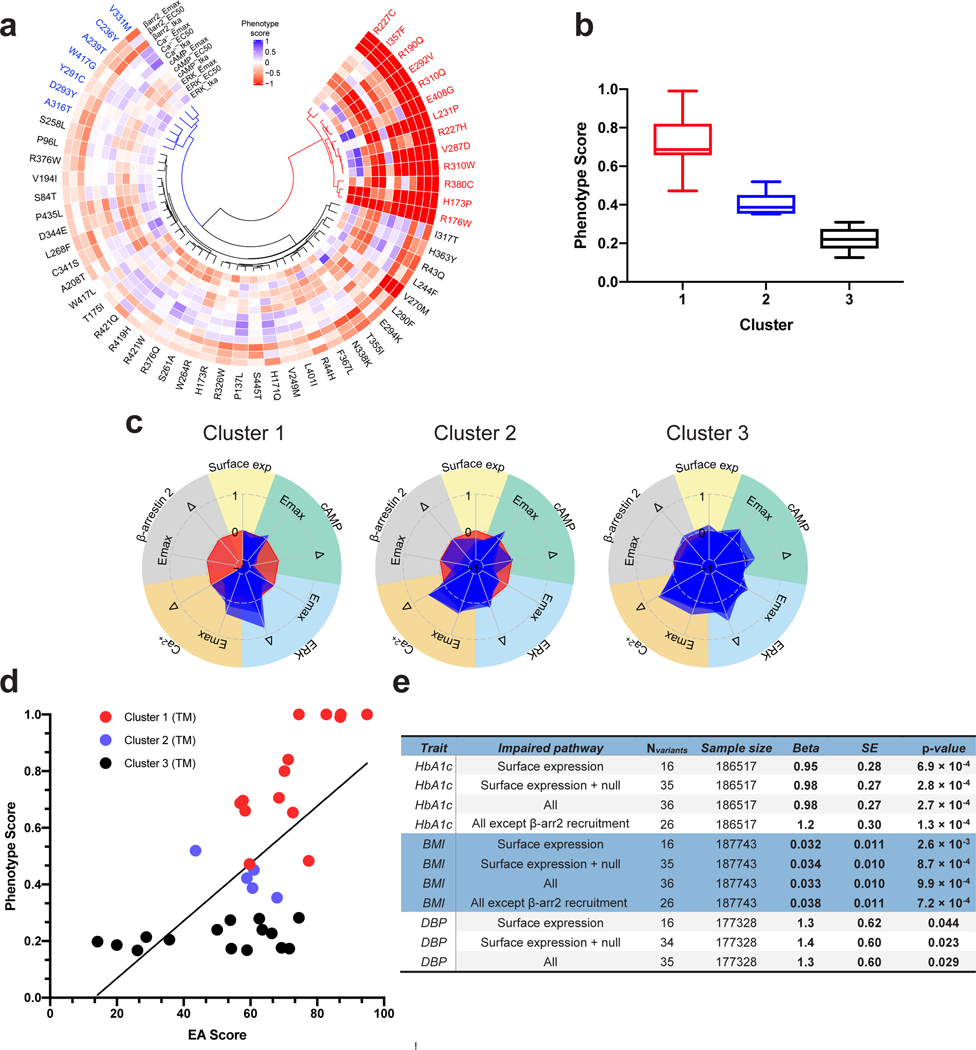
To further evaluate the overall signaling efficiencies of each mutant, we determined their transduction coefficient , and compared the values of the WT receptor and each mutant by subtracting the corresponding transduction coefficient and expressed it as (Supplementary Table 3a–d). We then plotted radial graphs containing together with values for all pathways to generate a visible signaling signature for each mutant (Fig. 3 and Extended Data Fig. 6). When excluding the mutants with severely impaired cell surface expression, the cAMP pathway turned out to be the most affected pathway, with eight mutants displaying values of up to −3.16, which is significantly different from zero, the reference value (Supplementary Table 3a), followed by recruitment (Supplementary Table 3d) with seven mutants with modest values (between −1.00 and −1.54). Only three and zero mutants showed statistically significant values for Ca2+ mobilization (Supplementary Table 3b) and ERK1/2 activation (Supplementary Table 3c), respectively.
Figure 3. 56 Mutants Clustered into Three Groups are Correlated to the Level of Phenotypic Pb.
a, Non-Negative Matrix Factorization (NMF) and K-means analysis clustered 56 mutants into 3 groups as shown in three dendrograms (red, blue, and black). The normalized difference values from phenotypic assays are represented in each radial plot and color-coded blue (Gain-of-Function, GoF) to red (Loss-of-Function, LoF). Phenotype scores were set from −1 to +1. WT GLP1R was set as zero, values of mutants ranging from 0 to +1 represent enhanced properties, and from 0 to −1 impaired properties. b, The box plot shows the distribution of the mutants into three clusters based on their phenotype score defined in the ‘Methods’ section. c, Superimposed radial graphs of mutants belonging to the same cluster. Cluster 1 is characterized by a complete loss of response and also drastically reduced potency of the cAMP response. They also lost mid to high ERK efficacy. Cluster 2 shows detectable function but drastic losses in Emax and . These mutants also have reduced ERK efficacy but increased ERK potency. Member of Cluster 3 shows lower phenotype scores than those of the other two clusters. d, The predictive evolutionary Action (EA) score of GLP1R mutants in the TM domain is correlated with the experimentally determined Phenotypic score of these mutants. R2=0.41 for the linear correlation (P < 0.0001). The TM domain was selected because of its highest predictive value for GPCRs 27, Pb, Perturbatio. e, Association between rare GLP1R variants and metabolic traits in the UK Biobank. , beta arrestin 2; BMI, body mass index; DBP, diastolic blood pressure; HbA1c, glycated hemoglobin A1C; HDL, high-density lipoprotein; LDL, low-density lipoprotein; SBP, systolic blood pressure; SE, standard error.
Interestingly, some of the variants showed signaling bias. Five variants encoding p.R227C, p.Y291C, p.R310Q, p.I357F and p.E408G (Extended Data Fig. 6) were G protein-biased with loss of recruitment but activation of the Gs/cAMP pathway and the Gq/11/ Ca2+ pathway (Supplementary Table 3b). Among these, p.E408G showed even GoF for Ca2+ mobilization and p.Y291C for both Ca2+ mobilization and cAMP production. None of the mutants were biased towards . Three variants encoding p.H173P, p.R190Q (Extended Data Fig. 6) and p.R380C (Fig. 2b) were strictly Gs/cAMP biased, as activation of all other pathways were undetectable. Another remarkable finding of our study was that, for many mutants, GoF or LoF was not a general feature of the mutant but was restricted to specific signaling pathways, leading to complex and different signaling signatures for each variant. In some cases, GoF and LoF phenotypes were observed for the same mutants, as exemplified by five mutants with LoF for recruitment combined with GoF for Ca2+ mobilization (p.E408G, p.W417G), for cAMP production (p.I357F) or for both pathways (p.Y291C, p.A316T) (Extended Data Fig. 6d,g,f, Fig. 2g).
We next performed an unbiased cluster analysis of those mutants for which signaling data were obtained for at least one pathway (56 variants) (Fig. 3). Non-negative matrix factorization (nnmf) and k-means were used to unbiasedly group the variants. To have a unique measure representing the signaling signatures of each variant, we defined the “phenotype score” as the positive-sum average of 12 signaling parameters. The mutants with different signaling profiles fitted best into three distinct clusters (Fig. 3a). Mutants in the first cluster (red, 13 variants) are characterized by complete loss of response and drastically reduced potency of the cAMP response. They also lost mid to high range of efficacy in ERK1/2. In the second cluster (blue, seven variants), responses are detectable, but with drastic losses in and . They also show reduced ERK1/2 efficacy, while increased ERK1/2 potency. Signaling impairments varied in Cluster 3 (black, 36 variants) with the variants with the lowest phenotypic scores belonging to this group (Fig 3a,b). The overlay of the different members of each cluster is shown in Fig 3c.
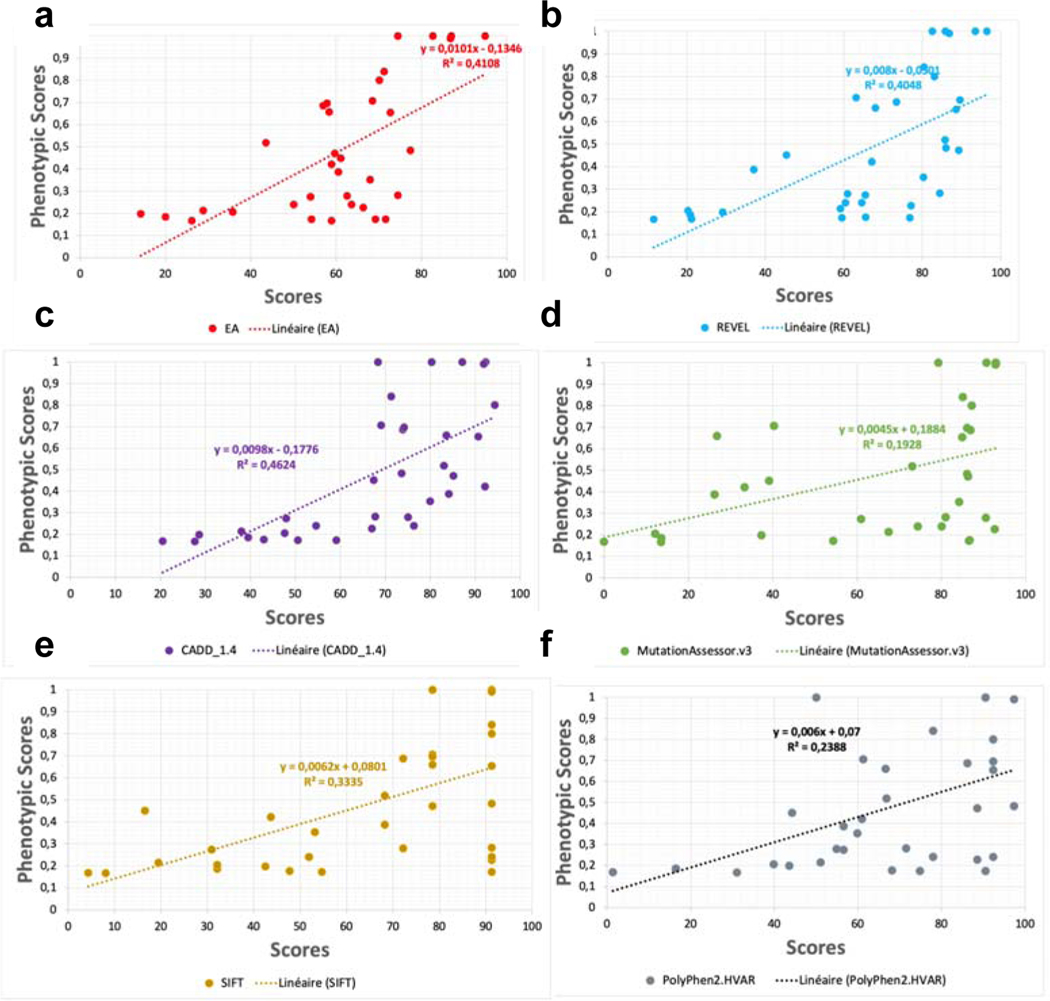
We then compared the experimentally obtained phenotypic score for those mutations located in the transmembrane region with six different scoring algorithms including EA, REVEL, CADD, SIFT, PolyPhen2, and MutationAssessor (Extended Data Fig. 8). CADD and EA scores showed the best R squares (0.46 and 0.42). The EA score showed the steepest slope (x-coefficient=0.0101), meaning the best discriminatory information, and showed also the lowest number of false positives (mutants with high predicted score (>80) but low phenotypic score) confirming the high value of the EA score in predicting the effect of variants on receptor fitness (Fig. 3d).
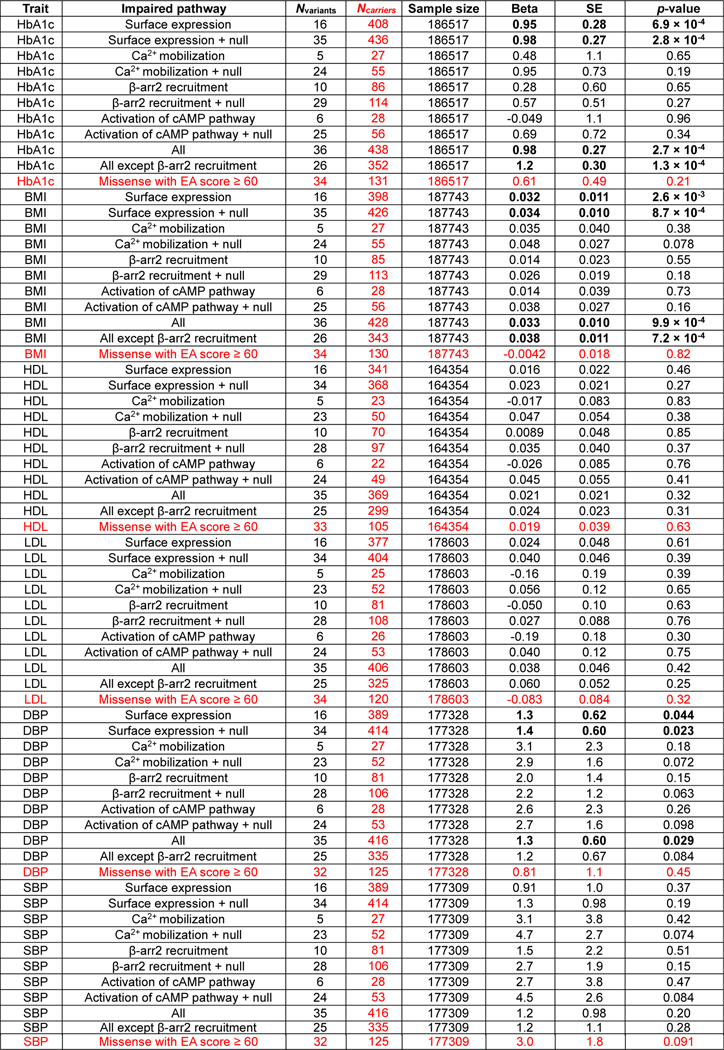
Among the GLP1R variants that were functionally analyzed in vitro, 35 variants were present in the 200K exome data of the UK Biobank (Supplementary Table 1). We could therefore assess the association between these GLP1R variants and various metabolic traits in UK Biobank. In the carriers, each GLP1R variant was heterozygous. Using the mixed-effects score test (MiST) method adjusted for relevant covariates, the burden of rare, loss-of-function GLP1R variants impairing cell surface expression was significantly associated with increased glycated hemoglobin A1c (Hb1Ac) ( with an effect [] of 0.95±0.28), increased body mass index (BMI) ( with a of 0.032±0.011) and increased diastolic blood pressure ( with a of 1.3±0.62 (Fig. 3e and Extended Data Fig. 9). These associtaions were stronger when rare, null (i.e. nonsense, frameshift, canonical ±1 or 2 splice sites, start lost) variants in GLP1R that were detected in the 200K exome data of the UK Biobank (Supplementary Table 4) were also included in the burden of GLP1R variants ( with a of 0.98±0.27, with a of 0.034±0.010 and with a of 1.4±0.60, respectively) (Fig. 3e and Extended Data Fig. 9). Furthermore, the burden of rare, null GLP1R variants along with all rare GLP1R variants impairing Ca2+ mobilization, recruitment, cAMP pathway and/or cell surface expression strongly increased both HbA1c ( with a of 0.98±0.27) and BMI levels ( with a of 0.033±0.010) (Fig. 3e and Extended Data Fig. 9). These associations were even stronger when LoF variants of recruitment were excluded ( with a of 1.2±0.30 and with a of 0.038±0.011, respectively) (Fig. 3e and Extended Data Fig. 9). This result suggested that defective recruitment is deleterious for glucose homeostasis and adiposity. Of note, we did not find any significant associations between rare deleterious GLP1R variants with EA score ≥ 60 and metabolic traits (Extended Data Fig. 9), highlighting the importance of in vitro analyses as we show here and in previous functional genetics-based studies,13, 14, 15 although the number of carriers was lower. Collectively, these results indicate that impaired GLP1R cell surface expression is a risk factor for increased HbA1c, BMI and diastolic blood pressure levels. Impaired recruitment seems to have rather a beneficial effect on these phenotypes, most likely by limiting GLP1R trafficking16.
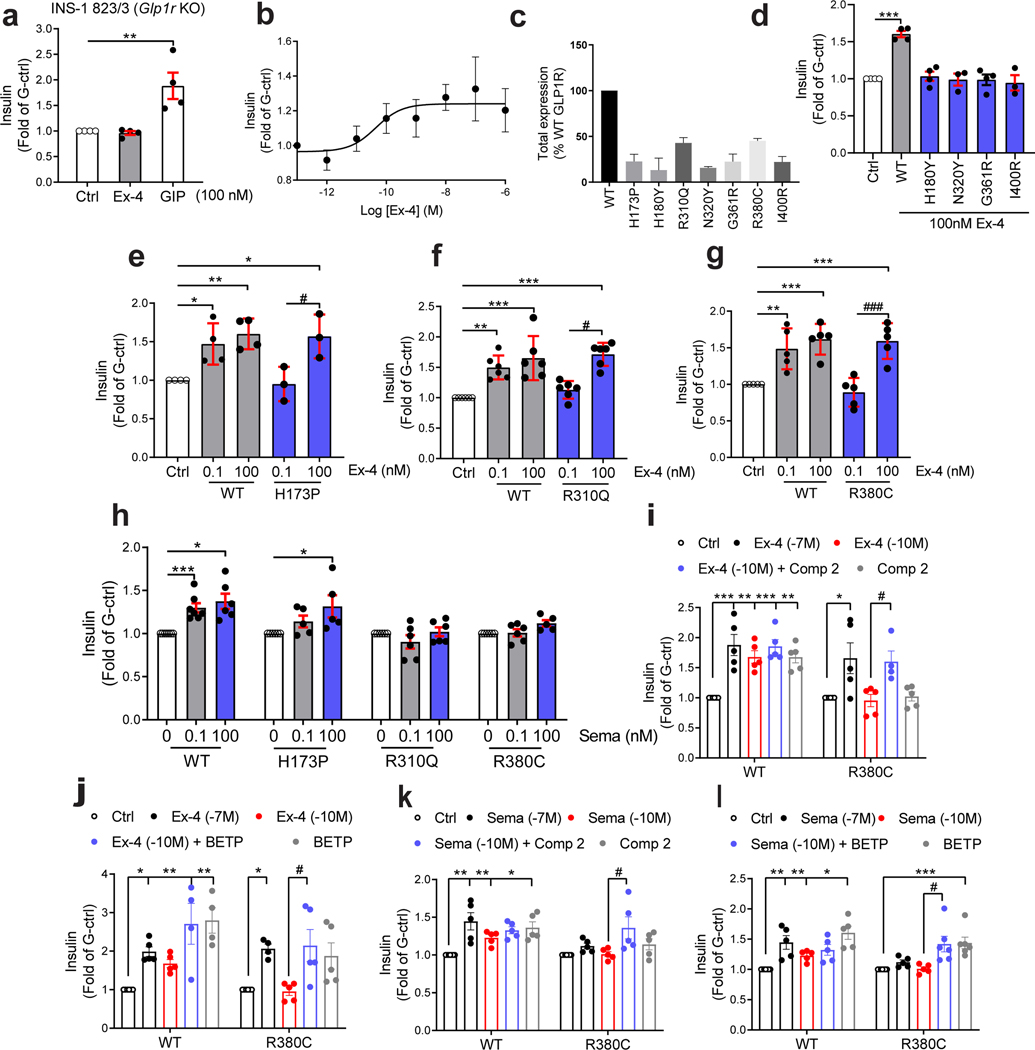
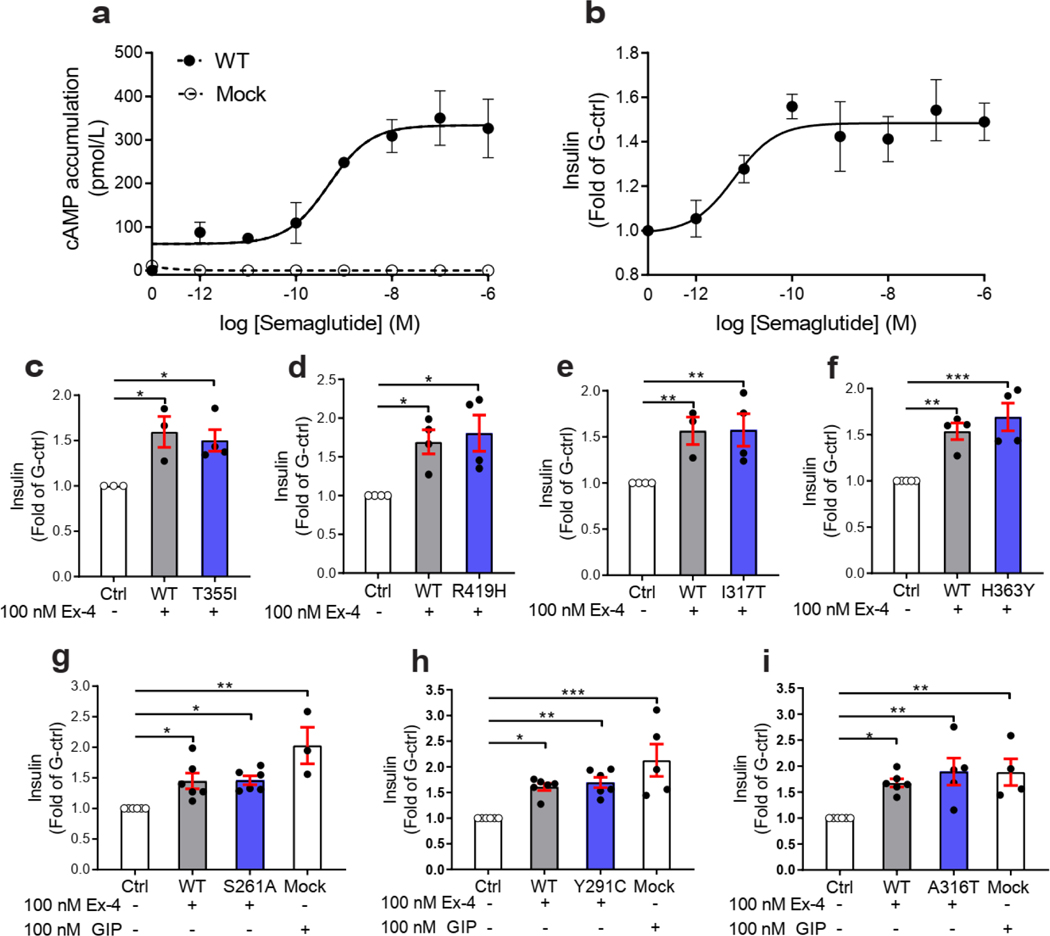
We then measured incretin promoted glucose-stimulated insulin secretion (GSIS) in INS-1 823/3 (Glp1r KO) cells. Expression of WT GLP1R restored a functional response by Ex-4 (p of 10.35 ± 0.28; ) and semaglutide (a clinically used GLP1R agonist17) ( of 11.20 ± 0.38; ) (Fig. 4a,b and Extended Data Fig. 10a,b). As expected, expression of mutants with LoF on all pathways and severely impaired cell surface expression (i.e. p.H180Y, p.N320Y, p.G361R and p.I400R) did not restore an Ex-4 response despite successful expression, even though lower than for WT receptor (Fig. 4c,d, see also Fig. 2b). Expression of mutants in the categories ‘Severely surface exp defective’ and ‘All pathways defective’ but with some residual activity on the cAMP pathway (p.H173P, p.R310Q, p.R380C) did not elicit a response at a low Ex-4 concentration, considered as saturating for WT GLP1R (0.1 nM), and most likely not at physiological GLP-1 concentraton. However, the same variants were fully responsive at 100 nM Ex-4 (Fig. 4b, Fig. 4e–g). Similar rescue was observed for p.H173P with 100 nM semaglutide (Fig. 4h). Positive allosteric modulators (PAM) are another potential way to improve the defective response of LoF mutants to orthosteric ligands 4. Co-stimulation of the p.R380C mutant with 0.1 nM Ex-4 and the GLP1R PAM Compound 2 (10 μM)18, 19, 20 restored a response similar to the incubation with 100 nM Ex-4 alone (Fig. 4i). Compound 2 alone did not have a significant effect on the p.R380C mutant (Fig. 4i). A similar pattern was observed for BETP (10 μM), another GLP1R PAM, which was also effective on its own revealing its agonistic activity in addition to its allosteric activity (Fig. 4j). Compound 2 and BETP similarly potentiated the response of semaglutide at low concentrations (Fig. 4k,l). Mutants with defective recruitment showed WT-like GSIS (Extended Data Fig. 10c–f) indicating that defects in this pathway do not inhibit GSIS. GoF mutants, either of the cAMP pathway alone (p.S261A) or in combination with the Ca2+ pathway (p.Y291C, p.A316T) showed GSIS similar to WT GLP1R and endogenous GIP receptors (Extended Data Fig. 4g–i) indicating that the improved signaling had no notable consequences on GSIS in our experimental settings.
Figure 4. Rescue of Insulin Secretion of GLP1R Mutants Expressed in INS-1 823/3 (Glp1r KO) cells.
INS-1 823/3 (Glp1r KO) pancreatic -cell line deleted of its Glp1r gene was used to examine the capacity of GLP1R mutants to promote glucose-stimulated insulin secretion. a, Ex-4 (100 nM) and GIP (100 nM) response in mock-transfected cells. b, Ex-4 concentration-response curve in cells expressing GLP1R WT. c, Total expression of mutants determined by ELISA. d-g, Ex-4 response in cells expressing mutants with (d,e) severely defective cell surface expression or (f,g) severely defective cAMP pathway (2 logs right shifted ). h, Semaglutide response in cells expressing WT GLP1R, p.H173P, p.R310Q or p.R380C mutants. i,j, Ex-4 response in the presence of Compound 2 or BETP in cells expressing the p.R380C mutant. k,l, Semaglutide response in the presence of Compound 2 or BETP in cells expressing the p.R380C mutant. Responses are normalized to glucose-induced insulin secretion in the absence of Ex-4. All values are means ± SEM of at least three independent experiments. Statistical significance of differences (compared with control) was determined by one-way analysis of variance and Dunnett’s post-test *P < 0.05, **P < 0.01, ***P < 0.0001. Statistical significance of differences (compared with 0.1 nM treatment of GLP1R mutant) was determined by one-way analysis of variance and Dunnett’s post-test #P < 0.05, ###P < 0.0001. Ex-4, Exendin-4; G-ctrl, glucose control; Comp 2, Compound 2; Sema, Semaglutide.
Taken together, in this study we discovered an unexpected high diversity and impact in terms of functional properties in 56 out of 60 rare GLP1R mutants. Our results identify defective cell surface expression and cAMP pathway activation as major determinants of GLP1R mutants for defective insulin secretion. This defect can be recovered by two pharmacological paradigms (higher agonist concentrations or a combination of low agonist concentration and allosteric modulators) for some mutants. Carriers of these LoF GLP1R variants migh thus not only benefit from the latest generations of GLP1R agonists including unimolecular GLP1R/GIPR dual agonists,21 but also from recently developed GLP1R positive allosteric modulators22, 23. LoF GLP1R variants were associated with impaired glucose homeostasis and increased adiposity. Exclusion of LoF mutants for recruitment reinforced this association. This observation supports the concept that -arr-dependent internalization limits the action of GLP1R activation on insulin secretion and suggests that carriers of LoF variants not associated with could benefit from Gs-biased ligands24.
This study has some limitations as we did not further explore the fact that rare GLP1R variants are heterozygous and may either impact the phenotype through haplo-insufficiency or have a dominant negative effect on the signalling by the co-expressed WT receptor. Aspects that should be addressed in future studies are the demonstration that PAMs can improve the actions of GLP1R agonists in GLP1R variant carriers, the impact of mutants on GLP1R signaling from intracellular locations, on the recruitment of , known to be also involved in insulin secretion and apoptosis25, 26, and on physiological functions of GLP1R other than insulin secretion, such as proliferation or inhibition of food intake1.
METHODS
Studies in cellular models
HEK293T cells (RRID: CVCL 0063) were cultured in Dulbecco’s modified Eagle’s medium (DMEM, GIBCO, 10566) consisting of 10% fetal bovine serum (FBS), 100 U/ml penicillin, and 0.1 mg/ml streptomycin. INS-1 832/3 cells lacking endogenous Glp1r after deletion by CRISPR-Cas9 11, a gift from Dr Jacqueline Naylor, were cultured in RPMI-1640 medium (Invitrogen), supplemented with 10% FBS, 100 U/ml penicillin, 0.1 mg/ml streptomycin, 1 mM sodium pyruvate, 10 mM HEPES and 50 μM 2-mercaptoethanol. Cells were incubated in a humidified air incubator containing 5% CO2 at 37°C.
GLP1R gene sequencing
Participants included in the RaDiO study were previously described (Nat Med. 2019 Nov;25(11):1733–1738. // Nat Metab. 2020 Oct;2(10):1126–1134.). DNA sequencing of GLP1R (NM_002062.5) was performed by next-generation sequencing as previously described (Nat Med. 2019 Nov;25(11):1733–1738. // Nat Metab. 2020 Oct;2(10):1126–1134.). Briefly, NimbleGen SeqCap EZ Choice XL target enrichment (Roche, Pleasanton, USA) was performed according to the manufacturer’s protocol for next-generation sequencing on the HiSeq 4000 system (Illumina, San Diego, USA), using a paired-end 2×150 bp protocol. The demultiplexing of sequence data was performed using bcl2fastq Conversion Software (Illumina; v2.17). Sequence reads were then mapped to the human genome (hg19/GRCh37) using Burrows-Wheeler Aligner (v0.7.13). The variant calling was performed using Genome Analysis ToolKit (GATK; v3.3). Only variants with a coverage higher than 8 reads were kept for further analyses. The annotation of variants was performed using the Ensembl Perl Application Program Interfaces (v75) and custom Perl scripts to include data from both dbSNP (version 135) and dbNSFP (v3.0) databases. All coding variants had a QUAL score higher than 50. Furthermore, no variant had more than 5% missing genotype (with a coverage below 8 reads or a QUAL score below 50) across the participants.
In UK Biobank (Application #67575), we analyzed up to 187,743 samples, with available exome sequencing data and clinical data. More specifically, we used exome data from pVCF format (field #23156). Only variants with a coverage higher than 10 reads and quality GQ score higher than 20 were kept for further analyses. Annotation of variants in GLP1R (NM_002062.5) was done using the Ensembl Variant Effect Predictor (VEP) tool version 103 (RefSeq). Subsequently, the analysis was focused on loss-of-function variants. No loss-of-function variant had more than 5% missing genotype (i.e. with a coverage below 10 reads or a GQ score below 20) across the participants.
Selection of GLP1R coding variants for functional in vitro analysis
In 2016, the ExAC browser (previous version of Genome Aggregation Database [GnomAD]) included 132 nonsynonymous variants in GLP1R (NM_002062.5), including five common variants with a MAF higher than 1% (Fig. 1 and table S1). To predict the functional impact of these variants in silico, we determined their evolutionary action (EA) score 7 (Extended Data Fig. 1). The EA has been shown to usefully predict the functional impact of mutations in genes encoding GPCRs 14, 27. It takes into account the relative importance of each residue position estimated with the evolutionary trace method based on phylogenetic divergences 8, combined with the likelihood to observe a given amino acid substitution at that position in receptor homologs across evolution 7. We selected 44 missense GLP1R variants predicted to be of moderate to high impact based on their EA scores. Available literature data on the functional consequences of alanine mutations at 11 positions among the positions of the 132 variants guided us further in the selection of the most impactful variants (Fig. 1). To further narrow down the number of variants we focused on mutations located in the TM and intracellular domains, both known to be important for receptor activation and signal transduction. At the end this selection process, we focused on 34 rare variants with high predicted functional impact (Fig. 1, Extended Data Fig. 1a and table S1). In parallel, we performed sequencing of GLP1R exons (NM_002062.5) in 8,672 participants from the RaDiO study 10. We identified 46 nonsynonymous variants of which we selected 25 rare variants and a common one encoding p.A316T because of their high predicted functional impact (Fig. 1, Extended Data Fig. 1b and table S1). In total, 60 GLP1R variants were selected for in vitro functional analyses (see Fig. 1b for positions in the receptor).
Receptor mutagenesis and constructs
GLP1R cDNA construct containing an N-terminal SNAP tag fused to a FLAG tag were obtained from Cisbio Bioassays (Codolet, France). GLP1R mutants were generated by site-directed mutagenesis using QuikChange Lightning Site-Directed Mutagenesis Kit (Agilent Technologies, 210518) according to the manufacturer’s protocols. The non-tagged GLP1R was generated by replacing the SNAP-flag cassette and by an oligonucleotide reconstituting the N-terminal methionine residue. All constructs were verified with Eurofins sequencing.
Transfection of plasmids and siRNA
HEK293T cells were transiently transfected with plasmid DNA by the reagent JetPEI (101–10N, Polyplus, New York, NY, USA) and transfected with siRNA using INTERFERin® (101000028, Polyplus, Illkirch, FRANCE) according to the manufacturer’s instructions. INS-1 832/3 (Glp1r KO) cells were transiently transfected with Lipofectamine® LTX & Plus Reagent (15338–100, Invitrogen) according to the manufacturer’s instructions. Generally, cells were 50–70% confluent at the time of transfection. At least forty-eight hours after transfection, both HEK293T and INS-1 832/3 (Glp1r KO) cells were experimentally manipulated for all the ELISA and signaling assays. The double-stranded 5′-ACCUGCGCCUUCCGCUAUG-3′ siRNA sequence (Eurogentec) was used to simultaneously target both and , as described previously28.
Cell surface and total receptor expression
HEK293T and INS-1 832/3 (Glp1r KO) cells were transfected with GLP1R or mutant receptor cDNA construct containing an N-terminal SNAP tag fused to a FLAG tag. After 24h, the cells were seeded into 96-well white Optiplates (6005680, Perkin Elmer) and cultured overnight at 37°C in 5% CO2. To measure the surface expression, the ELISA cells were washed with 1x PBS and fixed with 2% paraformaldehyde (PFA) at room temperature for 10 min. For total receptor measurement, cells washed with 1x PBS and fixed with methanol/acetone (1: 1) at room temperature for 1 min and then additionally treated with 0.2% Triton X-100 at room temperature for 10 min. The cells are blocked over 1 hour by 3% BSA for surface expression and 3% BSA containing 0.2% Triton X-100 for total expression. Receptor expression was then measured using a rabbit anti-flag antibody (F7425, Sigma-Aldrich) and a horseradish peroxidase-conjugated rabbit immunoglobulin G (IgG) secondary antibody (Cell signaling, 7074S). Luminata™ Forte ELISA HRP substrate (ELLUF0100, Merck Millipore) was used for the reaction to generate luminescence. Luminescence was read with a Tecan Infinite M500 microplate reader (Tecan Group, Ltd., Männedorf, Switzerland). No interference of the N-terminal SNAP-flag-tag was observed as similar results were observed with the non-tagged and the SNAP-flag-tagged WT GLP1R in INS-1 823/3 (Glp1r KO) and HEK293T cells (Extended Data Fig. 3g–j).
For internalization assays cells are incubated with 100 nM exendin-4 (Bachem, Weil am Rhein, Germany) at 37°C in 5% CO2 for the indicated times. The amount of surface and total receptors were then determined by ELISA.
LUXendin Flow cytometry
12 week-old C57/BL6 (Janvier, France) male mouse islet isolation was performed as described previously29. Islets were cultured in RPMI 1640 (#61870–010, Thermo Fisher Scientific) containing 10% fetal calf serum (FCS CVFSVF00–01, Eurobio, Les Ulis, France) and penicillin/streptomycin (#15140122, ThermoFisher Scientific) at 37°C, 5% CO2. Islets were incubated with 100 nM of LUXendin12 (Celtarys CELT111), or with 10 μM Exendin-4 (Bachem, Weil am Rhein, Germany) for 1h. Islets were then dissociated in single cell suspensions using Accutase (#07922, Stemcell technologies, Vancouver, Canada). GLP1R or Mock transfected INS-1 832/3 (Glp1r KO) and HEK293T were incubated with 100 nM of LUXendin for 1h and detached with trypsin. Cell sorting was carried out using a FACSAria III (BD Bioscience). Data were analyzed using FlowJo™ Software (RRID:SCR_008520, BD Life Sciences). LUXendin-positive cells were sorted in several sequential steps as described in Supplementary Figure 1.Data were normalized by substracting background staining (Mock transfected INS-1 832/3 (Glp1r KO) and HEK293T or Exendin-4 excess (GLP1R+ beta-cells) and are expressed as Mean Fluorescent Intensity (MFI) per cell.
cAMP accumulation measurement
Ligands-mediated cAMP accumulation assays were performed using the cAMP Gi kit (62AM9PEB, Cisbio Bioassays) as previously described30. Cells transiently expressed GLP1R WT or mutants. Forty-eight hours post-transfection, cells were suspended in stimulation buffer from kit and distributed to a 384-well white ProxiPlate (6008280, Perkin Elmer) at a density of 7500 cells per well. Increasing concentration of ligands was added to cell suspension. After 30min stimulation, cAMP d2 antibody and cAMP Eu-cryptate reagent were added. After one hour of stimulation, cAMP measurements were performed in triplicates and were read in Tecan Infinite M500 microplate (Tecan Group, Ltd., Männedorf, Switzerland).
ERK activation measurement
Intracellular phospho-ERK1/2 was measured using the AlphaLISA Surefire pERK kit as described previously31 (ALSU-PERK-A500, PerkinElmer, Waltham, MA). HEK293T cells transiently expressed GLP1R WT or one of the 60 GLP1R mutants. The cells are starved overnight prior to stimulation. An increasing concentration of ligands diluted in DMEM (Invitrogen) free FBS, was added at 37°C for the indicated times to generate full concentration-response curves. Cellular lysates were generated by adding the lysis buffer. Four μl cellular lysates were transferred to a 384-well white ProxiPlate (6008280, Perkin Elmer). After the reaction mixture was added and the signal was detected using the Tecan Infinite M1000 PRO microplate reader (Tecan Group, Ltd., Männedorf, Switzerland) with excitation at 680nm (α-laser) and emission at 520–620nm.
Exendin-4 induced ERK1/2 phosphorylation kinetics was determined over 1 h. At 5min, the exendin-4-mediated pERK1/2 was maximal for HEK293T cells. Accordingly, pERK1/2 dose-response experiments were performed at 5 min. At 5 min the Gs/cAMP/PKA pathway was the predominant input pathway (Extended Data Fig. 3k–n).
Intracellular calcium mobilization measurement
Intracellular Ca2+ mobilization detected in HEK293T cells was performed as previously described. Briefly, cells were pre-incubated with the Ca2+-sensitive Fluo-4 AM (Thermo Fisher Scientific) in 37°C incubator for 1 h before measuring in the multi-mode microplate reader (FlexStation 3, Molecular Devices). The fluorescence signals (excitation at 485 nm and emission at 525 nm) were then measured for 60 s. After the first 20 s, compounds were added automatically into the plate to treat the cells. The Ca2+ response was given as the agonist-induced fluorescence increase (maximum signal after agonist addition subtracts the mean value of the first 20 s). The dependence of the Ca response on Gq/11 proteins was addressed by preincubating cells for 30 min with the Gq/11 protein specific YM-254890 inhibitor in the presence of Ex-4 (100 nM) (Extended Data Fig. 3o).
recruitment (BRET) measurement
recruitment by GLP1R at the cell surface was assessed by measuring BRET between and rGFP-CAAX (prenylation CAAX box of KRas) upon treatment of HEK 293T cells cotransfected with GLP1R. Transfected cells were plated in 96-well white Optiplates (6005680, Perkin Elmer). Forty-eight hours after transfection, cells were washed with Dulbecco’s phosphate-buffered saline, and then Tyrode’s buffer was added. After 5 min incubation with Deep blue C Coelenterazine (2.5 μM, NanoLight Technology), the cells were incubated for 5 more minutes with exendin-4 at 37°C. Then, luminescence and fluorescence were measured simultaneously using plates and were read on the Mithras LB 940 with 480 ± 10 nm (Rluc) and 540 ± 20 nm (YFP) emission filters and BRET ratios were calculated.
Insulin secretion measurement
INS-1 832/3 (Glp1r KO) cells were seeded into 24-well plates coated with poly-L-lysine hydrobromide (P6282, Sigma-Aldrich). GLP1R or one of the 60 GLP1R mutants were transfected one day after. The cultured medium was changed by fresh cultured medium 24 h prior to glucose-dependent insulin secretion. On the day of the experiment, the cells were washed three times by low-glucose (2.8 mM) Krebs Ringer buffer (2.6 mM CaCl2, 98.5 mM NaCl, 4 mM KCl, 1.2 mM KH2PO4, 1.2 mM MgSO4, 20 mM HEPES, 25.9 mM NaHCO3, 0.2% BSA, pH 7.4) and incubated for 1 h at 37°C in low-glucose (2.8 mM) Krebs Ringer buffer. The supernatant was removed, and cells were incubated for 1 h at 37°C in high-(8.3 mM) glucose Krebs Ringer buffer ± exendin-4 or GIP or semaglutide 11. The supernatant was collected and insulin concentration was measured in 10 μL using the Insulin Ultra Sensitive assay (62IN2PEG, Cisbio Bioassays). According to the manufacturer’s instructions, supernatant, insulin Eu3+ Cryptate antibody and insulin XL665 antibody were distributed in a 384-well microplate (6007290, Perkin Elmer). After 24 hours incubation, the signal was read in Tecan Infinite M500 microplate (Tecan Group, Ltd., Männedorf, Switzerland).
TR-FRET-based ligand competition binding measurement
The affinity of GLP1R WT and GLP1R mutants for exendin-4 were determined by TR-FRET-based ligand competitive binding assay. Forty-eight hours post-transfection, HEK293T cells expressing SNAP-GLP1R WT or mutants were immediately placed on the ice to avoid the rapid receptor internalization. After washes, the cells were incubated with substrate (100 nM) conjugated to the long-lived fluorophore Terbium cryptate (Tb; Lumi4-Tb, SSNPTBX, Cisbio Bioassays) in Tag-lite labeling medium (1 h, on ice, LABMED, Cisbio Bioassays). After several washes, cells were dissociated by enzyme-free cell dissociation buffer (C5789; Sigma-Aldrich) and resuspended in Tag-lite buffer. The cells are distributed into a 384-well plate, whose then were used to detect fluorescence signal at 620 nm for verification of the efficiency of fluorescent labeling of SNAP. An increasing concentration of exendin-4 was incubated with cells in the presence or absence of the exendin-4 derivative labeled with a red-emitting HTRF fluorescent probe (L0030RED, Cisbio Bioassays) at final reaction volume of 14 μL. The incubation last two hours at room temperature and the TR-FRET signal was read in the Tecan Infinite M500 microplate reader (Tecan Group, Ltd., Männedorf, Switzerland) following settings: excitation at 340 nm (Tb, energy donor), emission at 665 nm (d2, acceptor); and 620 nm (donor); delay of 150 μs; and integration time of 500μs. Data is expressed as TR-FRET ratio (acceptor/donor) or normalized as % when indicated (maximal TR-FRET ratio = 100%, non-specific binding = 0%).
Western blotting
HEK293T cells were seeded in 6-well plates and transiently expressed GLP1R and silenced by using siRNA targeting both and according to the manufacturer’s instructions. The cells were then washed with PBS carefully. Lysis buffer composed of 62.5mM Tris/HCl pH 6.8, 5% SDS, 10% glycerol, 0.005% bromophenol blue are applied to denature proteins in cells over 2 hours. Samples were then sonicated for 5s, three times, and heated for 5 min at 95 °C. Denatured protein samples were resolved in SDS-PAGE and then transferred to nitrocellulose membranes. The immunoblottings were carried out with primary antibodies against the Flag tag (F7425, Sigma-Aldrich) and (4674, Cell Signaling Technology). Immunoreactivity was revealed using a secondary antibody coupled to 680 or 800 nm fluorophores (LI-COR Biosciences, Lincoln, NE, USA), and readings were performed with the Odyssey LI-COR infrared fluorescent scanner (LI-COR Biosciences).
NMF/K-mean Clustering Analysis
To characterize the phenotypic effects of the GLP1R mutants, we applied the Non-Negative Matrix Factorization (NMF) and K-means clustering analysis described in 27. Among the 60 mutants tested on GLP1R, four mutants (p.H180Y, p.N320Y, p.G361R, and p. I400R) were excluded because their experimental data were undetectable. To initiate the clustering, an input matrix was generated with 56 mutants and 4 different signaling pathways (, Ca2+, cAMP, and ERK) measured by 3 parameters each (, , and ), which resulted in matrix size of 56 × 12. To establish the robustness of the results, experimental errors were propagated by iteratively sampling values within one standard deviation of the mean of the phenotypic measurement. This generated a background of 300 input matrices that were independently processed by NMF/K-mean clustering. Before applying the clustering algorithm, each phenotypic measurement was normalized against WT:
| (1), |
where indicates the phenotypic measurement on mutant , and indicates wild type values on the phenotypic measurement. Therefore, each value ranged from 0 to 2, where 1 indicates an activity similar to WT. NMF was performed in the normalized matrix from sklearn.decomposition package in python to reduce dimensionality [K (basis factor) x H (number of mutants)]. We applied K-means analysis to the result of dimension reduction, using the sklearn.cluster package in python, across to , where is basis factor for NMF and the number of clusters for K-means (KNMF=KKmean). For each input matrix, NMF/K-means was iteratively applied 300 times. Thus, the final clustering frequency was determined by averaging 90,000 outcomes (300 input matrix times 300 clustering iteration) and converted into Euclidean distance matrix, using the scipy.cluster package in python.
Evolutionary Action Scores
The Evolutionary Action (EA) of a mutation is computed with an equation 7:
| (2), |
where is a fitness function that maps genotypes, , to phenotypes, , so that we may write . In practice, Eqn 2 can be computed by estimating as the magnitude of a mutation from evolutionary odds matrices of amino acid substitutions, and estimating , which as the gradient of the evolutionary function represent the functional sensitivity to mutations at each sequence positions, with the Evolutionary Trace 8. The result is the EA, , which varies continuously from 0 (a neutral mutation with no fitness effect) to 100 (a maximally deleterious mutation that causes a functional knockout). EA scores below 30 tend to be harmless, but tend to impact function progressively more above that threshold. The GLP1R mutants EA scores were given from http://eaction.lichtargelab.org/eaction. To evaluate EA score prediction with the experimental data, phenotypic score was calculated thus:
Statistical analysis
Statistical analyses for genetic association studies.
In UK Biobank, the rare variants were analyzed as single clusters using the mixed-effects score test (MiST) method (Sun, J., Zheng, Y. & Hsu, L. A unified mixed-effects model for rare-variant association in sequencing studies. Genet. Epidemiol. 37, 334–344 (2013)). MiST provides a score statistic for the mean effect of the cluster, and a score statistic for the heterogeneous effect of the cluster. Let the equation of the model be: , where Y is the trait of interest, X is the matrix of covariates (i.e. age, sex, body mass index [BMI], ancestry [i.e. PC1 to PC5; field #22009] for assessing diastolic blood pressure, systolic blood pressure, high-density lipoprotein, low-density lipropretin and age, sex, ancestry for assessing BMI and glycated hemoglobin A1c), G is the matrix of OPRD1 variants and is a vector of ones repeated times, with the number of rare OPRD1 variants, leading to: . BMI was log-transformed before analysis. As none of the association studies had significant heterogeneity, we only showed the P-values associated with the mean effect of the cluster. These statistical analyses were performed using R software (v4.0.2).
The surface and total expression determined by ELISA.
All values are expressed as means ± SEM of at least three independent experiments. Statistical significance of differences was determined by one-way analysis of variance and Dunnett’s post-test.
Insulin secretion measurement.
The agonist-induced response for every GLP1R mutant was normalized to its glucose control (set at 1). The fold ratio is expressed as means ± SEM of at least three independent experiments and compared to the WT receptor in parallel with the receptor mutant. Statistical significance of differences was determined by one-way analysis of variance and Dunnett’s post-test. is defined as the log of the concentration of initiating half of the maximal response was determined by nonlinear regression with a variable Hill slope using GraphPad Prism software (version 7.0).
TR-FRET-based ligand competition binding measurement.
is defined as the log of the concentration of red-emitting Ex-4 that results in half-way of decreasing of Ex-4 binding. was determined by nonlinear regression with a variable Hill slope using GraphPad Prism software (version 7.0). is expressed as means ± SEM of at least three independent experiments. The data were analyzed by comparing independent fits with a global fit that shares the selected parameter and by two-way analysis of variance and Sidak post-test.
cAMP accumulation, ERK activation, Ca2+ mobilization and recruitment measurement.
Agonist-induced is defined as the maximal response generated by agonists. , and agonist-induced values were determined by nonlinear regression with a variable Hill slope using GraphPad Prism software (version 7.0).
For these assays, the agonist-induced value for every GLP1R mutant was normalized as a percentage of the maximal Ex-4 stimulated response of the WT receptor (set at 100) monitored in parallel with the receptor mutant. and agonist-induced are expressed as means ± SEM of at least three independent experiments. The data were analyzed by comparing independent fits with a global fit that shares the selected parameter and by two-way analysis of variance and Sidak post-test. The concentration-response curves were fitted to an operational model of agonism designed by Kenakin and Christopoulos 32, 33 to obtain values for the WT receptor and its mutants. Normally, an agonist is set as a reference agonist, against which within pathway comparisons for the same receptor to other agonists can be made and expressed as . Here, withinpathway comparisons were made between GLP1R mutants and the WT receptor. Normalized difference was calculated on values corresponding to agonist-induced , and to fit a −1 to +1 scale using the following formula: (mutant – WT)/(mutant + WT). In the case of , before normalization, the antilogs were first calculated and then were fitted to the following formula: (mutant – WT)/(mutant + WT). Positive and negative values represent mutations with better or worst responses, respectively than those of the WT receptor. Subsequently, values were expressed as means ± SEM of the indicated number of experiments (n). Statistical analysis for ratios was performed by one-sample t test to examine the mean differences between WT GLP1R and its mutants.
All the correlation studies are analyzed by linear regression and define R2 using GraphPad Prism software (version 7.0). The statistical significance of differences was determined by linear regression.
Further information and requests for resources and reagents should be directed to and will be fulfilled by the Lead Contact, Ralf Jockers (ralf.jockers@inserm.fr)
Extended Data
Extended Data Fig. 1. Evolutionary action analysis of GLP1R variants.
a, Evolutionary Action (EA) scores were calculated for the 132 indicated GLP1R variants from the general database. EA scores range from 0 to 100, with a score of 0 (light blue) predicted as benign and a score of 100 (dark blue) predicted as highly impactful or detrimental to protein function. Variants selected for functional profiling are highlighted in bold. b, EA scores were calculated for 26 indicated GLP1R variants obtained from the RaDiO study.
Extended Data Fig. 2. Expression analysis of WT and mutant GLP1R monitored by ELISA and LUXendin binding.
a-e, FACS-sorting of intact mouse ß-cells expressing endogenous GLP1R (a), of INS-1 823/3 (Glp1r KO) cells expressing SNAP-flag-tagged WT GLP1R (b), or of HEK293T cells expressing SNAP-flag-tagged WT GLP1R (c), after fluorescent LUXendin binding (100 nM). Specificity LUXendin binding was determined in the presence of an excess of Ex-4 (10 μM) in ß-cells (a) and by mock transfection in INS-1 823/3 (Glp1r KO) and HEK293T cells (b,c). Functional WT-GLP1R expression was monitored in parallel by determining Ex-4-induced cAMP production (a-c). d, Quantification of LUXendin binding of panels a-c (see Methods for more details). e, Quantification of LUXendin binding to non-tagged vs. SNAP-flag-tagged WT GLP1R in INS-1 823/3 (Glp1r KO) and HEK293T cells. f-h, Surface (Sur) and total (To) expression of SNAP-flag-tagged GLP1R in HEK293T and INS-1 823/3 (Glp1r KO) cells determined by ELISA. (f) Expression of WT and mutant GLP1R in INS-1 823/3 (Glp1r KO) cells. Surface expression is shown at X-axis, total receptor expression as color gradient and the Sur/To ratio as size of the bubble. Statistical significance of differences (compared with WT GLP1R) was determined by one-way analysis of variance and Dunnett’s post-test. Sur: *P < 0.05, **P < 0.01, ***P < 0.0001; Tot: (a) P < 0.05, (b) P < 0.01, (c) P < 0.0001. (g-h) Comparison of the total expression of mutants in HEK293T and INS-1 823/3 (Glp1r KO) cells. Statistical significance of differences between two cell types was determined by two-way analysis of variance and Sidak’s multiple comparisons test *P < 0.05, **P < 0.01. 3–5 technical replicates of 3–13 independent biological replicates for each mutant; each mutant expressed as % WT. Ex-4, Exendin-4; MFI, Mean Fluorescent Intensity. See also Fig. 1c,d for complete data set.
Extended Data Fig. 3. Signaling pathways activated by WT GLP1R in HEK293 cells.
a-f, Ex-4 concentration-response curves for cAMP accumulation (a), Ca2+ mobilization (b), recruitment (d) and ERK activation (f) of SNAP-flag-tagged WT GLP1R. Kinetics of recruitment (c) and ERK activation (e). g-j, comparison of signaling of non-tagged vs. SNAP-flag-tagged WT GLP1R. k-n, At 5 minutes, the ERK1/2 activation was fully blocked by the PKA inhibitor H89 (1h preincubation) (k) but not by silencing (72 hours prior to Ex-4) (i) indicating that the Gs/cAMP/PKA pathway is the predominant input pathway at 5 minutes of Ex-4 (100 nM) stimulation in HEK293T cells. Representative Western blots showing knockdown of , and similar Flag-GLP1R expression levels in samples (m). Quantification of panel m (n). o, Effect of the Gq/11 protein inhibitor YM-254890 (30 min preincubation) on Ex-4 (100 nM) stimulated Ca2+ mobilization. 3–5 technical replicates of at least 3 independent biological replicates for each experiment. All values are means ± SEM of at least three independent experiments. Statistical significance of differences was determined by one-way analysis of variance and Dunnett’s post-test (*P < 0.05, **P < 0.01). Ex-4, Exendin-4; Sema, Semaglutide; , ; pERK, phosphorylation of ERK, Ctrl, control; AU, arbitrary Unit.
Extended Data Fig. 4. Correlations between signaling parameters of cAMP production and cell surface expression and comparison of GLP-1 vs. Ex-4 in HEK293 cells.
a, Ex-4 concentration-response curves for cAMP accumulation at different quantities of cell surface expressed WT GLP1R. 100% refers to transfection of 50 ng WT GLP1R plasmid. b,c, Correlation of (b) and (c) of cAMP accumulation with cell surface expression of WT GLP1R. Inset: 0 to 15% cell surface expression range. d, Surface expression of WT and mutant GLP1R. Ctrl-1=50 ng and Ctrl-2=1 ng of WT GLP1R plasmid to match the low expression of some mutants. e,f, Ex-4 and GLP-1 concentration-response curves of cAMP accumulation at Ctrl-1 and Ctrl-2 WT GLP1R conditions. Inset: response at Ctrl-2 condition. g, p values of panels e-f. h-k, Ex-4 (h) and GLP-1 (i) concentration-response curves of mutant GLP1R compared to WT GLP1R at Ctrl-2 conditions. p.H180Y, p.N320Y, p.G361R and p.I400R are complete loss-of-function (LoF) mutants for this pathway when stimulated with Ex-4 (h) or GLP-1 (i). p.H173P and p.R176R show a residual response and were classified as severely defective with similar results for Ex-4 (j) and GLP-1 (k) confirming the physiological relevance of this result. All values are means ± SEM of at least three independent experiments. Ctrl, control; Exp, expression; Ex-4, Exendin-4.
Extended Data Fig. 5. Correlations between signaling parameters of Ca2+ mobilization, ERK activation, recruitment and cell surface expression in HEK293T cells.
a-i, Different amounts of WT GLP1R were expressed in HEK293T cells and Ex-4 concentration-response curves were generated for Ca2+ mobilization (a), ERK1/2 activation (d), and recruitment (g) and calculated (b, e, h) and (c, f, i) values correlated with surface expression. These correlation curves allowed us to determine the signaling parameters ( and ) of receptor mutants at matched WT GLP1R expression levels. 100% surface expression refers to transfection of 50 ng of WT GLP1R plasmid. All values are means ± SEM of at least three independent experiments. Exp, expression; Ctrl, control; Ex-4, Exendin-4.
Extended Data Fig. 6. Extended version of the functional profiles of GLP1R mutants in HEK293T cells.
Ex-4 concentration-response curves were generated for cAMP production, Ca2+ mobilization, ERK activation, and recruitment of mutant GLP1R in HEK293T cells and organized in eight categories: Severely surface expression defective (a), all pathways defective (b), Two or three pathways defective (c), specific defect (d), ERK specific defect (e), cAMP Gain of function (f), Ca2+ Gain of function (g) Wild-type like (h). The radial graph of each mutant is shown on the right. Solid lines with filled circles correspond to the mutant GLP1R and dotted lines with open circles correspond to the WT GLP1R monitored in parallel with the mutant receptors in each experiment. For radial graphs, compare with WT GLP1R (set as zero), values of mutants ranged from −1 to +1, where 0 to +1 represent enhanced properties, and 0 to −1 means impaired properties. Data were plotted using nonlinear regression with a variable Hill slope. All values are means ± SEM of 2-3 technical replicates of 3-8 independent biological replicates for each mutant. Exp, expression Ex-4, Exendin-4; , . See also Fig. 2 and Supplementary tables 2,3 for complete data sets.
Extended Data Fig. 7. Affinity of Ex-4 for WT and mutant GLP1R with modified values in functional assays determined in TAG-LITE® GLP1 receptor competition binding experiments.
All values are expressed as means ± SEM of at least three independent experiments. ND refers to ‘no detectable binding’. The cumulative for the WT GLP1R. The data were analyzed by comparing independent fits with a global fit that share the selected parameter (#). *P < 0.05, **P < 0.01, ***P < 0.0001.
Extended Data Fig. 8. Correlations between experimentally determined phenotypic score and different predictive scores.
We calculated the predicted scores by using 5 different scoring algorithms including EA (a), REVEL (b), CADD (c), MutationAssessor (d), SIFT (e), and PolyPhen2 (f), and correlated them with the experimentally obtained phenotypic scores.
Extended Data Fig. 9. Association between rare deleterious GLP1R variants and metabolic traits in the UK Biobank.
, -arrestin2; BMI, body mass index; DBP, diastolic blood pressure; HbA1c, glycated hemoglobin A1C; HDL, high-density lipoprotein; LDL, low-density lipoprotein; SBP, systolic blood pressure; SE, standard error.
Extended Data Fig. 10. cAMP production and insulin secretion activated by WT and mutant GLP1R in INS-1 823/3 (Glp1r KO) cells.
a,b, Semaglutide concentration-response curves for cAMP accumulation (a) and insulin secretion (b) induced by SNAP-flag-tagged WT GLP1R. (c-i) Ex-4 response in cells expressing mutants with (c-f), defective recruitment and (g-i), gain-of-function phenotype. Responses are normalized to glucose-induced insulin secretion in the absence of Ex-4. Responses are normalized to glucose-induced insulin secretion in the absence of Ex-4. All values are means ± SEM of at least three independent experiments. Statistical significance of differences (compared with control) was determined by one-way analysis of variance and Dunnett’s post-test *P < 0.05, **P < 0.01, ***P < 0.0001. Ex-4, Exendin-4; G-ctrl, glucose control.
Supplementary Material
ACKNOWLEDGMENTS
We thank Dr. J Naylor (Cambridge, UK) for kindly providing INS-1 832/3 (GLP1R KO) cells and Dr. Mark Scott for giving advice for the selection of selective siRNA sequences. This work was supported by the Fondation de la Recherche Médicale (jfliu@mail.hust.edu.cn), Agence Nationale de la Recherche (ANR-2011-BSV1–012-01 “MLT2D”, ANR-2011-META “MELA-BETES, ANR-21-CE18-0023 “alloGLP1R”), Institut National de la Santé et de la Recherche Médicale (INSERM), Centre National de la Recherche Scientifique (CNRS) and the “Who am I?” laboratory of excellence No.ANR-11-LABX-0071 funded by the French Government through its “Investments for the Future” program operated by The French National Research Agency under grant No.ANR-11-IDEX-0005-01. This work was supported by grants from the Ministry of Science and Technology (grant number 2018YFA0507003 and 2021ZD0203302 to J. L.), the National Natural Science Foundation of China (NSFC) (grant numbers 81720108031, 81872945 and 31721002 to J. L.). This research has been conducted using the UK Biobank Application #67575. This study was further funded by the French National Research Agency (ANR-10-LABX-46 [European Genomics Institute for Diabetes]), the French National Research Agency (ANR-10-EQPX-07-01 [LIGAN-PM]), the European Research Council (ERC GEPIDIAB – 294785; ERC Reg-Seq – 715575), “France Génomique” consortium (ANR-10-INBS-009) and the National Center for Precision Diabetic Medicine - PreciDIAB, which is jointly supported by the French National Agency for Research (ANR-18-IBHU-0001), by the European Union (FEDER), by the Hauts-de-France Regional Council and by the European Metropolis of Lille (MEL). O.L. gratefully acknowledges support from NIH GM066099. W.G. was supported by a doctoral fellowship from the Chinese Scholarship Council (China).
Footnotes
DECLARATION OF INTERESTS
The authors declare no competing interes
REFERENCES
- 1.Muller TD, et al. Glucagon-like peptide 1 (GLP-1). Mol Metab 30, 72–130 (2019). [DOI] [PMC free article] [PubMed] [Google Scholar]
- 2.Graaf C, et al. Glucagon-Like Peptide-1 and Its Class B G Protein-Coupled Receptors: A Long March to Therapeutic Successes. Pharmacol Rev 68, 954–1013 (2016). [DOI] [PMC free article] [PubMed] [Google Scholar]
- 3.Zhang Y, et al. Cryo-EM structure of the activated GLP-1 receptor in complex with a G protein. Nature 546, 248–253 (2017). [DOI] [PMC free article] [PubMed] [Google Scholar]
- 4.Koole C, et al. Polymorphism and ligand dependent changes in human glucagon-like peptide-1 receptor (GLP-1R) function: allosteric rescue of loss of function mutation. Mol Pharmacol 80, 486–497 (2011). [DOI] [PMC free article] [PubMed] [Google Scholar]
- 5.Koole C, Savage EE, Christopoulos A, Miller LJ, Sexton PM, Wootten D. Minireview: Signal bias, allosterism, and polymorphic variation at the GLP-1R: implications for drug discovery. Mol Endocrinol 27, 1234–1244 (2013). [DOI] [PMC free article] [PubMed] [Google Scholar]
- 6.Liu T, Ji RL, Tao YX. Naturally occurring mutations in G protein-coupled receptors associated with obesity and type 2 diabetes mellitus. Pharmacol Ther 234, 108044 (2022). [DOI] [PubMed] [Google Scholar]
- 7.Katsonis P, Lichtarge O. A formal perturbation equation between genotype and phenotype determines the Evolutionary Action of protein-coding variations on fitness. Genome Res 24, 2050–2058 (2014). [DOI] [PMC free article] [PubMed] [Google Scholar]
- 8.Lichtarge O, Bourne HR, Cohen FE. An evolutionary trace method defines binding surfaces common to protein families. J Mol Biol 257, 342–358 (1996). [DOI] [PubMed] [Google Scholar]
- 9.Wootten D, et al. The Extracellular Surface of the GLP-1 Receptor Is a Molecular Trigger for Biased Agonism. Cell 165, 1632–1643 (2016). [DOI] [PMC free article] [PubMed] [Google Scholar]
- 10.Bonnefond A, et al. Pathogenic variants in actionable MODY genes are associated with type 2 diabetes. Nat Metab 2, 1126–1134 (2020). [DOI] [PubMed] [Google Scholar]
- 11.Naylor J, et al. Use of CRISPR/Cas9-engineered INS-1 pancreatic beta cells to define the pharmacology of dual GIPR/GLP-1R agonists. Biochem J 473, 2881–2891 (2016). [DOI] [PubMed] [Google Scholar]
- 12.Ast J, et al. Super-resolution microscopy compatible fluorescent probes reveal endogenous glucagon-like peptide-1 receptor distribution and dynamics. Nat Commun 11, 467 (2020). [DOI] [PMC free article] [PubMed] [Google Scholar]
- 13.Bonnefond A, et al. Rare MTNR1B variants impairing melatonin receptor 1B function contribute to type 2 diabetes. Nat Genet 44, 297–301 (2012). [DOI] [PMC free article] [PubMed] [Google Scholar]
- 14.Karamitri A, et al. Type 2 diabetes-associated variants of the MT(2) melatonin receptor affect distinct modes of signaling. Sci Signal 11, (2018). [DOI] [PubMed] [Google Scholar]
- 15.Folon L, et al. Contribution of heterozygous PCSK1 variants to obesity and implications for precision medicine: a case-control study. Lancet Diabetes Endocrinol 11, 182–190 (2023). [DOI] [PubMed] [Google Scholar]
- 16.Jones B, et al. Targeting GLP-1 receptor trafficking to improve agonist efficacy. Nat Commun 9, 1602 (2018). [DOI] [PMC free article] [PubMed] [Google Scholar]
- 17.Kushner RF, et al. Semaglutide 2.4 mg for the Treatment of Obesity: Key Elements of the STEP Trials 1 to 5. Obesity (Silver Spring) 28, 1050–1061 (2020). [DOI] [PMC free article] [PubMed] [Google Scholar]
- 18.Knudsen LB, et al. Small-molecule agonists for the glucagon-like peptide 1 receptor. Proc Natl Acad Sci U S A 104, 937–942 (2007). [DOI] [PMC free article] [PubMed] [Google Scholar]
- 19.Koole C, et al. Allosteric ligands of the glucagon-like peptide 1 receptor (GLP-1R) differentially modulate endogenous and exogenous peptide responses in a pathway-selective manner: implications for drug screening. Mol Pharmacol 78, 456–465 (2010). [DOI] [PMC free article] [PubMed] [Google Scholar]
- 20.Wootten D, et al. Differential activation and modulation of the glucagon-like peptide-1 receptor by small molecule ligands. Mol Pharmacol 83, 822–834 (2013). [DOI] [PubMed] [Google Scholar]
- 21.Rosenstock J, et al. Efficacy and safety of a novel dual GIP and GLP-1 receptor agonist tirzepatide in patients with type 2 diabetes (SURPASS-1): a double-blind, randomised, phase 3 trial. Lancet 398, 143–155 (2021). [DOI] [PubMed] [Google Scholar]
- 22.Malik F, Li Z. Non-peptide agonists and positive allosteric modulators of glucagon-like peptide-1 receptors: Alternative approaches for treatment of Type 2 diabetes. Br J Pharmacol 179, 511–525 (2022). [DOI] [PMC free article] [PubMed] [Google Scholar]
- 23.Bueno AB, et al. Structural insights into probe-dependent positive allosterism of the GLP-1 receptor. Nat Chem Biol 16, 1105–1110 (2020). [DOI] [PubMed] [Google Scholar]
- 24.Jones B The therapeutic potential of GLP-1 receptor biased agonism. Br J Pharmacol 179, 492–510 (2022). [DOI] [PMC free article] [PubMed] [Google Scholar]
- 25.Sonoda N, Imamura T, Yoshizaki T, Babendure JL, Lu JC, Olefsky JM. Beta-Arrestin-1 mediates glucagon-like peptide-1 signaling to insulin secretion in cultured pancreatic beta cells. Proc Natl Acad Sci U S A 105, 6614–6619 (2008). [DOI] [PMC free article] [PubMed] [Google Scholar]
- 26.Quoyer J, et al. GLP-1 mediates antiapoptotic effect by phosphorylating Bad through a beta-arrestin 1-mediated ERK1/2 activation in pancreatic beta-cells. J Biol Chem 285, 1989–2002 (2010). [DOI] [PMC free article] [PubMed] [Google Scholar]
- 27.Schonegge AM, et al. Evolutionary action and structural basis of the allosteric switch controlling beta(2)AR functional selectivity. Nat Commun 8, 2169 (2017). [DOI] [PMC free article] [PubMed] [Google Scholar]
- 28.Lima-Fernandes E, et al. Distinct functional outputs of PTEN signalling are controlled by dynamic association with beta-arrestins. EMBO J 30, 2557–2568 (2011). [DOI] [PMC free article] [PubMed] [Google Scholar]
- 29.Berthault C, Staels W, Scharfmann R. Purification of pancreatic endocrine subsets reveals increased iron metabolism in beta cells. Mol Metab 42, 101060 (2020). [DOI] [PMC free article] [PubMed] [Google Scholar]
- 30.Guillaume JL, et al. The PDZ protein mupp1 promotes Gi coupling and signaling of the Mt1 melatonin receptor. J Biol Chem 283, 16762–16771 (2008). [DOI] [PubMed] [Google Scholar]
- 31.Chen M, et al. Melatonin MT(1) and MT(2) receptor ERK signaling is differentially dependent on G(i/o) and G(q/11) proteins. J Pineal Res 68, e12641 (2020). [DOI] [PubMed] [Google Scholar]
- 32.Kenakin T New concepts in pharmacological efficacy at 7TM receptors: IUPHAR review 2. Br J Pharmacol 168, 554–575 (2013). [DOI] [PMC free article] [PubMed] [Google Scholar]
- 33.Cecon E, Oishi A, Jockers R. Melatonin receptors: molecular pharmacology and signalling in the context of system bias. Br J Pharmacol 175, 3263–3280 (2018). [DOI] [PMC free article] [PubMed] [Google Scholar]
Associated Data
This section collects any data citations, data availability statements, or supplementary materials included in this article.


