Abstract
Acute myeloid leukemia (AML) is a malignant blood disorder and the most common type of acute leukemia in adults. Notwithstanding the plethora of therapeutic modalities, a significant cohort of patients fail to respond to treatment and experience relapse. Anoikis, a distinct modality of programmed cell death, has been linked to cancer progression. However, the prognostic significance of anoikis in AML remains unclear. In this study, a non-negative matrix factorization algorithm was utilized to efficiently reduce the dimensions of merged datasets. We used differential analysis, weighted gene co-expression network analysis (WGCNA), univariate Cox regression, and least absolute shrinkage and selection operator (LASSO) regression to identify genes associated with prognosis and develop a risk scoring model. Immunohistochemistry was conducted to assess the expression levels of key genes in clinical samples. The association between risk score and the tumor microenvironment (TME), stemness, clinical characteristics, and immunotherapy was evaluated. We identified 41 AML anoikis-related genes (ANRGs) related to survival, and seven genes were chosen to develop prognostic models. The prognostic risk score combined with the clinical and pathological features of AML was used to develop a nomogram, and decision curve analysis demonstrated the net clinical benefit of the model. Furthermore, analysis of ANRGs revealed that PDGFRB inhibition significantly reduced the proliferation of AML cells, promoted apoptosis, and inhibited AML progression both in vitro and in vivo, indicating that PDGFRB plays a crucial role in AML development.
Keywords: Acute myeloblastic leukemia, anoikis, PDGFRB, prognosis, immunotherapy
Introduction
Acute myeloid leukemia (AML) is a genetically diverse clonal disorder of hematopoietic stem cells characterized by high relapse and mortality rates [1,2]. The treatment paradigms for AML were developed decades ago, resulting in a long-term disease-free survival rate of only approximately 30-40% following standard chemotherapy [3]. Given the limited therapeutic arsenal, with treatment primarily reliant on standard cytarabine and anthracyclines, disease persistence or recurrence is common among patients with AML [4]. Patients with recurrence or refractory AML have a poor prognosis, with overall survival (OS) of less than 10% after three years [5,6]. Therefore, identifying new biomarkers for predicting the prognosis of patients with early-stage AML is crucial to enable timely clinical interventions to delay disease progression.
Anoikis results from the disruption of cell-to-cell or cell-ECM attachment and presents a distinct type of programmed apoptosis that is essential for maintaining tissue equilibrium by eliminating misplaced or dislodged cells [7,8]. Anoikis is primarily initiated by the interaction of two key apoptotic pathways: mitochondrial interference and the activation of cellular death receptors [9]. Anoikis, originally observed in the epithelial and endothelial cells, has emerged as a crucial determinant of cancer invasion and metastasis [10]. Anoikis resistance enables unanchored cells to bypass death-inducing signals, thereby facilitating their survival in adverse environments [11,12]. Although ANRGs are recognized to significantly influence tumor development and progression, there is a paucity of studies systematically assessing the implications of anoikis in AML.
In this study, we explored the prognostic significance of ANRGs in AML and devised a prognostic scoring model utilizing these genes. Furthermore, we explored the variations in the TME based on risk stratification. The exploration of ANRG expression patterns not only enhances our understanding of AML but also aids in crafting highly personalized and accurate therapeutic strategies.
Materials and methods
Data collection
From The Cancer Genome Atlas (TCGA-AML), we sourced RNA-seq transcriptome data along with pertinent clinical details such as sex, age, subtype, and survival. Data on somatic mutations and copy number variations (CNVs) were extracted from TCGA. A collection of 41 ANRGs was obtained from the GSEA portal.
Characteristics of ANRGs
Initially, we probed the interrelations among diverse ANRGs. We also investigated the prevalence of somatic mutations, genetic loci, and CNVs in ANRGs. Furthermore, we examined the expression profiles of 41 ANRGs across various AML subtypes. Using the GlioVis datasets, we conducted a univariate Cox regression analysis on 31 ANRGs, subsequently illustrating the findings through forest plots.
Consensus clustering
Consensus clustering was employed to detect distinct patterns of ANRG expression by utilizing the k-means method to analyze the expression of anoikis regulators. Subsequently, uniform manifold approximation and projection (UMAP) was employed to verify the clustering results, implemented using the R package “ggplot2”.
Developing and validating prognostic signatures utilizing ANRGs
We conducted univariate Cox regression analysis to identify genes linked to survival, followed by least absolute shrinkage and selection operator (LASSO) regression analysis with the R package “glmnet”. The penalty regularization parameter λ was established through tenfold cross-validation. Subsequently, a multiple-variable Cox regression model was employed to identify key genes and calculate their respective coefficients. Kaplan-Meier (K-M) and time-dependent receiver operating characteristic (ROC) curve analyses were utilized to assess the predictive capability of the models.
Exploring the correlation between risk score and immune cell infiltration
The relative densities of the infiltrative immune cells were calculated using CIBERSORT and ssGSEA. We employed CIBERSORT to estimate the proportions of immune cell types in both low- and high-risk factions, and each sample contained scores for all discernible immune cell types. Spearman’s rank correlation analysis was used to assess the correlation between risk score metrics and immune cell infiltration.
Construction and evaluation of a predictive nomogram
A nomogram incorporating clinicopathological features and risk scores was created, an internal calibration plot was generated to assess the accuracy, and the time-C index was employed to validate the prognostic effectiveness of the nomogram. DCA was used to evaluate net clinical benefit [13].
Tumor immune single-cell hub database
The tumor immune single-cell hub is a comprehensive online repository dedicated to scRNA-seq, centered on the tumor microenvironment (TME) [14]. This database was used to systematically explore the TME heterogeneity across diverse datasets and cell types.
RNA extraction and quantitative real-time PCR (qRT-PCR)
Plasma specimens were procured from 60 patients with AML, along with negative controls (Control) and patients in complete remission (CR). This study was approved by the Ethics Committee of our hospital. Total RNA was extracted from plasma specimens or cells using the TRIzol reagent (Invitrogen, USA). cDNA synthesis was performed using HiScript II (Vazyme, China), followed by qRT-PCR on an AB7300 thermocycler (Applied Biosystems, USA) with primers sourced from Sango Biotech, China. GAPDH served as endogenous control, with relative expression magnitudes determined via the 2-ΔΔCT method. The following primers were used in this study: PDGFRB F: 5’-GCCACACTCCTTGCCCTTTAAG-3’; R: 5’-CTCACAGACTCAATCACCTTCCATC-3’. GAPDH F: 5’-GGACGCATTGGTCGTCTGG-3’; R: 5’-TTTGCACTGGTACGTGTTGAT-3’.
PDGFRB siRNA#-1: CACCATTCCATGCCGAGTAAC; siRNA#-2: CCAAAGGAGGACCCATCTATA.
Cell culture
HS-5, HL-60, and MOLM-13 cells were obtained from ATCC (Manassas, VA, USA). AML cells were cultured in RPMI-1640 medium (Gibco, USA) supplemented with 10% FBS (Gibco) in a humidified incubator with 5% CO2.
Cell proliferation assay and flow cytometry
Cell proliferation was evaluated using the CCK-8 assays. After incubation with EdU working solution (10 μM) for 2 h, the cells were treated with 4% paraformaldehyde for 15 min Subsequently, the 10-min immersion in 0.3% Triton X-100 in PBS was performed. After incubation, the cells were treated with a click reaction solution for 30 min in the dark. Subsequently, images were acquired using a fluorescence microscope (Nikon, Tokyo, Japan) and analyzed with ImageJ. CCK-8 and Annexin V-FITC apoptosis assay kits to ascertain cellular viability and apoptosis. The proportion of apoptotic cells was assessed via flow cytometry analysis.
Protein extraction and western blot
Protein extraction and Western blotting were conducted using previously established methods. Antibodies were as follows: PDGFRB (1:1,000; CST) and GAPDH (1:5,000; Origene). An electrochemiluminescence (ECL) system was used to visualize the protein bands, and ImageJ software was employed to measure the grayscale values. This approach allowed for the assessment of relative protein levels, which were then normalized to GAPDH for accurate quantification.
Mouse experiments
To establish xenograft models, 6-week-old female NSG mice were acclimated to a specific pathogen-free facility for a week. Subsequently, MOLM-13 cells (1×10⁷ cells, 0.1 mL PBS) were injected subcutaneously into NSG mice. When the tumor volume was approximately 150 mm3, the mice were randomly classified into three groups: control, si-NC, and si-PDGFRB, with four mice allocated per group. Cholesterol-conjugated si-NC or si-PDGFRB (50 nmol) was administered via intratumoral injection in both groups, three times a week for two weeks. The control mice were injected with 150 μL of PBS. All animals were slaughtered, and the tumor volume was determined using the following equation: V (volume) = (length width2)/2; extracted and imaged tumor tissue. The tumors were then extracted for histopathological analysis.
Statistical analysis
Statistical analyses were performed using R software version 4.1.3, and the data are presented as mean ± standard deviation. Student’s t-test was employed for comparing two groups, whereas one-way analysis of variance (ANOVA) was utilized for comparing groups of three or more. Statistical significance was defined as P < 0.05.
Results
ANRGs expression and genetic variants in AML
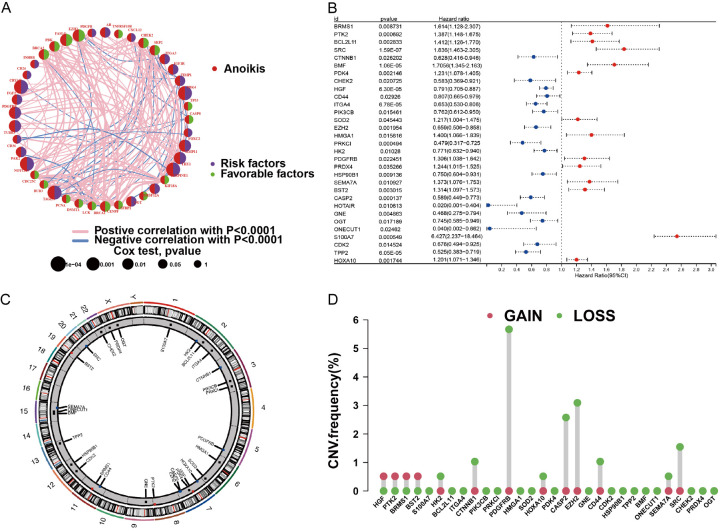
Forty-one patients with ANRGs were included in this study. A network plot was constructed to provide a comprehensive overview of the complex interactions between ANRGs and their prognostic value in AML (Figure 1A). The forest plot underscores 31 ANRGs, of which 14 were correlated with an adverse prognosis (Figure 1B). We procured CNV data from the TCGA repository to delve into the chromosomal modifications and positioning of these ANRGs (Figure 1C, 1D). As shown in Figure 1D, the predominant amplified alterations for HGF, PTK2, BRMS1, and BST2 were located on chromosomes 7, 8, 11, and 19, respectively, whereas PDGFRB was mainly “loss” and located on chromosome 5.
Figure 1.
Exploring ANRG variations and expression patterns in AML. A. Network diagram illustrating the interplay of 41 ANRGs in AML. B. Forest plot showing the top 31 ANRGs. C. Frequency of CNV in 31 ANRGs in TCGA-AML. D. Chromosomal regions and alterations in ANRGs.
ANRGs consistently clustered the AML cell molecular subgroups
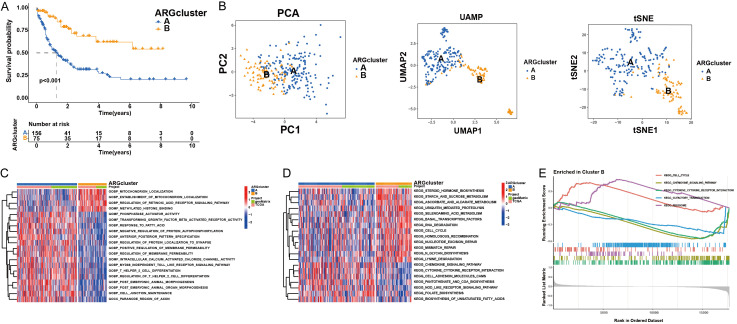
To elucidate the role of ANRGs in AML, we used 31 ANRGs for consensus clustering with the Consensus Cluster Plus module within R. Assemblages were segregated into two distinct subtypes, clusters A and B. Survival analysis indicated a pronounced disparity in prognosis between these subtypes (Figure 2A). PCA, UMAP, and tSNE were used to test the clustering accuracy (Figure 2B). Gene Ontology (GO) pathway analysis revealed that genes within cluster B were predominantly associated with mitochondrial localization and the retinoic acid receptor signaling cascade, among other pathways (Figure 2C). Using the GSVA module, we analyzed the divergent enrichment of KEGG pathways between clusters B and A (Figure 2D). Cluster B predominantly pertained to the cell cycle, chemokine signaling pathways, cytokines, and cytokine receptors (Figure 2E).
Figure 2.
AML subgroups based on ANRGs. A. Patients with AML were categorized into two gene clusters (A and B). B. PCA, UMAP, and t-SNE identified two subtypes according to the expression of ANRGs. C, D. ANRGs of the two gene clusters were analyzed using GO and KEGG. E. GSVA analysis examined the varying enrichment of KEGG pathways between cluster B.
Gene expression and immune infiltration in the two subtypes
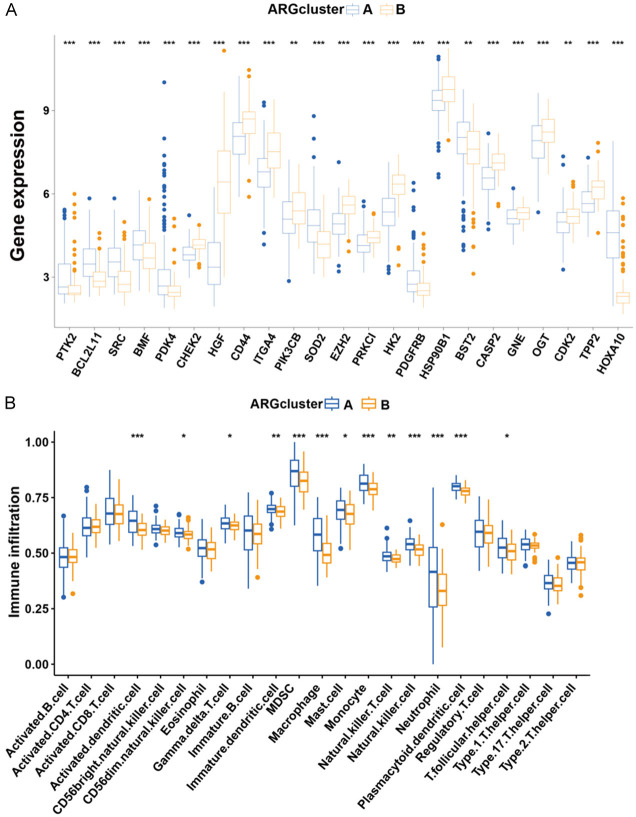
A box plot was used to delineate the ANRG expression patterns in the two subgroups. Notably, PTK2, BCL2L11, SRC, BMF, PDK4, SOD2, PDGFRB, and HOXA10 were expressed at significantly lower levels in cluster B than in cluster A whereas other AML genes exhibited higher expression levels. Given their association with OS, these differentially expressed genes may serve as pivotal molecules influencing the prognosis of patients with AML and targeted therapy (Figure 3A). Differences in the magnitude of immune cell infiltration were also observed (Figure 3B). Specifically, the numbers of activated CD4+, CD8+, and B lymphocytes in cluster B were markedly lower than those in cluster A.
Figure 3.
Gene expression and immune infiltration patterns within the two subtypes. A. Expression patterns of ANRGs in the two subtypes. B. Expression patterns of immune infiltration in two subtypes.
Developing and validating an ANRG prognostic model with good performance
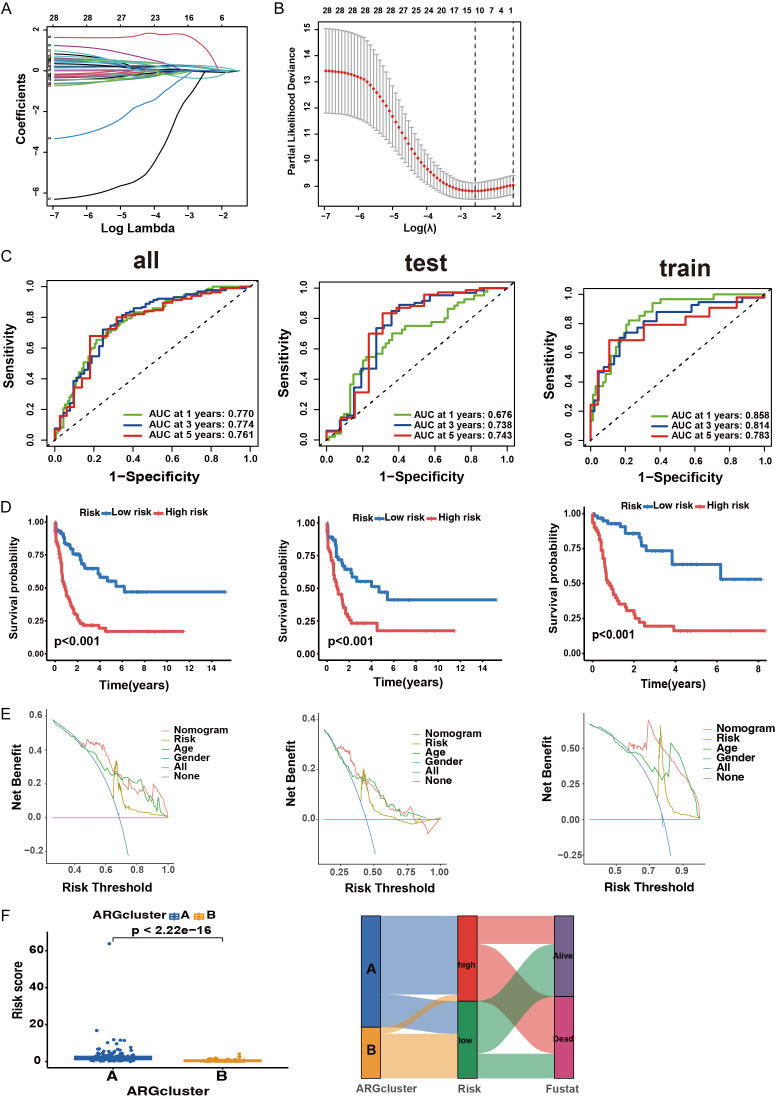
To investigate the clinical significance of ANRGs, we incorporated 41 ANRGs in the LASSO-penalized Cox regression analysis (Figure 4A, 4B). The composite risk score derived from the seven-ANRG signature is referred to as “ANRGscore”. Prognostic index (PI) = (0.469* SRC expression level) + (0.415* BMF expression level) + (0.436* the expression level of HMGA1) + (0.337* PDGFRB expression level) + (2.885* the expression level of S100A7) - (4.02* the expression level of ONECUT1) + (0.364* the expression level of HOXA10). We randomized a cohort of patients with AML to delineate between the training and test sets. ROC curves for OS at 1, 3, and 5 years demonstrated that the model had good predictive performance (Figure 4C). K-M analyses indicated that a higher risk score in this model corresponded to poorer survival (P < 0.001) (Figure 4D). DCA of the risk factors is shown in Figure 4E. Risk scores differed significantly between the two subtypes (Figure 4F). The alluvial diagram depicts the changes in ANRG clusters, ANRG score, and survival status.
Figure 4.
Identified ANRG prognosis signature. A. Utilization of LASSO-identified ANRGs. B. Coefficient profiles of prognostic ANRGs. C. Time-dependent ROC curves for OS at 1, 3, and 5 years. D. K-M analysis reveals varying prognoses in the risk group of the subtype. E. DCA curve illustrating the net clinical benefit associated with the formulated model. F. Risk score established in two clusters and a comprehensive alluvial diagram depicting the subtype and survival status.
GSEA and immunological activity analysis with different risk scores
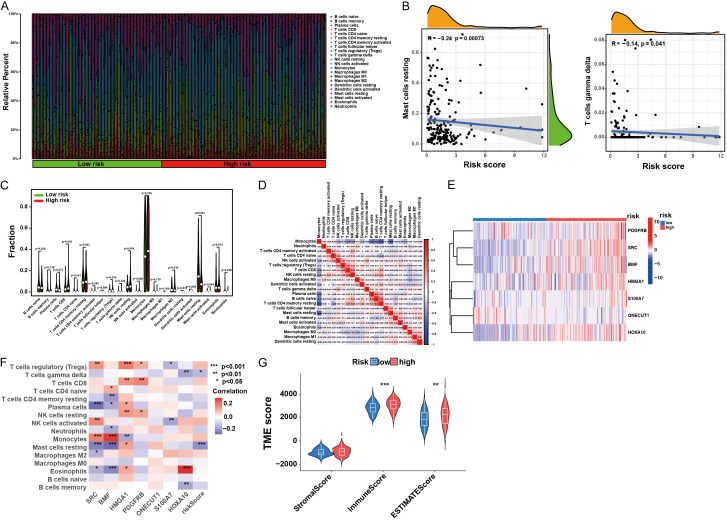
We further examined the TME landscape of patients with AML in the high- and low-risk groups (Figure 5A). As the risk score increased, a discernible reduction in the prevalence of activated mast and T cells was observed (Figure 5B). Moreover, monocytes constituted a greater proportion of the immune cell spectrum in AML (Figure 5C), indicating a significant factor contributing to the poor prognosis of AML. Studying the correlation among immune cells in AML patients may offer insights into the composition of the immune microenvironment in distinct tumor types (Figure 5D). The seven-gene feature, foundational to the AML core model, exhibited distinct expression patterns between the high- and low-risk groups and showed strong correlations with multiple immune cell infiltrates (Figure 5E, 5F). Furthermore, by estimating the expression profile score, we derived the stromal and immune scores for both groups (Figure 5G). Finally, we explored the potential drug susceptibility of these groups (Figure S1).
Figure 5.
Immune landscape associated with diverse risk scores. A. Comparison of infiltrative immune cell proportions across diverse risk scores. B. Correlation analysis of risk scores with the proportions of activated mast cells and T cells in AML samples. C. Differences in immune cellular components. D. Correlation among immune cells. E. Heat map showing gene expression patterns in the seven hub ANRGs. F. Correlation between immune cell populations and the seven hub ANRGs. G. Estimated expression profile scores in the high- and low-risk fractions.
Designing a predictive nomogram for patients with AML
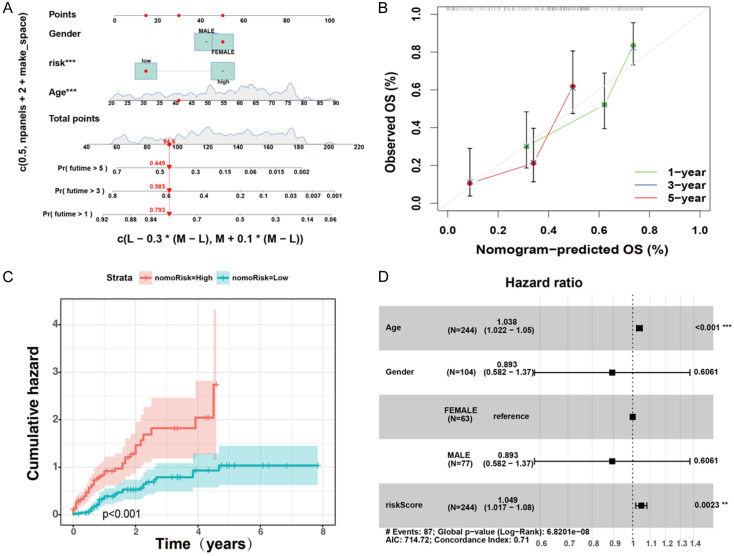
Considering the pivotal role of clinical and pathological characteristics in the prognostic model, we integrated the AML core model with the clinical data to formulate a nomogram (Figure 6A). The calibration plot validated the nomogram (Figure 6B). Notably, the cumulative hazard curve revealed a gradual increase in the risk of OS in patients with AML and high scores on the nomogram (Figure 6C). A forest plot showed that age, sex, and risk score were the primary influencing variables in the nomogram (Figure 6D). These results indicate that a nomogram incorporating AML-based risk scores could serve as an effective approach for prognostic assessment in clinical practice.
Figure 6.
Prognostic nomogram of the cohort of patients with AML. A. Nomogram plot derived from ANRG score and clinicopathological characteristics. B. Calibration plot for validating the nomogram. C. Cumulative hazard curve plot representing the probability of survival over time. D. Forest plot summary of multivariable Cox regression of clinical characteristics, with risk score in patients with AML.
ANRGs and TME correlation analysis
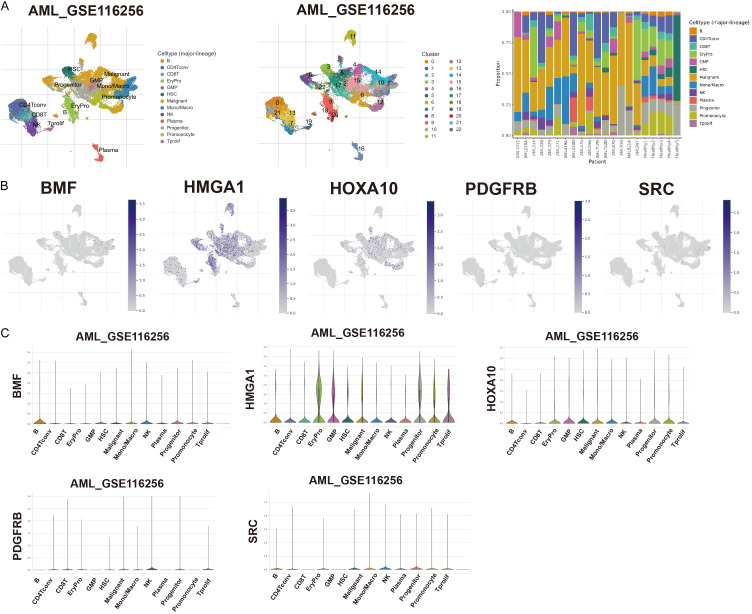
We examined the expression of five genes in the TME using the single-cell dataset AML_GSE116256 from the TISCH database. The GSE116256 dataset encompasses 13 cell clusters and 22 distinct cell types; a detailed depiction of their distribution and numerosity is presented in Figure 7A. BMF predominantly manifests within malignant and immune cells, notably B cells and mono/macro cells. High HMGA1 expression was observed across diverse cell types and was detected in EryPro, GMP, and Tprolif. HOXA10 was expressed in EryPro, GMP, HSC, Mono/Macro, and promonocytes, whereas PDGFRB and SRC were expressed at lower levels in immune cells (Figure 7B, 7C). We investigated the role of PDGFRB in the development of AML.
Figure 7.
ANRG expression in AML TME-associated cells. A. Comprehensive cellular type in GSE116256, and the proportion of each cell type. B, C. Percentage and expression levels of BMF, HMGA1, HOXA10, PDGFRB, and SRC.
PDGFRB promotes AML progression
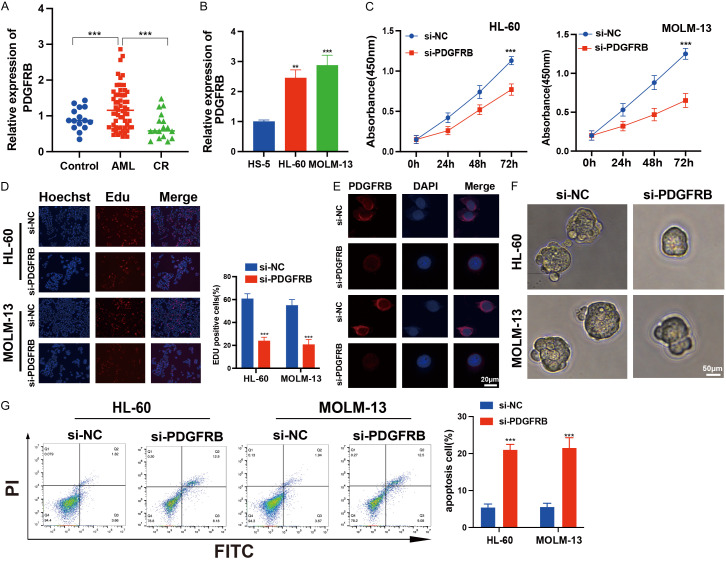
We conducted qRT-PCR analyses on peripheral blood samples obtained from patients with AML, healthy subjects, and patients in CR and found that PDGFRB expression was significantly upregulated in patients with AML (Figure 8A). Elevated PDGFRB expression was observed in both HL-60 and MOLM-13 cells (Figure 8B). Moreover, we found that both both siRNA-#1 and siRNA-#2 effectively reduced PDGFRB expression. However, siRNA-#2 was chosen for subsequent experiments due to its superior inhibitory effect (Figure S2A, S2B). CCK-8 and EdU assays revealed diminished proliferative capability of AML cells after PDGFRB knockdown (Figure 8C, 8D). FISH assays confirmed the cytoplasmic localization of PDGFRB (Figure 8E). For a more comprehensive analysis of the PDGFRB characteristics in cancer stem cells, we established tumor suspension microspheres using a non-adhesive suspension culture system and observed the formation of floating spherical colonies within seven days. After PDGFRB knockdown, there was a significant reduction in both the volume and quantity of tumor spheres (Figure 8F). The apoptosis assays revealed that PDGFRB knockdown induced apoptosis in AML cells (Figure 8G). Collectively, these data suggest that PDGFRB knockdown inhibits AML progression in vitro.
Figure 8.
Impact of PDGFRB knockdown on AML cell functions. A. Expression analysis of PDGFRB in patients with AML, healthy donors (Control), and patients in complete remission (CR). B. qRT-qPCR analysis of PDGFRB in HL-60 and MOLM-13 cells, as well as HS-5 cells. C. Cell proliferation analysis of AML cells with PDGFRB knockdown. D. Decreased percentage of EdU-positive cells after PDGFRB knockdown in AML cells. E. FISH assay confirming the localization of PDGFRB knockdown in the cytoplasm. Scale bar: 20 μm. F. Images of HL-60 and MOLM-13 cells after PDGFRB knockdown for 7 days. Scale bar: 50 μm. G. Flow cytometry revealing cell apoptosis of HL-60 and MOLM-13 cells after 24 h. The data represent the mean ± standard deviation from three independent experiments. **P < 0.01, ***P < 0.001.
PDGFRB is correlated with the prognosis of patients with AML
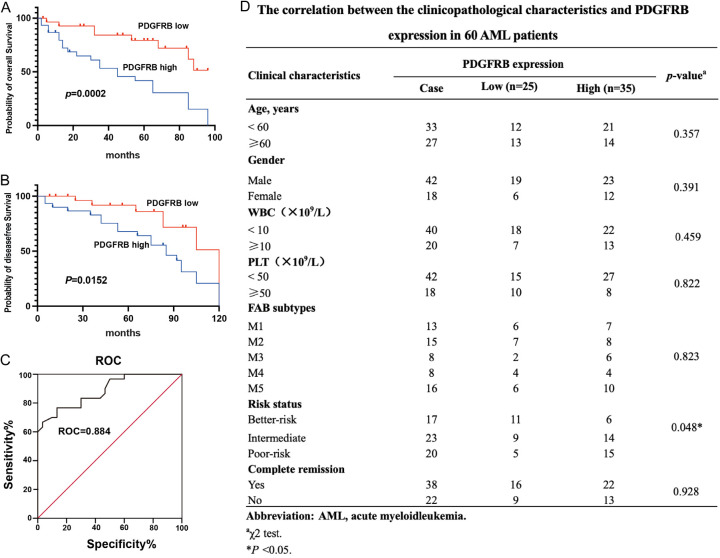
Patients with AML exhibiting elevated PDGFRB expression had poor overall and progression-free survival trajectories compared with their counterparts with diminished PDGFRB expression (Figure 9A, 9B). Furthermore, ROC curve analysis revealed that PDGFRB was an underlying biomarker for AML screening (Figure 9C). Moreover, a cohort of 60 patients with AML, along with clinicopathological parameters and survival data, was incorporated to investigate the correlation between PDGFRB and prognosis. We observed a positive correlation between PDGFRB expression and risk status (P = 0.048), whereas no significant associations were found with other clinicopathological characteristics, including age, sex, WBC, PLT, FAB subtypes, and CR (Figure 9D). In conclusion, we found that higher PDGFRB expression was correlated with a poorer prognosis in patients with AML.
Figure 9.
PDGFRB is correlated with the prognosis of patients with AML. A, B. K-M analysis of the correlation of PDGFRB levels with OS and disease-free survival of patients with AML. C. ROC curve analysis revealed that PDGFRB is a potential biomarker for distinguishing patients with AML from healthy controls. D. Correlations between PDGFRB proportion and clinicopathological characteristics of 60 patients with AML. The data represent the mean ± standard deviation from three independent experiments. **P < 0.01.
PDGFRB promotes tumor growth
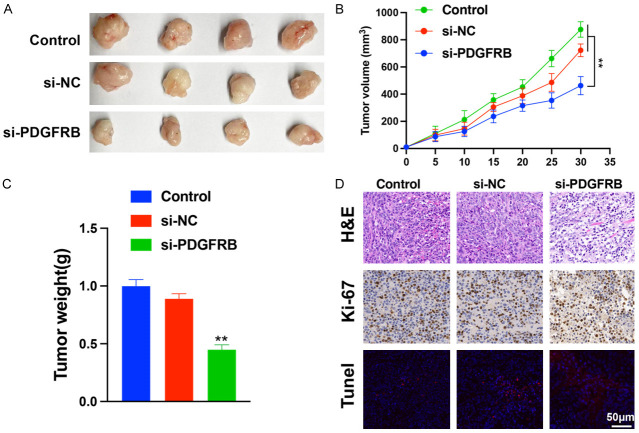
To investigate the effect of PDGFRB knockdown on tumor growth in vivo, a xenograft tumor model of MOLM-13 cells was established and intratumorally injected with si-PDGFRB or si-NC. As shown in Figure 10A, tumor volume and weight were markedly lower in the si-PDGFRB group than in the other groups (Figure 10B, 10C). Following the retrieval of subcutaneous tumor tissues, immunohistochemistry was performed. H&E staining revealed more necrotic areas in the si-PDGFRB group than in the other groups. The results indicated that xenograft tumors with PDGFRB knockdown exhibited weak fluorescence signal by ki-67 staining (red). H&E staining revealed more necrotic areas in the si-PDGFRB group than in the other groups, and a strong fluorescence signal was observed by TUNEL staining (green) (Figure 10D). Collectively, these findings indicate that PDGFRB may contribute to AML oncogenesis both in vitro and in vivo.
Figure 10.
PDGFRB knockdown suppresses tumor formation. A. Effects of suppression of PDGFRB knockdown on tumor volume and weight. B, C. Tumor volume and weight in control, si-NC, and si-PDGFRB mice. D. HE were identified using immunohistochemistry. Ki-67 (red) and TUNEL (green) were identified using immunofluorescence. Scale bar: 50 μm. The data represent the mean ± standard deviation from three independent experiments. **P < 0.01.
Discussion
Anoikis serves as a crucial defense mechanism in organisms, preventing dislodged cells from aberrantly adhering to new matrices, thereby preserving the integrity of cellular growth. Eosinophil apoptosis depends on the intrinsic and extrinsic pathways [15]. Eosinophil apoptosis is initiated by an array of intracellular cues, including DNA damage, endoplasmic reticulum stress, and mitochondrial damage, all of which play central roles in apoptotic process [16]. Dysregulated apoptosis, a characteristic of neoplastic cells, enhances tumor incursion, migration, distant organ metastasis, and the emergence of drug resistance [17-19]. Anoikis genes play a pivotal role in the occurrence, invasion, migration, formation of distant organ metastases, and drug resistance [20]. In addition, ANRGs were highly efficient in predicting the prognosis of renal-cell carcinoma. These seven types of ANRGs were closely related to immune cell infiltration and immune checkpoint genes, contributing to the development of personalized and precise treatment strategies [21]. Multigene analysis elucidates the intricate interplay among diverse factors influencing the resistance of eosinophilic enzymes in tumor pathology. Therefore, in the age of precision cancer medicine, this multigene approach can be used to characterize tumor biology and guide clinical decision-making.
AML exhibits heterogeneous cytogenetic and molecular profiles. It is characterized by delayed maturation and unregulated proliferation of bone marrow stem cells, and an accurate prognostic prediction is still lacking [22,23]. In this study, we developed a prognostic risk score model for AML utilizing disparities in ANRG expression. We assessed the predictive value of risk scores in determining the AML response to immunotherapy and investigated variations in the expression of immune-related cells in tumors categorized by high- and low-risk scores. Patients with lower risk scores notably exhibited extended OS, demonstrating the dependability of this risk score model in predicting immunotherapy outcomes for patients. TME has an important impact on tumor metastasis and the potency of precision therapies [24,25]. The TME is a self-regulating ecosystem comprising tumor, stromal, and immune cells with non-cellular components [26,27]. We investigated the proportions of 22 immune cell types across various AML subtypes. Notably, in the high-risk cohort characterized by poor survival, the infiltration of activated monocytes significantly increased, highlighting their essential role in AML development. Furthermore, we identified five genes, BMF, HMGA1, HOXA10, PDGFRB, and SRC, which were characterized by robust risk scores. Previous studies have elucidated the relationships between specific genes, tumorigenesis, and pathogenesis. The pro-apoptotic protein BMF, which induces apoptosis during cellular detachment, facilitates breast duct luminal formation [28]. BMF inhibition supports anoikis resistance and tumor transmission, especially in E-cadherin-depleted metastatic breast carcinomas [29]. HMGA1, a non-histone chromosomal protein, acts as an “architectural” transcription factor, facilitating the assembly of “enhanceosome”. Owing to its high expression in various malignancies and minimal levels in healthy adults, HMGA1 has emerged as a potential “tumor marker” [30,31]. HOXA10, a member of the HOX family, significantly affects embryonic development and oncogenic progression [32-34]. It potentially enhances the epithelial-mesenchymal transformation process in gastric cancer via TGFB2/Smad/METTL3 signaling, thereby facilitating the invasion and metastasis of gastric cancer cells [35]. SRC, a member of the expansive membrane-associated non-receptor protein tyrosine kinase lineage, regulates several signaling pathways, including the PI3K/Akt and MAPK pathways, which elicit a plethora of cellular outcomes. SRC activation decreases anoikis via its downstream target Akt [36]. Across various colon cancer cell lines, anoikis resistance is associated with SRC expression levels; the change in anoikis correlates with the change in SRC levels, demonstrating that SRC plays a key function in the resistance to anoikis triggered by the tight junction protein claudin [37].
PDGFRB promotes cancer stem cell characteristics and epithelial-mesenchymal transformation in sarcomas [38]. PDGFRB is highly expressed in epithelial ovarian cancer and is a potential therapeutic target for this disease [39,40]. These findings suggest that PDGFRB is upregulated in AML and associated with poor survival. PDGFRB knockdown suppressed the proliferation and induced apoptosis of AML cells, suggesting that PDGFRB is involved in AML progression. Additionally, PDGFRB knockdown inhibited tumor growth, suggesting that PDGFRB is a potential cancer-related gene in AML.
Although our riskScore and the nomogram constructed from it demonstrated superior predictive performance, single-cell anoikis studies may offer more precise insights into AML progression and patient prognosis owing to cellular heterogeneity. Moreover, the limited information obtained in this investigation requires a larger number of study participants to adjust the prediction model.
In conclusion, the model can accurately predict the survival of patients with AML, and a nomogram derived from the model can aid physicians in tailoring personalized AML treatments. Future research on the underlying molecular mechanisms linked with AML and prospective randomized clinical trials are clinically significant and offer precise treatment approaches.
Acknowledgements
This study was supported by the Guizhou Provincial People’s Hospital Youth fund project (GZSYQN202205), the Traditional Chinese medicine project in Guizhou Province (QZYY-2023-014), and the Fundamental Research Funds for Science and Technology Foundation of Guizhou Province (ZK[2024]-463).
Disclosure of conflict of interest
None.
Supporting Information
References
- 1.Hassani S, Ghaffari P, Chahardouli B, Alimoghaddam K, Ghavamzadeh A, Alizadeh S, Ghaffari SH. Disulfiram/copper causes ROS levels alteration, cell cycle inhibition, and apoptosis in acute myeloid leukaemia cell lines with modulation in the expression of related genes. Biomed Pharmacother. 2018;99:561–569. doi: 10.1016/j.biopha.2018.01.109. [DOI] [PubMed] [Google Scholar]
- 2.Venton G, Pérez-Alea M, Baier C, Fournet G, Quash G, Labiad Y, Martin G, Sanderson F, Poullin P, Suchon P, Farnault L, Nguyen C, Brunet C, Ceylan I, Costello RT. Aldehyde dehydrogenases inhibition eradicates leukemia stem cells while sparing normal progenitors. Blood Cancer J. 2016;6:e469. doi: 10.1038/bcj.2016.78. [DOI] [PMC free article] [PubMed] [Google Scholar]
- 3.Hospital MA, Prebet T, Bertoli S, Thomas X, Tavernier E, Braun T, Pautas C, Perrot A, Lioure B, Rousselot P, Tamburini J, Cluzeau T, Konopacki J, Randriamalala E, Berthon C, Gourin MP, Recher C, Cahn JY, Ifrah N, Dombret H, Boissel N. Core-binding factor acute myeloid leukemia in first relapse: a retrospective study from the French AML Intergroup. Blood. 2014;124:1312–1319. doi: 10.1182/blood-2014-01-549212. [DOI] [PubMed] [Google Scholar]
- 4.Du A, Yang Q, Luo X. Cuproptosis-related lncRNAs as potential biomarkers of AML prognosis and the role of lncRNA HAGLR/miR-326/CDKN2A regulatory axis in AML. Am J Cancer Res. 2023;13:3921–3940. [PMC free article] [PubMed] [Google Scholar]
- 5.Rowe JM, Tallman MS. How I treat acute myeloid leukemia. Blood. 2010;116:3147–3156. doi: 10.1182/blood-2010-05-260117. [DOI] [PubMed] [Google Scholar]
- 6.Döhner H, Weisdorf DJ, Bloomfield CD. Acute myeloid leukemia. N Engl J Med. 2015;373:1136–1152. doi: 10.1056/NEJMra1406184. [DOI] [PubMed] [Google Scholar]
- 7.Han HJ, Sung JY, Kim SH, Yun UJ, Kim H, Jang EJ, Yoo HE, Hong EK, Goh SH, Moon A, Lee JS, Ye SK, Shim J, Kim YN. Fibronectin regulates anoikis resistance via cell aggregate formation. Cancer Lett. 2021;508:59–72. doi: 10.1016/j.canlet.2021.03.011. [DOI] [PubMed] [Google Scholar]
- 8.Weems AD, Welf ES, Driscoll MK, Zhou FY, Mazloom-Farsibaf H, Chang BJ, Murali VS, Gihana GM, Weiss BG, Chi J, Rajendran D, Dean KM, Fiolka R, Danuser G. Blebs promote cell survival by assembling oncogenic signalling hubs. Nature. 2023;615:517–525. doi: 10.1038/s41586-023-05758-6. [DOI] [PMC free article] [PubMed] [Google Scholar]
- 9.Zhong X, Rescorla FJ. Cell surface adhesion molecules and adhesion-initiated signaling: understanding of anoikis resistance mechanisms and therapeutic opportunities. Cell Signal. 2012;24:393–401. doi: 10.1016/j.cellsig.2011.10.005. [DOI] [PubMed] [Google Scholar]
- 10.Kakavandi E, Shahbahrami R, Goudarzi H, Eslami G, Faghihloo E. Anoikis resistance and oncoviruses. J Cell Biochem. 2018;119:2484–2491. doi: 10.1002/jcb.26363. [DOI] [PubMed] [Google Scholar]
- 11.Adeshakin FO, Adeshakin AO, Afolabi LO, Yan D, Zhang G, Wan X. Mechanisms for modulating anoikis resistance in cancer and the relevance of metabolic reprogramming. Front Oncol. 2021;11:626577. doi: 10.3389/fonc.2021.626577. [DOI] [PMC free article] [PubMed] [Google Scholar]
- 12.Di Micco R, Krizhanovsky V, Baker D, d’Adda di Fagagna F. Cellular senescence in ageing: from mechanisms to therapeutic opportunities. Nat Rev Mol Cell Biol. 2021;22:75–95. doi: 10.1038/s41580-020-00314-w. [DOI] [PMC free article] [PubMed] [Google Scholar]
- 13.Vickers AJ, Cronin AM, Elkin EB, Gonen M. Extensions to decision curve analysis, a novel method for evaluating diagnostic tests, prediction models and molecular markers. BMC Med Inform Decis Mak. 2008;8:53. doi: 10.1186/1472-6947-8-53. [DOI] [PMC free article] [PubMed] [Google Scholar]
- 14.Sun D, Wang J, Han Y, Dong X, Ge J, Zheng R, Shi X, Wang B, Li Z, Ren P, Sun L, Yan Y, Zhang P, Zhang F, Li T, Wang C. TISCH: a comprehensive web resource enabling interactive single-cell transcriptome visualization of tumor microenvironment. Nucleic Acids Res. 2021;49:D1420–D1430. doi: 10.1093/nar/gkaa1020. [DOI] [PMC free article] [PubMed] [Google Scholar]
- 15.Li S, Chen Y, Zhang Y, Jiang X, Jiang Y, Qin X, Yang H, Wu C, Liu Y. Shear stress promotes anoikis resistance of cancer cells via caveolin-1-dependent extrinsic and intrinsic apoptotic pathways. J Cell Physiol. 2019;234:3730–3743. doi: 10.1002/jcp.27149. [DOI] [PubMed] [Google Scholar]
- 16.Zhi Z, Ouyang Z, Ren Y, Cheng Y, Liu P, Wen Y, Shao Y. Non-canonical phosphorylation of Bmf by p38 MAPK promotes its apoptotic activity in anoikis. Cell Death Differ. 2022;29:323–336. doi: 10.1038/s41418-021-00855-3. [DOI] [PMC free article] [PubMed] [Google Scholar]
- 17.Jin L, Chun J, Pan C, Alesi GN, Li D, Magliocca KR, Kang Y, Chen ZG, Shin DM, Khuri FR, Fan J, Kang S. Phosphorylation-mediated activation of LDHA promotes cancer cell invasion and tumour metastasis. Oncogene. 2017;36:3797–3806. doi: 10.1038/onc.2017.6. [DOI] [PMC free article] [PubMed] [Google Scholar]
- 18.Jiang K, Yao G, Hu L, Yan Y, Liu J, Shi J, Chang Y, Zhang Y, Liang D, Shen D, Zhang G, Meng S, Piao H. MOB2 suppresses GBM cell migration and invasion via regulation of FAK/Akt and cAMP/PKA signaling. Cell Death Dis. 2020;11:230. doi: 10.1038/s41419-020-2381-8. [DOI] [PMC free article] [PubMed] [Google Scholar]
- 19.Kim H, Choi P, Kim T, Kim Y, Song BG, Park YT, Choi SJ, Yoon CH, Lim WC, Ko H, Ham J. Ginsenosides Rk1 and Rg5 inhibit transforming growth factor-β1-induced epithelial-mesenchymal transition and suppress migration, invasion, anoikis resistance, and development of stem-like features in lung cancer. J Ginseng Res. 2021;45:134–148. doi: 10.1016/j.jgr.2020.02.005. [DOI] [PMC free article] [PubMed] [Google Scholar]
- 20.Sun Z, Zhao Y, Wei Y, Ding X, Tan C, Wang C. Identification and validation of an anoikis-associated gene signature to predict clinical character, stemness, IDH mutation, and immune filtration in glioblastoma. Front Immunol. 2022;13:939523. doi: 10.3389/fimmu.2022.939523. [DOI] [PMC free article] [PubMed] [Google Scholar]
- 21.Liu Y, Shi Z, Zheng J, Zheng Z, Sun H, Xuan Z, Bai Y, Fu M, Du Y, Shao C. Establishment and validation of a novel anoikis-related prognostic signature of clear cell renal cell carcinoma. Front Immunol. 2023;14:1171883. doi: 10.3389/fimmu.2023.1171883. [DOI] [PMC free article] [PubMed] [Google Scholar]
- 22.Du A, Yang Q, Sun X, Zhao Q. Exosomal circRNA-001264 promotes AML immunosuppression through induction of M2-like macrophages and PD-L1 overexpression. Int Immunopharmacol. 2023;124:110868. doi: 10.1016/j.intimp.2023.110868. [DOI] [PubMed] [Google Scholar]
- 23.Shao R, Wang H, Liu W, Wang J, Lu S, Tang H, Lu Y. Establishment of a prognostic ferroptosis-related gene profile in acute myeloid leukaemia. J Cell Mol Med. 2021;25:10950–10960. doi: 10.1111/jcmm.17013. [DOI] [PMC free article] [PubMed] [Google Scholar]
- 24.Zhang FP, Huang YP, Luo WX, Deng WY, Liu CQ, Xu LB, Liu C. Construction of a risk score prognosis model based on hepatocellular carcinoma microenvironment. World J Gastroenterol. 2020;26:134–153. doi: 10.3748/wjg.v26.i2.134. [DOI] [PMC free article] [PubMed] [Google Scholar]
- 25.Rubin SJS, Sojwal RS, Gubatan J, Rogalla S. The tumor immune microenvironment in pancreatic ductal adenocarcinoma: neither hot nor cold. Cancers (Basel) 2022;14:4236. doi: 10.3390/cancers14174236. [DOI] [PMC free article] [PubMed] [Google Scholar]
- 26.Du A, Wu X, Gao Y, Jiang B, Wang J, Zhang P, Zhao Q. m6A regulator-mediated methylation modification patterns and tumor microenvironment infiltration characterization in acute myeloid leukemia. Front Immunol. 2021;12:789914. doi: 10.3389/fimmu.2021.789914. [DOI] [PMC free article] [PubMed] [Google Scholar]
- 27.Ala M. The footprint of kynurenine pathway in every cancer: a new target for chemotherapy. Eur J Pharmacol. 2021;896:173921. doi: 10.1016/j.ejphar.2021.173921. [DOI] [PubMed] [Google Scholar]
- 28.Schmelzle T, Mailleux AA, Overholtzer M, Carroll JS, Solimini NL, Lightcap ES, Veiby OP, Brugge JS. Functional role and oncogene-regulated expression of the BH3-only factor Bmf in mammary epithelial anoikis and morphogenesis. Proc Natl Acad Sci U S A. 2007;104:3787–3792. doi: 10.1073/pnas.0700115104. [DOI] [PMC free article] [PubMed] [Google Scholar]
- 29.Hornsveld M, Tenhagen M, van de Ven RA, Smits AM, van Triest MH, van Amersfoort M, Kloet DE, Dansen TB, Burgering BM, Derksen PW. Restraining FOXO3-dependent transcriptional BMF activation underpins tumour growth and metastasis of E-cadherin-negative breast cancer. Cell Death Differ. 2016;23:1483–1492. doi: 10.1038/cdd.2016.33. [DOI] [PMC free article] [PubMed] [Google Scholar]
- 30.Akhter MZ, Rajeswari MR. Interaction of doxorubicin with a regulatory element of hmga1 and its in vitro anti-cancer activity associated with decreased HMGA1 expression. J Photochem Photobiol B. 2014;141:36–46. doi: 10.1016/j.jphotobiol.2014.08.026. [DOI] [PubMed] [Google Scholar]
- 31.Akhter MZ, Rajeswari MR. Triplex forming oligonucleotides targeted to hmga1 selectively inhibit its expression and induce apoptosis in human cervical cancer. J Biomol Struct Dyn. 2017;35:689–703. doi: 10.1080/07391102.2016.1160257. [DOI] [PubMed] [Google Scholar]
- 32.Chen W, Wu G, Zhu Y, Zhang W, Zhang H, Zhou Y, Sun P. HOXA10 deteriorates gastric cancer through activating JAK1/STAT3 signaling pathway. Cancer Manag Res. 2019;11:6625–6635. doi: 10.2147/CMAR.S201342. [DOI] [PMC free article] [PubMed] [Google Scholar]
- 33.Cui YP, Xie M, Pan WX, Zhang ZY, Li WF. HOXA10 promotes the development of bladder cancer through regulating FOSL1. Eur Rev Med Pharmacol Sci. 2020;24:2945–2954. doi: 10.26355/eurrev_202003_20659. [DOI] [PubMed] [Google Scholar]
- 34.Zhang Y, Chen J, Wu SS, Lv MJ, Yu YS, Tang ZH, Chen XH, Zang GQ. HOXA10 knockdown inhibits proliferation, induces cell cycle arrest and apoptosis in hepatocellular carcinoma cells through HDAC1. Cancer Manag Res. 2019;11:7065–7076. doi: 10.2147/CMAR.S199239. [DOI] [PMC free article] [PubMed] [Google Scholar]
- 35.Song C, Zhou C. HOXA10 mediates epithelial-mesenchymal transition to promote gastric cancer metastasis partly via modulation of TGFB2/Smad/METTL3 signaling axis. J Exp Clin Cancer Res. 2021;40:62. doi: 10.1186/s13046-021-01859-0. [DOI] [PMC free article] [PubMed] [Google Scholar]
- 36.Windham TC, Parikh NU, Siwak DR, Summy JM, McConkey DJ, Kraker AJ, Gallick GE. Src activation regulates anoikis in human colon tumor cell lines. Oncogene. 2002;21:7797–7807. doi: 10.1038/sj.onc.1205989. [DOI] [PubMed] [Google Scholar]
- 37.Singh AB, Sharma A, Dhawan P. Claudin-1 expression confers resistance to anoikis in colon cancer cells in a Src-dependent manner. Carcinogenesis. 2012;33:2538–2547. doi: 10.1093/carcin/bgs275. [DOI] [PMC free article] [PubMed] [Google Scholar]
- 38.Matei D, Kelich S, Cao L, Menning N, Emerson RE, Rao J, Jeng MH, Sledge GW. PDGF BB induces VEGF secretion in ovarian cancer. Cancer Biol Ther. 2007;6:1951–1959. doi: 10.4161/cbt.6.12.4976. [DOI] [PubMed] [Google Scholar]
- 39.Chang KK, Yoon C, Yi BC, Tap WD, Simon MC, Yoon SS. Platelet-derived growth factor receptor-α and -β promote cancer stem cell phenotypes in sarcomas. Oncogenesis. 2018;7:47. doi: 10.1038/s41389-018-0059-1. [DOI] [PMC free article] [PubMed] [Google Scholar] [Retracted]
- 40.Wilczynski SP, Chen YY, Chen W, Howell SB, Shively JE, Alberts DS. Expression and mutational analysis of tyrosine kinase receptors c-kit, PDGFRalpha, and PDGFRbeta in ovarian cancers. Hum Pathol. 2005;36:242–249. doi: 10.1016/j.humpath.2004.11.009. [DOI] [PubMed] [Google Scholar]
Associated Data
This section collects any data citations, data availability statements, or supplementary materials included in this article.


